Zip Codes with the Highest Percentage of Population Employed in Installation, Maintenance & Repair in Texas City, TX
RELATED REPORTS & OPTIONS
Installation, Maintenance & Repair
Texas City
Compare Zip Codes
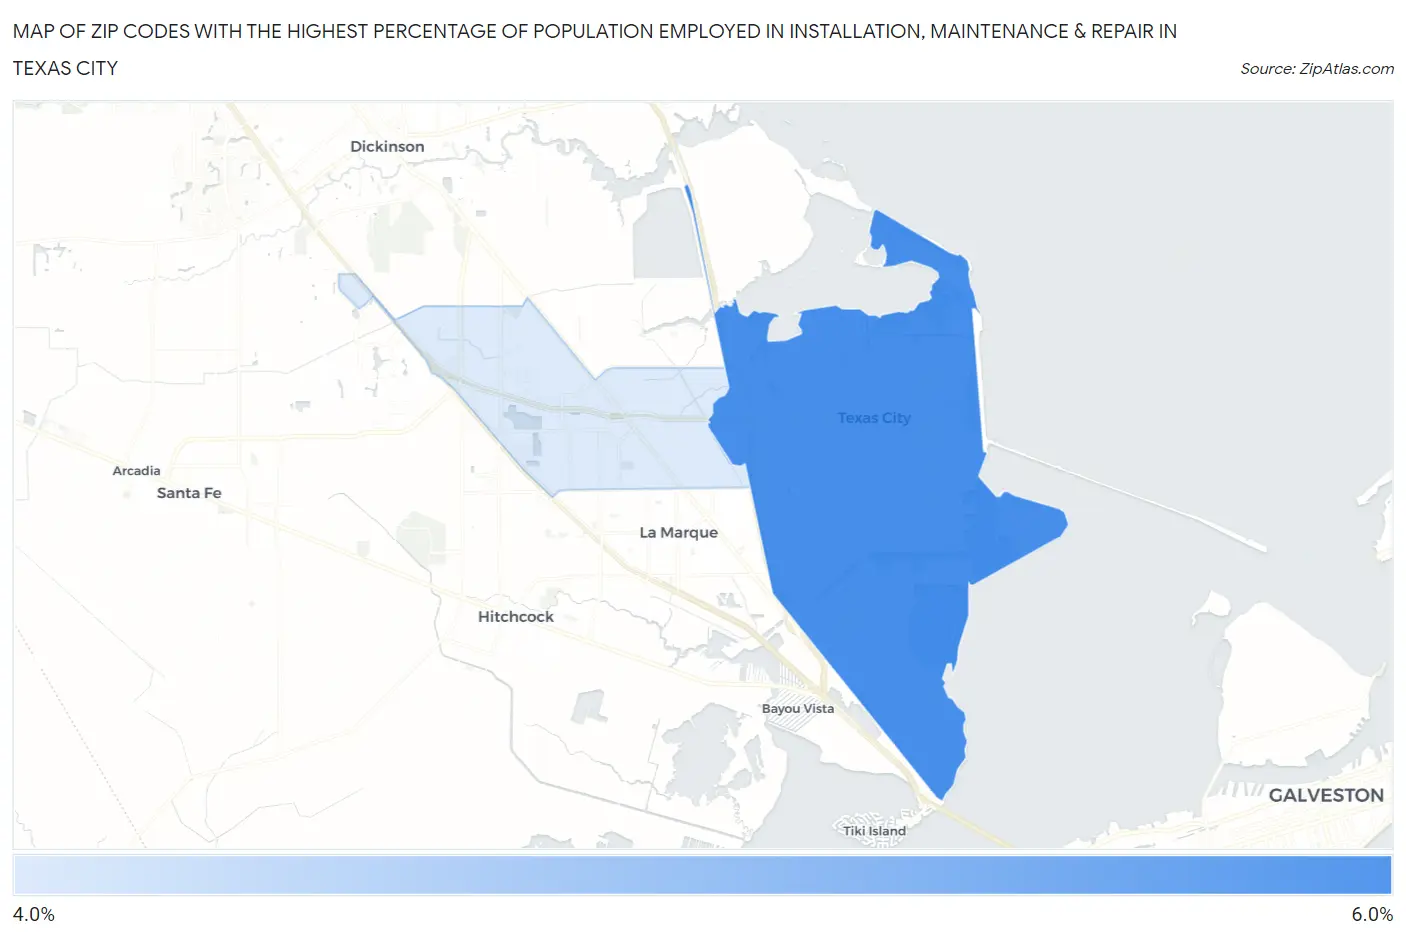
Map of Zip Codes with the Highest Percentage of Population Employed in Installation, Maintenance & Repair in Texas City
4.3%
5.4%
Zip Codes with the Highest Percentage of Population Employed in Installation, Maintenance & Repair in Texas City, TX
| Zip Code | % Employed | vs State | vs National | |
| 1. | 77590 | 5.4% | 3.4%(+1.99)#447 | 3.1%(+2.33)#7,538 |
| 2. | 77591 | 4.3% | 3.4%(+0.909)#678 | 3.1%(+1.24)#11,113 |
1
Common Questions
What are the Top Zip Codes with the Highest Percentage of Population Employed in Installation, Maintenance & Repair in Texas City, TX?
Top Zip Codes with the Highest Percentage of Population Employed in Installation, Maintenance & Repair in Texas City, TX are:
What zip code has the Highest Percentage of Population Employed in Installation, Maintenance & Repair in Texas City, TX?
77590 has the Highest Percentage of Population Employed in Installation, Maintenance & Repair in Texas City, TX with 5.4%.
What is the Percentage of Population Employed in Installation, Maintenance & Repair in Texas City, TX?
Percentage of Population Employed in Installation, Maintenance & Repair in Texas City is 5.0%.
What is the Percentage of Population Employed in Installation, Maintenance & Repair in Texas?
Percentage of Population Employed in Installation, Maintenance & Repair in Texas is 3.4%.
What is the Percentage of Population Employed in Installation, Maintenance & Repair in the United States?
Percentage of Population Employed in Installation, Maintenance & Repair in the United States is 3.1%.