Zip Codes with the Highest Percentage of Population Employed in Installation, Maintenance & Repair in Sherman, TX
RELATED REPORTS & OPTIONS
Installation, Maintenance & Repair
Sherman
Compare Zip Codes
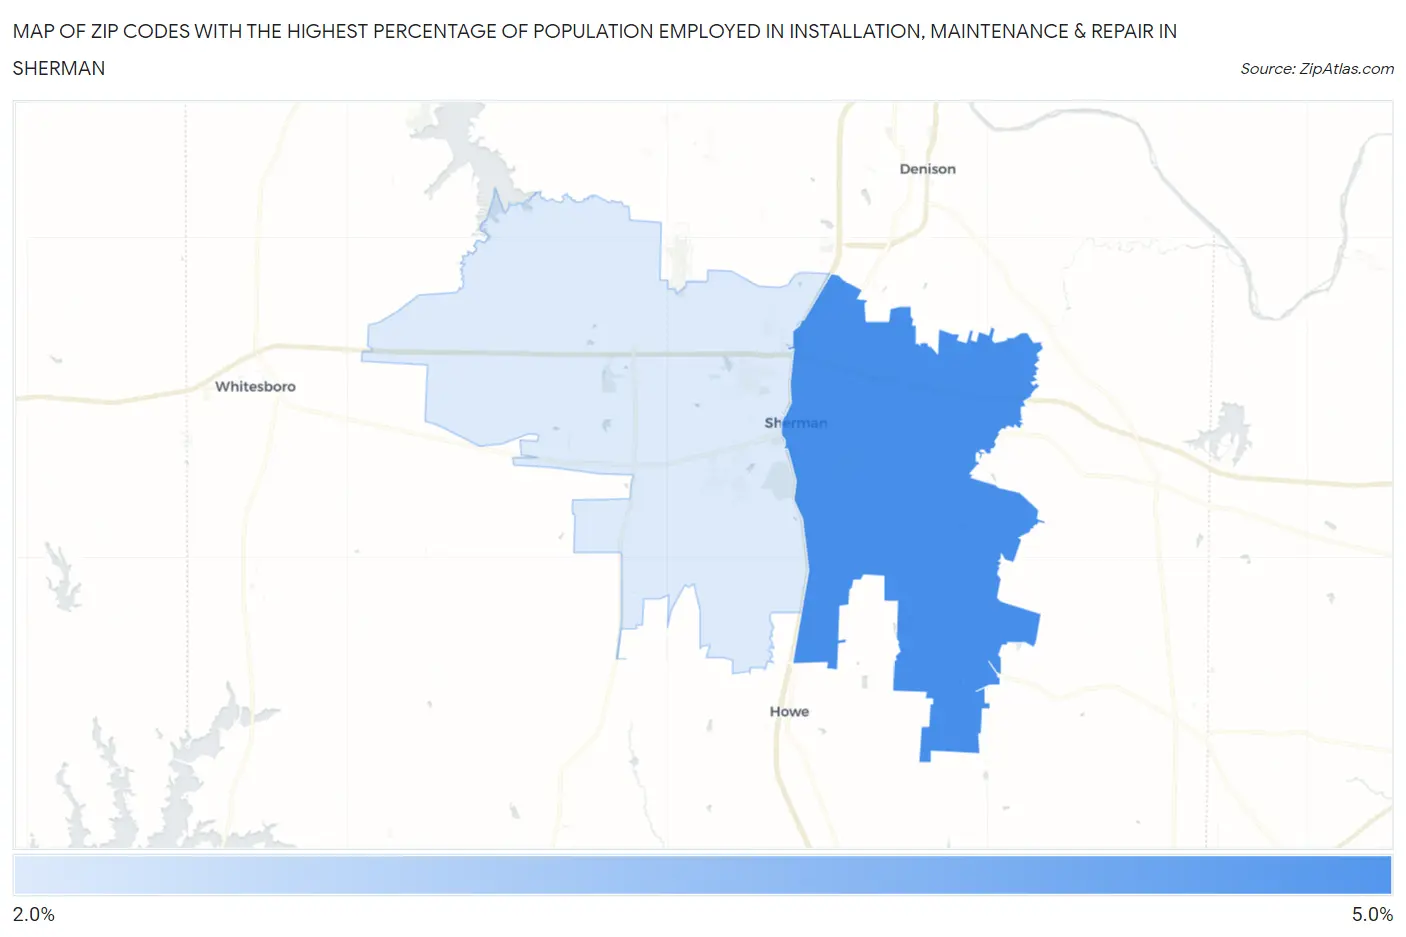
Map of Zip Codes with the Highest Percentage of Population Employed in Installation, Maintenance & Repair in Sherman
2.7%
4.1%
Zip Codes with the Highest Percentage of Population Employed in Installation, Maintenance & Repair in Sherman, TX
| Zip Code | % Employed | vs State | vs National | |
| 1. | 75090 | 4.1% | 3.4%(+0.697)#727 | 3.1%(+1.03)#11,919 |
| 2. | 75092 | 2.7% | 3.4%(-0.691)#1,142 | 3.1%(-0.356)#18,478 |
1
Common Questions
What are the Top Zip Codes with the Highest Percentage of Population Employed in Installation, Maintenance & Repair in Sherman, TX?
Top Zip Codes with the Highest Percentage of Population Employed in Installation, Maintenance & Repair in Sherman, TX are:
What zip code has the Highest Percentage of Population Employed in Installation, Maintenance & Repair in Sherman, TX?
75090 has the Highest Percentage of Population Employed in Installation, Maintenance & Repair in Sherman, TX with 4.1%.
What is the Percentage of Population Employed in Installation, Maintenance & Repair in Sherman, TX?
Percentage of Population Employed in Installation, Maintenance & Repair in Sherman is 3.1%.
What is the Percentage of Population Employed in Installation, Maintenance & Repair in Texas?
Percentage of Population Employed in Installation, Maintenance & Repair in Texas is 3.4%.
What is the Percentage of Population Employed in Installation, Maintenance & Repair in the United States?
Percentage of Population Employed in Installation, Maintenance & Repair in the United States is 3.1%.