Seco Mines, TX Map & Demographics
Seco Mines Map
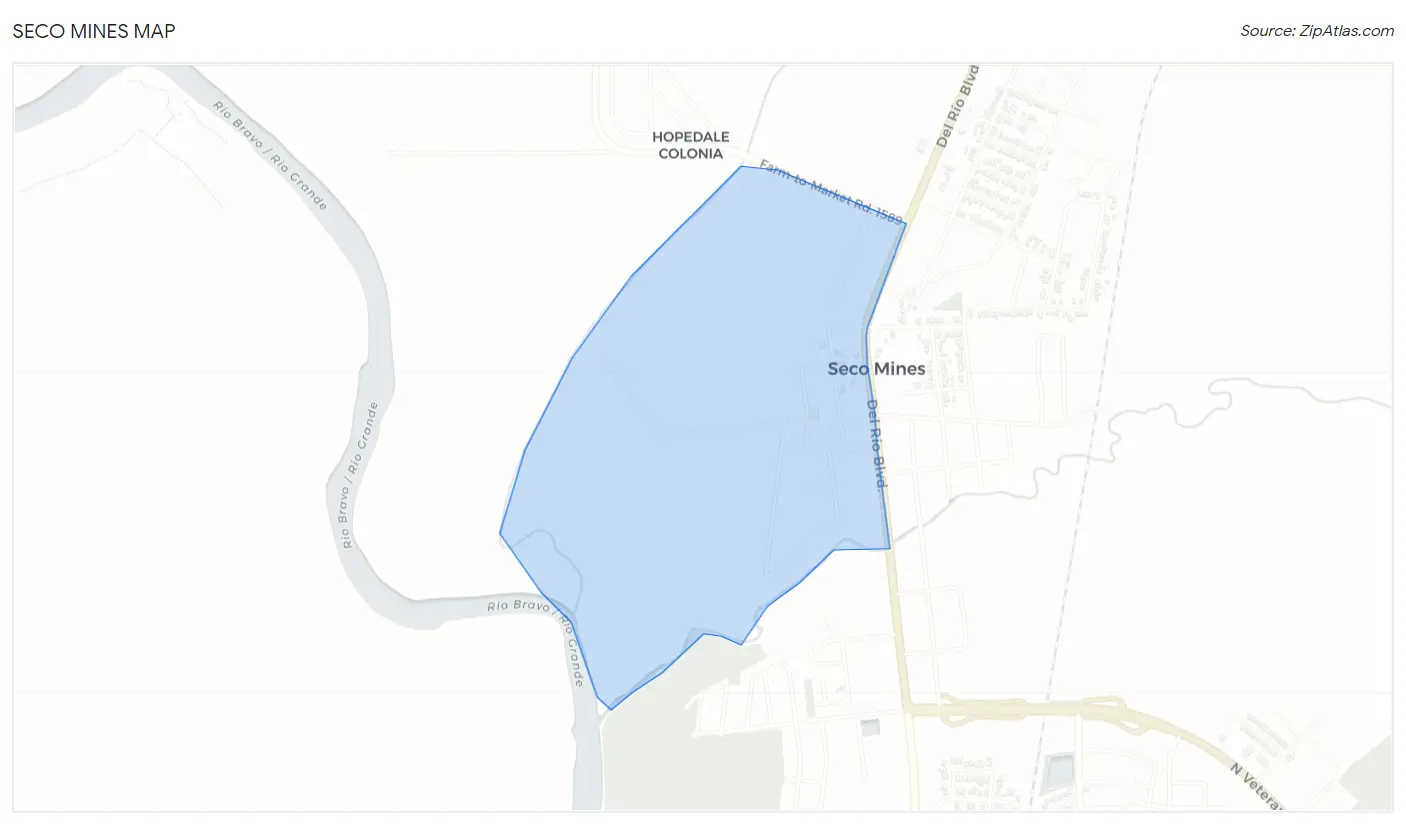
Seco Mines Overview
$11,535
PER CAPITA INCOME
$43,226
AVG FAMILY INCOME
$43,226
AVG HOUSEHOLD INCOME
0.34
INEQUALITY / GINI INDEX
1,274
TOTAL POPULATION
787
MALE POPULATION
487
FEMALE POPULATION
161.60
MALES / 100 FEMALES
61.88
FEMALES / 100 MALES
22.4
MEDIAN AGE
4.5
AVG FAMILY SIZE
4.5
AVG HOUSEHOLD SIZE
519
LABOR FORCE [ PEOPLE ]
55.2%
PERCENT IN LABOR FORCE
17.9%
UNEMPLOYMENT RATE
Income in Seco Mines
Income Overview in Seco Mines
Per Capita Income in Seco Mines is $11,535, while median incomes of families and households are $43,226 and $43,226 respectively.
| Characteristic | Number | Measure |
| Per Capita Income | 1,274 | $11,535 |
| Median Family Income | 284 | $43,226 |
| Mean Family Income | 284 | $44,277 |
| Median Household Income | 284 | $43,226 |
| Mean Household Income | 284 | $44,277 |
| Income Deficit | 284 | $0 |
| Wage / Income Gap (%) | 1,274 | 0.00% |
| Wage / Income Gap ($) | 1,274 | 100.00¢ per $1 |
| Gini / Inequality Index | 1,274 | 0.34 |
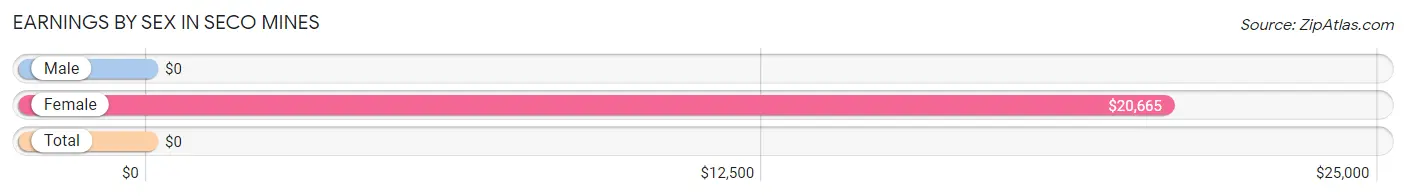
Earnings by Sex in Seco Mines
| Sex | Number | Average Earnings |
| Male | 293 (68.8%) | $0 |
| Female | 133 (31.2%) | $20,665 |
| Total | 426 (100.0%) | $0 |
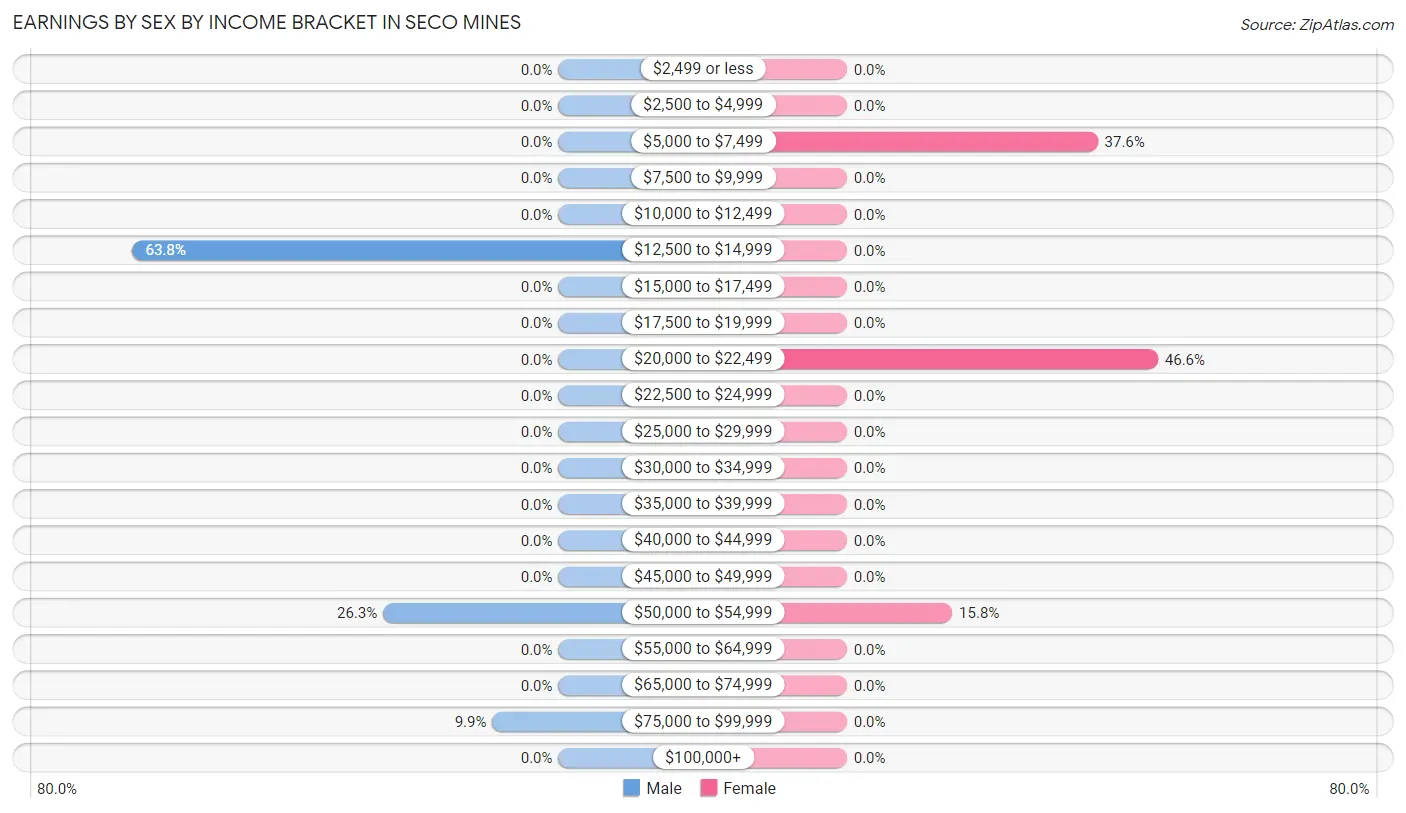
Earnings by Sex by Income Bracket in Seco Mines
The most common earnings brackets in Seco Mines are $12,500 to $14,999 for men (187 | 63.8%) and $20,000 to $22,499 for women (62 | 46.6%).
| Income | Male | Female |
| $2,499 or less | 0 (0.0%) | 0 (0.0%) |
| $2,500 to $4,999 | 0 (0.0%) | 0 (0.0%) |
| $5,000 to $7,499 | 0 (0.0%) | 50 (37.6%) |
| $7,500 to $9,999 | 0 (0.0%) | 0 (0.0%) |
| $10,000 to $12,499 | 0 (0.0%) | 0 (0.0%) |
| $12,500 to $14,999 | 187 (63.8%) | 0 (0.0%) |
| $15,000 to $17,499 | 0 (0.0%) | 0 (0.0%) |
| $17,500 to $19,999 | 0 (0.0%) | 0 (0.0%) |
| $20,000 to $22,499 | 0 (0.0%) | 62 (46.6%) |
| $22,500 to $24,999 | 0 (0.0%) | 0 (0.0%) |
| $25,000 to $29,999 | 0 (0.0%) | 0 (0.0%) |
| $30,000 to $34,999 | 0 (0.0%) | 0 (0.0%) |
| $35,000 to $39,999 | 0 (0.0%) | 0 (0.0%) |
| $40,000 to $44,999 | 0 (0.0%) | 0 (0.0%) |
| $45,000 to $49,999 | 0 (0.0%) | 0 (0.0%) |
| $50,000 to $54,999 | 77 (26.3%) | 21 (15.8%) |
| $55,000 to $64,999 | 0 (0.0%) | 0 (0.0%) |
| $65,000 to $74,999 | 0 (0.0%) | 0 (0.0%) |
| $75,000 to $99,999 | 29 (9.9%) | 0 (0.0%) |
| $100,000+ | 0 (0.0%) | 0 (0.0%) |
| Total | 293 (100.0%) | 133 (100.0%) |
Earnings by Sex by Educational Attainment in Seco Mines
| Educational Attainment | Male Income | Female Income |
| Less than High School | - | - |
| High School Diploma | - | - |
| College or Associate's Degree | - | - |
| Bachelor's Degree | - | - |
| Graduate Degree | - | - |
| Total | - | - |
Family Income in Seco Mines
Family Income Brackets in Seco Mines
According to the Seco Mines family income data, there are 94 families falling into the $35,000 to $49,999 income range, which is the most common income bracket and makes up 33.1% of all families.
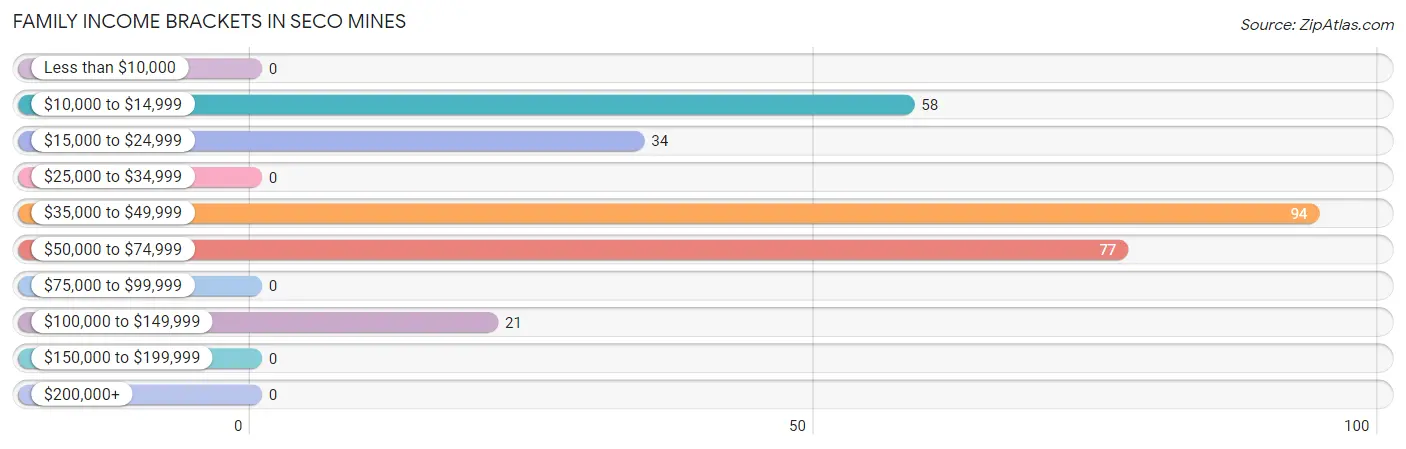
| Income Bracket | # Families | % Families |
| Less than $10,000 | 0 | 0.0% |
| $10,000 to $14,999 | 58 | 20.4% |
| $15,000 to $24,999 | 34 | 12.0% |
| $25,000 to $34,999 | 0 | 0.0% |
| $35,000 to $49,999 | 94 | 33.1% |
| $50,000 to $74,999 | 77 | 27.1% |
| $75,000 to $99,999 | 0 | 0.0% |
| $100,000 to $149,999 | 21 | 7.4% |
| $150,000 to $199,999 | 0 | 0.0% |
| $200,000+ | 0 | 0.0% |
Family Income by Famaliy Size in Seco Mines
| Income Bracket | # Families | Median Income |
| 2-Person Families | 92 (32.4%) | $0 |
| 3-Person Families | 0 (0.0%) | $0 |
| 4-Person Families | 77 (27.1%) | $0 |
| 5-Person Families | 83 (29.2%) | $0 |
| 6-Person Families | 32 (11.3%) | $0 |
| 7+ Person Families | 0 (0.0%) | $0 |
| Total | 284 (100.0%) | $43,226 |
Family Income by Number of Earners in Seco Mines
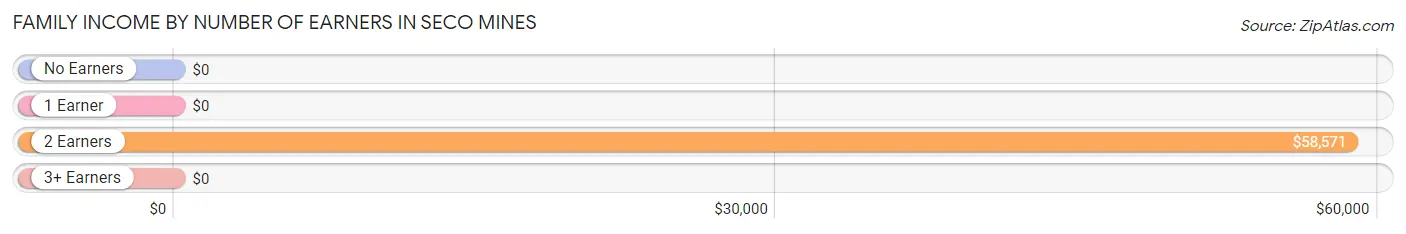
| Number of Earners | # Families | Median Income |
| No Earners | 92 (32.4%) | $0 |
| 1 Earner | 62 (21.8%) | $0 |
| 2 Earners | 130 (45.8%) | $58,571 |
| 3+ Earners | 0 (0.0%) | $0 |
| Total | 284 (100.0%) | $43,226 |
Household Income in Seco Mines
Household Income Brackets in Seco Mines
With 94 households falling in the category, the $35,000 to $49,999 income range is the most frequent in Seco Mines, accounting for 33.1% of all households.
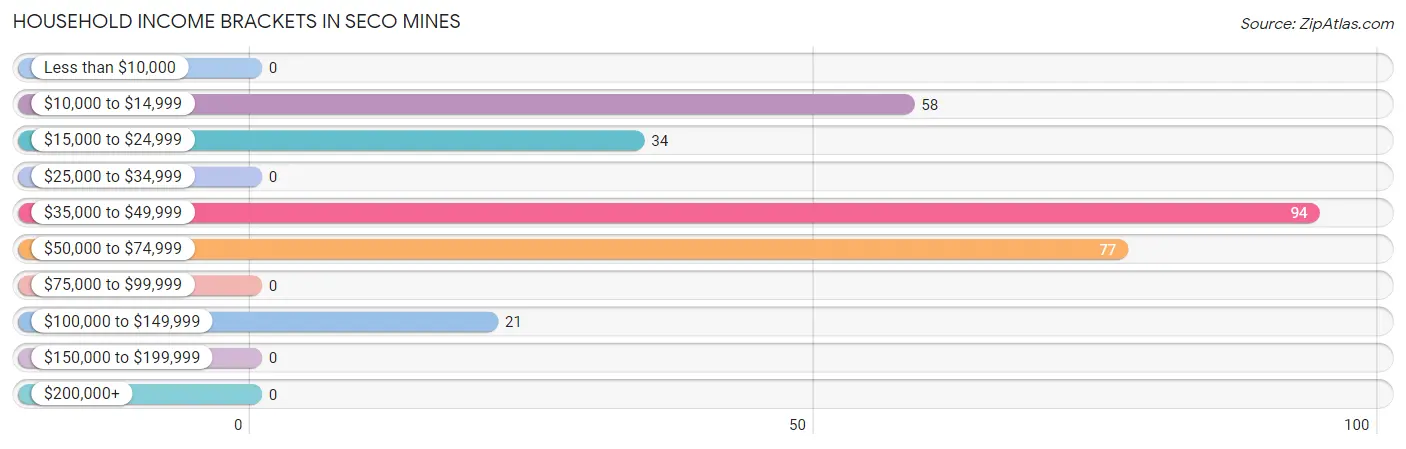
| Income Bracket | # Households | % Households |
| Less than $10,000 | 0 | 0.0% |
| $10,000 to $14,999 | 58 | 20.4% |
| $15,000 to $24,999 | 34 | 12.0% |
| $25,000 to $34,999 | 0 | 0.0% |
| $35,000 to $49,999 | 94 | 33.1% |
| $50,000 to $74,999 | 77 | 27.1% |
| $75,000 to $99,999 | 0 | 0.0% |
| $100,000 to $149,999 | 21 | 7.4% |
| $150,000 to $199,999 | 0 | 0.0% |
| $200,000+ | 0 | 0.0% |
Household Income by Householder Age in Seco Mines
The median household income in Seco Mines is $43,226, with the highest median household income of $17,794 found in the 65+ years age bracket for the primary householder. A total of 124 households (43.7%) fall into this category.
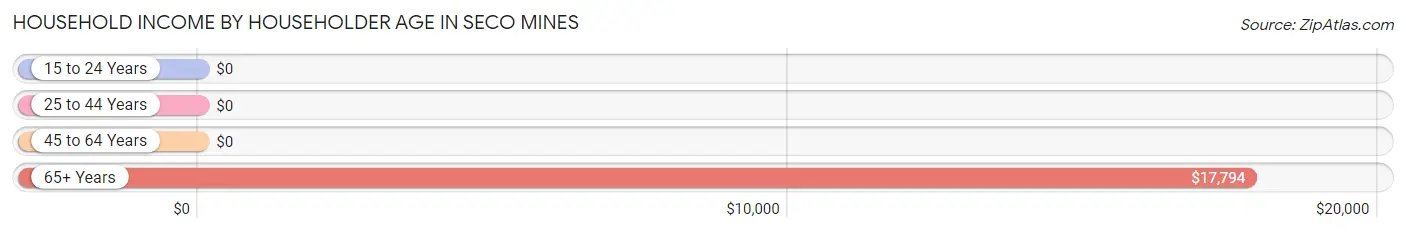
| Income Bracket | # Households | Median Income |
| 15 to 24 Years | 0 (0.0%) | $0 |
| 25 to 44 Years | 83 (29.2%) | $0 |
| 45 to 64 Years | 77 (27.1%) | $0 |
| 65+ Years | 124 (43.7%) | $17,794 |
| Total | 284 (100.0%) | $43,226 |
Poverty in Seco Mines
Income Below Poverty by Sex and Age in Seco Mines
With 56.0% poverty level for males and 22.2% for females among the residents of Seco Mines, 18 to 24 year old males and 75 year old and over females are the most vulnerable to poverty, with 230 males (100.0%) and 58 females (100.0%) in their respective age groups living below the poverty level.
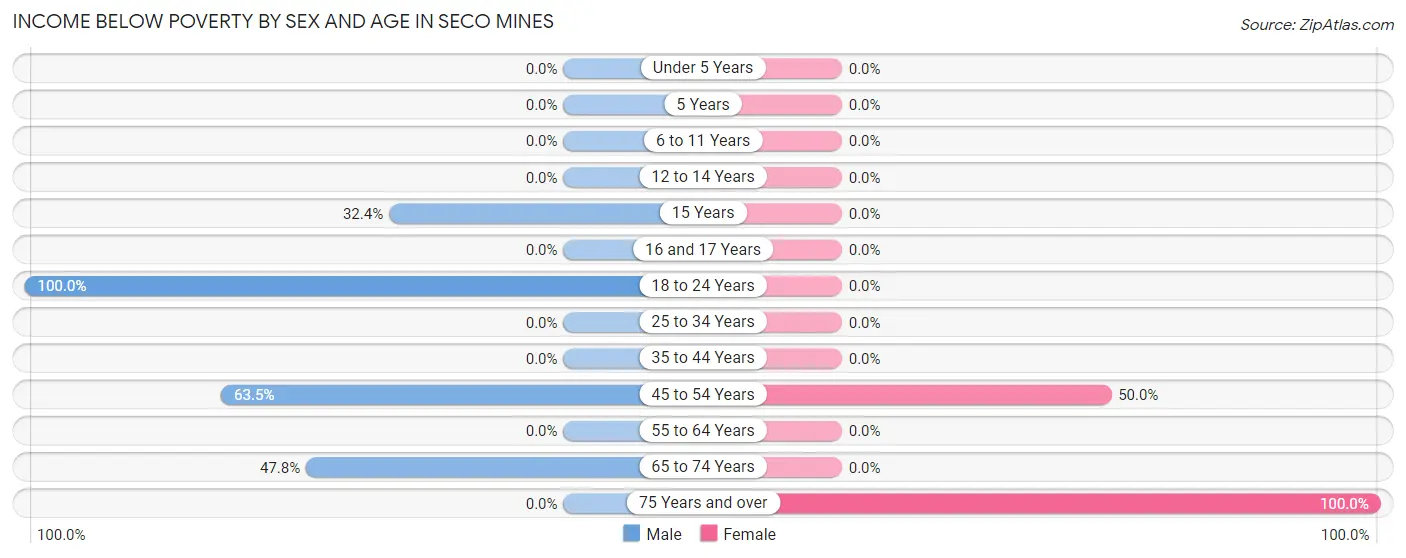
| Age Bracket | Male | Female |
| Under 5 Years | 0 (0.0%) | 0 (0.0%) |
| 5 Years | 0 (0.0%) | 0 (0.0%) |
| 6 to 11 Years | 0 (0.0%) | 0 (0.0%) |
| 12 to 14 Years | 0 (0.0%) | 0 (0.0%) |
| 15 Years | 45 (32.4%) | 0 (0.0%) |
| 16 and 17 Years | 0 (0.0%) | 0 (0.0%) |
| 18 to 24 Years | 230 (100.0%) | 0 (0.0%) |
| 25 to 34 Years | 0 (0.0%) | 0 (0.0%) |
| 35 to 44 Years | 0 (0.0%) | 0 (0.0%) |
| 45 to 54 Years | 134 (63.5%) | 50 (50.0%) |
| 55 to 64 Years | 0 (0.0%) | 0 (0.0%) |
| 65 to 74 Years | 32 (47.8%) | 0 (0.0%) |
| 75 Years and over | 0 (0.0%) | 58 (100.0%) |
| Total | 441 (56.0%) | 108 (22.2%) |
Income Above Poverty by Sex and Age in Seco Mines
According to the poverty statistics in Seco Mines, males aged 5 years and females aged under 5 years are the age groups that are most secure financially, with 100.0% of males and 100.0% of females in these age groups living above the poverty line.
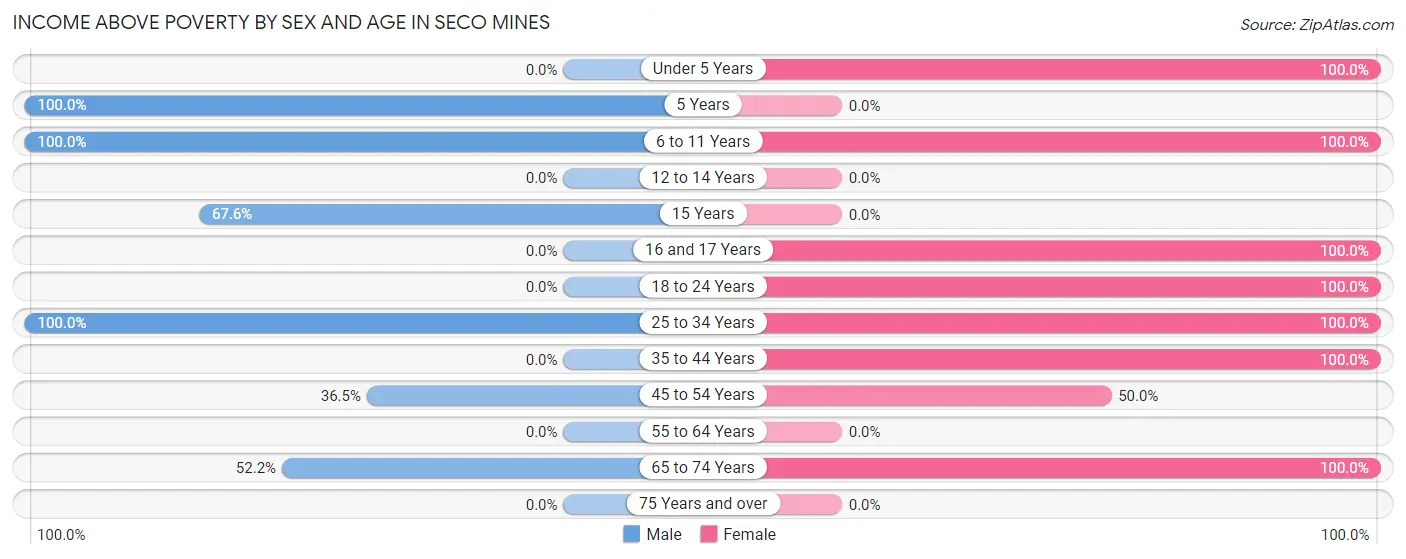
| Age Bracket | Male | Female |
| Under 5 Years | 0 (0.0%) | 31 (100.0%) |
| 5 Years | 63 (100.0%) | 0 (0.0%) |
| 6 to 11 Years | 48 (100.0%) | 52 (100.0%) |
| 12 to 14 Years | 0 (0.0%) | 0 (0.0%) |
| 15 Years | 94 (67.6%) | 0 (0.0%) |
| 16 and 17 Years | 0 (0.0%) | 56 (100.0%) |
| 18 to 24 Years | 0 (0.0%) | 73 (100.0%) |
| 25 to 34 Years | 29 (100.0%) | 21 (100.0%) |
| 35 to 44 Years | 0 (0.0%) | 62 (100.0%) |
| 45 to 54 Years | 77 (36.5%) | 50 (50.0%) |
| 55 to 64 Years | 0 (0.0%) | 0 (0.0%) |
| 65 to 74 Years | 35 (52.2%) | 34 (100.0%) |
| 75 Years and over | 0 (0.0%) | 0 (0.0%) |
| Total | 346 (44.0%) | 379 (77.8%) |
Income Below Poverty Among Married-Couple Families in Seco Mines
The poverty statistics for married-couple families in Seco Mines show that 19.5% or 32 of the total 164 families live below the poverty line. Families with 1 or 2 children have the highest poverty rate of 29.4%, comprising of 32 families. On the other hand, families with no children have the lowest poverty rate of 0.0%, which includes 0 families.
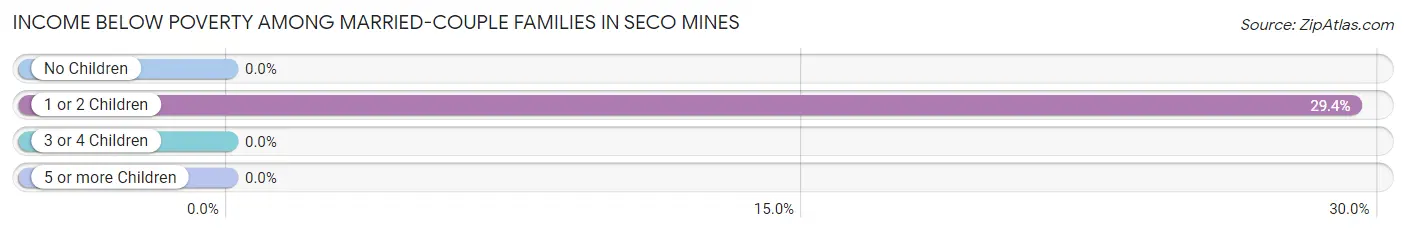
| Children | Above Poverty | Below Poverty |
| No Children | 34 (100.0%) | 0 (0.0%) |
| 1 or 2 Children | 77 (70.6%) | 32 (29.4%) |
| 3 or 4 Children | 21 (100.0%) | 0 (0.0%) |
| 5 or more Children | 0 (0.0%) | 0 (0.0%) |
| Total | 132 (80.5%) | 32 (19.5%) |
Income Below Poverty Among Single-Parent Households in Seco Mines
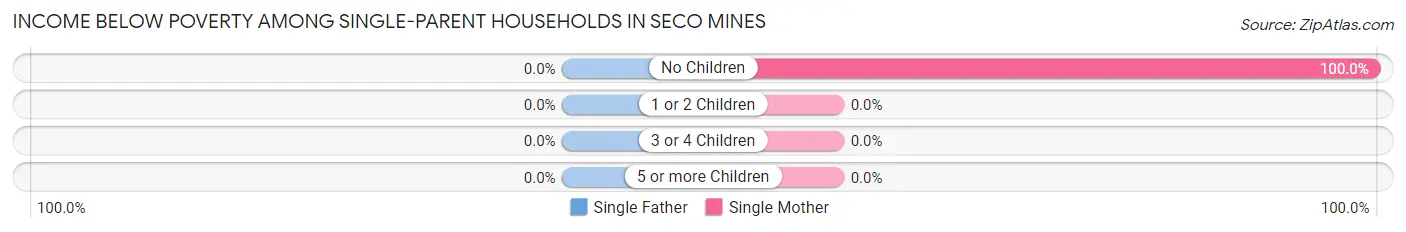
| Children | Single Father | Single Mother |
| No Children | 0 (0.0%) | 58 (100.0%) |
| 1 or 2 Children | 0 (0.0%) | 0 (0.0%) |
| 3 or 4 Children | 0 (0.0%) | 0 (0.0%) |
| 5 or more Children | 0 (0.0%) | 0 (0.0%) |
| Total | 0 (0.0%) | 58 (48.3%) |
Income Below Poverty Among Married-Couple vs Single-Parent Households in Seco Mines
The poverty data for Seco Mines shows that 32 of the married-couple family households (19.5%) and 58 of the single-parent households (48.3%) are living below the poverty level. Within the married-couple family households, those with 1 or 2 children have the highest poverty rate, with 32 households (29.4%) falling below the poverty line. Among the single-parent households, those with no children have the highest poverty rate, with 58 household (100.0%) living below poverty.
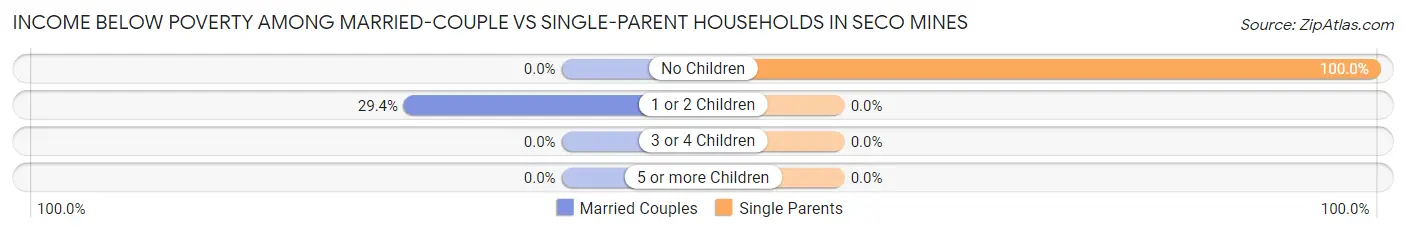
| Children | Married-Couple Families | Single-Parent Households |
| No Children | 0 (0.0%) | 58 (100.0%) |
| 1 or 2 Children | 32 (29.4%) | 0 (0.0%) |
| 3 or 4 Children | 0 (0.0%) | 0 (0.0%) |
| 5 or more Children | 0 (0.0%) | 0 (0.0%) |
| Total | 32 (19.5%) | 58 (48.3%) |
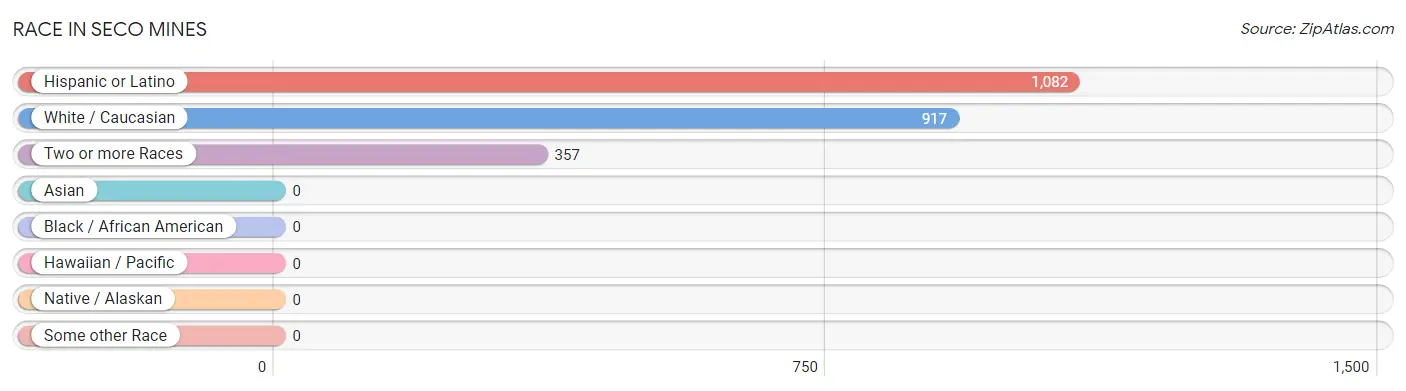
Race in Seco Mines
The most populous races in Seco Mines are Hispanic or Latino (1,082 | 84.9%), White / Caucasian (917 | 72.0%), and Two or more Races (357 | 28.0%).
| Race | # Population | % Population |
| Asian | 0 | 0.0% |
| Black / African American | 0 | 0.0% |
| Hawaiian / Pacific | 0 | 0.0% |
| Hispanic or Latino | 1,082 | 84.9% |
| Native / Alaskan | 0 | 0.0% |
| White / Caucasian | 917 | 72.0% |
| Two or more Races | 357 | 28.0% |
| Some other Race | 0 | 0.0% |
| Total | 1,274 | 100.0% |
Ancestry in Seco Mines
The most populous ancestries reported in Seco Mines are , and Mexican (837 | 65.7%), together accounting for 65.7% of all Seco Mines residents.

| Ancestry | # Population | % Population |
| Mexican | 837 | 65.7% | View All 1 Rows |
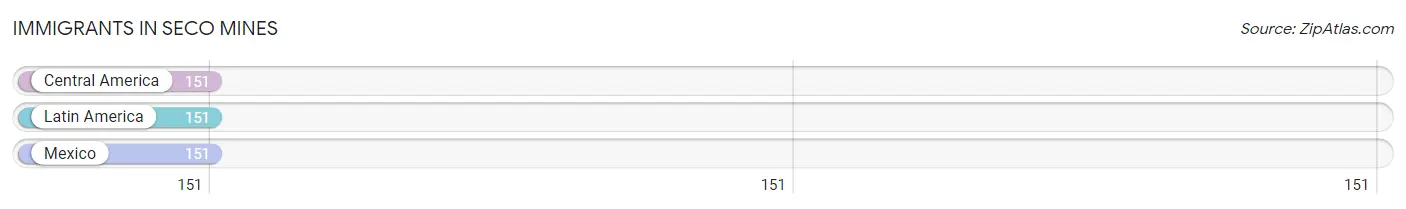
Immigrants in Seco Mines
The most numerous immigrant groups reported in Seco Mines came from Central America (151 | 11.8%), Latin America (151 | 11.8%), and Mexico (151 | 11.8%), together accounting for 35.5% of all Seco Mines residents.
| Immigration Origin | # Population | % Population |
| Central America | 151 | 11.8% |
| Latin America | 151 | 11.8% |
| Mexico | 151 | 11.8% | View All 3 Rows |
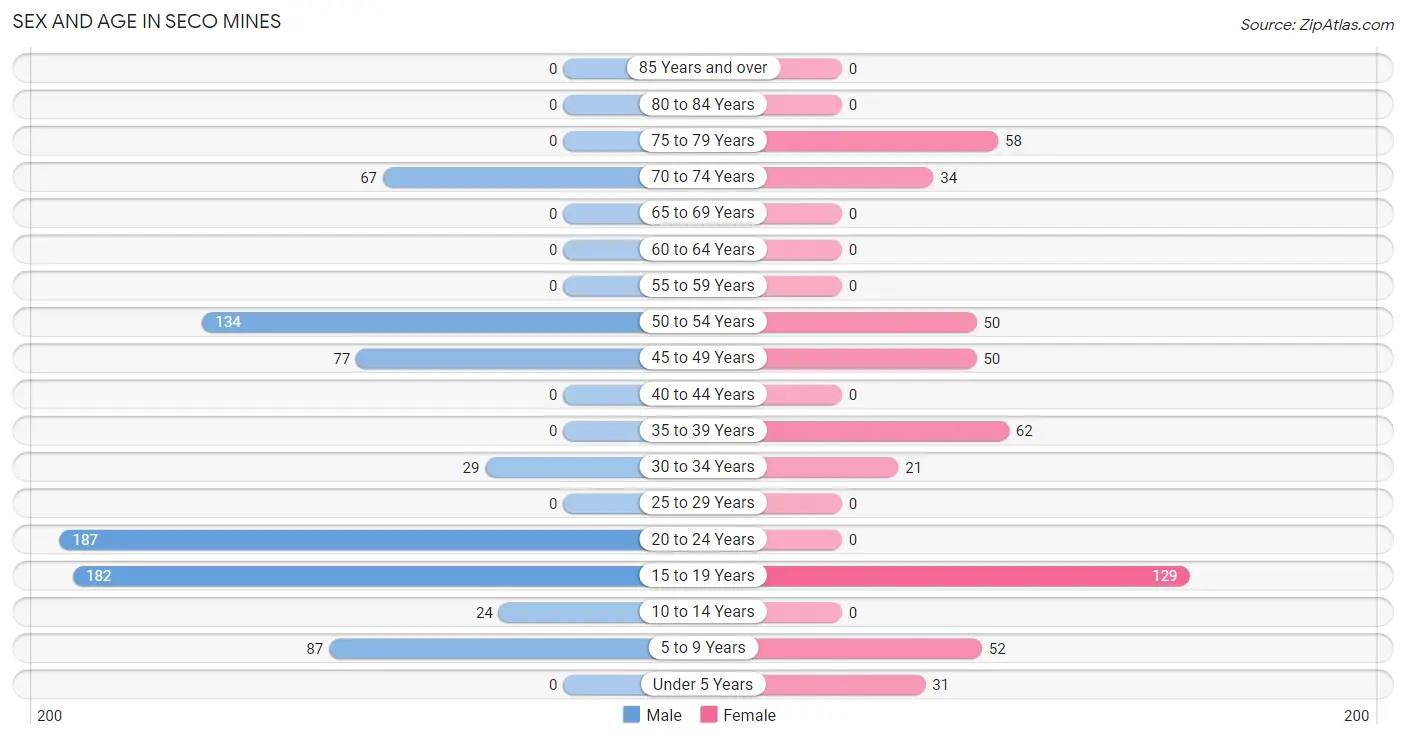
Sex and Age in Seco Mines
Sex and Age in Seco Mines
The most populous age groups in Seco Mines are 20 to 24 Years (187 | 23.8%) for men and 15 to 19 Years (129 | 26.5%) for women.
| Age Bracket | Male | Female |
| Under 5 Years | 0 (0.0%) | 31 (6.4%) |
| 5 to 9 Years | 87 (11.1%) | 52 (10.7%) |
| 10 to 14 Years | 24 (3.0%) | 0 (0.0%) |
| 15 to 19 Years | 182 (23.1%) | 129 (26.5%) |
| 20 to 24 Years | 187 (23.8%) | 0 (0.0%) |
| 25 to 29 Years | 0 (0.0%) | 0 (0.0%) |
| 30 to 34 Years | 29 (3.7%) | 21 (4.3%) |
| 35 to 39 Years | 0 (0.0%) | 62 (12.7%) |
| 40 to 44 Years | 0 (0.0%) | 0 (0.0%) |
| 45 to 49 Years | 77 (9.8%) | 50 (10.3%) |
| 50 to 54 Years | 134 (17.0%) | 50 (10.3%) |
| 55 to 59 Years | 0 (0.0%) | 0 (0.0%) |
| 60 to 64 Years | 0 (0.0%) | 0 (0.0%) |
| 65 to 69 Years | 0 (0.0%) | 0 (0.0%) |
| 70 to 74 Years | 67 (8.5%) | 34 (7.0%) |
| 75 to 79 Years | 0 (0.0%) | 58 (11.9%) |
| 80 to 84 Years | 0 (0.0%) | 0 (0.0%) |
| 85 Years and over | 0 (0.0%) | 0 (0.0%) |
| Total | 787 (100.0%) | 487 (100.0%) |
Families and Households in Seco Mines
Median Family Size in Seco Mines
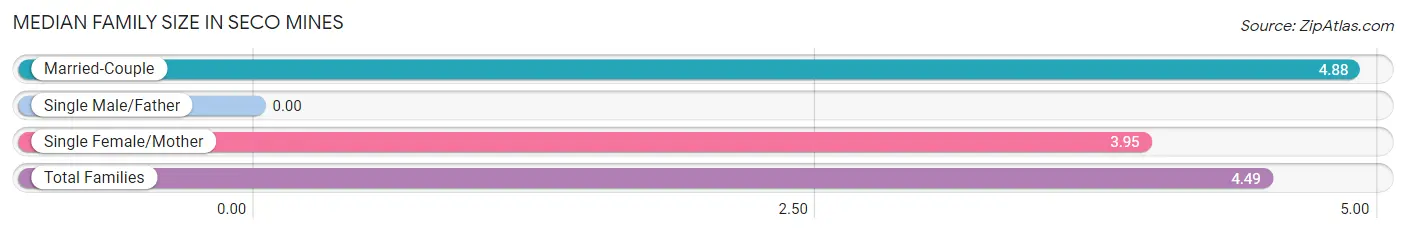
| Family Type | # Families | Family Size |
| Married-Couple | 164 (57.8%) | 4.88 |
| Single Male/Father | 0 (0.0%) | - |
| Single Female/Mother | 120 (42.2%) | 3.95 |
| Total Families | 284 (100.0%) | 4.49 |
Median Household Size in Seco Mines
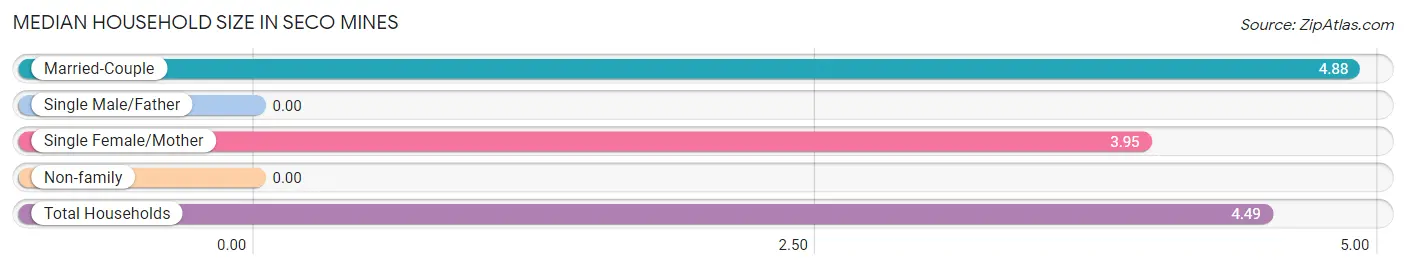
| Household Type | # Households | Household Size |
| Married-Couple | 164 (57.8%) | 4.88 |
| Single Male/Father | 0 (0.0%) | - |
| Single Female/Mother | 120 (42.2%) | 3.95 |
| Non-family | 0 (0.0%) | - |
| Total Households | 284 (100.0%) | 4.49 |
Household Size by Marriage Status in Seco Mines
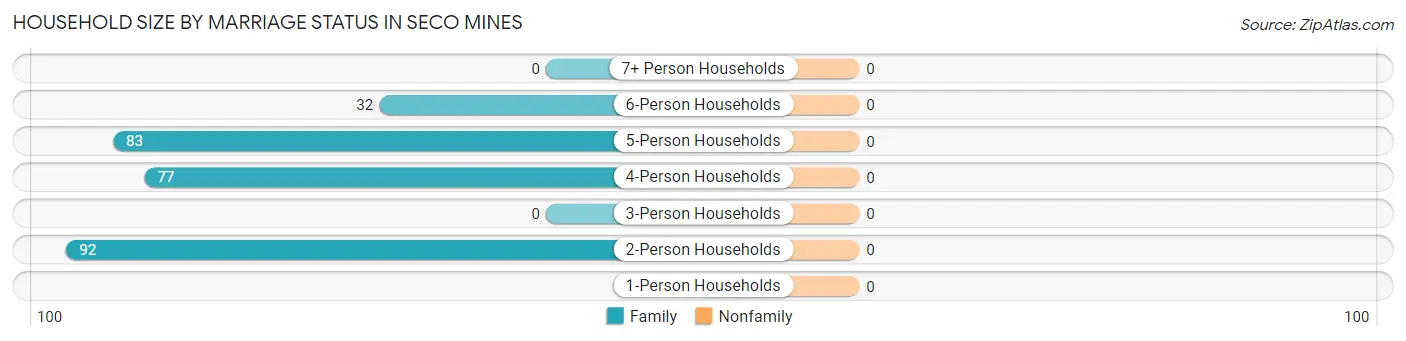
| Household Size | Family Households | Nonfamily Households |
| 1-Person Households | - | 0 (0.0%) |
| 2-Person Households | 92 (32.4%) | 0 (0.0%) |
| 3-Person Households | 0 (0.0%) | 0 (0.0%) |
| 4-Person Households | 77 (27.1%) | 0 (0.0%) |
| 5-Person Households | 83 (29.2%) | 0 (0.0%) |
| 6-Person Households | 32 (11.3%) | 0 (0.0%) |
| 7+ Person Households | 0 (0.0%) | 0 (0.0%) |
| Total | 284 (100.0%) | 0 (0.0%) |
Female Fertility in Seco Mines
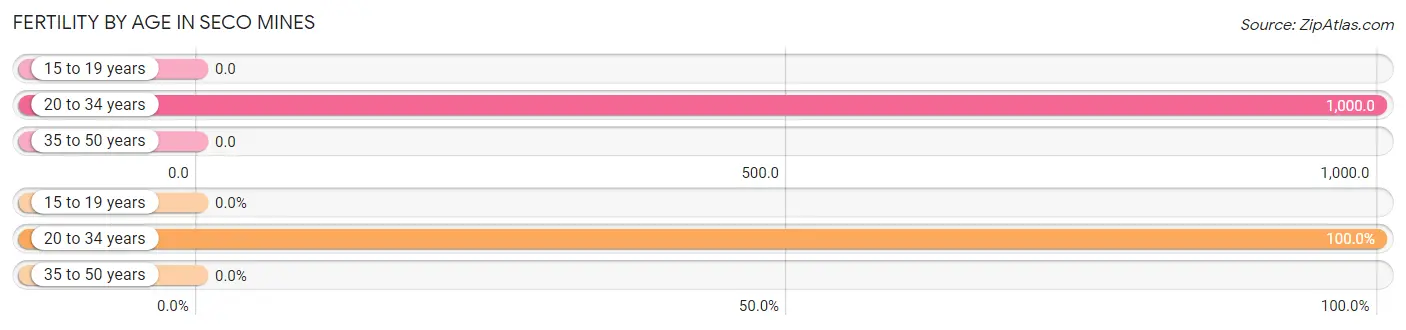
Fertility by Age in Seco Mines
Average fertility rate in Seco Mines is 80.0 births per 1,000 women. Women in the age bracket of 20 to 34 years have the highest fertility rate with 1,000.0 births per 1,000 women. Women in the age bracket of 20 to 34 years acount for 100.0% of all women with births.
| Age Bracket | Women with Births | Births / 1,000 Women |
| 15 to 19 years | 0 (0.0%) | 0.0 |
| 20 to 34 years | 21 (100.0%) | 1,000.0 |
| 35 to 50 years | 0 (0.0%) | 0.0 |
| Total | 21 (100.0%) | 80.0 |
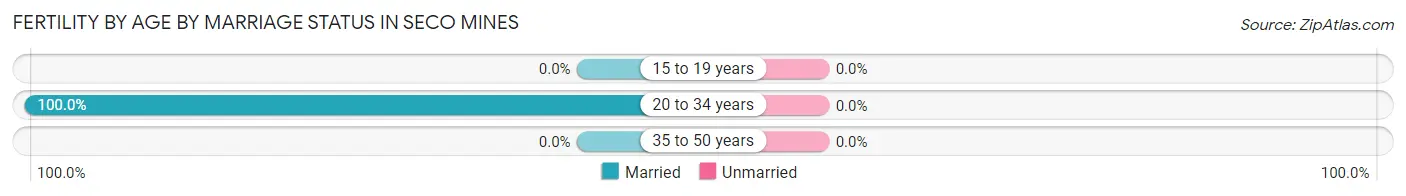
Fertility by Age by Marriage Status in Seco Mines
| Age Bracket | Married | Unmarried |
| 15 to 19 years | 0 (0.0%) | 0 (0.0%) |
| 20 to 34 years | 21 (100.0%) | 0 (0.0%) |
| 35 to 50 years | 0 (0.0%) | 0 (0.0%) |
| Total | 21 (100.0%) | 0 (0.0%) |
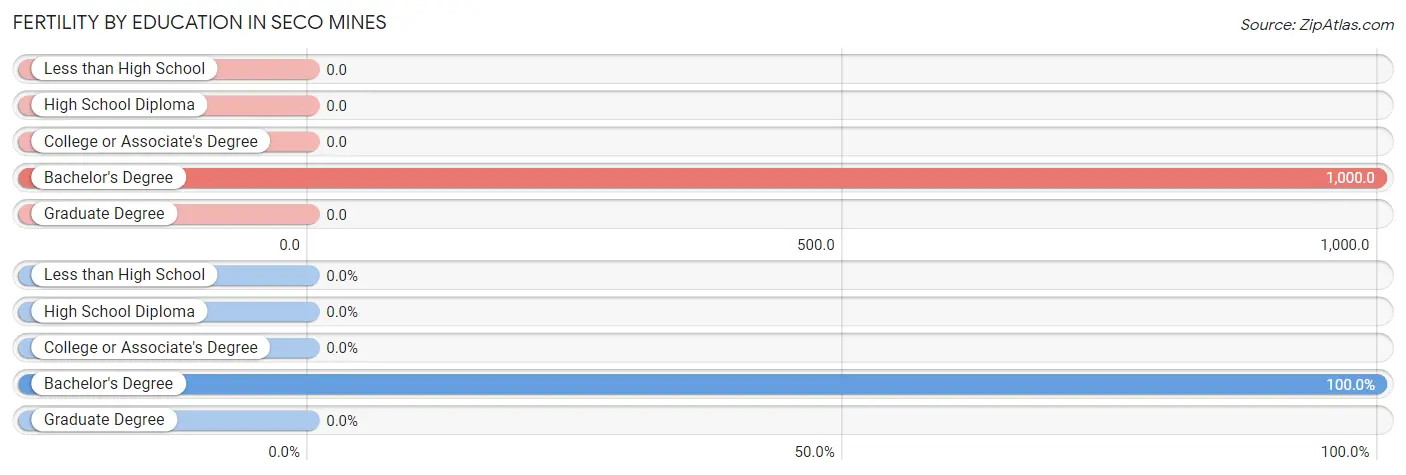
Fertility by Education in Seco Mines
| Educational Attainment | Women with Births | Births / 1,000 Women |
| Less than High School | 0 (0.0%) | 0.0 |
| High School Diploma | 0 (0.0%) | 0.0 |
| College or Associate's Degree | 0 (0.0%) | 0.0 |
| Bachelor's Degree | 21 (100.0%) | 1,000.0 |
| Graduate Degree | 0 (0.0%) | 0.0 |
| Total | 21 (100.0%) | 80.0 |
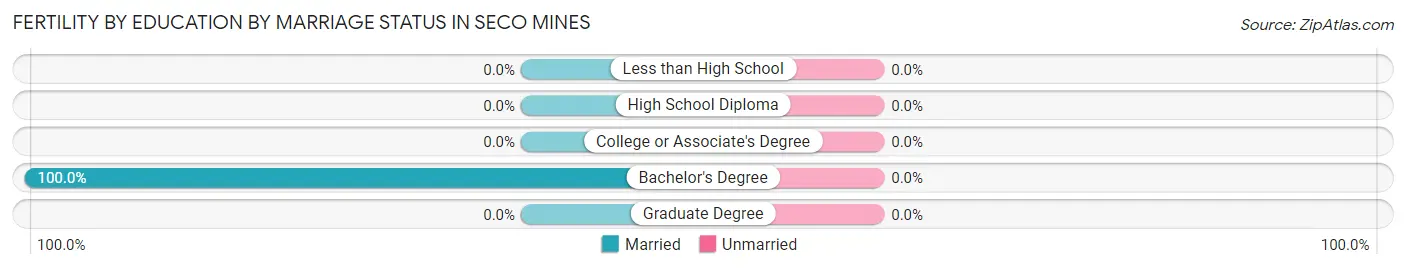
Fertility by Education by Marriage Status in Seco Mines
| Educational Attainment | Married | Unmarried |
| Less than High School | 0 (0.0%) | 0 (0.0%) |
| High School Diploma | 0 (0.0%) | 0 (0.0%) |
| College or Associate's Degree | 0 (0.0%) | 0 (0.0%) |
| Bachelor's Degree | 21 (100.0%) | 0 (0.0%) |
| Graduate Degree | 0 (0.0%) | 0 (0.0%) |
| Total | 21 (100.0%) | 0 (0.0%) |
Employment Characteristics in Seco Mines
Employment by Class of Employer in Seco Mines
Among the 426 employed individuals in Seco Mines, private company employees (326 | 76.5%), and local government employees (100 | 23.5%) make up the most common classes of employment.
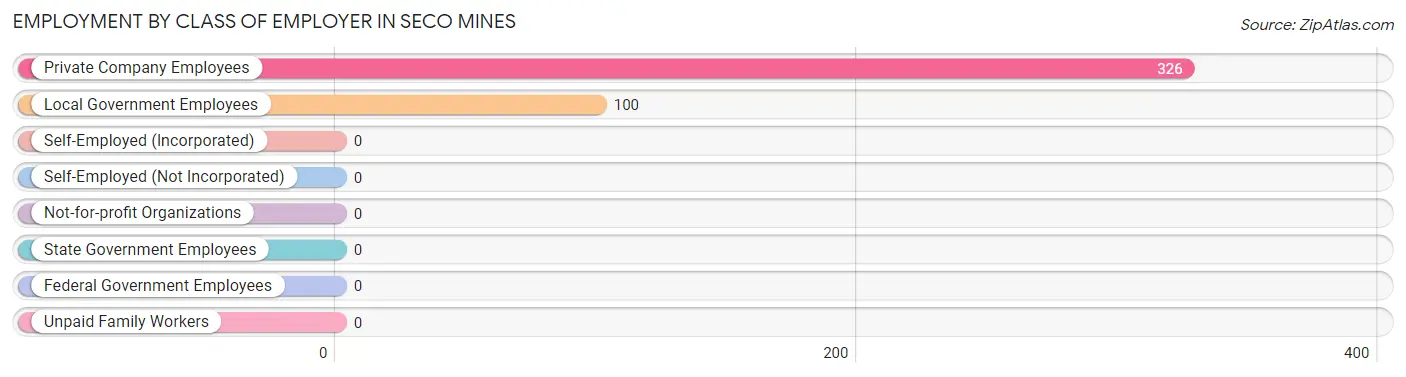
| Employer Class | # Employees | % Employees |
| Private Company Employees | 326 | 76.5% |
| Self-Employed (Incorporated) | 0 | 0.0% |
| Self-Employed (Not Incorporated) | 0 | 0.0% |
| Not-for-profit Organizations | 0 | 0.0% |
| Local Government Employees | 100 | 23.5% |
| State Government Employees | 0 | 0.0% |
| Federal Government Employees | 0 | 0.0% |
| Unpaid Family Workers | 0 | 0.0% |
| Total | 426 | 100.0% |
Employment Status by Age in Seco Mines
According to the labor force statistics for Seco Mines, out of the total population over 16 years of age (941), 55.2% or 519 individuals are in the labor force, with 17.9% or 93 of them unemployed. The age group with the highest labor force participation rate is 20 to 24 years, with 100.0% or 187 individuals in the labor force. Within the labor force, the 16 to 19 years age range has the highest percentage of unemployed individuals, with 100.0% or 43 of them being unemployed.
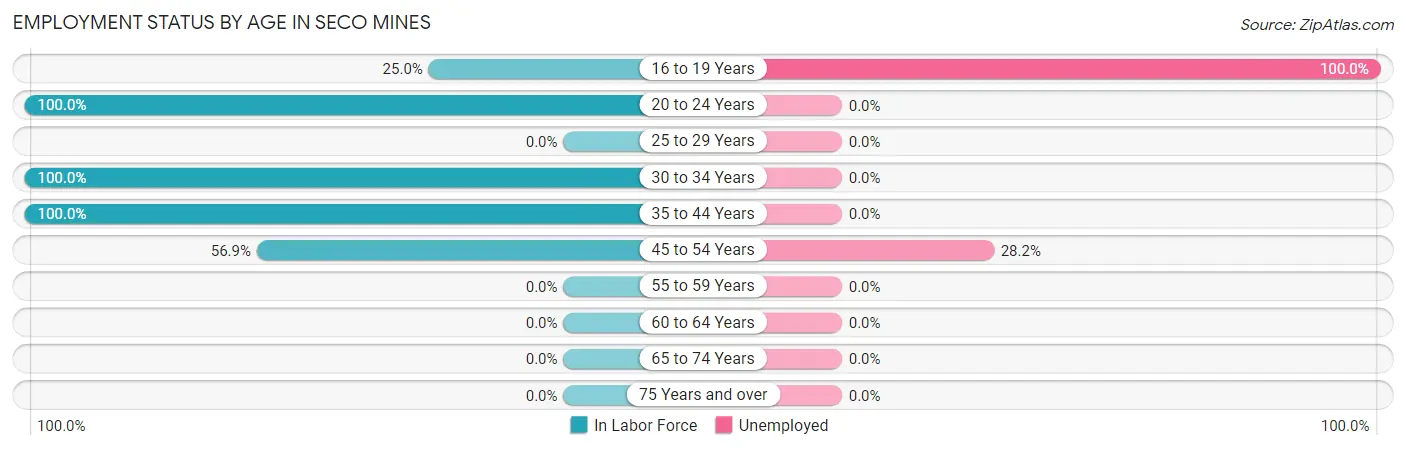
| Age Bracket | In Labor Force | Unemployed |
| 16 to 19 Years | 43 (25.0%) | 43 (100.0%) |
| 20 to 24 Years | 187 (100.0%) | 0 (0.0%) |
| 25 to 29 Years | 0 (0.0%) | 0 (0.0%) |
| 30 to 34 Years | 50 (100.0%) | 0 (0.0%) |
| 35 to 44 Years | 62 (100.0%) | 0 (0.0%) |
| 45 to 54 Years | 177 (56.9%) | 50 (28.2%) |
| 55 to 59 Years | 0 (0.0%) | 0 (0.0%) |
| 60 to 64 Years | 0 (0.0%) | 0 (0.0%) |
| 65 to 74 Years | 0 (0.0%) | 0 (0.0%) |
| 75 Years and over | 0 (0.0%) | 0 (0.0%) |
| Total | 519 (55.2%) | 93 (17.9%) |
Employment Status by Educational Attainment in Seco Mines
According to labor force statistics for Seco Mines, 68.3% of individuals (289) out of the total population between 25 and 64 years of age (423) are in the labor force, with 17.3% or 50 of them being unemployed. The group with the highest labor force participation rate are those with the educational attainment of college / associate degree, with 100.0% or 91 individuals in the labor force. Within the labor force, individuals with bachelor's degree or higher education have the highest percentage of unemployment, with 70.4% or 50 of them being unemployed.
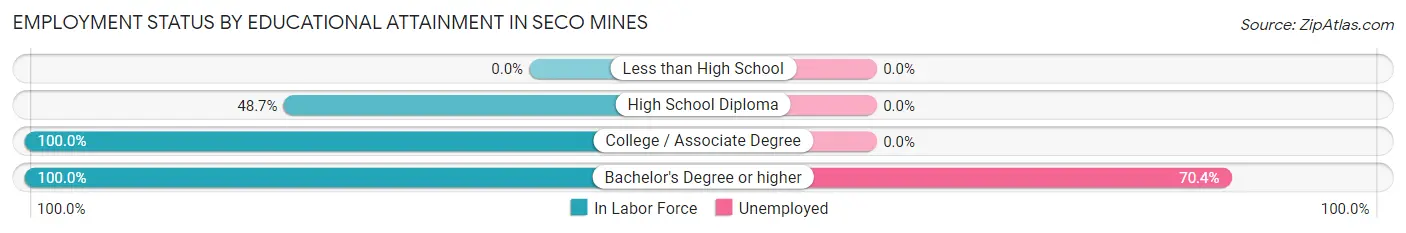
| Educational Attainment | In Labor Force | Unemployed |
| Less than High School | 0 (0.0%) | 0 (0.0%) |
| High School Diploma | 127 (48.7%) | 0 (0.0%) |
| College / Associate Degree | 91 (100.0%) | 0 (0.0%) |
| Bachelor's Degree or higher | 71 (100.0%) | 50 (70.4%) |
| Total | 289 (68.3%) | 73 (17.3%) |
Employment Occupations by Sex in Seco Mines
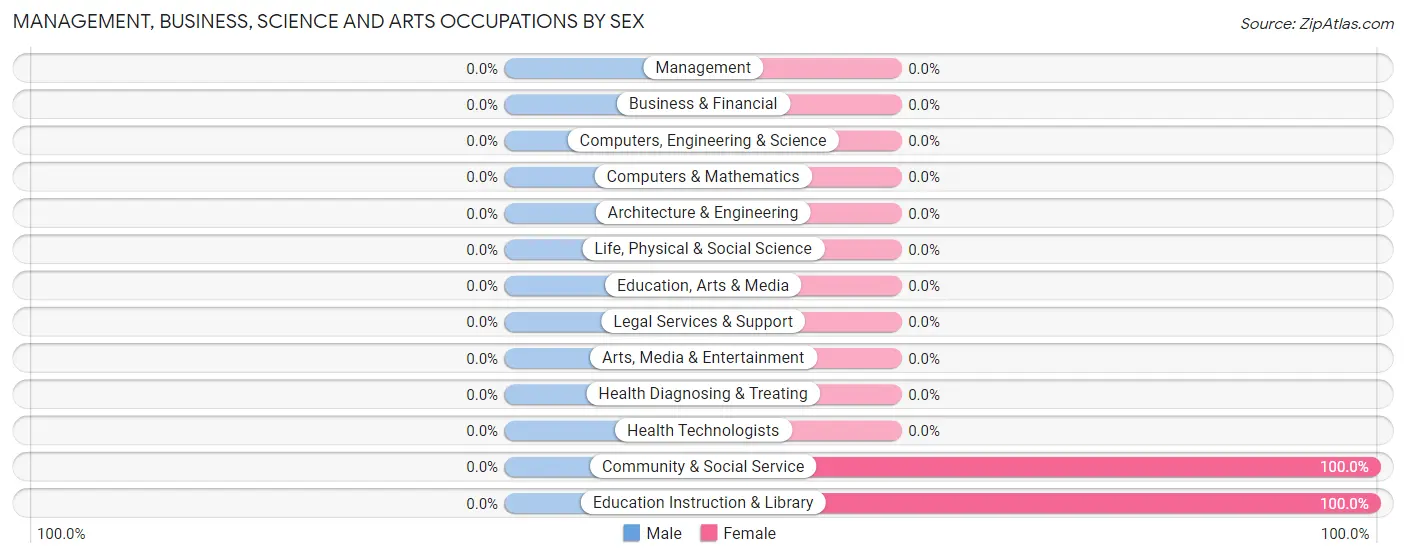
Management, Business, Science and Arts Occupations
The most common Management, Business, Science and Arts occupations in Seco Mines are Community & Social Service (21 | 4.9%), and Education Instruction & Library (21 | 4.9%).
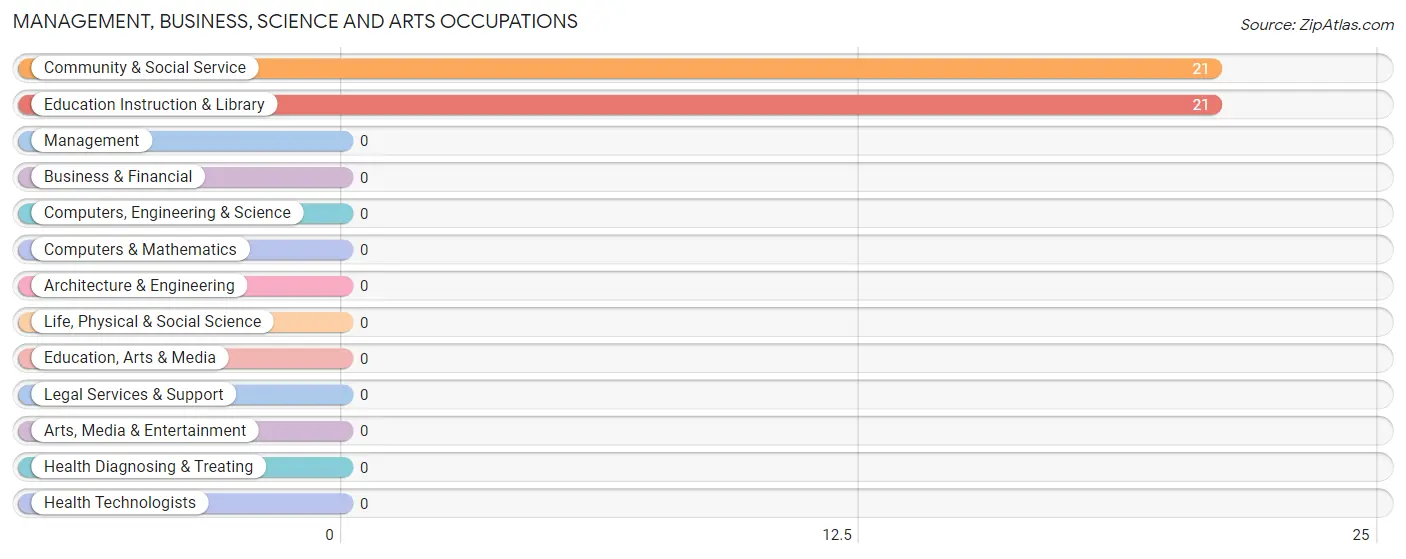
Management, Business, Science and Arts Occupations by Sex
| Occupation | Male | Female |
| Management | 0 (0.0%) | 0 (0.0%) |
| Business & Financial | 0 (0.0%) | 0 (0.0%) |
| Computers, Engineering & Science | 0 (0.0%) | 0 (0.0%) |
| Computers & Mathematics | 0 (0.0%) | 0 (0.0%) |
| Architecture & Engineering | 0 (0.0%) | 0 (0.0%) |
| Life, Physical & Social Science | 0 (0.0%) | 0 (0.0%) |
| Community & Social Service | 0 (0.0%) | 21 (100.0%) |
| Education, Arts & Media | 0 (0.0%) | 0 (0.0%) |
| Legal Services & Support | 0 (0.0%) | 0 (0.0%) |
| Education Instruction & Library | 0 (0.0%) | 21 (100.0%) |
| Arts, Media & Entertainment | 0 (0.0%) | 0 (0.0%) |
| Health Diagnosing & Treating | 0 (0.0%) | 0 (0.0%) |
| Health Technologists | 0 (0.0%) | 0 (0.0%) |
| Total (Category) | 0 (0.0%) | 21 (100.0%) |
| Total (Overall) | 293 (68.8%) | 133 (31.2%) |
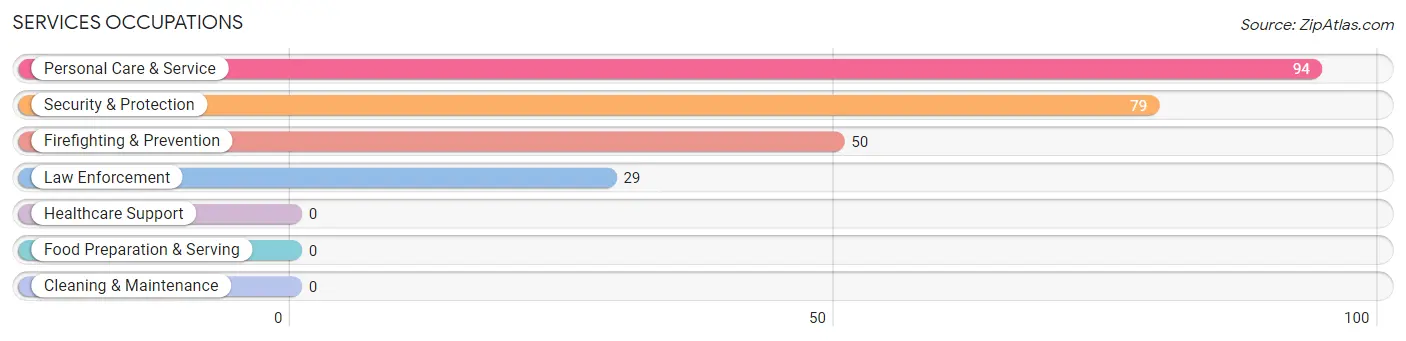
Services Occupations
The most common Services occupations in Seco Mines are Personal Care & Service (94 | 22.1%), Security & Protection (79 | 18.5%), Firefighting & Prevention (50 | 11.7%), and Law Enforcement (29 | 6.8%).
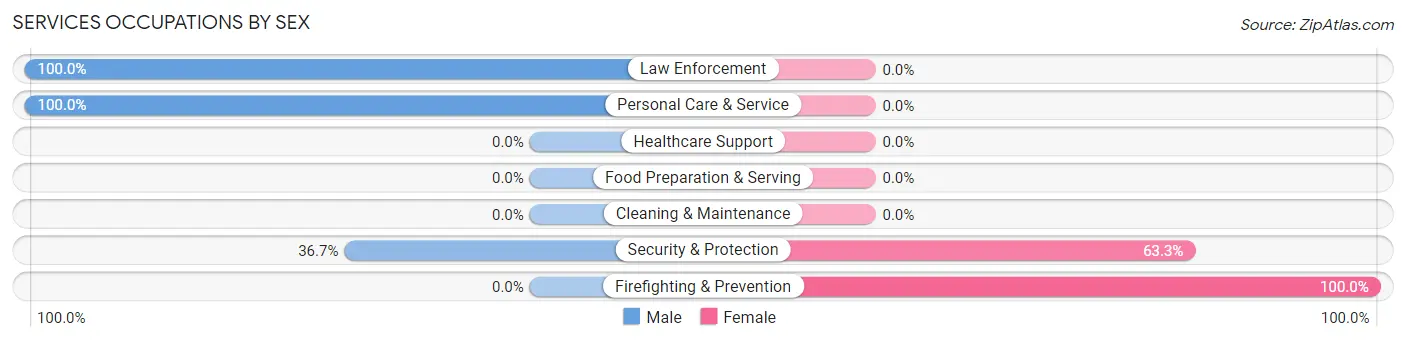
Services Occupations by Sex
Within the Services occupations in Seco Mines, the most male-oriented occupations are Law Enforcement (100.0%), Personal Care & Service (100.0%), and Security & Protection (36.7%), while the most female-oriented occupations are Firefighting & Prevention (100.0%), and Security & Protection (63.3%).
| Occupation | Male | Female |
| Healthcare Support | 0 (0.0%) | 0 (0.0%) |
| Security & Protection | 29 (36.7%) | 50 (63.3%) |
| Firefighting & Prevention | 0 (0.0%) | 50 (100.0%) |
| Law Enforcement | 29 (100.0%) | 0 (0.0%) |
| Food Preparation & Serving | 0 (0.0%) | 0 (0.0%) |
| Cleaning & Maintenance | 0 (0.0%) | 0 (0.0%) |
| Personal Care & Service | 94 (100.0%) | 0 (0.0%) |
| Total (Category) | 123 (71.1%) | 50 (28.9%) |
| Total (Overall) | 293 (68.8%) | 133 (31.2%) |
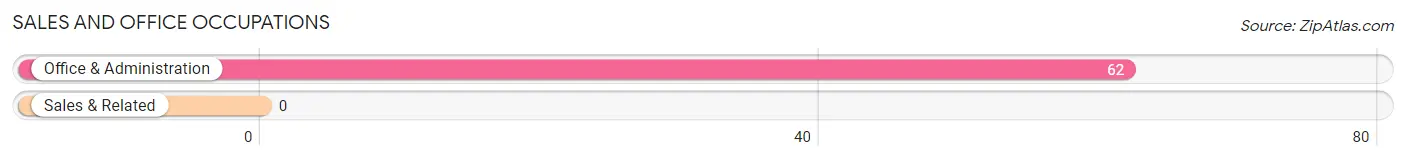
Sales and Office Occupations
The most common Sales and Office occupations in Seco Mines are , and Office & Administration (62 | 14.5%).
Sales and Office Occupations by Sex
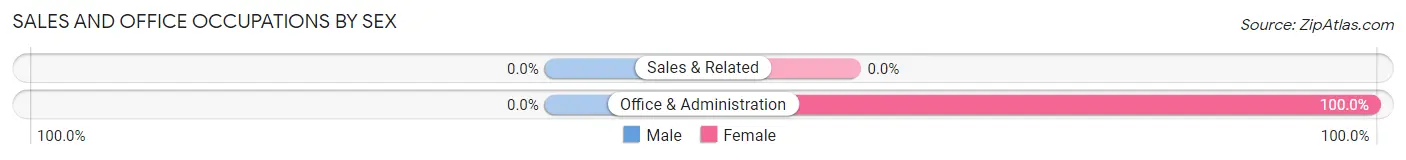
| Occupation | Male | Female |
| Sales & Related | 0 (0.0%) | 0 (0.0%) |
| Office & Administration | 0 (0.0%) | 62 (100.0%) |
| Total (Category) | 0 (0.0%) | 62 (100.0%) |
| Total (Overall) | 293 (68.8%) | 133 (31.2%) |
Natural Resources, Construction and Maintenance Occupations
The most common Natural Resources, Construction and Maintenance occupations in Seco Mines are , and Installation, Maintenance & Repair (77 | 18.1%).
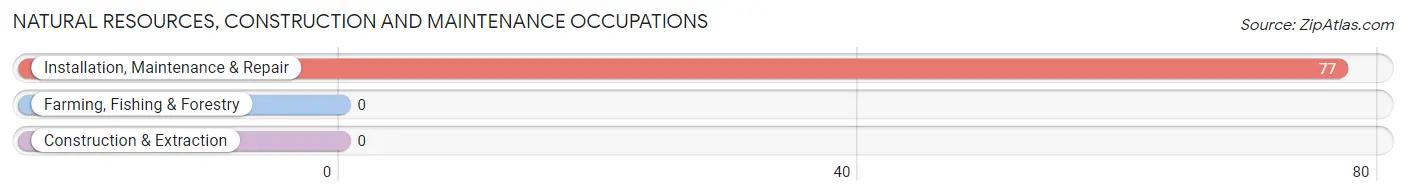
Natural Resources, Construction and Maintenance Occupations by Sex
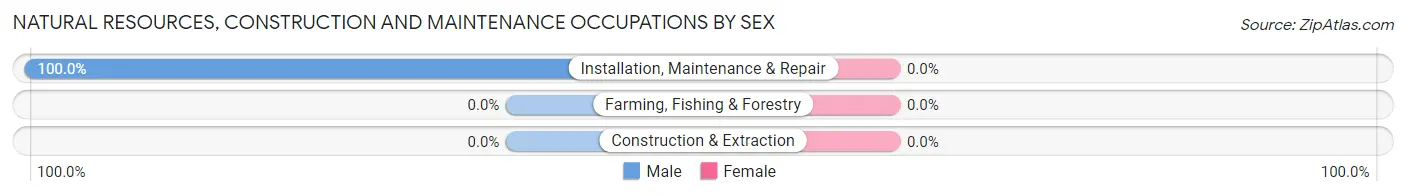
| Occupation | Male | Female |
| Farming, Fishing & Forestry | 0 (0.0%) | 0 (0.0%) |
| Construction & Extraction | 0 (0.0%) | 0 (0.0%) |
| Installation, Maintenance & Repair | 77 (100.0%) | 0 (0.0%) |
| Total (Category) | 77 (100.0%) | 0 (0.0%) |
| Total (Overall) | 293 (68.8%) | 133 (31.2%) |
Production, Transportation and Moving Occupations
The most common Production, Transportation and Moving occupations in Seco Mines are , and Material Moving (93 | 21.8%).
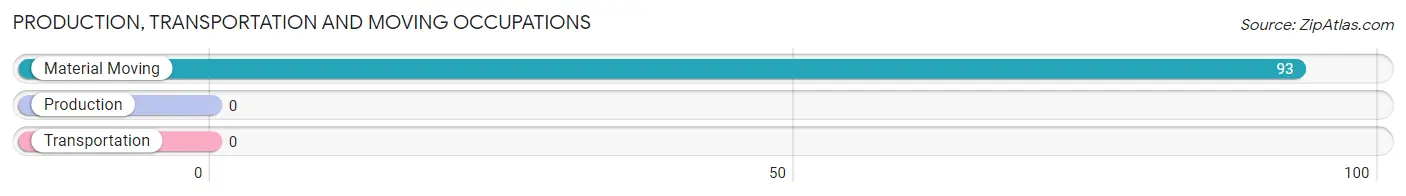
Production, Transportation and Moving Occupations by Sex
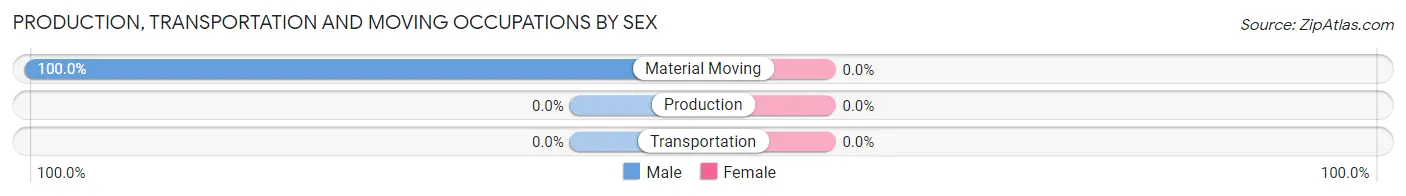
| Occupation | Male | Female |
| Production | 0 (0.0%) | 0 (0.0%) |
| Transportation | 0 (0.0%) | 0 (0.0%) |
| Material Moving | 93 (100.0%) | 0 (0.0%) |
| Total (Category) | 93 (100.0%) | 0 (0.0%) |
| Total (Overall) | 293 (68.8%) | 133 (31.2%) |
Employment Industries by Sex in Seco Mines
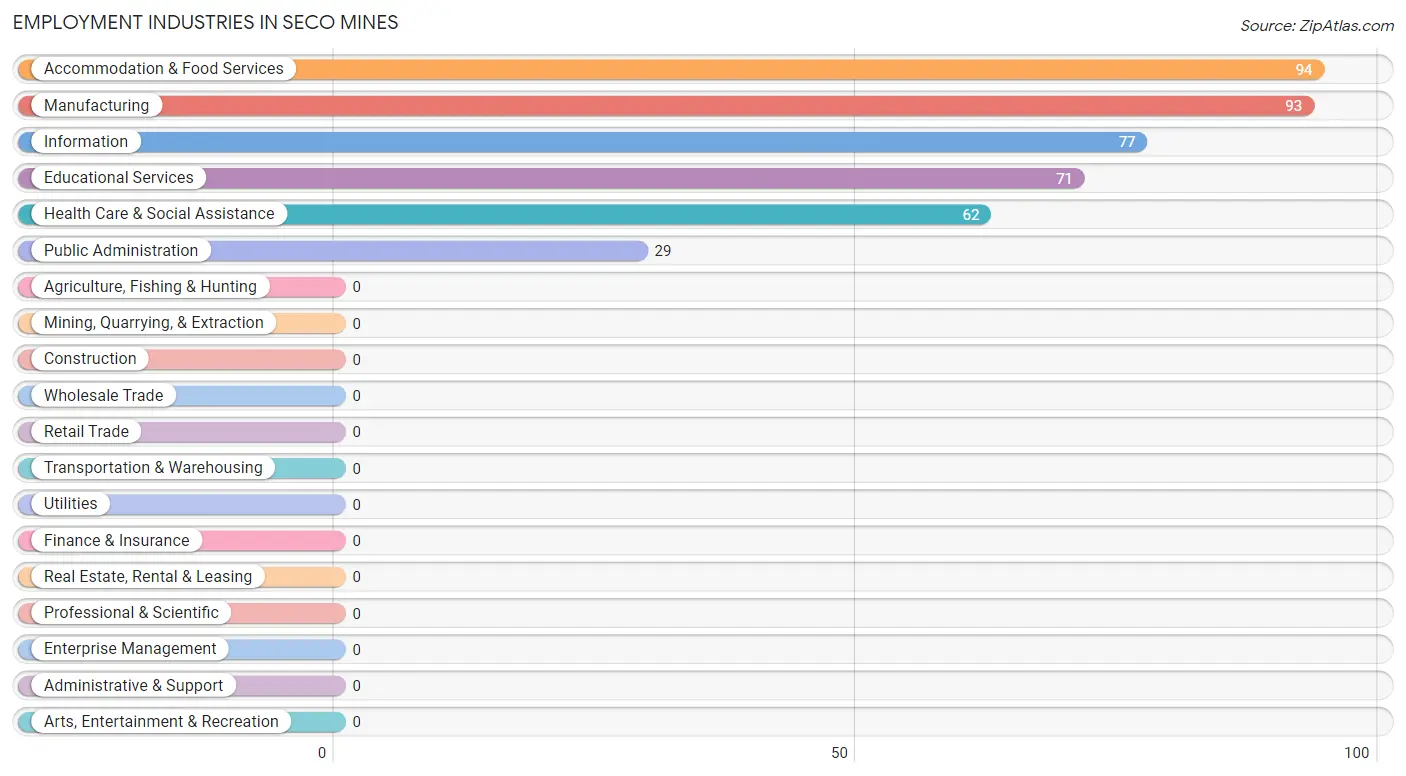
Employment Industries in Seco Mines
The major employment industries in Seco Mines include Accommodation & Food Services (94 | 22.1%), Manufacturing (93 | 21.8%), Information (77 | 18.1%), Educational Services (71 | 16.7%), and Health Care & Social Assistance (62 | 14.5%).
Employment Industries by Sex in Seco Mines
The Seco Mines industries that see more men than women are Manufacturing (100.0%), Information (100.0%), and Accommodation & Food Services (100.0%), whereas the industries that tend to have a higher number of women are Educational Services (100.0%), and Health Care & Social Assistance (100.0%).
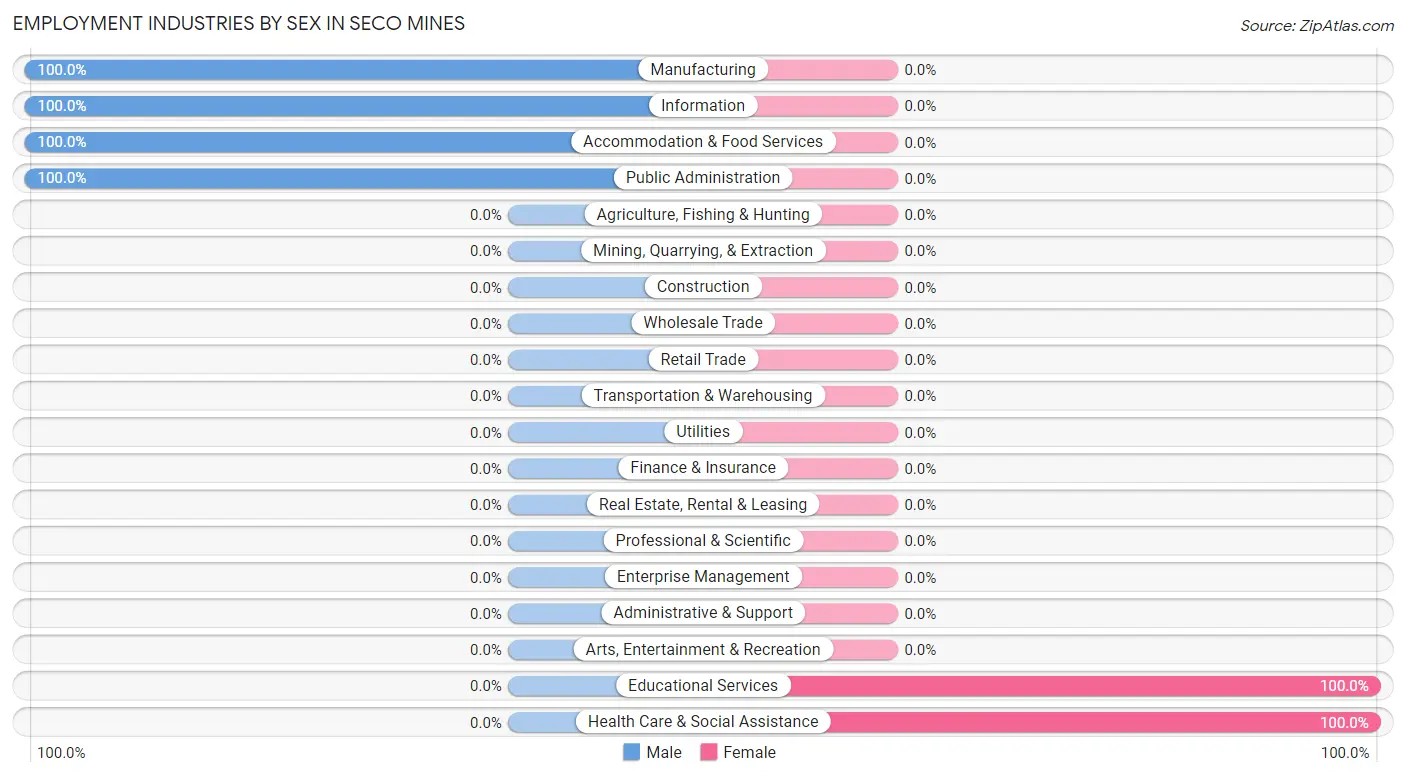
| Industry | Male | Female |
| Agriculture, Fishing & Hunting | 0 (0.0%) | 0 (0.0%) |
| Mining, Quarrying, & Extraction | 0 (0.0%) | 0 (0.0%) |
| Construction | 0 (0.0%) | 0 (0.0%) |
| Manufacturing | 93 (100.0%) | 0 (0.0%) |
| Wholesale Trade | 0 (0.0%) | 0 (0.0%) |
| Retail Trade | 0 (0.0%) | 0 (0.0%) |
| Transportation & Warehousing | 0 (0.0%) | 0 (0.0%) |
| Utilities | 0 (0.0%) | 0 (0.0%) |
| Information | 77 (100.0%) | 0 (0.0%) |
| Finance & Insurance | 0 (0.0%) | 0 (0.0%) |
| Real Estate, Rental & Leasing | 0 (0.0%) | 0 (0.0%) |
| Professional & Scientific | 0 (0.0%) | 0 (0.0%) |
| Enterprise Management | 0 (0.0%) | 0 (0.0%) |
| Administrative & Support | 0 (0.0%) | 0 (0.0%) |
| Educational Services | 0 (0.0%) | 71 (100.0%) |
| Health Care & Social Assistance | 0 (0.0%) | 62 (100.0%) |
| Arts, Entertainment & Recreation | 0 (0.0%) | 0 (0.0%) |
| Accommodation & Food Services | 94 (100.0%) | 0 (0.0%) |
| Public Administration | 29 (100.0%) | 0 (0.0%) |
| Total | 293 (68.8%) | 133 (31.2%) |
Education in Seco Mines
School Enrollment in Seco Mines
The most common levels of schooling among the 516 students in Seco Mines are high school (266 | 51.5%), college / undergraduate (94 | 18.2%), and middle school (69 | 13.4%).
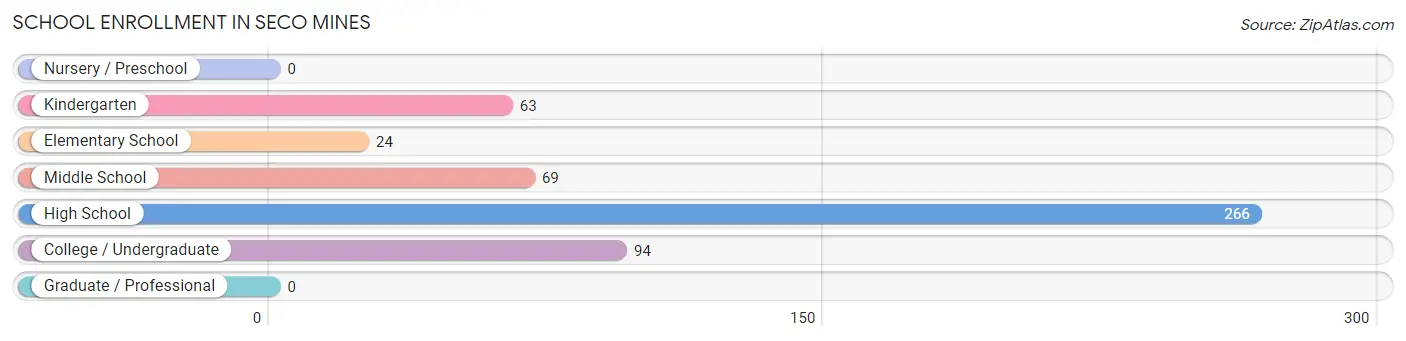
| School Level | # Students | % Students |
| Nursery / Preschool | 0 | 0.0% |
| Kindergarten | 63 | 12.2% |
| Elementary School | 24 | 4.6% |
| Middle School | 69 | 13.4% |
| High School | 266 | 51.5% |
| College / Undergraduate | 94 | 18.2% |
| Graduate / Professional | 0 | 0.0% |
| Total | 516 | 100.0% |
School Enrollment by Age by Funding Source in Seco Mines
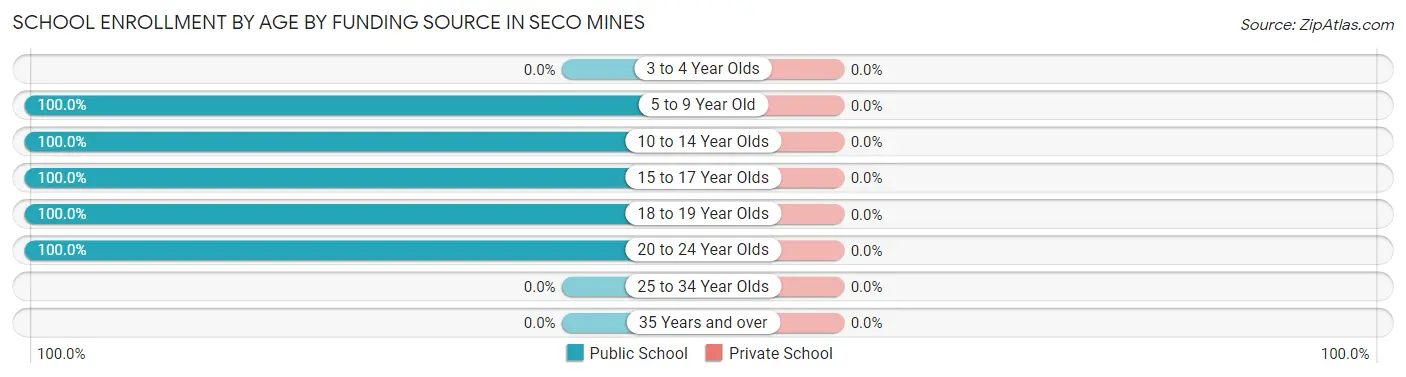
| Age Bracket | Public School | Private School |
| 3 to 4 Year Olds | 0 (0.0%) | 0 (0.0%) |
| 5 to 9 Year Old | 87 (100.0%) | 0 (0.0%) |
| 10 to 14 Year Olds | 24 (100.0%) | 0 (0.0%) |
| 15 to 17 Year Olds | 195 (100.0%) | 0 (0.0%) |
| 18 to 19 Year Olds | 116 (100.0%) | 0 (0.0%) |
| 20 to 24 Year Olds | 94 (100.0%) | 0 (0.0%) |
| 25 to 34 Year Olds | 0 (0.0%) | 0 (0.0%) |
| 35 Years and over | 0 (0.0%) | 0 (0.0%) |
| Total | 516 (100.0%) | 0 (0.0%) |
Educational Attainment by Field of Study in Seco Mines
Business (50 | 70.4%), and multidisciplinary studies (21 | 29.6%) are the most common fields of study among 71 individuals in Seco Mines who have obtained a bachelor's degree or higher.
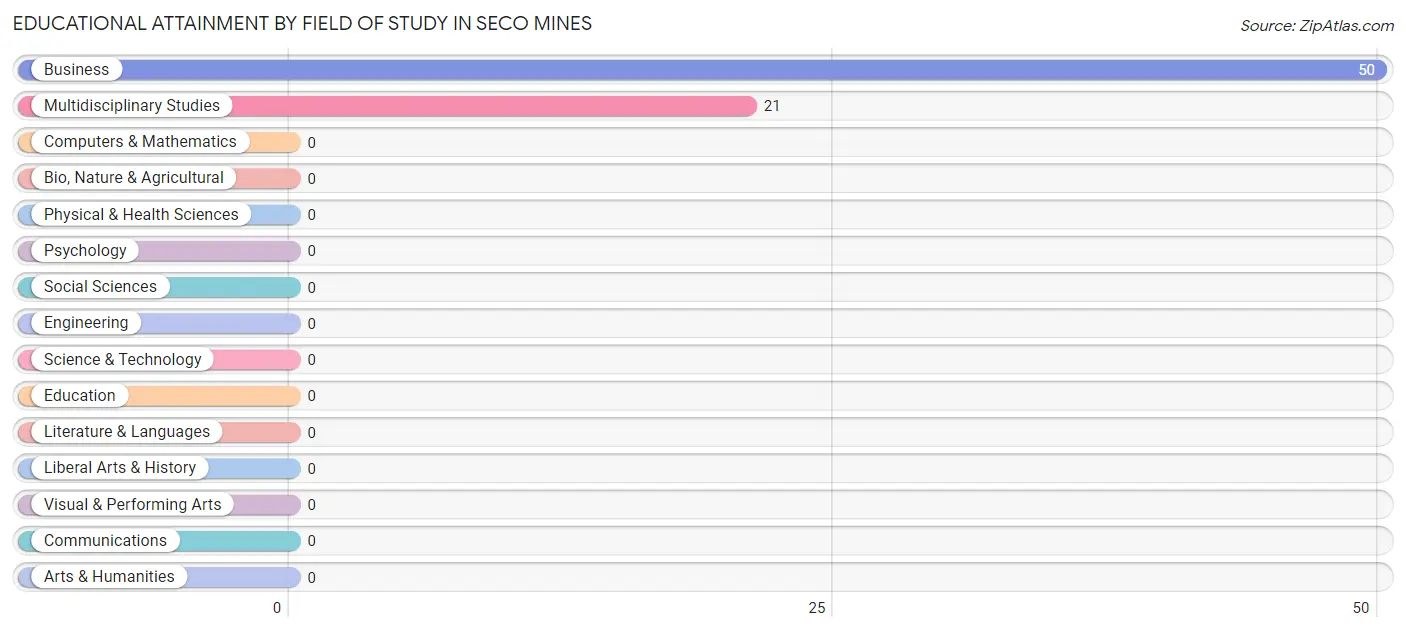
| Field of Study | # Graduates | % Graduates |
| Computers & Mathematics | 0 | 0.0% |
| Bio, Nature & Agricultural | 0 | 0.0% |
| Physical & Health Sciences | 0 | 0.0% |
| Psychology | 0 | 0.0% |
| Social Sciences | 0 | 0.0% |
| Engineering | 0 | 0.0% |
| Multidisciplinary Studies | 21 | 29.6% |
| Science & Technology | 0 | 0.0% |
| Business | 50 | 70.4% |
| Education | 0 | 0.0% |
| Literature & Languages | 0 | 0.0% |
| Liberal Arts & History | 0 | 0.0% |
| Visual & Performing Arts | 0 | 0.0% |
| Communications | 0 | 0.0% |
| Arts & Humanities | 0 | 0.0% |
| Total | 71 | 100.0% |
Transportation & Commute in Seco Mines
Vehicle Availability by Sex in Seco Mines
The most prevalent vehicle ownership categories in Seco Mines are males with 3 vehicles (187, accounting for 63.8%) and females with 3 vehicles (0, making up 140.6%).
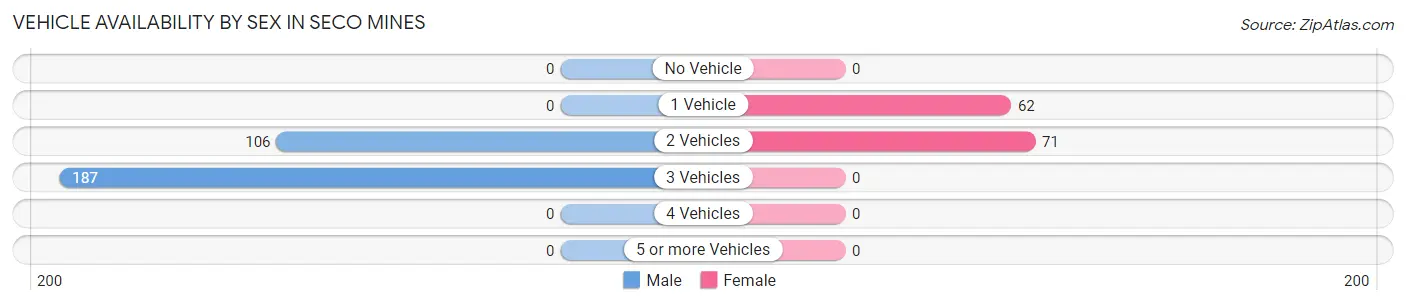
| Vehicles Available | Male | Female |
| No Vehicle | 0 (0.0%) | 0 (0.0%) |
| 1 Vehicle | 0 (0.0%) | 62 (46.6%) |
| 2 Vehicles | 106 (36.2%) | 71 (53.4%) |
| 3 Vehicles | 187 (63.8%) | 0 (0.0%) |
| 4 Vehicles | 0 (0.0%) | 0 (0.0%) |
| 5 or more Vehicles | 0 (0.0%) | 0 (0.0%) |
| Total | 293 (100.0%) | 133 (100.0%) |
Commute Time in Seco Mines
The most frequently occuring commute durations in Seco Mines are 10 to 14 minutes (133 commuters, 31.2%), 25 to 29 minutes (123 commuters, 28.9%), and 15 to 19 minutes (93 commuters, 21.8%).
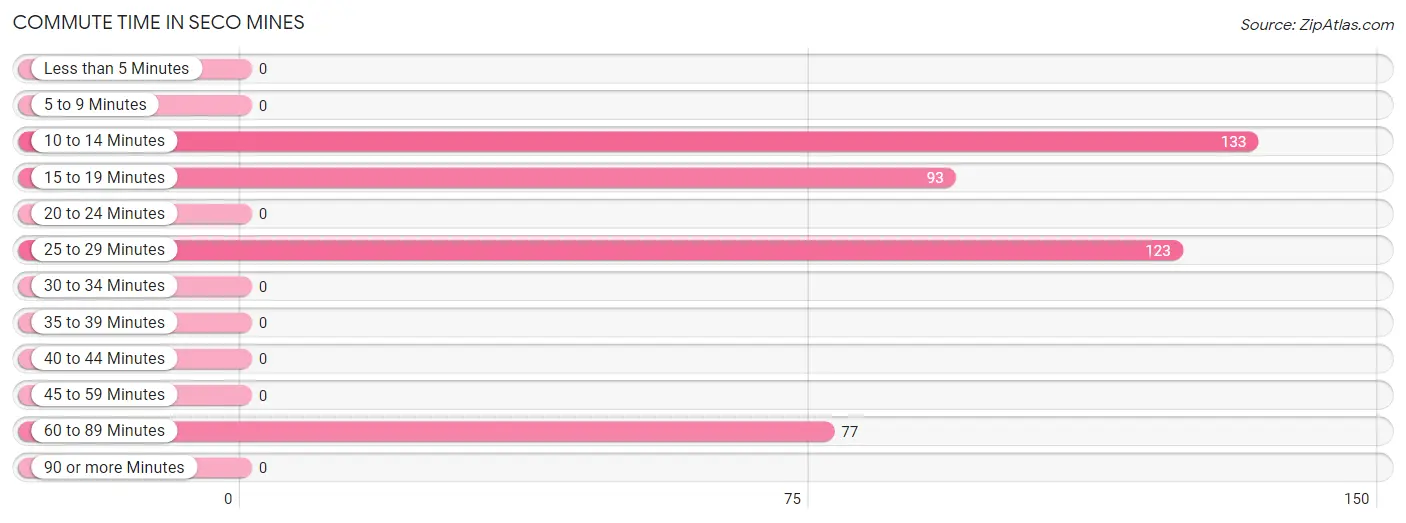
| Commute Time | # Commuters | % Commuters |
| Less than 5 Minutes | 0 | 0.0% |
| 5 to 9 Minutes | 0 | 0.0% |
| 10 to 14 Minutes | 133 | 31.2% |
| 15 to 19 Minutes | 93 | 21.8% |
| 20 to 24 Minutes | 0 | 0.0% |
| 25 to 29 Minutes | 123 | 28.9% |
| 30 to 34 Minutes | 0 | 0.0% |
| 35 to 39 Minutes | 0 | 0.0% |
| 40 to 44 Minutes | 0 | 0.0% |
| 45 to 59 Minutes | 0 | 0.0% |
| 60 to 89 Minutes | 77 | 18.1% |
| 90 or more Minutes | 0 | 0.0% |
Commute Time by Sex in Seco Mines
The most common commute times in Seco Mines are 25 to 29 minutes (123 commuters, 42.0%) for males and 10 to 14 minutes (133 commuters, 100.0%) for females.
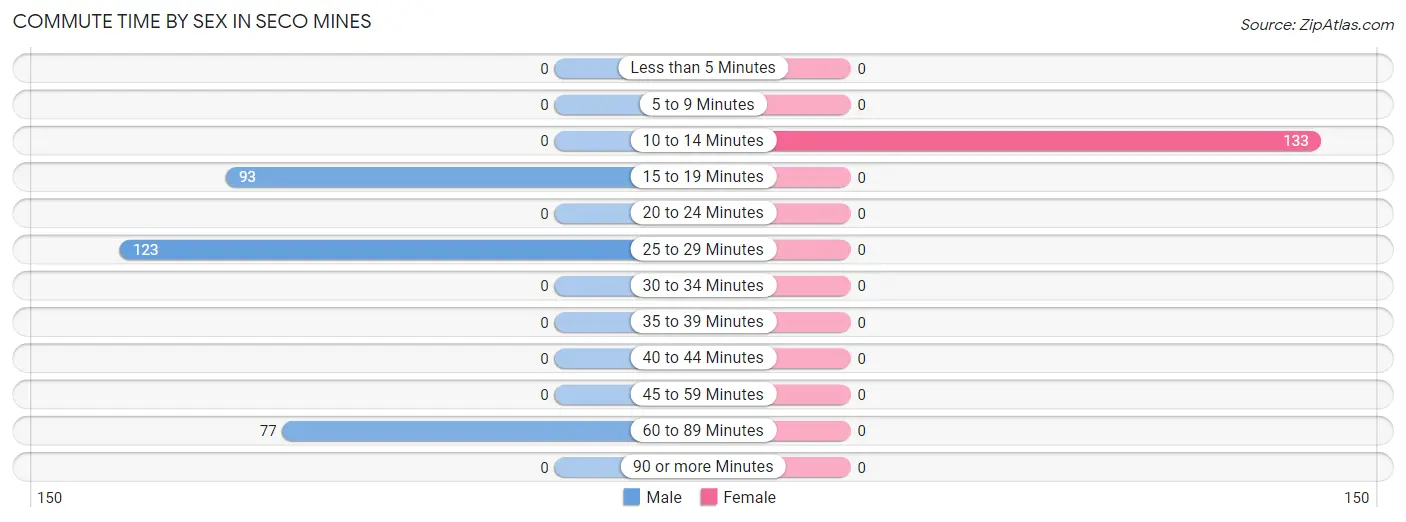
| Commute Time | Male | Female |
| Less than 5 Minutes | 0 (0.0%) | 0 (0.0%) |
| 5 to 9 Minutes | 0 (0.0%) | 0 (0.0%) |
| 10 to 14 Minutes | 0 (0.0%) | 133 (100.0%) |
| 15 to 19 Minutes | 93 (31.7%) | 0 (0.0%) |
| 20 to 24 Minutes | 0 (0.0%) | 0 (0.0%) |
| 25 to 29 Minutes | 123 (42.0%) | 0 (0.0%) |
| 30 to 34 Minutes | 0 (0.0%) | 0 (0.0%) |
| 35 to 39 Minutes | 0 (0.0%) | 0 (0.0%) |
| 40 to 44 Minutes | 0 (0.0%) | 0 (0.0%) |
| 45 to 59 Minutes | 0 (0.0%) | 0 (0.0%) |
| 60 to 89 Minutes | 77 (26.3%) | 0 (0.0%) |
| 90 or more Minutes | 0 (0.0%) | 0 (0.0%) |
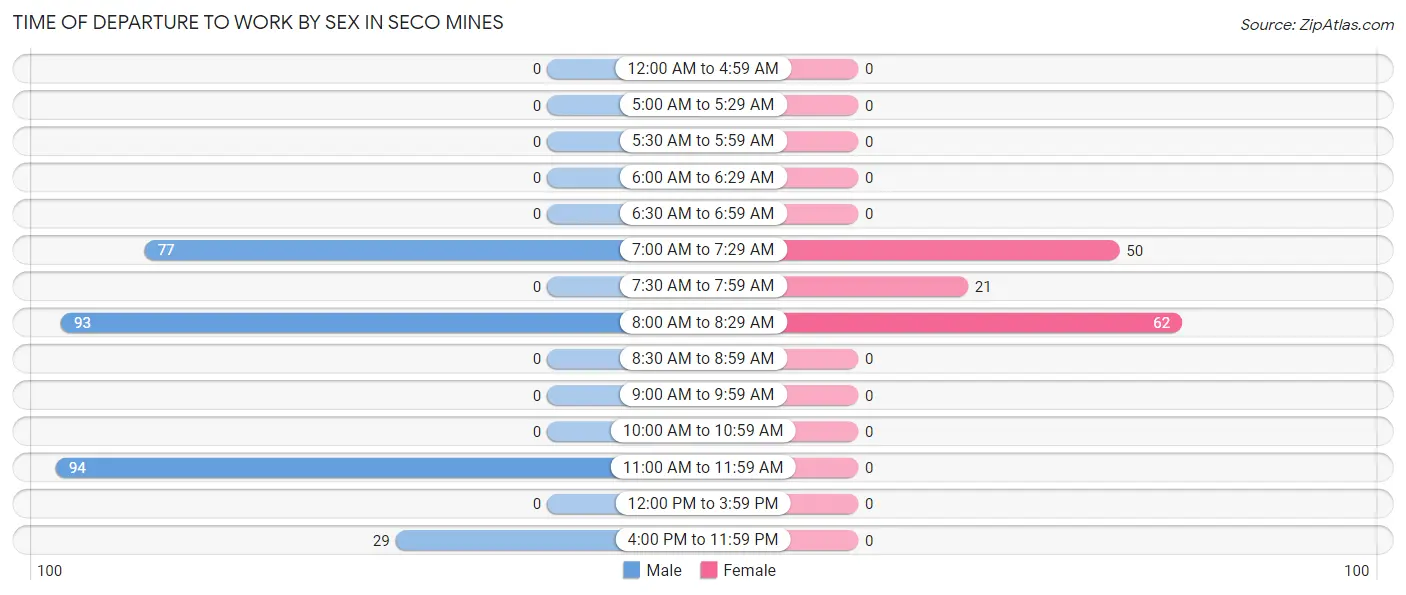
Time of Departure to Work by Sex in Seco Mines
The most frequent times of departure to work in Seco Mines are 11:00 AM to 11:59 AM (94, 32.1%) for males and 8:00 AM to 8:29 AM (62, 46.6%) for females.
| Time of Departure | Male | Female |
| 12:00 AM to 4:59 AM | 0 (0.0%) | 0 (0.0%) |
| 5:00 AM to 5:29 AM | 0 (0.0%) | 0 (0.0%) |
| 5:30 AM to 5:59 AM | 0 (0.0%) | 0 (0.0%) |
| 6:00 AM to 6:29 AM | 0 (0.0%) | 0 (0.0%) |
| 6:30 AM to 6:59 AM | 0 (0.0%) | 0 (0.0%) |
| 7:00 AM to 7:29 AM | 77 (26.3%) | 50 (37.6%) |
| 7:30 AM to 7:59 AM | 0 (0.0%) | 21 (15.8%) |
| 8:00 AM to 8:29 AM | 93 (31.7%) | 62 (46.6%) |
| 8:30 AM to 8:59 AM | 0 (0.0%) | 0 (0.0%) |
| 9:00 AM to 9:59 AM | 0 (0.0%) | 0 (0.0%) |
| 10:00 AM to 10:59 AM | 0 (0.0%) | 0 (0.0%) |
| 11:00 AM to 11:59 AM | 94 (32.1%) | 0 (0.0%) |
| 12:00 PM to 3:59 PM | 0 (0.0%) | 0 (0.0%) |
| 4:00 PM to 11:59 PM | 29 (9.9%) | 0 (0.0%) |
| Total | 293 (100.0%) | 133 (100.0%) |
Housing Occupancy in Seco Mines
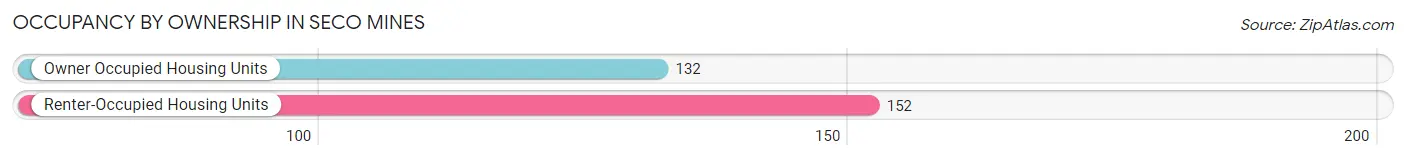
Occupancy by Ownership in Seco Mines
Of the total 284 dwellings in Seco Mines, owner-occupied units account for 132 (46.5%), while renter-occupied units make up 152 (53.5%).
| Occupancy | # Housing Units | % Housing Units |
| Owner Occupied Housing Units | 132 | 46.5% |
| Renter-Occupied Housing Units | 152 | 53.5% |
| Total Occupied Housing Units | 284 | 100.0% |
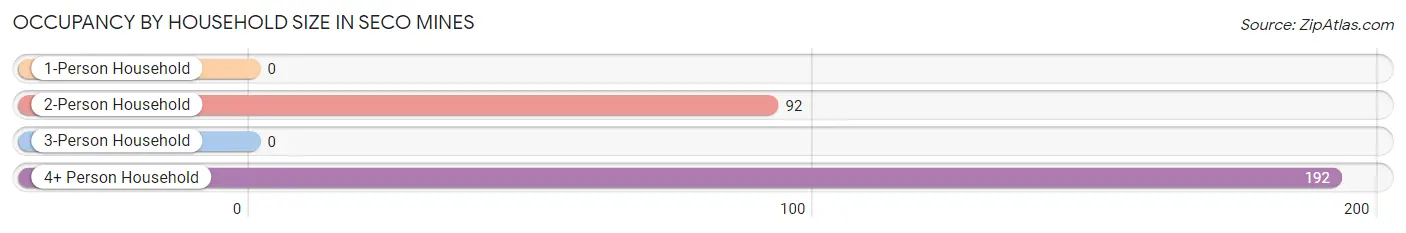
Occupancy by Household Size in Seco Mines
| Household Size | # Housing Units | % Housing Units |
| 1-Person Household | 0 | 0.0% |
| 2-Person Household | 92 | 32.4% |
| 3-Person Household | 0 | 0.0% |
| 4+ Person Household | 192 | 67.6% |
| Total Housing Units | 284 | 100.0% |
Occupancy by Ownership by Household Size in Seco Mines
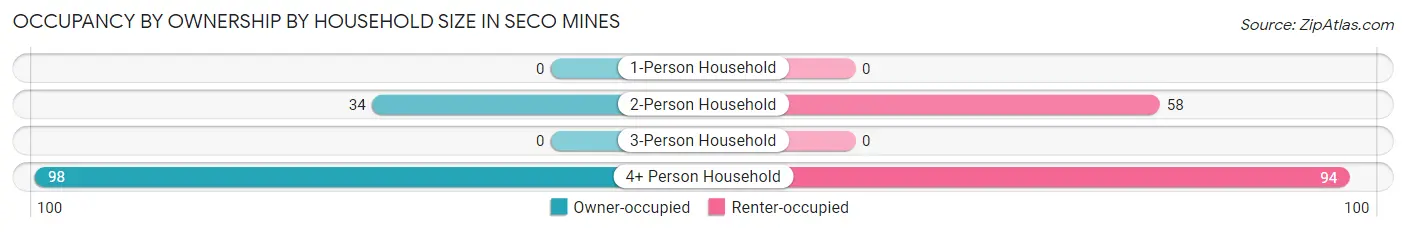
| Household Size | Owner-occupied | Renter-occupied |
| 1-Person Household | 0 (0.0%) | 0 (0.0%) |
| 2-Person Household | 34 (37.0%) | 58 (63.0%) |
| 3-Person Household | 0 (0.0%) | 0 (0.0%) |
| 4+ Person Household | 98 (51.0%) | 94 (49.0%) |
| Total Housing Units | 132 (46.5%) | 152 (53.5%) |
Occupancy by Educational Attainment in Seco Mines
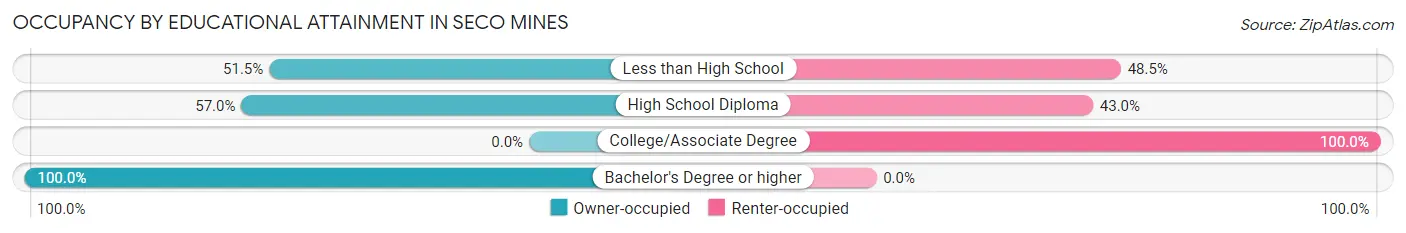
| Household Size | Owner-occupied | Renter-occupied |
| Less than High School | 34 (51.5%) | 32 (48.5%) |
| High School Diploma | 77 (57.0%) | 58 (43.0%) |
| College/Associate Degree | 0 (0.0%) | 62 (100.0%) |
| Bachelor's Degree or higher | 21 (100.0%) | 0 (0.0%) |
Occupancy by Age of Householder in Seco Mines
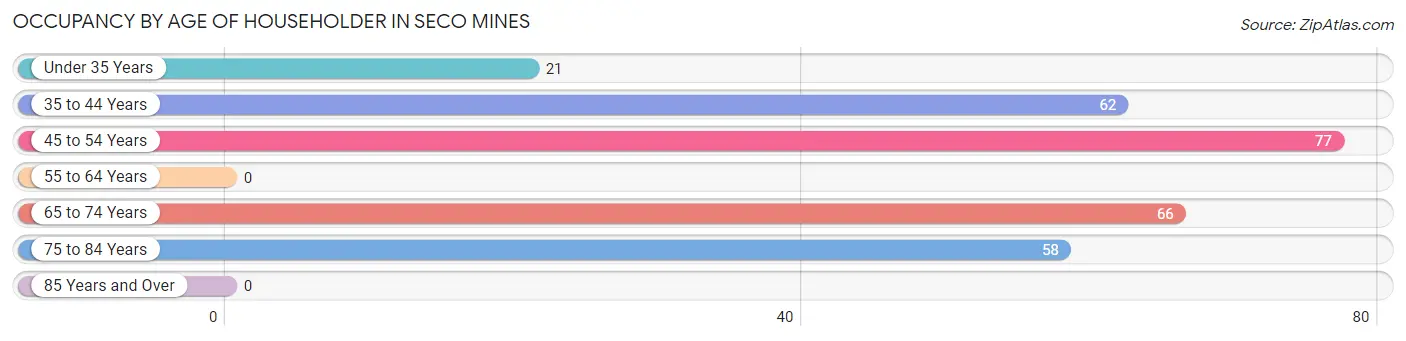
| Age Bracket | # Households | % Households |
| Under 35 Years | 21 | 7.4% |
| 35 to 44 Years | 62 | 21.8% |
| 45 to 54 Years | 77 | 27.1% |
| 55 to 64 Years | 0 | 0.0% |
| 65 to 74 Years | 66 | 23.2% |
| 75 to 84 Years | 58 | 20.4% |
| 85 Years and Over | 0 | 0.0% |
| Total | 284 | 100.0% |
Housing Finances in Seco Mines
Median Income by Occupancy in Seco Mines
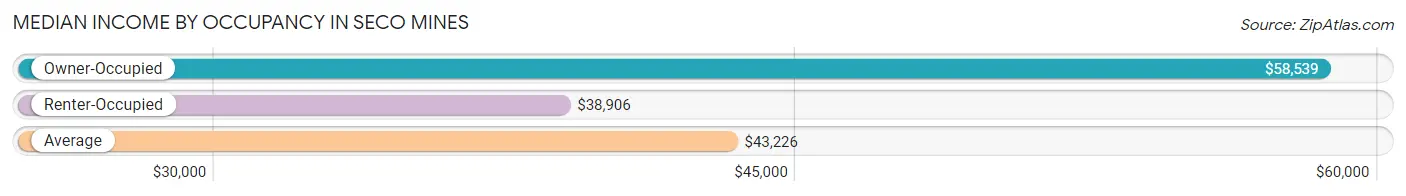
| Occupancy Type | # Households | Median Income |
| Owner-Occupied | 132 (46.5%) | $58,539 |
| Renter-Occupied | 152 (53.5%) | $38,906 |
| Average | 284 (100.0%) | $43,226 |
Occupancy by Householder Income Bracket in Seco Mines
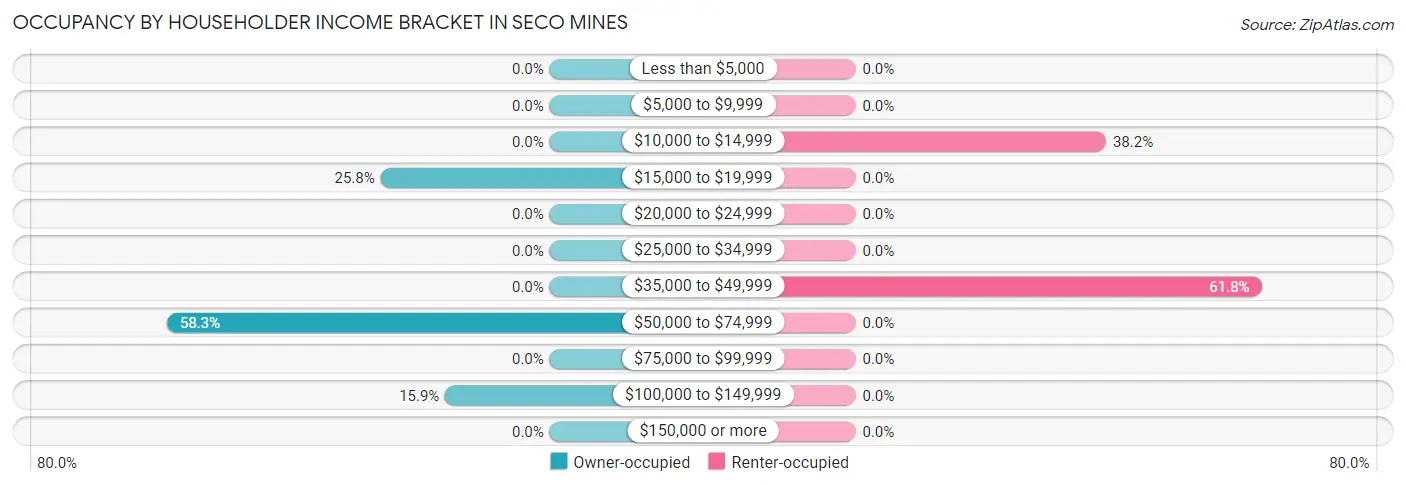
| Income Bracket | Owner-occupied | Renter-occupied |
| Less than $5,000 | 0 (0.0%) | 0 (0.0%) |
| $5,000 to $9,999 | 0 (0.0%) | 0 (0.0%) |
| $10,000 to $14,999 | 0 (0.0%) | 58 (38.2%) |
| $15,000 to $19,999 | 34 (25.8%) | 0 (0.0%) |
| $20,000 to $24,999 | 0 (0.0%) | 0 (0.0%) |
| $25,000 to $34,999 | 0 (0.0%) | 0 (0.0%) |
| $35,000 to $49,999 | 0 (0.0%) | 94 (61.8%) |
| $50,000 to $74,999 | 77 (58.3%) | 0 (0.0%) |
| $75,000 to $99,999 | 0 (0.0%) | 0 (0.0%) |
| $100,000 to $149,999 | 21 (15.9%) | 0 (0.0%) |
| $150,000 or more | 0 (0.0%) | 0 (0.0%) |
| Total | 132 (100.0%) | 152 (100.0%) |
Monthly Housing Cost Tiers in Seco Mines
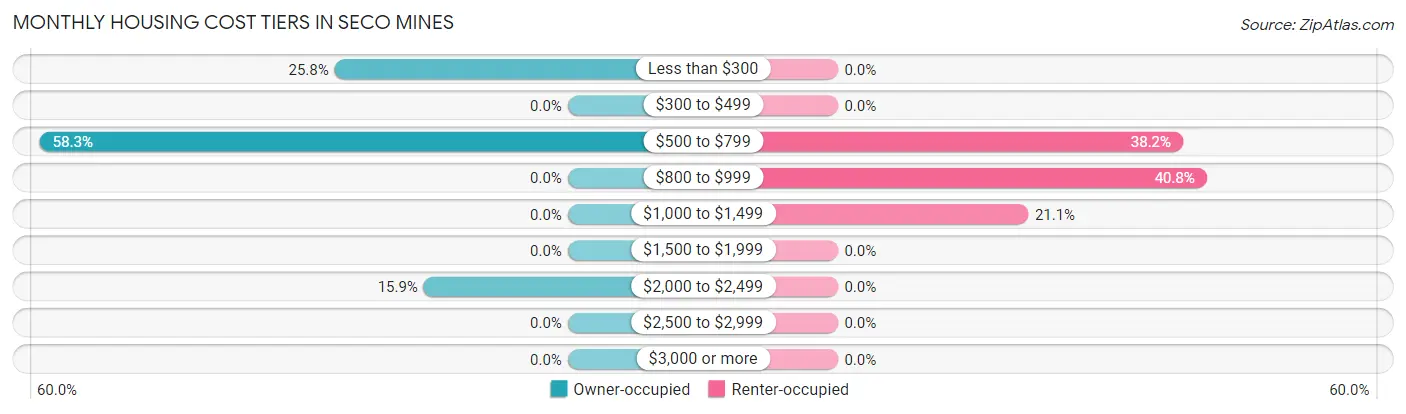
| Monthly Cost | Owner-occupied | Renter-occupied |
| Less than $300 | 34 (25.8%) | 0 (0.0%) |
| $300 to $499 | 0 (0.0%) | 0 (0.0%) |
| $500 to $799 | 77 (58.3%) | 58 (38.2%) |
| $800 to $999 | 0 (0.0%) | 62 (40.8%) |
| $1,000 to $1,499 | 0 (0.0%) | 32 (21.0%) |
| $1,500 to $1,999 | 0 (0.0%) | 0 (0.0%) |
| $2,000 to $2,499 | 21 (15.9%) | 0 (0.0%) |
| $2,500 to $2,999 | 0 (0.0%) | 0 (0.0%) |
| $3,000 or more | 0 (0.0%) | 0 (0.0%) |
| Total | 132 (100.0%) | 152 (100.0%) |
Physical Housing Characteristics in Seco Mines
Housing Structures in Seco Mines
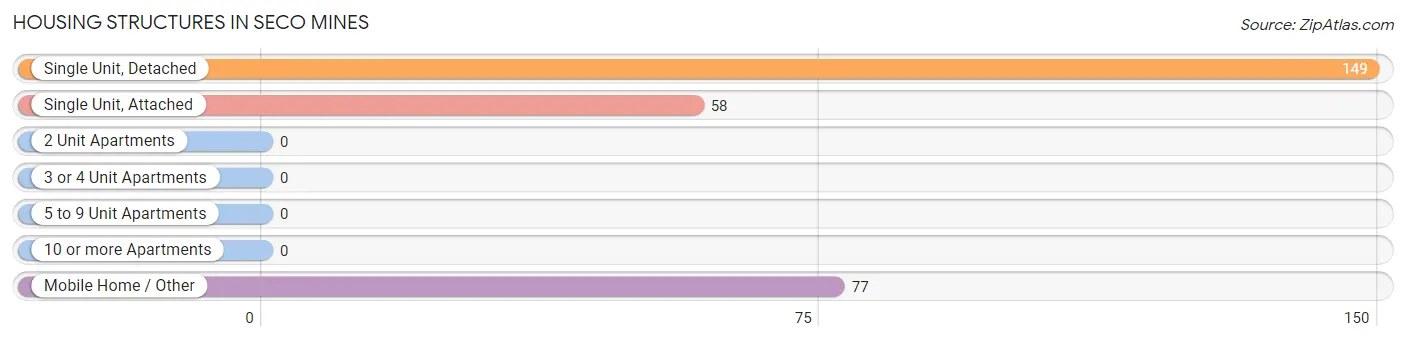
| Structure Type | # Housing Units | % Housing Units |
| Single Unit, Detached | 149 | 52.5% |
| Single Unit, Attached | 58 | 20.4% |
| 2 Unit Apartments | 0 | 0.0% |
| 3 or 4 Unit Apartments | 0 | 0.0% |
| 5 to 9 Unit Apartments | 0 | 0.0% |
| 10 or more Apartments | 0 | 0.0% |
| Mobile Home / Other | 77 | 27.1% |
| Total | 284 | 100.0% |
Housing Structures by Occupancy in Seco Mines
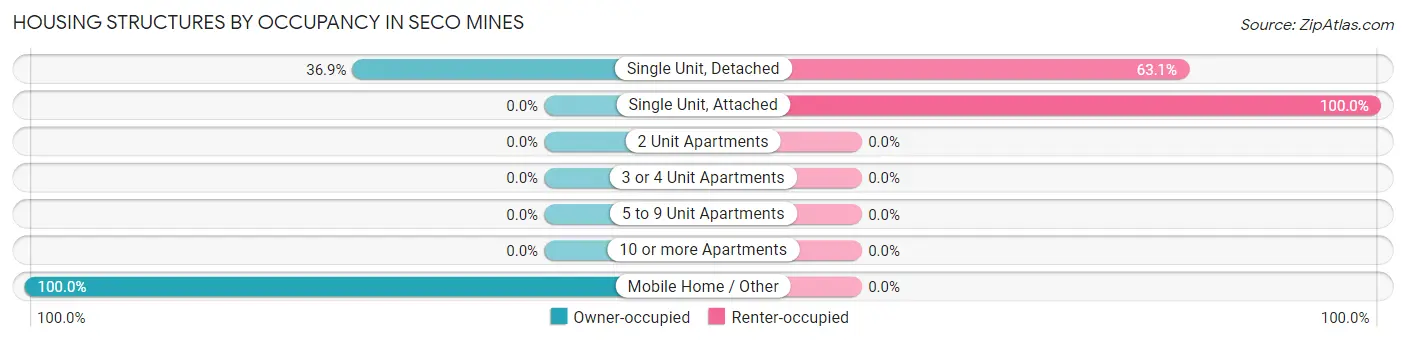
| Structure Type | Owner-occupied | Renter-occupied |
| Single Unit, Detached | 55 (36.9%) | 94 (63.1%) |
| Single Unit, Attached | 0 (0.0%) | 58 (100.0%) |
| 2 Unit Apartments | 0 (0.0%) | 0 (0.0%) |
| 3 or 4 Unit Apartments | 0 (0.0%) | 0 (0.0%) |
| 5 to 9 Unit Apartments | 0 (0.0%) | 0 (0.0%) |
| 10 or more Apartments | 0 (0.0%) | 0 (0.0%) |
| Mobile Home / Other | 77 (100.0%) | 0 (0.0%) |
| Total | 132 (46.5%) | 152 (53.5%) |
Housing Structures by Number of Rooms in Seco Mines
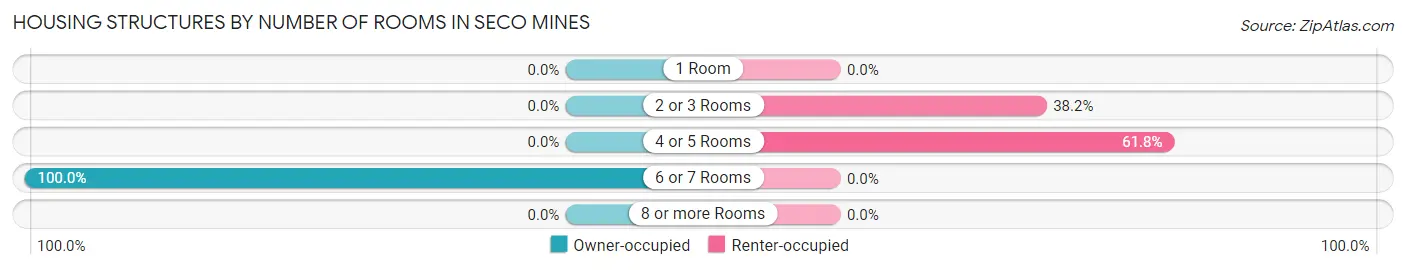
| Number of Rooms | Owner-occupied | Renter-occupied |
| 1 Room | 0 (0.0%) | 0 (0.0%) |
| 2 or 3 Rooms | 0 (0.0%) | 58 (38.2%) |
| 4 or 5 Rooms | 0 (0.0%) | 94 (61.8%) |
| 6 or 7 Rooms | 132 (100.0%) | 0 (0.0%) |
| 8 or more Rooms | 0 (0.0%) | 0 (0.0%) |
| Total | 132 (100.0%) | 152 (100.0%) |
Housing Structure by Heating Type in Seco Mines
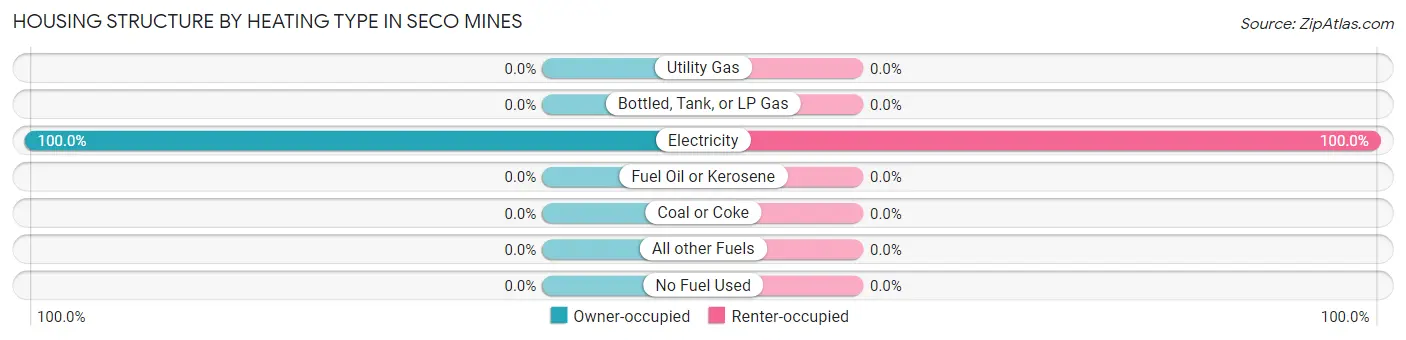
| Heating Type | Owner-occupied | Renter-occupied |
| Utility Gas | 0 (0.0%) | 0 (0.0%) |
| Bottled, Tank, or LP Gas | 0 (0.0%) | 0 (0.0%) |
| Electricity | 132 (100.0%) | 152 (100.0%) |
| Fuel Oil or Kerosene | 0 (0.0%) | 0 (0.0%) |
| Coal or Coke | 0 (0.0%) | 0 (0.0%) |
| All other Fuels | 0 (0.0%) | 0 (0.0%) |
| No Fuel Used | 0 (0.0%) | 0 (0.0%) |
| Total | 132 (100.0%) | 152 (100.0%) |
Household Vehicle Usage in Seco Mines
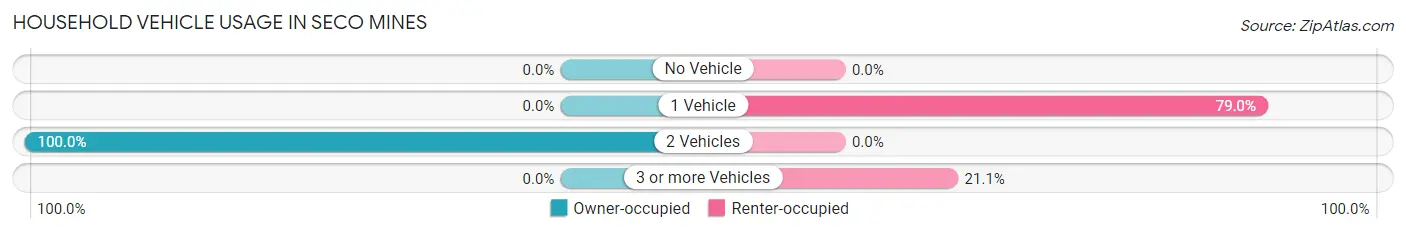
| Vehicles per Household | Owner-occupied | Renter-occupied |
| No Vehicle | 0 (0.0%) | 0 (0.0%) |
| 1 Vehicle | 0 (0.0%) | 120 (78.9%) |
| 2 Vehicles | 132 (100.0%) | 0 (0.0%) |
| 3 or more Vehicles | 0 (0.0%) | 32 (21.0%) |
| Total | 132 (100.0%) | 152 (100.0%) |
Real Estate & Mortgages in Seco Mines
Real Estate and Mortgage Overview in Seco Mines
| Characteristic | Without Mortgage | With Mortgage |
| Housing Units | 34 | 98 |
| Median Property Value | - | - |
| Median Household Income | - | - |
| Monthly Housing Costs | - | - |
| Real Estate Taxes | - | - |
Property Value by Mortgage Status in Seco Mines
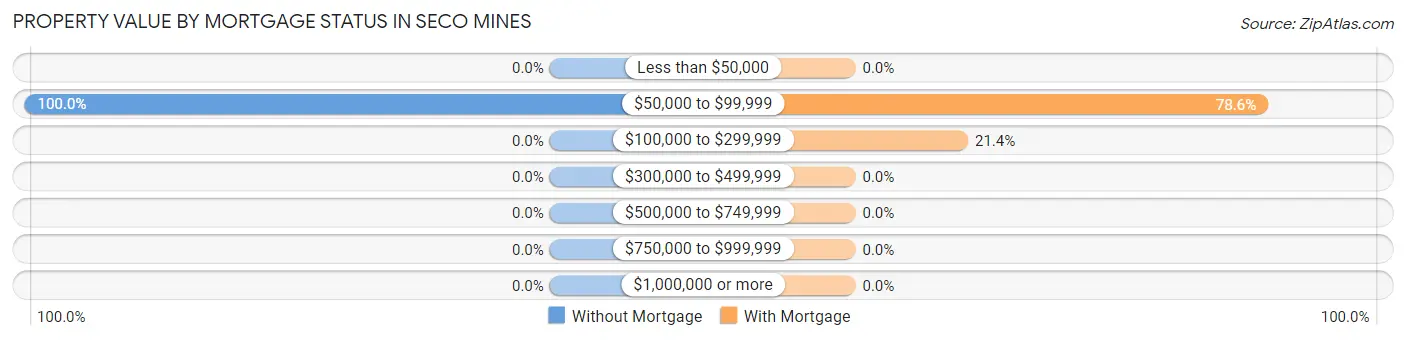
| Property Value | Without Mortgage | With Mortgage |
| Less than $50,000 | 0 (0.0%) | 0 (0.0%) |
| $50,000 to $99,999 | 34 (100.0%) | 77 (78.6%) |
| $100,000 to $299,999 | 0 (0.0%) | 21 (21.4%) |
| $300,000 to $499,999 | 0 (0.0%) | 0 (0.0%) |
| $500,000 to $749,999 | 0 (0.0%) | 0 (0.0%) |
| $750,000 to $999,999 | 0 (0.0%) | 0 (0.0%) |
| $1,000,000 or more | 0 (0.0%) | 0 (0.0%) |
| Total | 34 (100.0%) | 98 (100.0%) |
Household Income by Mortgage Status in Seco Mines
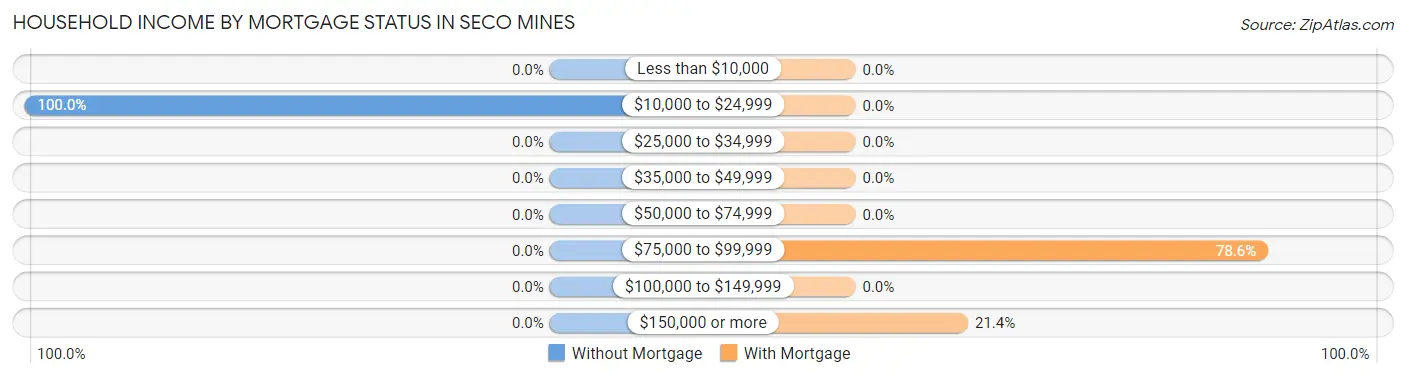
| Household Income | Without Mortgage | With Mortgage |
| Less than $10,000 | 0 (0.0%) | 0 (0.0%) |
| $10,000 to $24,999 | 34 (100.0%) | 0 (0.0%) |
| $25,000 to $34,999 | 0 (0.0%) | 0 (0.0%) |
| $35,000 to $49,999 | 0 (0.0%) | 0 (0.0%) |
| $50,000 to $74,999 | 0 (0.0%) | 0 (0.0%) |
| $75,000 to $99,999 | 0 (0.0%) | 77 (78.6%) |
| $100,000 to $149,999 | 0 (0.0%) | 0 (0.0%) |
| $150,000 or more | 0 (0.0%) | 21 (21.4%) |
| Total | 34 (100.0%) | 98 (100.0%) |
Property Value to Household Income Ratio in Seco Mines
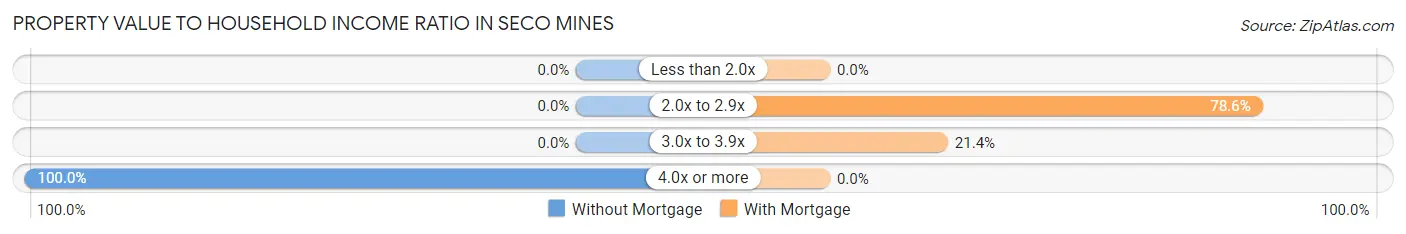
| Value-to-Income Ratio | Without Mortgage | With Mortgage |
| Less than 2.0x | 0 (0.0%) | 0 (0.0%) |
| 2.0x to 2.9x | 0 (0.0%) | 77 (78.6%) |
| 3.0x to 3.9x | 0 (0.0%) | 21 (21.4%) |
| 4.0x or more | 34 (100.0%) | 0 (0.0%) |
| Total | 34 (100.0%) | 98 (100.0%) |
Real Estate Taxes by Mortgage Status in Seco Mines
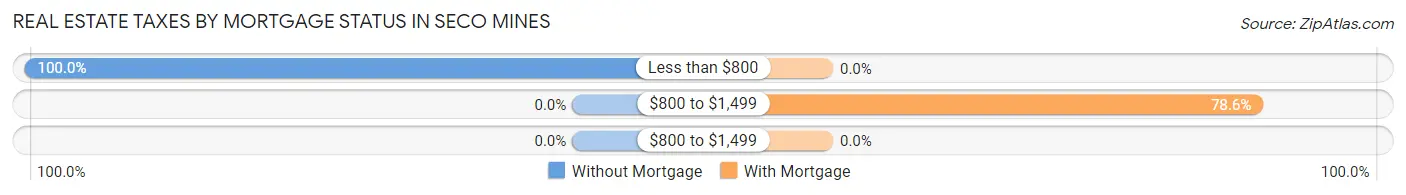
| Property Taxes | Without Mortgage | With Mortgage |
| Less than $800 | 34 (100.0%) | 0 (0.0%) |
| $800 to $1,499 | 0 (0.0%) | 77 (78.6%) |
| $800 to $1,499 | 0 (0.0%) | 0 (0.0%) |
| Total | 34 (100.0%) | 98 (100.0%) |
Health & Disability in Seco Mines
Health Insurance Coverage by Age in Seco Mines
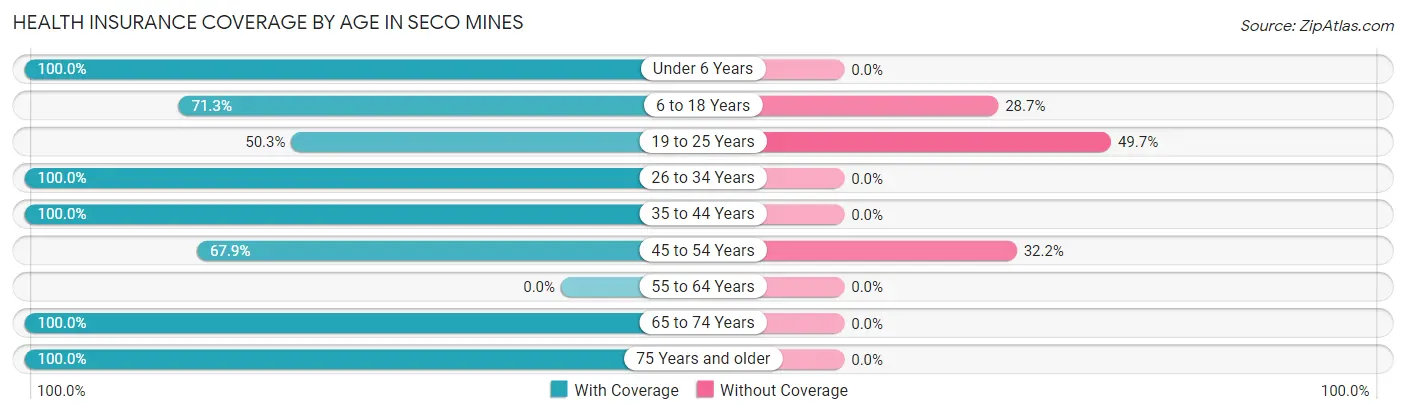
| Age Bracket | With Coverage | Without Coverage |
| Under 6 Years | 94 (100.0%) | 0 (0.0%) |
| 6 to 18 Years | 293 (71.3%) | 118 (28.7%) |
| 19 to 25 Years | 94 (50.3%) | 93 (49.7%) |
| 26 to 34 Years | 50 (100.0%) | 0 (0.0%) |
| 35 to 44 Years | 62 (100.0%) | 0 (0.0%) |
| 45 to 54 Years | 211 (67.8%) | 100 (32.2%) |
| 55 to 64 Years | 0 (0.0%) | 0 (0.0%) |
| 65 to 74 Years | 101 (100.0%) | 0 (0.0%) |
| 75 Years and older | 58 (100.0%) | 0 (0.0%) |
| Total | 963 (75.6%) | 311 (24.4%) |
Health Insurance Coverage by Citizenship Status in Seco Mines
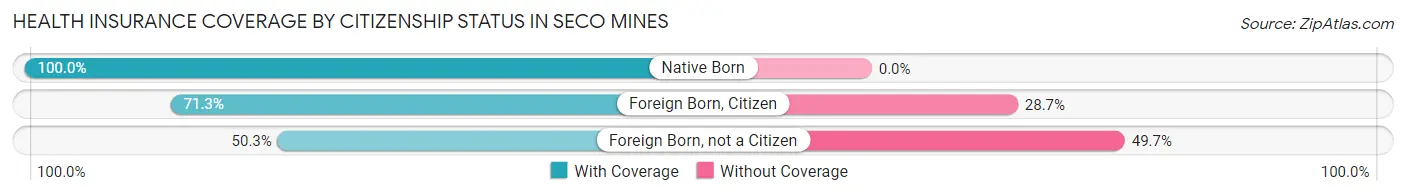
| Citizenship Status | With Coverage | Without Coverage |
| Native Born | 94 (100.0%) | 0 (0.0%) |
| Foreign Born, Citizen | 293 (71.3%) | 118 (28.7%) |
| Foreign Born, not a Citizen | 94 (50.3%) | 93 (49.7%) |
Health Insurance Coverage by Household Income in Seco Mines
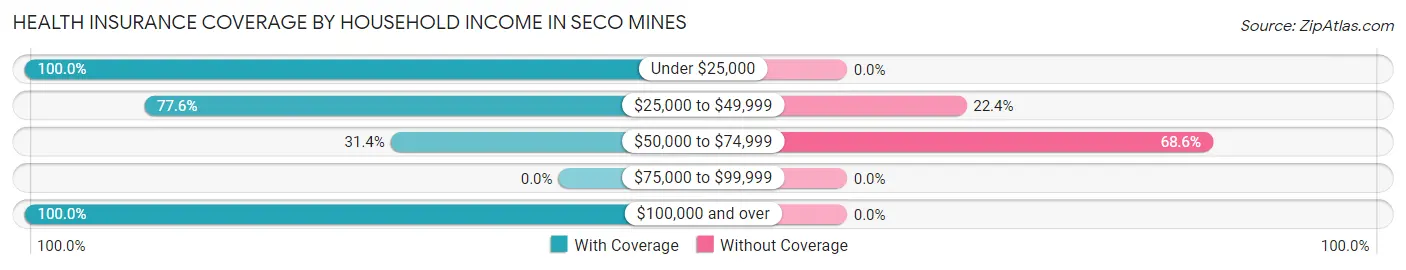
| Household Income | With Coverage | Without Coverage |
| Under $25,000 | 261 (100.0%) | 0 (0.0%) |
| $25,000 to $49,999 | 496 (77.6%) | 143 (22.4%) |
| $50,000 to $74,999 | 77 (31.4%) | 168 (68.6%) |
| $75,000 to $99,999 | 0 (0.0%) | 0 (0.0%) |
| $100,000 and over | 129 (100.0%) | 0 (0.0%) |
Public vs Private Health Insurance Coverage by Age in Seco Mines
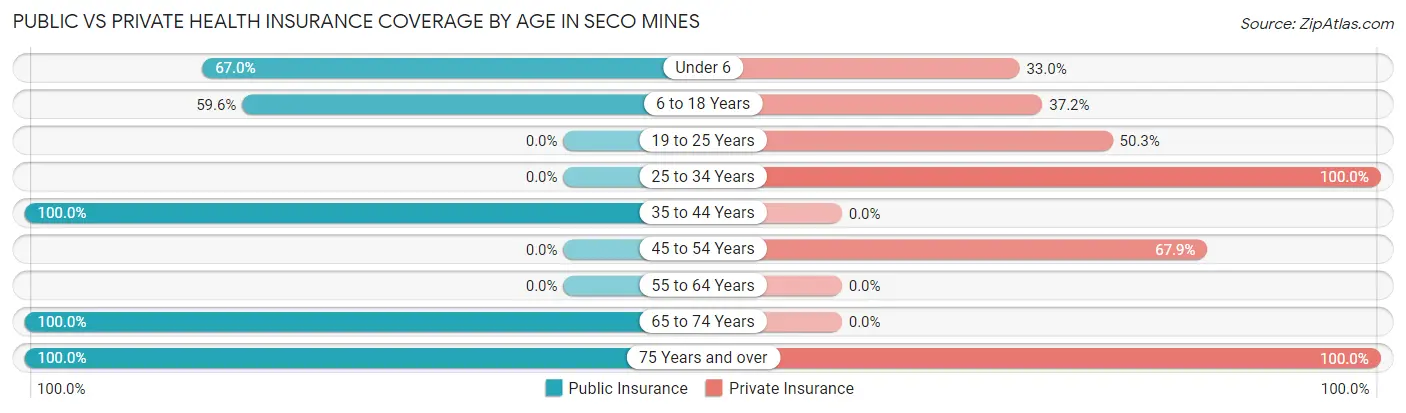
| Age Bracket | Public Insurance | Private Insurance |
| Under 6 | 63 (67.0%) | 31 (33.0%) |
| 6 to 18 Years | 245 (59.6%) | 153 (37.2%) |
| 19 to 25 Years | 0 (0.0%) | 94 (50.3%) |
| 25 to 34 Years | 0 (0.0%) | 50 (100.0%) |
| 35 to 44 Years | 62 (100.0%) | 0 (0.0%) |
| 45 to 54 Years | 0 (0.0%) | 211 (67.8%) |
| 55 to 64 Years | 0 (0.0%) | 0 (0.0%) |
| 65 to 74 Years | 101 (100.0%) | 0 (0.0%) |
| 75 Years and over | 58 (100.0%) | 58 (100.0%) |
| Total | 529 (41.5%) | 597 (46.9%) |
Disability Status by Sex by Age in Seco Mines
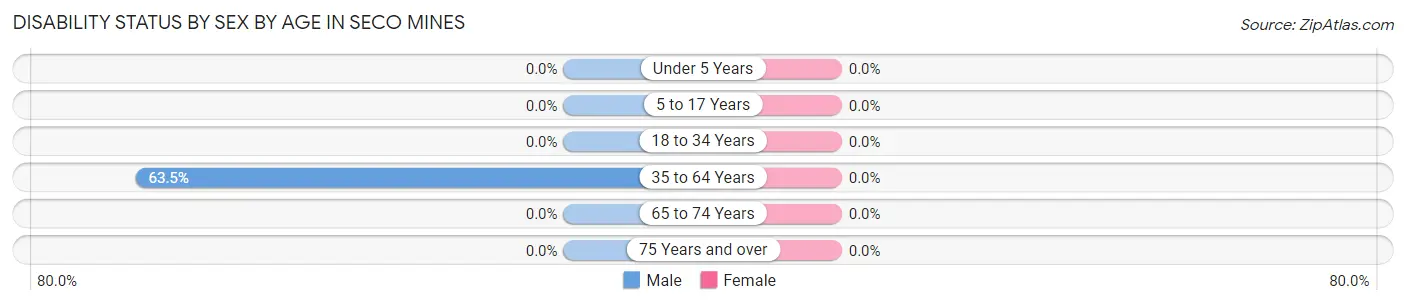
| Age Bracket | Male | Female |
| Under 5 Years | 0 (0.0%) | 0 (0.0%) |
| 5 to 17 Years | 0 (0.0%) | 0 (0.0%) |
| 18 to 34 Years | 0 (0.0%) | 0 (0.0%) |
| 35 to 64 Years | 134 (63.5%) | 0 (0.0%) |
| 65 to 74 Years | 0 (0.0%) | 0 (0.0%) |
| 75 Years and over | 0 (0.0%) | 0 (0.0%) |
Disability Class by Sex by Age in Seco Mines
Disability Class: Hearing Difficulty
| Age Bracket | Male | Female |
| Under 5 Years | 0 (0.0%) | 0 (0.0%) |
| 5 to 17 Years | 0 (0.0%) | 0 (0.0%) |
| 18 to 34 Years | 0 (0.0%) | 0 (0.0%) |
| 35 to 64 Years | 0 (0.0%) | 0 (0.0%) |
| 65 to 74 Years | 0 (0.0%) | 0 (0.0%) |
| 75 Years and over | 0 (0.0%) | 0 (0.0%) |
Disability Class: Vision Difficulty
| Age Bracket | Male | Female |
| Under 5 Years | 0 (0.0%) | 0 (0.0%) |
| 5 to 17 Years | 0 (0.0%) | 0 (0.0%) |
| 18 to 34 Years | 0 (0.0%) | 0 (0.0%) |
| 35 to 64 Years | 0 (0.0%) | 0 (0.0%) |
| 65 to 74 Years | 0 (0.0%) | 0 (0.0%) |
| 75 Years and over | 0 (0.0%) | 0 (0.0%) |
Disability Class: Cognitive Difficulty
| Age Bracket | Male | Female |
| 5 to 17 Years | 0 (0.0%) | 0 (0.0%) |
| 18 to 34 Years | 0 (0.0%) | 0 (0.0%) |
| 35 to 64 Years | 0 (0.0%) | 0 (0.0%) |
| 65 to 74 Years | 0 (0.0%) | 0 (0.0%) |
| 75 Years and over | 0 (0.0%) | 0 (0.0%) |
Disability Class: Ambulatory Difficulty
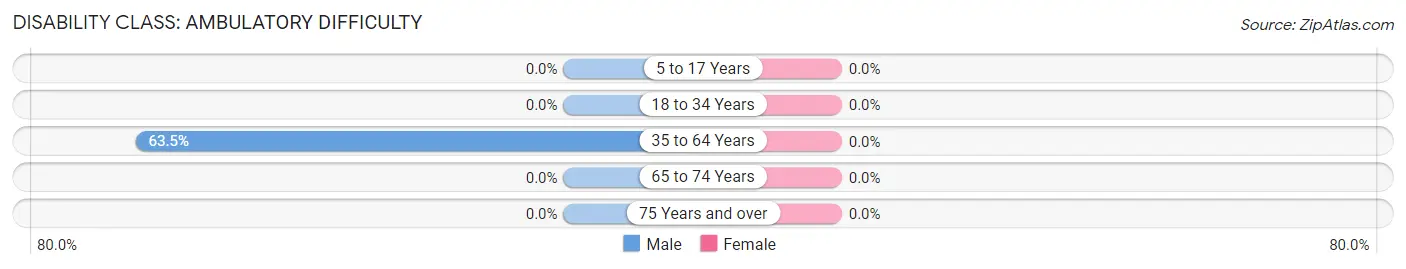
| Age Bracket | Male | Female |
| 5 to 17 Years | 0 (0.0%) | 0 (0.0%) |
| 18 to 34 Years | 0 (0.0%) | 0 (0.0%) |
| 35 to 64 Years | 134 (63.5%) | 0 (0.0%) |
| 65 to 74 Years | 0 (0.0%) | 0 (0.0%) |
| 75 Years and over | 0 (0.0%) | 0 (0.0%) |
Disability Class: Self-Care Difficulty
| Age Bracket | Male | Female |
| 5 to 17 Years | 0 (0.0%) | 0 (0.0%) |
| 18 to 34 Years | 0 (0.0%) | 0 (0.0%) |
| 35 to 64 Years | 0 (0.0%) | 0 (0.0%) |
| 65 to 74 Years | 0 (0.0%) | 0 (0.0%) |
| 75 Years and over | 0 (0.0%) | 0 (0.0%) |
Technology Access in Seco Mines
Computing Device Access in Seco Mines
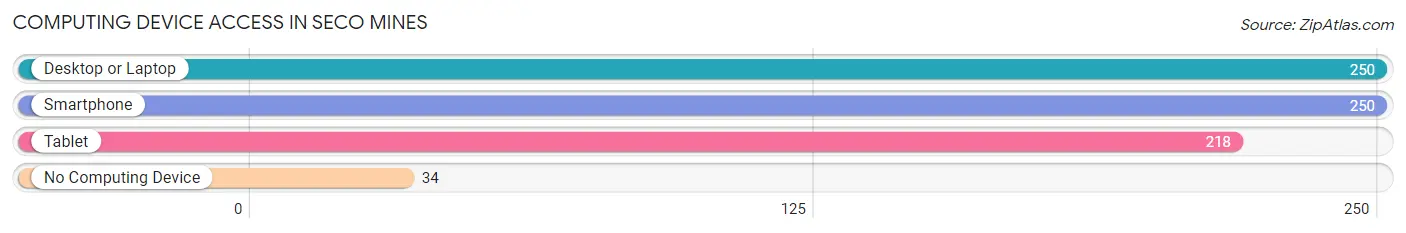
| Device Type | # Households | % Households |
| Desktop or Laptop | 250 | 88.0% |
| Smartphone | 250 | 88.0% |
| Tablet | 218 | 76.8% |
| No Computing Device | 34 | 12.0% |
| Total | 284 | 100.0% |
Internet Access in Seco Mines
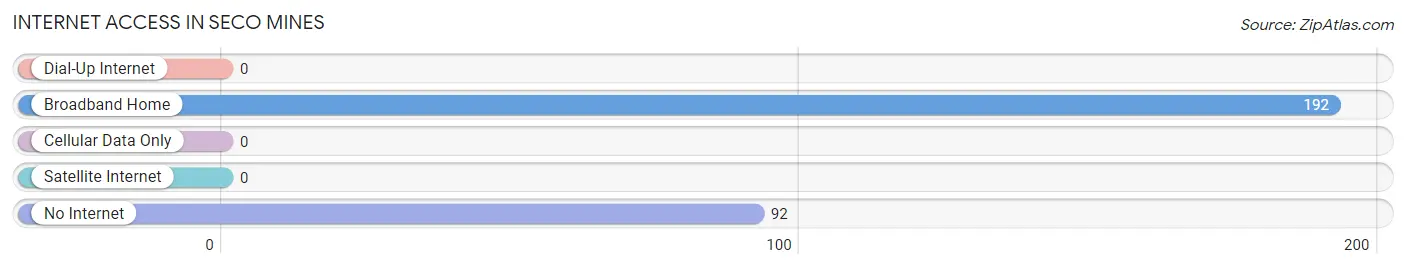
| Internet Type | # Households | % Households |
| Dial-Up Internet | 0 | 0.0% |
| Broadband Home | 192 | 67.6% |
| Cellular Data Only | 0 | 0.0% |
| Satellite Internet | 0 | 0.0% |
| No Internet | 92 | 32.4% |
| Total | 284 | 100.0% |
Seco Mines Summary
Seco Mines, Texas is a small unincorporated community located in the western part of the state, in the county of Presidio. It is situated in the Chihuahuan Desert, near the Rio Grande River, and is surrounded by the Big Bend National Park. The area is known for its rugged terrain and stunning views of the surrounding mountains.
History
The area around Seco Mines has been inhabited for thousands of years, with evidence of human activity dating back to the Paleo-Indian period. The first recorded settlers in the area were the Apache, who were followed by the Comanche and the Kiowa. The area was later settled by Spanish and Mexican ranchers, who established ranches in the area.
In the late 19th century, the area was opened up to American settlers, who began to mine for silver and other minerals in the area. The town of Seco Mines was established in 1883, and the first post office was established in 1884. The town was named after the nearby Seco Mine, which was one of the most productive silver mines in the area.
Geography
Seco Mines is located in the western part of Texas, in the county of Presidio. It is situated in the Chihuahuan Desert, near the Rio Grande River, and is surrounded by the Big Bend National Park. The area is known for its rugged terrain and stunning views of the surrounding mountains.
The climate in Seco Mines is arid and semi-arid, with hot summers and mild winters. The average annual temperature is around 70°F (21°C), and the average annual precipitation is around 10 inches (25 cm).
Economy
The economy of Seco Mines is largely based on tourism and ranching. The area is popular with tourists, who come to enjoy the stunning views of the surrounding mountains and the rugged terrain. The area is also home to several ranches, which raise cattle and other livestock.
Demographics
As of the 2010 census, the population of Seco Mines was 545. The racial makeup of the town was 94.3% White, 0.2% African American, 0.7% Native American, 0.2% Asian, 0.2% Pacific Islander, and 4.6% from other races. The median household income was $25,000, and the median family income was $30,000. The per capita income was $14,000.
Conclusion
Seco Mines, Texas is a small unincorporated community located in the western part of the state, in the county of Presidio. It is situated in the Chihuahuan Desert, near the Rio Grande River, and is surrounded by the Big Bend National Park. The area is known for its rugged terrain and stunning views of the surrounding mountains. The economy of Seco Mines is largely based on tourism and ranching, and the population of the town was 545 as of the 2010 census.
Common Questions
What is Per Capita Income in Seco Mines?
Per Capita income in Seco Mines is $11,535.
What is the Median Family Income in Seco Mines?
Median Family Income in Seco Mines is $43,226.
What is the Median Household income in Seco Mines?
Median Household Income in Seco Mines is $43,226.
What is Inequality or Gini Index in Seco Mines?
Inequality or Gini Index in Seco Mines is 0.34.
What is the Total Population of Seco Mines?
Total Population of Seco Mines is 1,274.
What is the Total Male Population of Seco Mines?
Total Male Population of Seco Mines is 787.
What is the Total Female Population of Seco Mines?
Total Female Population of Seco Mines is 487.
What is the Ratio of Males per 100 Females in Seco Mines?
There are 161.60 Males per 100 Females in Seco Mines.
What is the Ratio of Females per 100 Males in Seco Mines?
There are 61.88 Females per 100 Males in Seco Mines.
What is the Median Population Age in Seco Mines?
Median Population Age in Seco Mines is 22.4 Years.
What is the Average Family Size in Seco Mines
Average Family Size in Seco Mines is 4.5 People.
What is the Average Household Size in Seco Mines
Average Household Size in Seco Mines is 4.5 People.
How Large is the Labor Force in Seco Mines?
There are 519 People in the Labor Forcein in Seco Mines.
What is the Percentage of People in the Labor Force in Seco Mines?
55.2% of People are in the Labor Force in Seco Mines.
What is the Unemployment Rate in Seco Mines?
Unemployment Rate in Seco Mines is 17.9%.