Zip Codes with the Highest Percentage of Population Employed in Installation, Maintenance & Repair in Houston, TX
RELATED REPORTS & OPTIONS
Installation, Maintenance & Repair
Houston
Compare Zip Codes
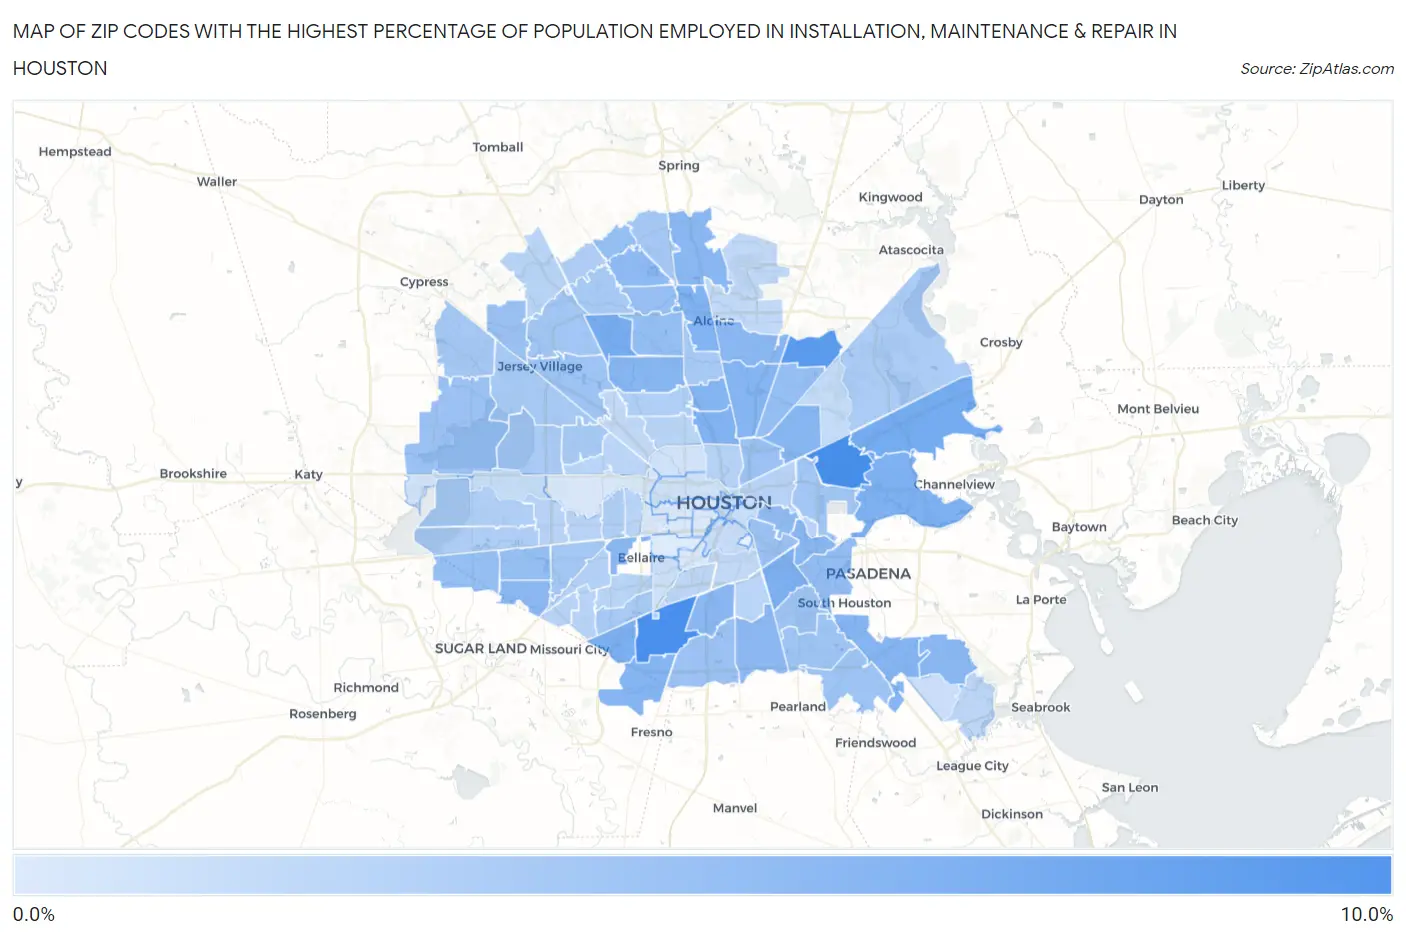
Map of Zip Codes with the Highest Percentage of Population Employed in Installation, Maintenance & Repair in Houston
0.088%
9.1%
Zip Codes with the Highest Percentage of Population Employed in Installation, Maintenance & Repair in Houston, TX
| Zip Code | % Employed | vs State | vs National | |
| 1. | 77013 | 9.1% | 3.4%(+5.69)#145 | 3.1%(+6.03)#2,490 |
| 2. | 77045 | 9.0% | 3.4%(+5.55)#149 | 3.1%(+5.89)#2,588 |
| 3. | 77050 | 8.0% | 3.4%(+4.55)#196 | 3.1%(+4.89)#3,360 |
| 4. | 77049 | 6.2% | 3.4%(+2.82)#328 | 3.1%(+3.16)#5,687 |
| 5. | 77086 | 6.2% | 3.4%(+2.76)#335 | 3.1%(+3.10)#5,800 |
| 6. | 77085 | 5.8% | 3.4%(+2.44)#373 | 3.1%(+2.78)#6,463 |
| 7. | 77087 | 5.7% | 3.4%(+2.28)#400 | 3.1%(+2.61)#6,831 |
| 8. | 77015 | 5.7% | 3.4%(+2.26)#402 | 3.1%(+2.59)#6,875 |
| 9. | 77022 | 5.5% | 3.4%(+2.13)#426 | 3.1%(+2.47)#7,186 |
| 10. | 77060 | 5.5% | 3.4%(+2.11)#430 | 3.1%(+2.44)#7,253 |
| 11. | 77076 | 5.4% | 3.4%(+1.99)#446 | 3.1%(+2.33)#7,537 |
| 12. | 77093 | 5.3% | 3.4%(+1.89)#464 | 3.1%(+2.22)#7,837 |
| 13. | 77034 | 5.3% | 3.4%(+1.86)#467 | 3.1%(+2.20)#7,903 |
| 14. | 77053 | 5.2% | 3.4%(+1.82)#478 | 3.1%(+2.15)#8,033 |
| 15. | 77028 | 5.2% | 3.4%(+1.77)#488 | 3.1%(+2.10)#8,180 |
| 16. | 77088 | 5.1% | 3.4%(+1.69)#506 | 3.1%(+2.02)#8,427 |
| 17. | 77059 | 5.0% | 3.4%(+1.64)#519 | 3.1%(+1.98)#8,588 |
| 18. | 77039 | 5.0% | 3.4%(+1.63)#522 | 3.1%(+1.96)#8,632 |
| 19. | 77073 | 5.0% | 3.4%(+1.61)#526 | 3.1%(+1.95)#8,668 |
| 20. | 77081 | 5.0% | 3.4%(+1.56)#538 | 3.1%(+1.90)#8,833 |
| 21. | 77012 | 5.0% | 3.4%(+1.55)#542 | 3.1%(+1.88)#8,871 |
| 22. | 77051 | 4.9% | 3.4%(+1.52)#550 | 3.1%(+1.85)#8,976 |
| 23. | 77099 | 4.9% | 3.4%(+1.48)#559 | 3.1%(+1.82)#9,102 |
| 24. | 77048 | 4.8% | 3.4%(+1.40)#574 | 3.1%(+1.73)#9,351 |
| 25. | 77014 | 4.7% | 3.4%(+1.35)#583 | 3.1%(+1.68)#9,504 |
| 26. | 77011 | 4.5% | 3.4%(+1.14)#634 | 3.1%(+1.47)#10,274 |
| 27. | 77017 | 4.4% | 3.4%(+1.04)#653 | 3.1%(+1.37)#10,624 |
| 28. | 77083 | 4.4% | 3.4%(+0.951)#668 | 3.1%(+1.29)#10,938 |
| 29. | 77016 | 4.3% | 3.4%(+0.881)#681 | 3.1%(+1.22)#11,224 |
| 30. | 77068 | 4.3% | 3.4%(+0.868)#687 | 3.1%(+1.20)#11,253 |
| 31. | 77038 | 4.3% | 3.4%(+0.848)#693 | 3.1%(+1.18)#11,331 |
| 32. | 77072 | 4.2% | 3.4%(+0.840)#698 | 3.1%(+1.18)#11,365 |
| 33. | 77067 | 4.2% | 3.4%(+0.783)#707 | 3.1%(+1.12)#11,560 |
| 34. | 77026 | 4.0% | 3.4%(+0.616)#755 | 3.1%(+0.951)#12,269 |
| 35. | 77023 | 4.0% | 3.4%(+0.580)#767 | 3.1%(+0.916)#12,453 |
| 36. | 77065 | 3.9% | 3.4%(+0.546)#777 | 3.1%(+0.881)#12,593 |
| 37. | 77084 | 3.9% | 3.4%(+0.494)#788 | 3.1%(+0.829)#12,817 |
| 38. | 77047 | 3.9% | 3.4%(+0.488)#791 | 3.1%(+0.824)#12,844 |
| 39. | 77040 | 3.8% | 3.4%(+0.399)#813 | 3.1%(+0.735)#13,217 |
| 40. | 77075 | 3.8% | 3.4%(+0.379)#821 | 3.1%(+0.714)#13,318 |
| 41. | 77089 | 3.7% | 3.4%(+0.322)#836 | 3.1%(+0.658)#13,569 |
| 42. | 77061 | 3.7% | 3.4%(+0.305)#839 | 3.1%(+0.640)#13,632 |
| 43. | 77029 | 3.5% | 3.4%(+0.092)#898 | 3.1%(+0.428)#14,654 |
| 44. | 77064 | 3.4% | 3.4%(+0.001)#933 | 3.1%(+0.336)#15,067 |
| 45. | 77036 | 3.4% | 3.4%(-0.008)#939 | 3.1%(+0.328)#15,105 |
| 46. | 77090 | 3.4% | 3.4%(-0.051)#958 | 3.1%(+0.285)#15,313 |
| 47. | 77095 | 3.3% | 3.4%(-0.066)#962 | 3.1%(+0.269)#15,374 |
| 48. | 77037 | 3.2% | 3.4%(-0.155)#983 | 3.1%(+0.181)#15,792 |
| 49. | 77041 | 3.2% | 3.4%(-0.216)#1,003 | 3.1%(+0.119)#16,090 |
| 50. | 77080 | 3.2% | 3.4%(-0.229)#1,008 | 3.1%(+0.106)#16,162 |
| 51. | 77066 | 3.2% | 3.4%(-0.244)#1,012 | 3.1%(+0.092)#16,242 |
| 52. | 77035 | 3.1% | 3.4%(-0.256)#1,014 | 3.1%(+0.079)#16,298 |
| 53. | 77043 | 3.0% | 3.4%(-0.376)#1,055 | 3.1%(-0.040)#16,858 |
| 54. | 77044 | 3.0% | 3.4%(-0.440)#1,073 | 3.1%(-0.104)#17,176 |
| 55. | 77082 | 2.8% | 3.4%(-0.596)#1,113 | 3.1%(-0.260)#17,969 |
| 56. | 77069 | 2.8% | 3.4%(-0.635)#1,126 | 3.1%(-0.300)#18,172 |
| 57. | 77057 | 2.8% | 3.4%(-0.653)#1,133 | 3.1%(-0.318)#18,268 |
| 58. | 77091 | 2.7% | 3.4%(-0.714)#1,145 | 3.1%(-0.379)#18,607 |
| 59. | 77077 | 2.6% | 3.4%(-0.816)#1,172 | 3.1%(-0.481)#19,129 |
| 60. | 77074 | 2.6% | 3.4%(-0.848)#1,179 | 3.1%(-0.512)#19,287 |
| 61. | 77009 | 2.4% | 3.4%(-1.04)#1,237 | 3.1%(-0.705)#20,255 |
| 62. | 77063 | 2.3% | 3.4%(-1.11)#1,256 | 3.1%(-0.773)#20,596 |
| 63. | 77031 | 2.3% | 3.4%(-1.13)#1,264 | 3.1%(-0.795)#20,717 |
| 64. | 77071 | 2.2% | 3.4%(-1.17)#1,277 | 3.1%(-0.836)#20,927 |
| 65. | 77042 | 2.2% | 3.4%(-1.18)#1,279 | 3.1%(-0.842)#20,953 |
| 66. | 77020 | 2.2% | 3.4%(-1.22)#1,295 | 3.1%(-0.889)#21,178 |
| 67. | 77056 | 2.2% | 3.4%(-1.25)#1,301 | 3.1%(-0.914)#21,289 |
| 68. | 77018 | 2.1% | 3.4%(-1.26)#1,303 | 3.1%(-0.922)#21,325 |
| 69. | 77055 | 2.1% | 3.4%(-1.27)#1,306 | 3.1%(-0.939)#21,402 |
| 70. | 77096 | 2.1% | 3.4%(-1.29)#1,310 | 3.1%(-0.952)#21,473 |
| 71. | 77033 | 2.1% | 3.4%(-1.33)#1,325 | 3.1%(-0.998)#21,695 |
| 72. | 77070 | 2.0% | 3.4%(-1.36)#1,336 | 3.1%(-1.03)#21,829 |
| 73. | 77054 | 2.0% | 3.4%(-1.41)#1,350 | 3.1%(-1.07)#22,040 |
| 74. | 77046 | 2.0% | 3.4%(-1.41)#1,352 | 3.1%(-1.07)#22,048 |
| 75. | 77058 | 1.9% | 3.4%(-1.47)#1,364 | 3.1%(-1.13)#22,304 |
| 76. | 77092 | 1.7% | 3.4%(-1.66)#1,403 | 3.1%(-1.33)#23,145 |
| 77. | 77032 | 1.7% | 3.4%(-1.71)#1,415 | 3.1%(-1.38)#23,391 |
| 78. | 77021 | 1.7% | 3.4%(-1.73)#1,419 | 3.1%(-1.40)#23,484 |
| 79. | 77002 | 1.5% | 3.4%(-1.91)#1,457 | 3.1%(-1.58)#24,214 |
| 80. | 77079 | 1.4% | 3.4%(-1.98)#1,469 | 3.1%(-1.65)#24,471 |
| 81. | 77078 | 1.4% | 3.4%(-2.05)#1,477 | 3.1%(-1.71)#24,703 |
| 82. | 77003 | 1.3% | 3.4%(-2.10)#1,490 | 3.1%(-1.76)#24,890 |
| 83. | 77004 | 1.3% | 3.4%(-2.14)#1,494 | 3.1%(-1.81)#25,023 |
| 84. | 77062 | 1.1% | 3.4%(-2.29)#1,516 | 3.1%(-1.95)#25,544 |
| 85. | 77025 | 0.95% | 3.4%(-2.46)#1,543 | 3.1%(-2.12)#26,059 |
| 86. | 77007 | 0.84% | 3.4%(-2.56)#1,556 | 3.1%(-2.22)#26,359 |
| 87. | 77008 | 0.80% | 3.4%(-2.60)#1,563 | 3.1%(-2.27)#26,503 |
| 88. | 77094 | 0.77% | 3.4%(-2.63)#1,566 | 3.1%(-2.29)#26,585 |
| 89. | 77024 | 0.38% | 3.4%(-3.02)#1,602 | 3.1%(-2.69)#27,436 |
| 90. | 77019 | 0.26% | 3.4%(-3.14)#1,615 | 3.1%(-2.81)#27,615 |
| 91. | 77006 | 0.26% | 3.4%(-3.14)#1,616 | 3.1%(-2.81)#27,620 |
| 92. | 77098 | 0.21% | 3.4%(-3.19)#1,617 | 3.1%(-2.86)#27,676 |
| 93. | 77027 | 0.19% | 3.4%(-3.21)#1,620 | 3.1%(-2.87)#27,690 |
| 94. | 77030 | 0.19% | 3.4%(-3.21)#1,621 | 3.1%(-2.87)#27,691 |
| 95. | 77005 | 0.088% | 3.4%(-3.31)#1,626 | 3.1%(-2.98)#27,777 |
1
Common Questions
What are the Top 10 Zip Codes with the Highest Percentage of Population Employed in Installation, Maintenance & Repair in Houston, TX?
Top 10 Zip Codes with the Highest Percentage of Population Employed in Installation, Maintenance & Repair in Houston, TX are:
What zip code has the Highest Percentage of Population Employed in Installation, Maintenance & Repair in Houston, TX?
77013 has the Highest Percentage of Population Employed in Installation, Maintenance & Repair in Houston, TX with 9.1%.
What is the Percentage of Population Employed in Installation, Maintenance & Repair in Houston, TX?
Percentage of Population Employed in Installation, Maintenance & Repair in Houston is 3.0%.
What is the Percentage of Population Employed in Installation, Maintenance & Repair in Texas?
Percentage of Population Employed in Installation, Maintenance & Repair in Texas is 3.4%.
What is the Percentage of Population Employed in Installation, Maintenance & Repair in the United States?
Percentage of Population Employed in Installation, Maintenance & Repair in the United States is 3.1%.