Zip Codes with the Highest Percentage of Population Employed in Installation, Maintenance & Repair in Gilmer, TX
RELATED REPORTS & OPTIONS
Installation, Maintenance & Repair
Gilmer
Compare Zip Codes
Map of Zip Codes with the Highest Percentage of Population Employed in Installation, Maintenance & Repair in Gilmer
5.7%
5.8%
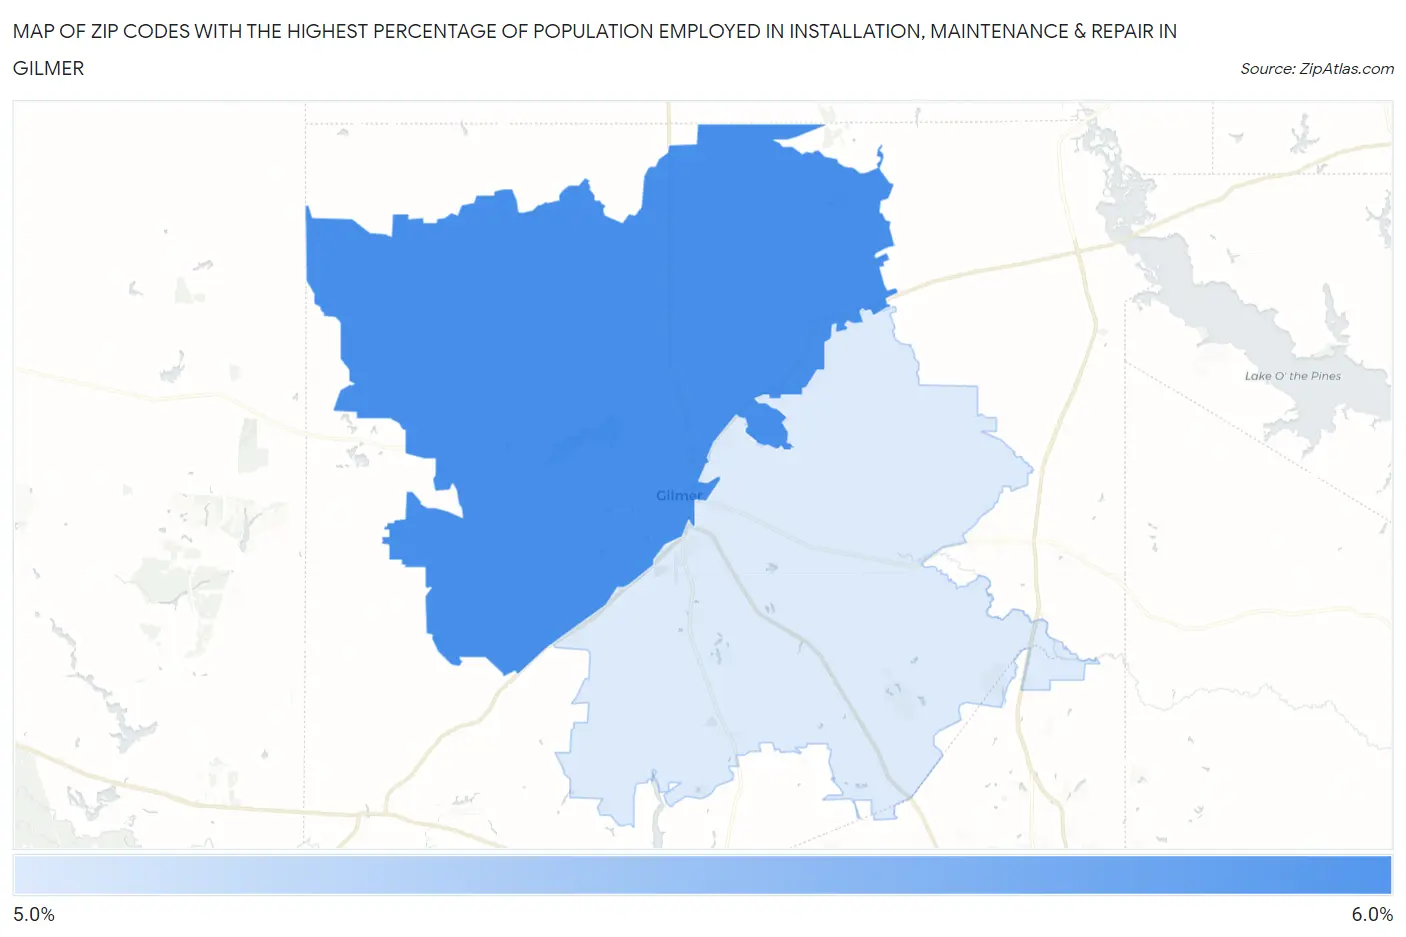
Zip Codes with the Highest Percentage of Population Employed in Installation, Maintenance & Repair in Gilmer, TX
| Zip Code | % Employed | vs State | vs National | |
| 1. | 75644 | 5.8% | 3.4%(+2.39)#380 | 3.1%(+2.72)#6,582 |
| 2. | 75645 | 5.7% | 3.4%(+2.28)#401 | 3.1%(+2.61)#6,832 |
1
Common Questions
What are the Top Zip Codes with the Highest Percentage of Population Employed in Installation, Maintenance & Repair in Gilmer, TX?
Top Zip Codes with the Highest Percentage of Population Employed in Installation, Maintenance & Repair in Gilmer, TX are:
What zip code has the Highest Percentage of Population Employed in Installation, Maintenance & Repair in Gilmer, TX?
75644 has the Highest Percentage of Population Employed in Installation, Maintenance & Repair in Gilmer, TX with 5.8%.
What is the Percentage of Population Employed in Installation, Maintenance & Repair in Gilmer, TX?
Percentage of Population Employed in Installation, Maintenance & Repair in Gilmer is 5.7%.
What is the Percentage of Population Employed in Installation, Maintenance & Repair in Texas?
Percentage of Population Employed in Installation, Maintenance & Repair in Texas is 3.4%.
What is the Percentage of Population Employed in Installation, Maintenance & Repair in the United States?
Percentage of Population Employed in Installation, Maintenance & Repair in the United States is 3.1%.