Zip Codes with the Highest Percentage of Population Employed in Installation, Maintenance & Repair in Lancaster, TX
RELATED REPORTS & OPTIONS
Installation, Maintenance & Repair
Lancaster
Compare Zip Codes
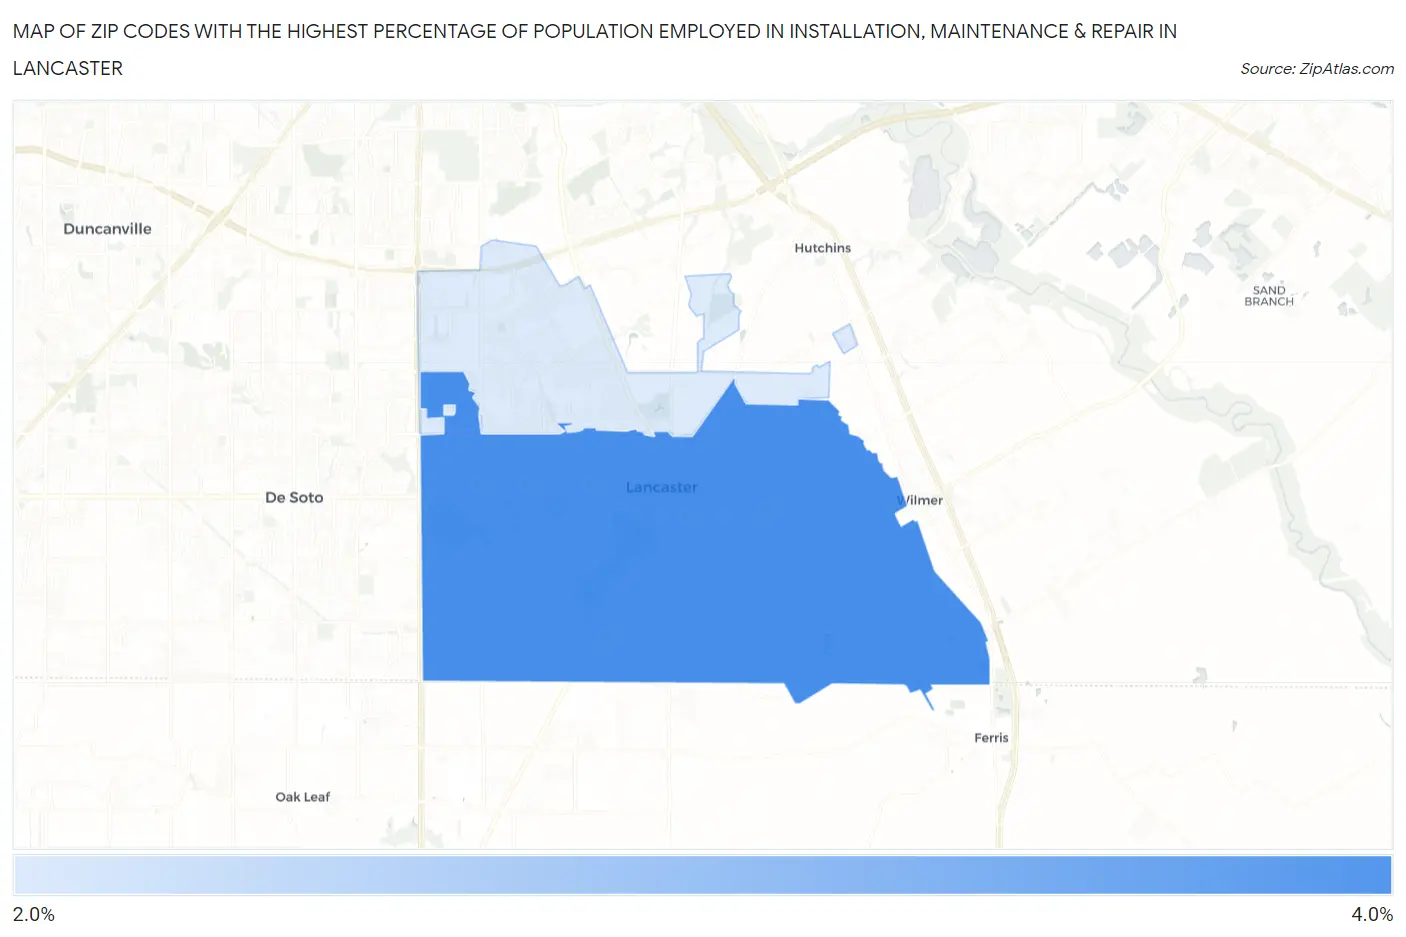
Map of Zip Codes with the Highest Percentage of Population Employed in Installation, Maintenance & Repair in Lancaster
2.2%
3.3%
Zip Codes with the Highest Percentage of Population Employed in Installation, Maintenance & Repair in Lancaster, TX
| Zip Code | % Employed | vs State | vs National | |
| 1. | 75146 | 3.3% | 3.4%(-0.108)#969 | 3.1%(+0.228)#15,569 |
| 2. | 75134 | 2.2% | 3.4%(-1.16)#1,273 | 3.1%(-0.822)#20,851 |
1
Common Questions
What are the Top Zip Codes with the Highest Percentage of Population Employed in Installation, Maintenance & Repair in Lancaster, TX?
Top Zip Codes with the Highest Percentage of Population Employed in Installation, Maintenance & Repair in Lancaster, TX are:
What zip code has the Highest Percentage of Population Employed in Installation, Maintenance & Repair in Lancaster, TX?
75146 has the Highest Percentage of Population Employed in Installation, Maintenance & Repair in Lancaster, TX with 3.3%.
What is the Percentage of Population Employed in Installation, Maintenance & Repair in Lancaster, TX?
Percentage of Population Employed in Installation, Maintenance & Repair in Lancaster is 2.8%.
What is the Percentage of Population Employed in Installation, Maintenance & Repair in Texas?
Percentage of Population Employed in Installation, Maintenance & Repair in Texas is 3.4%.
What is the Percentage of Population Employed in Installation, Maintenance & Repair in the United States?
Percentage of Population Employed in Installation, Maintenance & Repair in the United States is 3.1%.