Gladewater, TX Map & Demographics
Gladewater Map
Gladewater Overview
$24,457
PER CAPITA INCOME
$54,507
AVG FAMILY INCOME
$47,749
AVG HOUSEHOLD INCOME
41.9%
WAGE / INCOME GAP [ % ]
58.1¢/ $1
WAGE / INCOME GAP [ $ ]
0.48
INEQUALITY / GINI INDEX
6,166
TOTAL POPULATION
2,639
MALE POPULATION
3,527
FEMALE POPULATION
74.82
MALES / 100 FEMALES
133.65
FEMALES / 100 MALES
33.3
MEDIAN AGE
3.2
AVG FAMILY SIZE
2.7
AVG HOUSEHOLD SIZE
2,459
LABOR FORCE [ PEOPLE ]
57.4%
PERCENT IN LABOR FORCE
2.8%
UNEMPLOYMENT RATE
Gladewater Zip Codes
Income in Gladewater
Income Overview in Gladewater
Per Capita Income in Gladewater is $24,457, while median incomes of families and households are $54,507 and $47,749 respectively.
| Characteristic | Number | Measure |
| Per Capita Income | 6,166 | $24,457 |
| Median Family Income | 1,483 | $54,507 |
| Mean Family Income | 1,483 | $73,221 |
| Median Household Income | 2,230 | $47,749 |
| Mean Household Income | 2,230 | $65,028 |
| Income Deficit | 1,483 | $0 |
| Wage / Income Gap (%) | 6,166 | 41.85% |
| Wage / Income Gap ($) | 6,166 | 58.15¢ per $1 |
| Gini / Inequality Index | 6,166 | 0.48 |
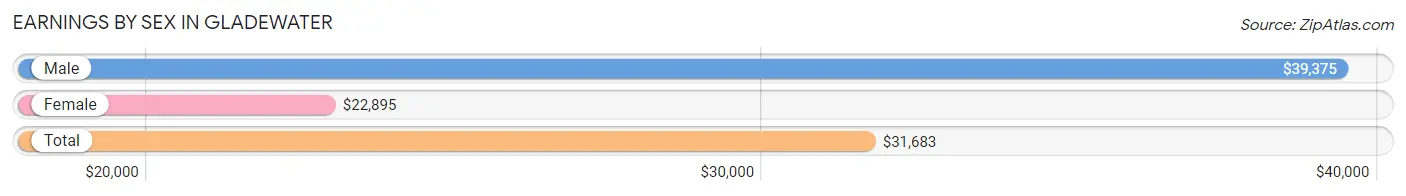
Earnings by Sex in Gladewater
Average Earnings in Gladewater are $31,683, $39,375 for men and $22,895 for women, a difference of 41.8%.
| Sex | Number | Average Earnings |
| Male | 1,190 (44.3%) | $39,375 |
| Female | 1,498 (55.7%) | $22,895 |
| Total | 2,688 (100.0%) | $31,683 |
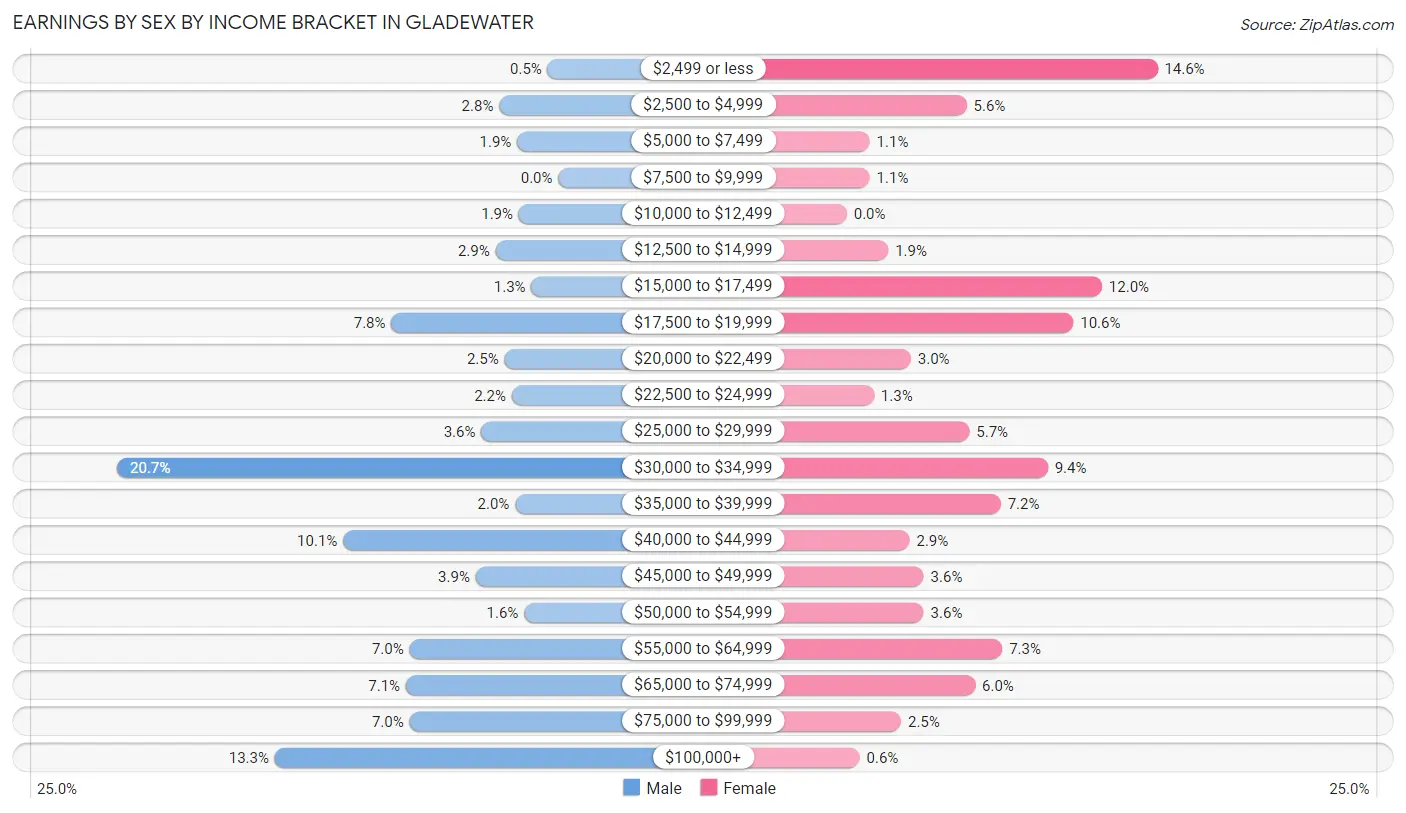
Earnings by Sex by Income Bracket in Gladewater
The most common earnings brackets in Gladewater are $30,000 to $34,999 for men (246 | 20.7%) and $2,499 or less for women (218 | 14.5%).
| Income | Male | Female |
| $2,499 or less | 6 (0.5%) | 218 (14.5%) |
| $2,500 to $4,999 | 33 (2.8%) | 84 (5.6%) |
| $5,000 to $7,499 | 23 (1.9%) | 16 (1.1%) |
| $7,500 to $9,999 | 0 (0.0%) | 16 (1.1%) |
| $10,000 to $12,499 | 22 (1.8%) | 0 (0.0%) |
| $12,500 to $14,999 | 35 (2.9%) | 29 (1.9%) |
| $15,000 to $17,499 | 15 (1.3%) | 179 (11.9%) |
| $17,500 to $19,999 | 93 (7.8%) | 159 (10.6%) |
| $20,000 to $22,499 | 30 (2.5%) | 45 (3.0%) |
| $22,500 to $24,999 | 26 (2.2%) | 19 (1.3%) |
| $25,000 to $29,999 | 43 (3.6%) | 86 (5.7%) |
| $30,000 to $34,999 | 246 (20.7%) | 141 (9.4%) |
| $35,000 to $39,999 | 24 (2.0%) | 108 (7.2%) |
| $40,000 to $44,999 | 120 (10.1%) | 44 (2.9%) |
| $45,000 to $49,999 | 46 (3.9%) | 54 (3.6%) |
| $50,000 to $54,999 | 19 (1.6%) | 54 (3.6%) |
| $55,000 to $64,999 | 83 (7.0%) | 109 (7.3%) |
| $65,000 to $74,999 | 85 (7.1%) | 90 (6.0%) |
| $75,000 to $99,999 | 83 (7.0%) | 38 (2.5%) |
| $100,000+ | 158 (13.3%) | 9 (0.6%) |
| Total | 1,190 (100.0%) | 1,498 (100.0%) |
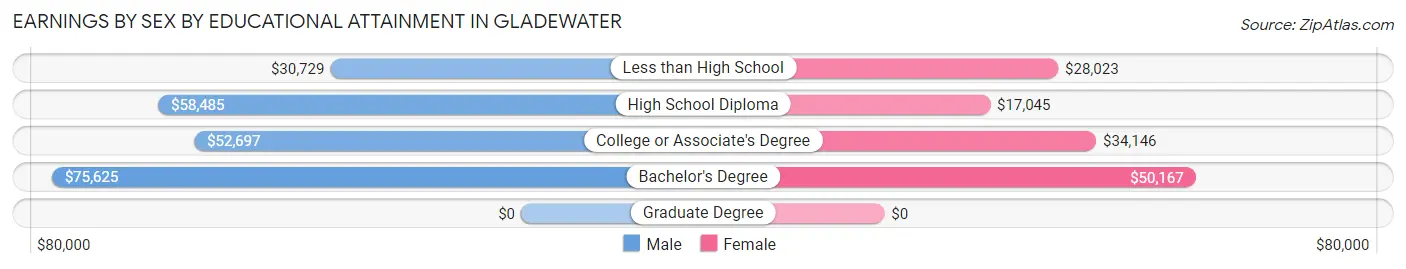
Earnings by Sex by Educational Attainment in Gladewater
Average earnings in Gladewater are $41,523 for men and $28,949 for women, a difference of 30.3%. Men with an educational attainment of bachelor's degree enjoy the highest average annual earnings of $75,625, while those with less than high school education earn the least with $30,729. Women with an educational attainment of bachelor's degree earn the most with the average annual earnings of $50,167, while those with high school diploma education have the smallest earnings of $17,045.
| Educational Attainment | Male Income | Female Income |
| Less than High School | $30,729 | $28,023 |
| High School Diploma | $58,485 | $17,045 |
| College or Associate's Degree | $52,697 | $34,146 |
| Bachelor's Degree | $75,625 | $50,167 |
| Graduate Degree | - | - |
| Total | $41,523 | $28,949 |
Family Income in Gladewater
Family Income Brackets in Gladewater
According to the Gladewater family income data, there are 329 families falling into the $50,000 to $74,999 income range, which is the most common income bracket and makes up 22.2% of all families. Conversely, the $10,000 to $14,999 income bracket is the least frequent group with only 39 families (2.6%) belonging to this category.
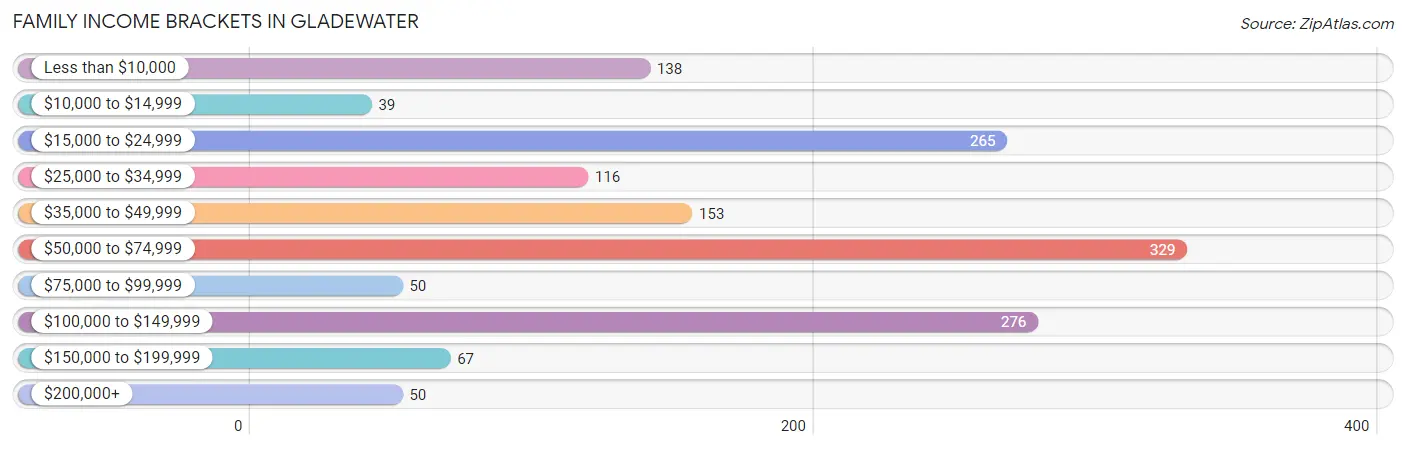
| Income Bracket | # Families | % Families |
| Less than $10,000 | 138 | 9.3% |
| $10,000 to $14,999 | 39 | 2.6% |
| $15,000 to $24,999 | 265 | 17.9% |
| $25,000 to $34,999 | 116 | 7.8% |
| $35,000 to $49,999 | 153 | 10.3% |
| $50,000 to $74,999 | 329 | 22.2% |
| $75,000 to $99,999 | 50 | 3.4% |
| $100,000 to $149,999 | 276 | 18.6% |
| $150,000 to $199,999 | 67 | 4.5% |
| $200,000+ | 50 | 3.4% |
Family Income by Famaliy Size in Gladewater
3-person families (226 | 15.2%) account for the highest median family income in Gladewater with $100,909 per family, while 3-person families (226 | 15.2%) have the highest median income of $33,636 per family member.
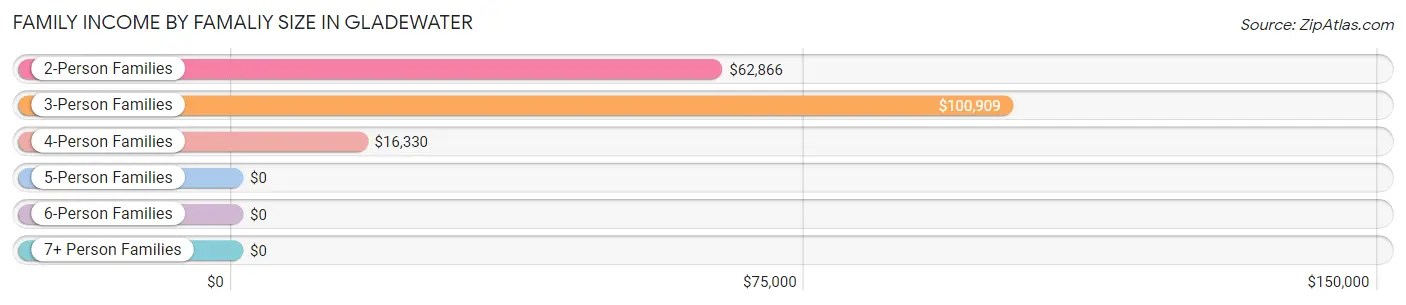
| Income Bracket | # Families | Median Income |
| 2-Person Families | 760 (51.2%) | $62,866 |
| 3-Person Families | 226 (15.2%) | $100,909 |
| 4-Person Families | 317 (21.4%) | $16,330 |
| 5-Person Families | 130 (8.8%) | $0 |
| 6-Person Families | 32 (2.2%) | $0 |
| 7+ Person Families | 18 (1.2%) | $0 |
| Total | 1,483 (100.0%) | $54,507 |
Family Income by Number of Earners in Gladewater
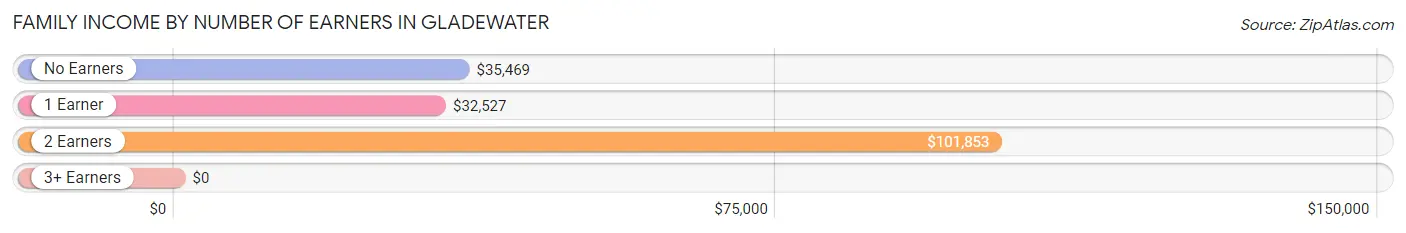
| Number of Earners | # Families | Median Income |
| No Earners | 164 (11.1%) | $35,469 |
| 1 Earner | 767 (51.7%) | $32,527 |
| 2 Earners | 543 (36.6%) | $101,853 |
| 3+ Earners | 9 (0.6%) | $0 |
| Total | 1,483 (100.0%) | $54,507 |
Household Income in Gladewater
Household Income Brackets in Gladewater
With 450 households falling in the category, the $35,000 to $49,999 income range is the most frequent in Gladewater, accounting for 20.2% of all households. In contrast, only 60 households (2.7%) fall into the $75,000 to $99,999 income bracket, making it the least populous group.
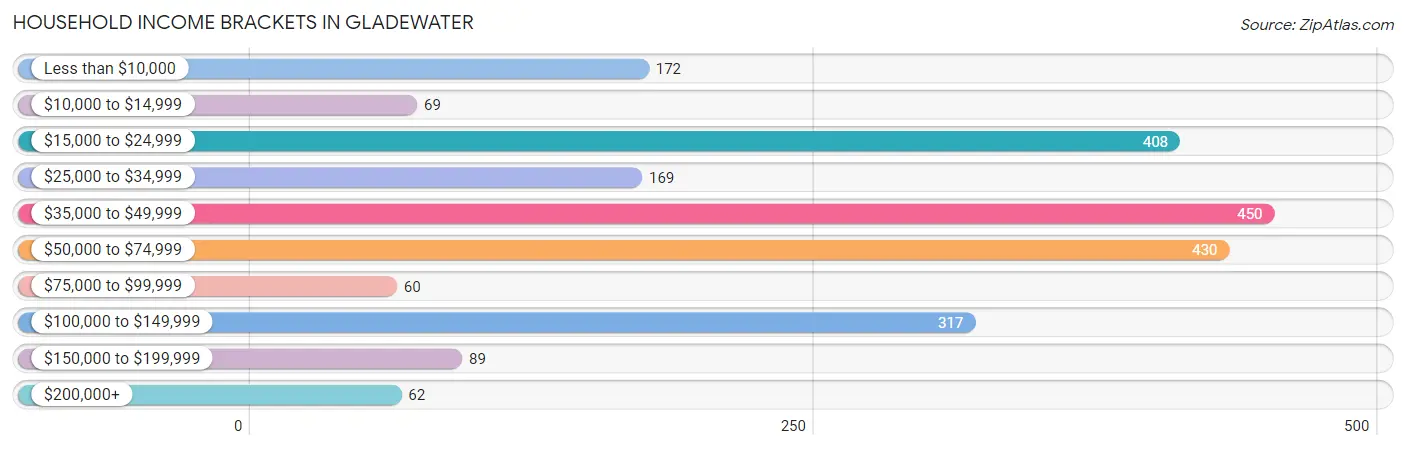
| Income Bracket | # Households | % Households |
| Less than $10,000 | 172 | 7.7% |
| $10,000 to $14,999 | 69 | 3.1% |
| $15,000 to $24,999 | 408 | 18.3% |
| $25,000 to $34,999 | 169 | 7.6% |
| $35,000 to $49,999 | 450 | 20.2% |
| $50,000 to $74,999 | 430 | 19.3% |
| $75,000 to $99,999 | 60 | 2.7% |
| $100,000 to $149,999 | 317 | 14.2% |
| $150,000 to $199,999 | 89 | 4.0% |
| $200,000+ | 62 | 2.8% |
Household Income by Householder Age in Gladewater
The median household income in Gladewater is $47,749, with the highest median household income of $53,355 found in the 45 to 64 years age bracket for the primary householder. A total of 982 households (44.0%) fall into this category. Meanwhile, the 15 to 24 years age bracket for the primary householder has the lowest median household income of $0, with 70 households (3.1%) in this group.
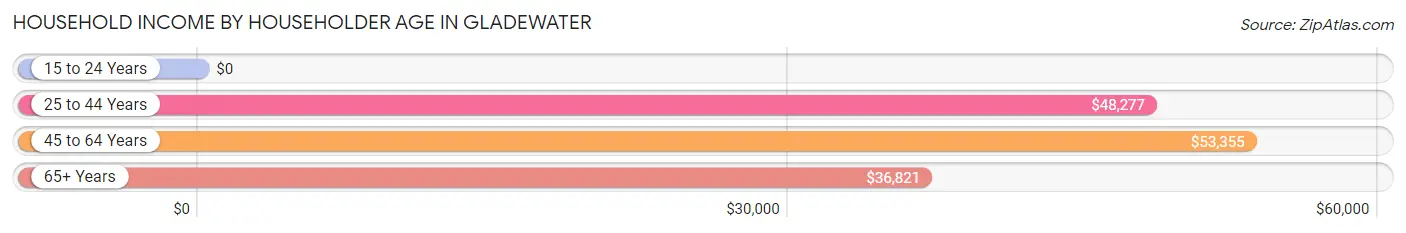
| Income Bracket | # Households | Median Income |
| 15 to 24 Years | 70 (3.1%) | $0 |
| 25 to 44 Years | 733 (32.9%) | $48,277 |
| 45 to 64 Years | 982 (44.0%) | $53,355 |
| 65+ Years | 445 (20.0%) | $36,821 |
| Total | 2,230 (100.0%) | $47,749 |
Poverty in Gladewater
Income Below Poverty by Sex and Age in Gladewater
With 21.5% poverty level for males and 39.3% for females among the residents of Gladewater, under 5 year old males and 6 to 11 year old females are the most vulnerable to poverty, with 183 males (59.2%) and 317 females (88.8%) in their respective age groups living below the poverty level.
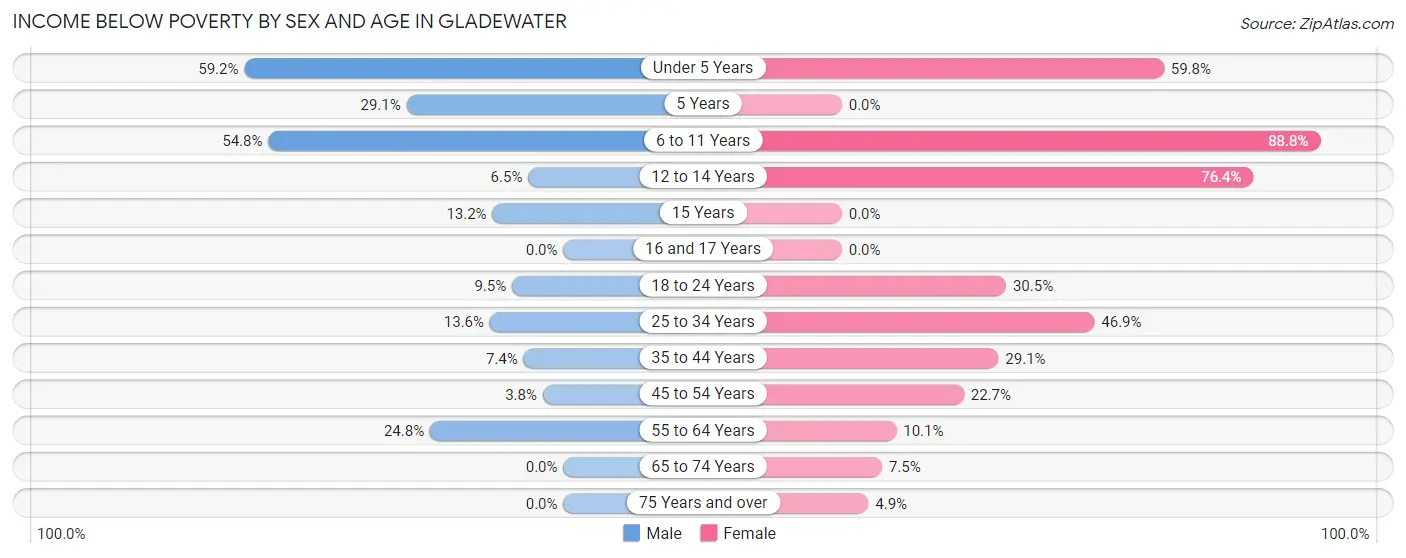
| Age Bracket | Male | Female |
| Under 5 Years | 183 (59.2%) | 205 (59.8%) |
| 5 Years | 23 (29.1%) | 0 (0.0%) |
| 6 to 11 Years | 132 (54.8%) | 317 (88.8%) |
| 12 to 14 Years | 6 (6.5%) | 249 (76.4%) |
| 15 Years | 5 (13.2%) | 0 (0.0%) |
| 16 and 17 Years | 0 (0.0%) | 0 (0.0%) |
| 18 to 24 Years | 12 (9.5%) | 57 (30.5%) |
| 25 to 34 Years | 57 (13.6%) | 240 (46.9%) |
| 35 to 44 Years | 17 (7.4%) | 109 (29.1%) |
| 45 to 54 Years | 11 (3.8%) | 70 (22.7%) |
| 55 to 64 Years | 99 (24.7%) | 46 (10.1%) |
| 65 to 74 Years | 0 (0.0%) | 14 (7.4%) |
| 75 Years and over | 0 (0.0%) | 11 (4.9%) |
| Total | 545 (21.5%) | 1,318 (39.3%) |
Income Above Poverty by Sex and Age in Gladewater
According to the poverty statistics in Gladewater, males aged 16 and 17 years and females aged 5 years are the age groups that are most secure financially, with 100.0% of males and 100.0% of females in these age groups living above the poverty line.
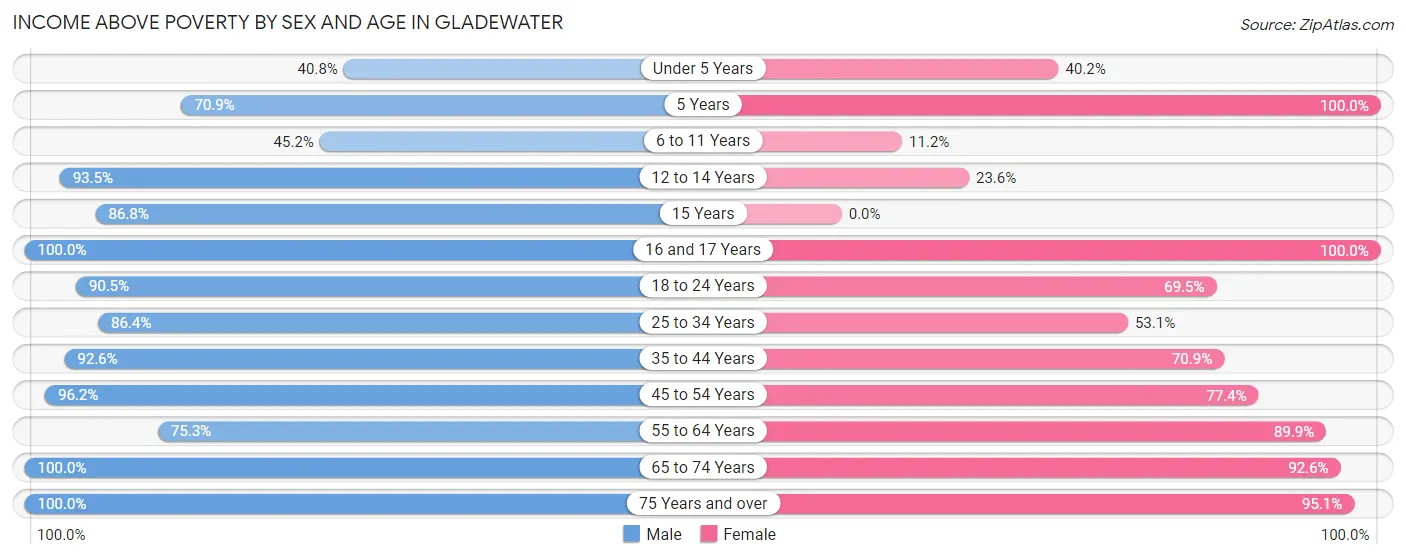
| Age Bracket | Male | Female |
| Under 5 Years | 126 (40.8%) | 138 (40.2%) |
| 5 Years | 56 (70.9%) | 46 (100.0%) |
| 6 to 11 Years | 109 (45.2%) | 40 (11.2%) |
| 12 to 14 Years | 86 (93.5%) | 77 (23.6%) |
| 15 Years | 33 (86.8%) | 0 (0.0%) |
| 16 and 17 Years | 39 (100.0%) | 34 (100.0%) |
| 18 to 24 Years | 114 (90.5%) | 130 (69.5%) |
| 25 to 34 Years | 361 (86.4%) | 272 (53.1%) |
| 35 to 44 Years | 213 (92.6%) | 266 (70.9%) |
| 45 to 54 Years | 278 (96.2%) | 239 (77.3%) |
| 55 to 64 Years | 301 (75.2%) | 409 (89.9%) |
| 65 to 74 Years | 151 (100.0%) | 174 (92.5%) |
| 75 Years and over | 118 (100.0%) | 212 (95.1%) |
| Total | 1,985 (78.5%) | 2,037 (60.7%) |
Income Below Poverty Among Married-Couple Families in Gladewater
The poverty statistics for married-couple families in Gladewater show that 6.7% or 50 of the total 752 families live below the poverty line. Families with 3 or 4 children have the highest poverty rate of 35.7%, comprising of 20 families. On the other hand, families with 1 or 2 children have the lowest poverty rate of 0.0%, which includes 0 families.
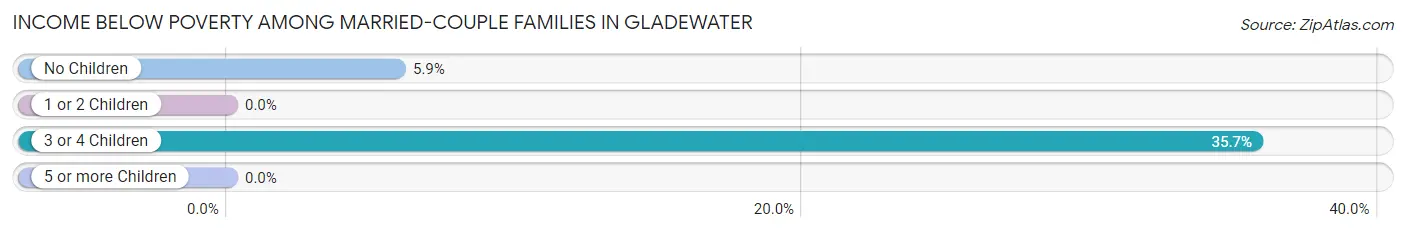
| Children | Above Poverty | Below Poverty |
| No Children | 483 (94.2%) | 30 (5.9%) |
| 1 or 2 Children | 183 (100.0%) | 0 (0.0%) |
| 3 or 4 Children | 36 (64.3%) | 20 (35.7%) |
| 5 or more Children | 0 (0.0%) | 0 (0.0%) |
| Total | 702 (93.3%) | 50 (6.7%) |
Income Below Poverty Among Single-Parent Households in Gladewater
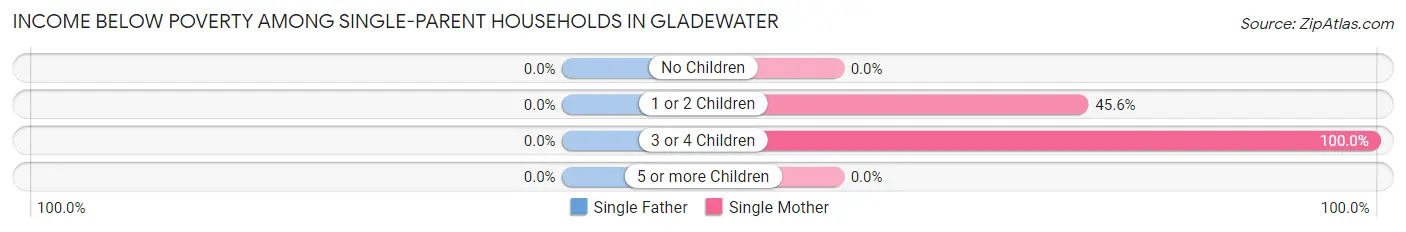
| Children | Single Father | Single Mother |
| No Children | 0 (0.0%) | 0 (0.0%) |
| 1 or 2 Children | 0 (0.0%) | 98 (45.6%) |
| 3 or 4 Children | 0 (0.0%) | 264 (100.0%) |
| 5 or more Children | 0 (0.0%) | 0 (0.0%) |
| Total | 0 (0.0%) | 362 (51.6%) |
Income Below Poverty Among Married-Couple vs Single-Parent Households in Gladewater
The poverty data for Gladewater shows that 50 of the married-couple family households (6.7%) and 362 of the single-parent households (49.5%) are living below the poverty level. Within the married-couple family households, those with 3 or 4 children have the highest poverty rate, with 20 households (35.7%) falling below the poverty line. Among the single-parent households, those with 3 or 4 children have the highest poverty rate, with 264 household (100.0%) living below poverty.
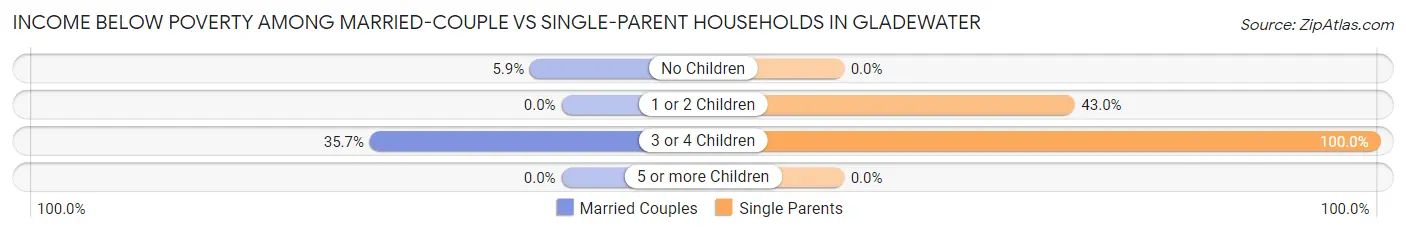
| Children | Married-Couple Families | Single-Parent Households |
| No Children | 30 (5.9%) | 0 (0.0%) |
| 1 or 2 Children | 0 (0.0%) | 98 (43.0%) |
| 3 or 4 Children | 20 (35.7%) | 264 (100.0%) |
| 5 or more Children | 0 (0.0%) | 0 (0.0%) |
| Total | 50 (6.7%) | 362 (49.5%) |
Race in Gladewater
The most populous races in Gladewater are White / Caucasian (4,484 | 72.7%), Black / African American (1,082 | 17.5%), and Hispanic or Latino (948 | 15.4%).
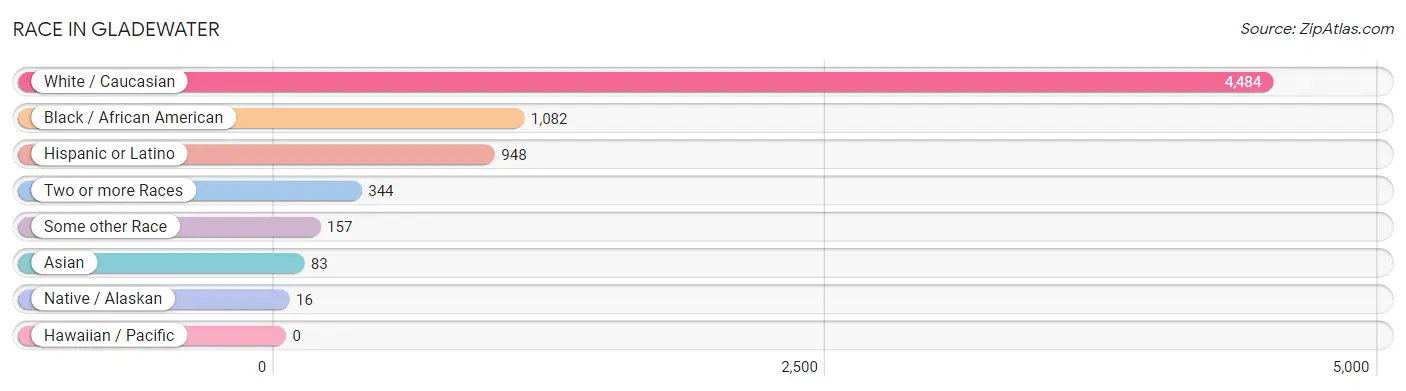
| Race | # Population | % Population |
| Asian | 83 | 1.3% |
| Black / African American | 1,082 | 17.5% |
| Hawaiian / Pacific | 0 | 0.0% |
| Hispanic or Latino | 948 | 15.4% |
| Native / Alaskan | 16 | 0.3% |
| White / Caucasian | 4,484 | 72.7% |
| Two or more Races | 344 | 5.6% |
| Some other Race | 157 | 2.5% |
| Total | 6,166 | 100.0% |
Ancestry in Gladewater
The most populous ancestries reported in Gladewater are Mexican (902 | 14.6%), Irish (739 | 12.0%), American (719 | 11.7%), English (591 | 9.6%), and German (302 | 4.9%), together accounting for 52.8% of all Gladewater residents.
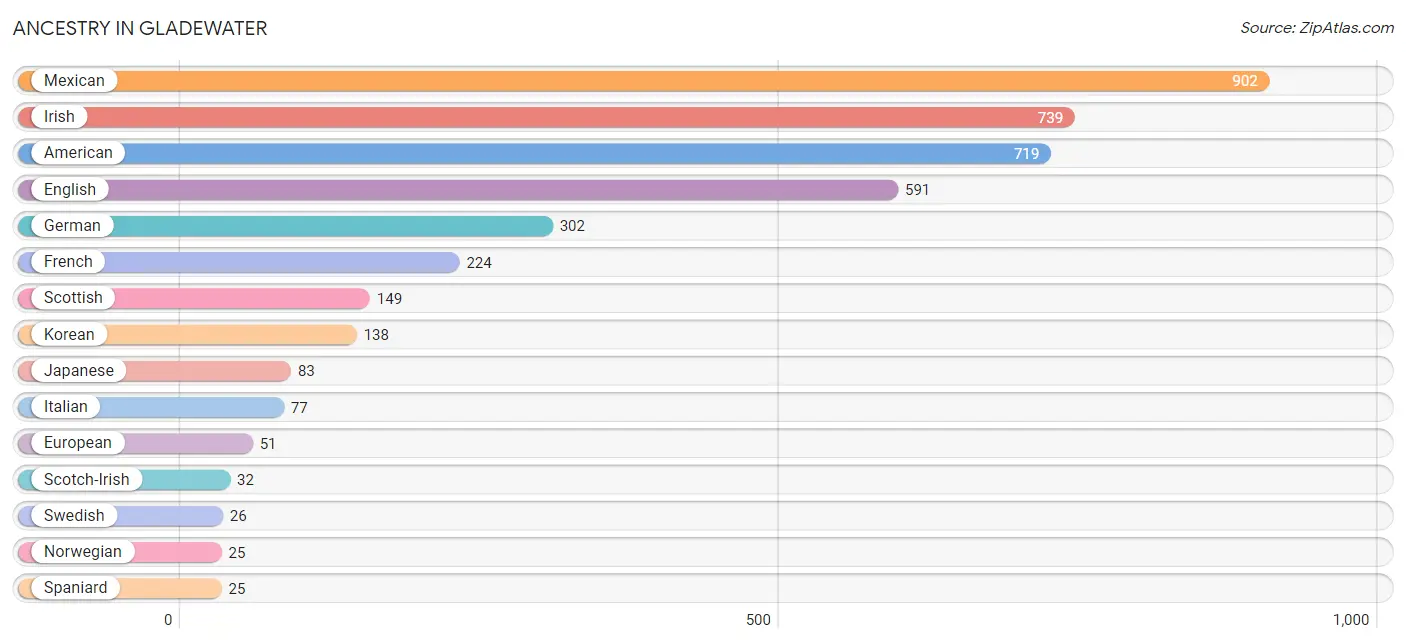
| Ancestry | # Population | % Population |
| African | 10 | 0.2% |
| American | 719 | 11.7% |
| British | 22 | 0.4% |
| Cajun | 13 | 0.2% |
| Central American | 21 | 0.3% |
| Cherokee | 5 | 0.1% |
| Choctaw | 4 | 0.1% |
| English | 591 | 9.6% |
| European | 51 | 0.8% |
| French | 224 | 3.6% |
| German | 302 | 4.9% |
| Honduran | 21 | 0.3% |
| Irish | 739 | 12.0% |
| Italian | 77 | 1.3% |
| Japanese | 83 | 1.3% |
| Korean | 138 | 2.2% |
| Mexican | 902 | 14.6% |
| Navajo | 16 | 0.3% |
| Norwegian | 25 | 0.4% |
| Polish | 22 | 0.4% |
| Scotch-Irish | 32 | 0.5% |
| Scottish | 149 | 2.4% |
| Sioux | 4 | 0.1% |
| Spaniard | 25 | 0.4% |
| Subsaharan African | 10 | 0.2% |
| Swedish | 26 | 0.4% |
| Welsh | 15 | 0.2% |
| West Indian | 19 | 0.3% | View All 28 Rows |
Immigrants in Gladewater
The most numerous immigrant groups reported in Gladewater came from Central America (192 | 3.1%), Latin America (192 | 3.1%), Mexico (171 | 2.8%), Asia (28 | 0.4%), and Cambodia (28 | 0.4%), together accounting for 9.9% of all Gladewater residents.
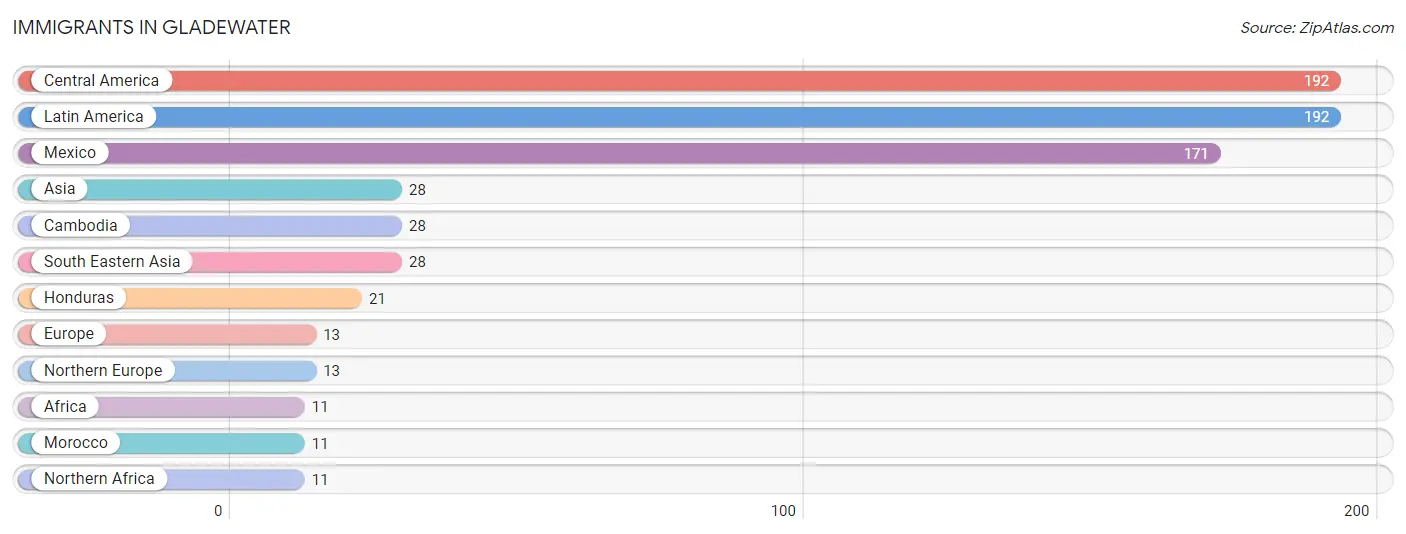
| Immigration Origin | # Population | % Population |
| Africa | 11 | 0.2% |
| Asia | 28 | 0.4% |
| Cambodia | 28 | 0.4% |
| Central America | 192 | 3.1% |
| Europe | 13 | 0.2% |
| Honduras | 21 | 0.3% |
| Latin America | 192 | 3.1% |
| Mexico | 171 | 2.8% |
| Morocco | 11 | 0.2% |
| Northern Africa | 11 | 0.2% |
| Northern Europe | 13 | 0.2% |
| South Eastern Asia | 28 | 0.4% | View All 12 Rows |
Sex and Age in Gladewater
Sex and Age in Gladewater
The most populous age groups in Gladewater are Under 5 Years (309 | 11.7%) for men and 10 to 14 Years (512 | 14.5%) for women.
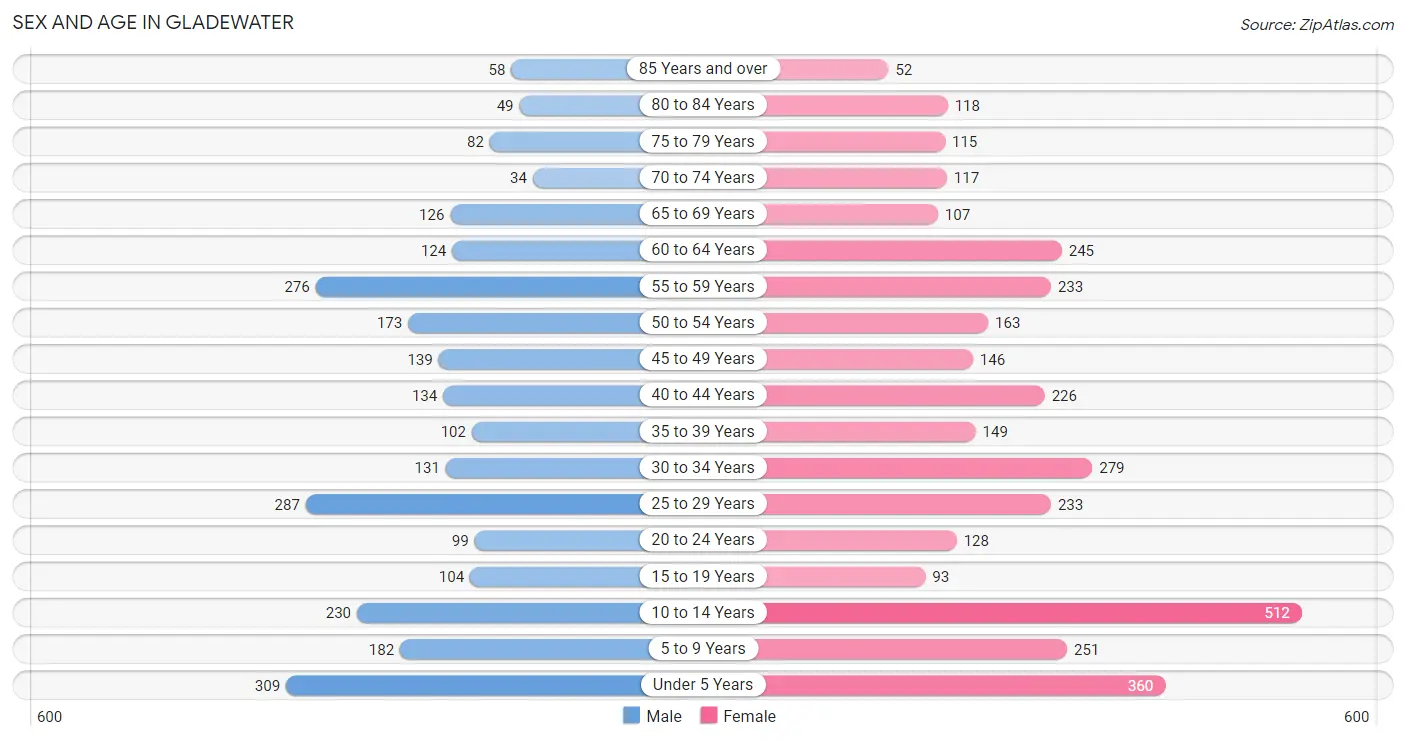
| Age Bracket | Male | Female |
| Under 5 Years | 309 (11.7%) | 360 (10.2%) |
| 5 to 9 Years | 182 (6.9%) | 251 (7.1%) |
| 10 to 14 Years | 230 (8.7%) | 512 (14.5%) |
| 15 to 19 Years | 104 (3.9%) | 93 (2.6%) |
| 20 to 24 Years | 99 (3.7%) | 128 (3.6%) |
| 25 to 29 Years | 287 (10.9%) | 233 (6.6%) |
| 30 to 34 Years | 131 (5.0%) | 279 (7.9%) |
| 35 to 39 Years | 102 (3.9%) | 149 (4.2%) |
| 40 to 44 Years | 134 (5.1%) | 226 (6.4%) |
| 45 to 49 Years | 139 (5.3%) | 146 (4.1%) |
| 50 to 54 Years | 173 (6.6%) | 163 (4.6%) |
| 55 to 59 Years | 276 (10.5%) | 233 (6.6%) |
| 60 to 64 Years | 124 (4.7%) | 245 (7.0%) |
| 65 to 69 Years | 126 (4.8%) | 107 (3.0%) |
| 70 to 74 Years | 34 (1.3%) | 117 (3.3%) |
| 75 to 79 Years | 82 (3.1%) | 115 (3.3%) |
| 80 to 84 Years | 49 (1.9%) | 118 (3.4%) |
| 85 Years and over | 58 (2.2%) | 52 (1.5%) |
| Total | 2,639 (100.0%) | 3,527 (100.0%) |
Families and Households in Gladewater
Median Family Size in Gladewater
The median family size in Gladewater is 3.19 persons per family, with single female/mother families (701 | 47.3%) accounting for the largest median family size of 3.34 persons per family. On the other hand, married-couple families (752 | 50.7%) represent the smallest median family size with 3.05 persons per family.
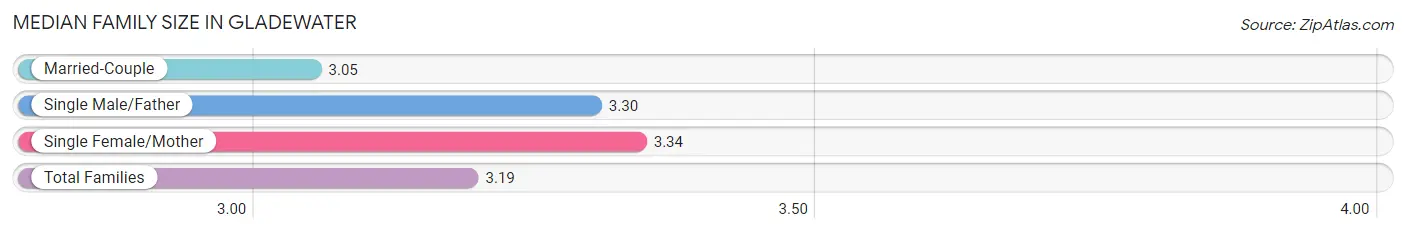
| Family Type | # Families | Family Size |
| Married-Couple | 752 (50.7%) | 3.05 |
| Single Male/Father | 30 (2.0%) | 3.30 |
| Single Female/Mother | 701 (47.3%) | 3.34 |
| Total Families | 1,483 (100.0%) | 3.19 |
Median Household Size in Gladewater
The median household size in Gladewater is 2.66 persons per household, with single male/father households (30 | 1.3%) accounting for the largest median household size of 3.67 persons per household. non-family households (747 | 33.5%) represent the smallest median household size with 1.27 persons per household.
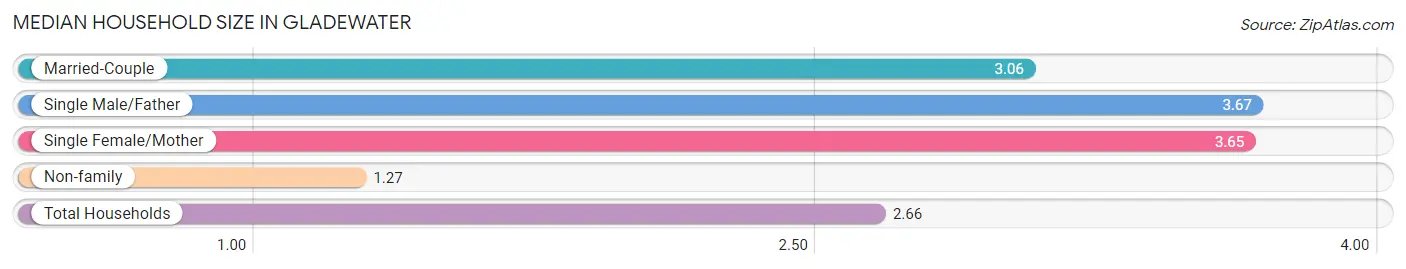
| Household Type | # Households | Household Size |
| Married-Couple | 752 (33.7%) | 3.06 |
| Single Male/Father | 30 (1.3%) | 3.67 |
| Single Female/Mother | 701 (31.4%) | 3.65 |
| Non-family | 747 (33.5%) | 1.27 |
| Total Households | 2,230 (100.0%) | 2.66 |
Household Size by Marriage Status in Gladewater
Out of a total of 2,230 households in Gladewater, 1,483 (66.5%) are family households, while 747 (33.5%) are nonfamily households. The most numerous type of family households are 2-person households, comprising 721, and the most common type of nonfamily households are 1-person households, comprising 546.
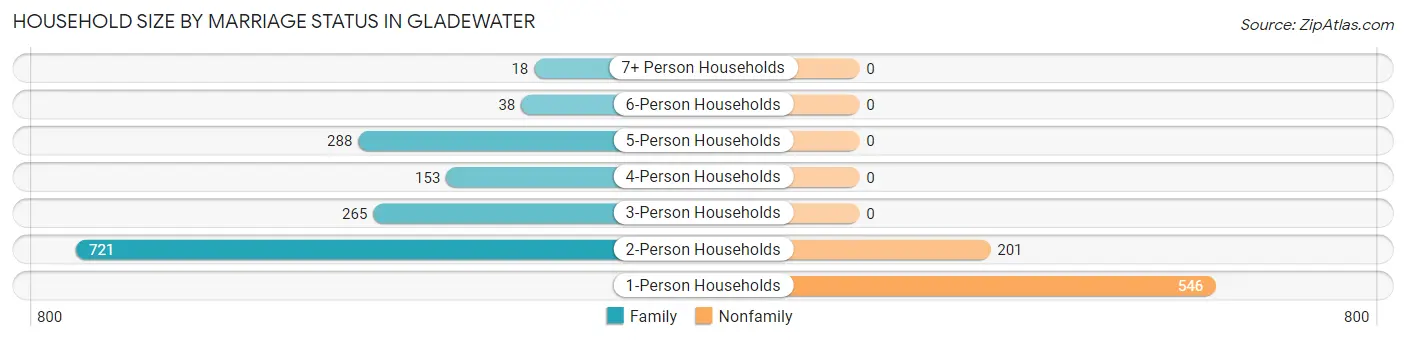
| Household Size | Family Households | Nonfamily Households |
| 1-Person Households | - | 546 (24.5%) |
| 2-Person Households | 721 (32.3%) | 201 (9.0%) |
| 3-Person Households | 265 (11.9%) | 0 (0.0%) |
| 4-Person Households | 153 (6.9%) | 0 (0.0%) |
| 5-Person Households | 288 (12.9%) | 0 (0.0%) |
| 6-Person Households | 38 (1.7%) | 0 (0.0%) |
| 7+ Person Households | 18 (0.8%) | 0 (0.0%) |
| Total | 1,483 (66.5%) | 747 (33.5%) |
Female Fertility in Gladewater
Fertility by Age in Gladewater
Average fertility rate in Gladewater is 27.0 births per 1,000 women. Women in the age bracket of 35 to 50 years have the highest fertility rate with 46.0 births per 1,000 women. Women in the age bracket of 35 to 50 years acount for 75.0% of all women with births.
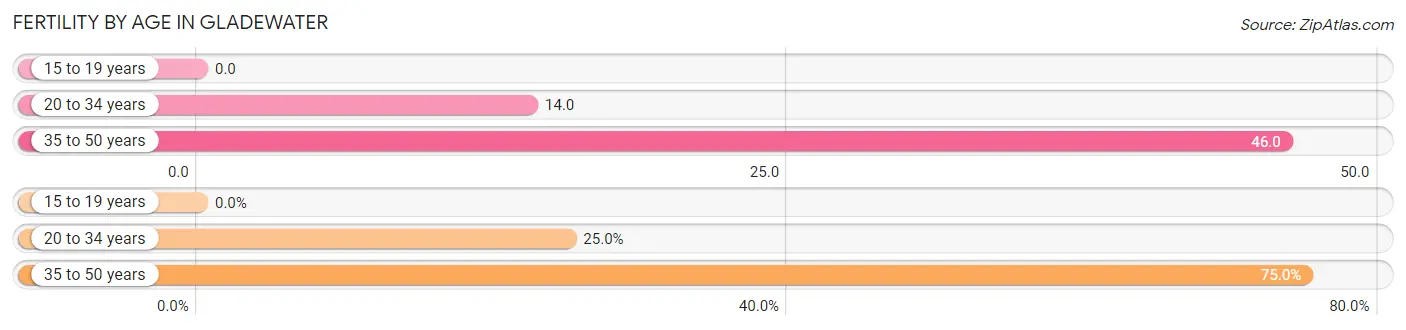
| Age Bracket | Women with Births | Births / 1,000 Women |
| 15 to 19 years | 0 (0.0%) | 0.0 |
| 20 to 34 years | 9 (25.0%) | 14.0 |
| 35 to 50 years | 27 (75.0%) | 46.0 |
| Total | 36 (100.0%) | 27.0 |
Fertility by Age by Marriage Status in Gladewater
25.0% of women with births (36) in Gladewater are married. The highest percentage of unmarried women with births falls into 35 to 50 years age bracket with 100.0% of them unmarried at the time of birth, while the lowest percentage of unmarried women with births belong to 20 to 34 years age bracket with 0.0% of them unmarried.
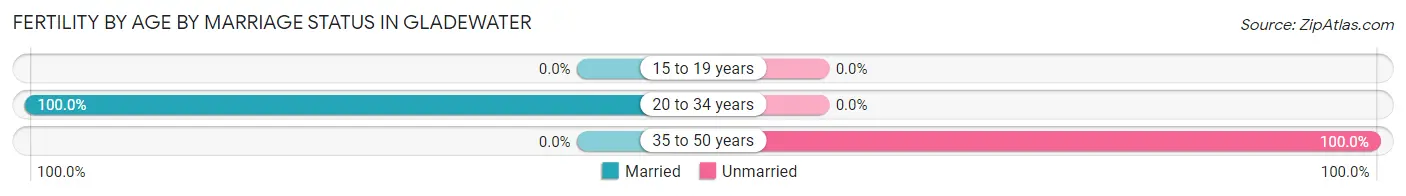
| Age Bracket | Married | Unmarried |
| 15 to 19 years | 0 (0.0%) | 0 (0.0%) |
| 20 to 34 years | 9 (100.0%) | 0 (0.0%) |
| 35 to 50 years | 0 (0.0%) | 27 (100.0%) |
| Total | 9 (25.0%) | 27 (75.0%) |
Fertility by Education in Gladewater
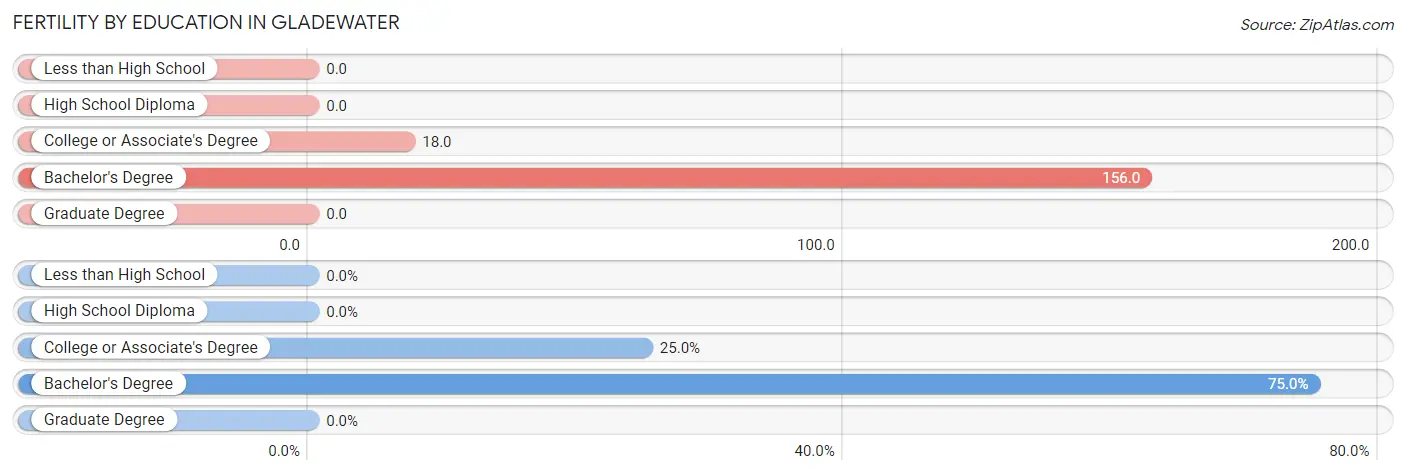
| Educational Attainment | Women with Births | Births / 1,000 Women |
| Less than High School | 0 (0.0%) | 0.0 |
| High School Diploma | 0 (0.0%) | 0.0 |
| College or Associate's Degree | 9 (25.0%) | 18.0 |
| Bachelor's Degree | 27 (75.0%) | 156.0 |
| Graduate Degree | 0 (0.0%) | 0.0 |
| Total | 36 (100.0%) | 27.0 |
Fertility by Education by Marriage Status in Gladewater
75.0% of women with births in Gladewater are unmarried. Women with the educational attainment of college or associate's degree are most likely to be married with 100.0% of them married at childbirth, while women with the educational attainment of bachelor's degree are least likely to be married with 100.0% of them unmarried at childbirth.
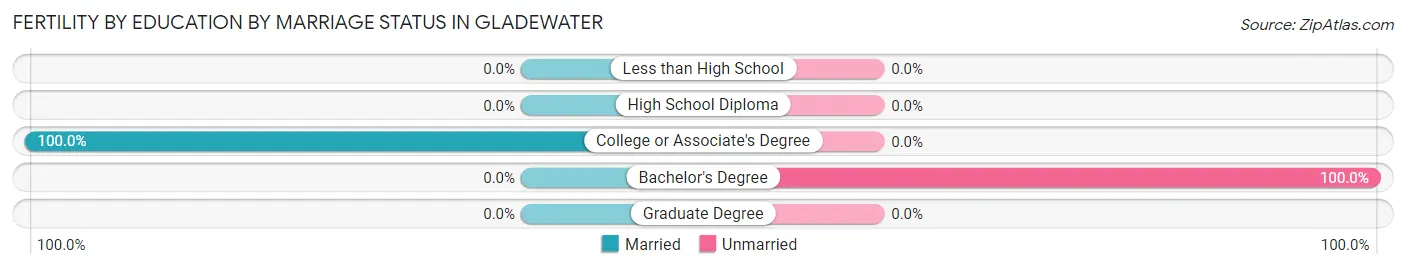
| Educational Attainment | Married | Unmarried |
| Less than High School | 0 (0.0%) | 0 (0.0%) |
| High School Diploma | 0 (0.0%) | 0 (0.0%) |
| College or Associate's Degree | 9 (100.0%) | 0 (0.0%) |
| Bachelor's Degree | 0 (0.0%) | 27 (100.0%) |
| Graduate Degree | 0 (0.0%) | 0 (0.0%) |
| Total | 9 (25.0%) | 27 (75.0%) |
Employment Characteristics in Gladewater
Employment by Class of Employer in Gladewater
Among the 2,346 employed individuals in Gladewater, private company employees (1,693 | 72.2%), not-for-profit organizations (246 | 10.5%), and local government employees (195 | 8.3%) make up the most common classes of employment.
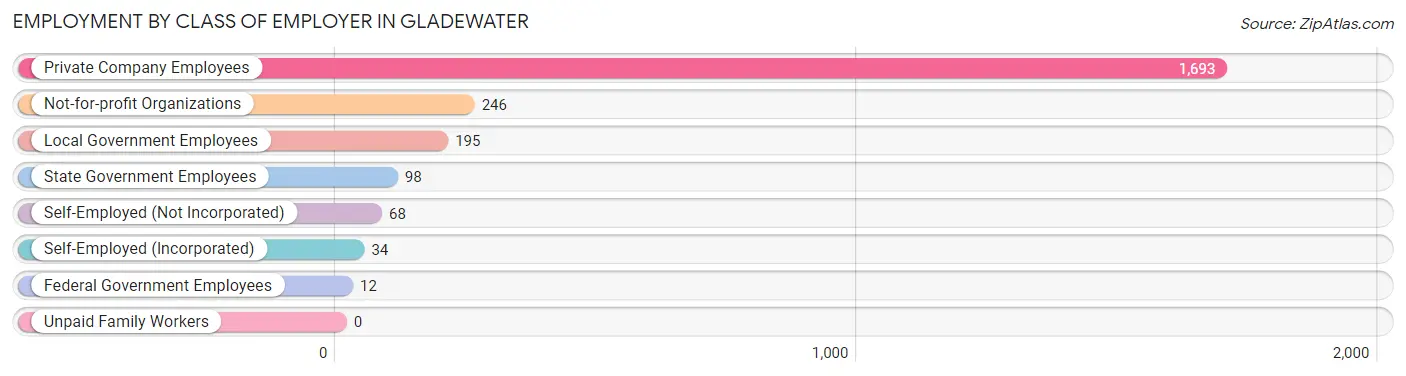
| Employer Class | # Employees | % Employees |
| Private Company Employees | 1,693 | 72.2% |
| Self-Employed (Incorporated) | 34 | 1.5% |
| Self-Employed (Not Incorporated) | 68 | 2.9% |
| Not-for-profit Organizations | 246 | 10.5% |
| Local Government Employees | 195 | 8.3% |
| State Government Employees | 98 | 4.2% |
| Federal Government Employees | 12 | 0.5% |
| Unpaid Family Workers | 0 | 0.0% |
| Total | 2,346 | 100.0% |
Employment Status by Age in Gladewater
According to the labor force statistics for Gladewater, out of the total population over 16 years of age (4,284), 57.4% or 2,459 individuals are in the labor force, with 2.8% or 69 of them unemployed. The age group with the highest labor force participation rate is 30 to 34 years, with 83.9% or 344 individuals in the labor force. Within the labor force, the 60 to 64 years age range has the highest percentage of unemployed individuals, with 11.0% or 17 of them being unemployed.
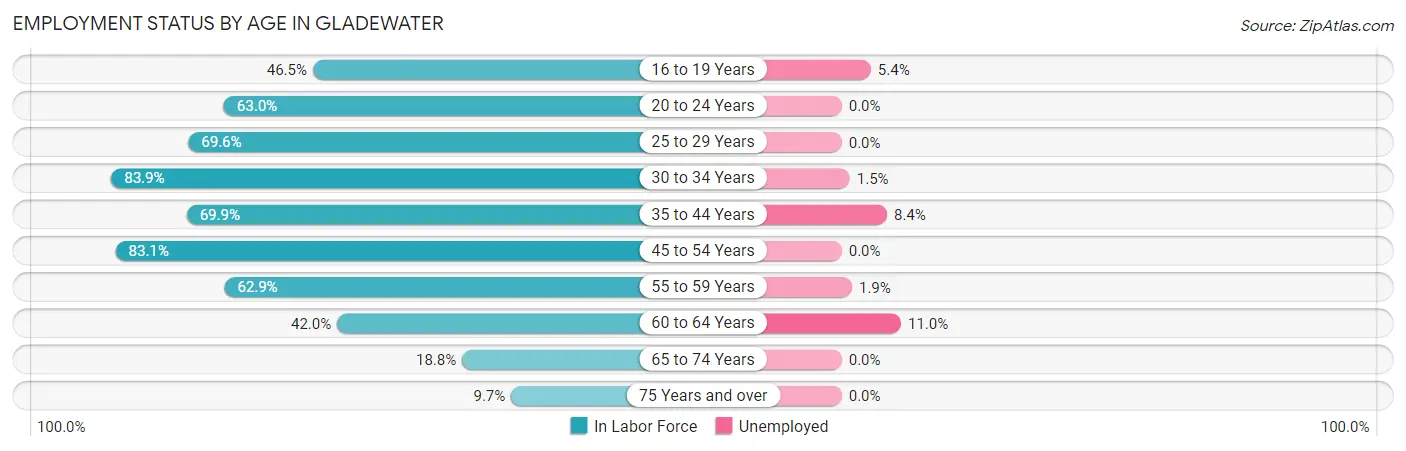
| Age Bracket | In Labor Force | Unemployed |
| 16 to 19 Years | 74 (46.5%) | 4 (5.4%) |
| 20 to 24 Years | 143 (63.0%) | 0 (0.0%) |
| 25 to 29 Years | 362 (69.6%) | 0 (0.0%) |
| 30 to 34 Years | 344 (83.9%) | 5 (1.5%) |
| 35 to 44 Years | 427 (69.9%) | 36 (8.4%) |
| 45 to 54 Years | 516 (83.1%) | 0 (0.0%) |
| 55 to 59 Years | 320 (62.9%) | 6 (1.9%) |
| 60 to 64 Years | 155 (42.0%) | 17 (11.0%) |
| 65 to 74 Years | 72 (18.8%) | 0 (0.0%) |
| 75 Years and over | 46 (9.7%) | 0 (0.0%) |
| Total | 2,459 (57.4%) | 69 (2.8%) |
Employment Status by Educational Attainment in Gladewater
According to labor force statistics for Gladewater, 69.9% of individuals (2,125) out of the total population between 25 and 64 years of age (3,040) are in the labor force, with 3.0% or 64 of them being unemployed. The group with the highest labor force participation rate are those with the educational attainment of bachelor's degree or higher, with 87.2% or 320 individuals in the labor force. Within the labor force, individuals with college / associate degree education have the highest percentage of unemployment, with 8.8% or 64 of them being unemployed.
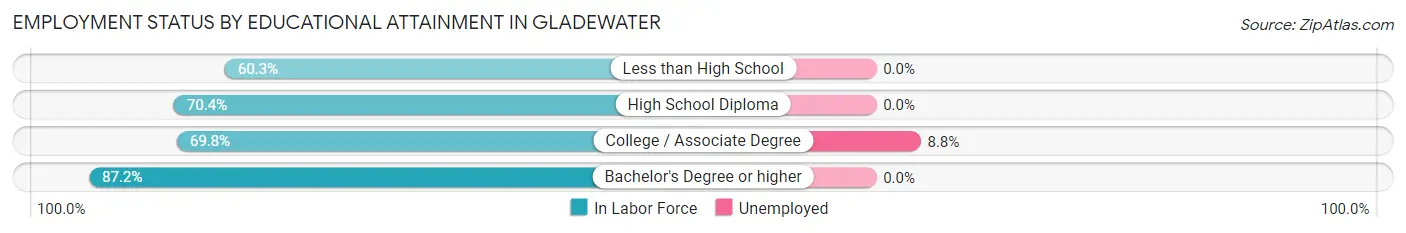
| Educational Attainment | In Labor Force | Unemployed |
| Less than High School | 429 (60.3%) | 0 (0.0%) |
| High School Diploma | 645 (70.4%) | 0 (0.0%) |
| College / Associate Degree | 730 (69.8%) | 92 (8.8%) |
| Bachelor's Degree or higher | 320 (87.2%) | 0 (0.0%) |
| Total | 2,125 (69.9%) | 91 (3.0%) |
Employment Occupations by Sex in Gladewater
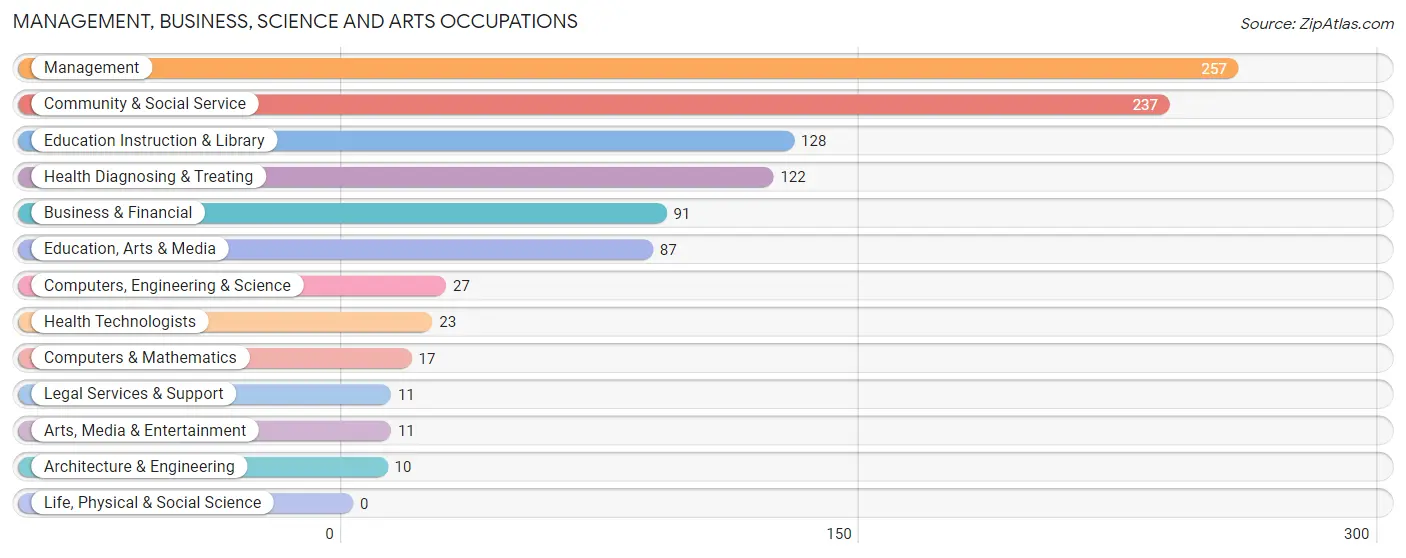
Management, Business, Science and Arts Occupations
The most common Management, Business, Science and Arts occupations in Gladewater are Management (257 | 10.7%), Community & Social Service (237 | 9.9%), Education Instruction & Library (128 | 5.3%), Health Diagnosing & Treating (122 | 5.1%), and Business & Financial (91 | 3.8%).
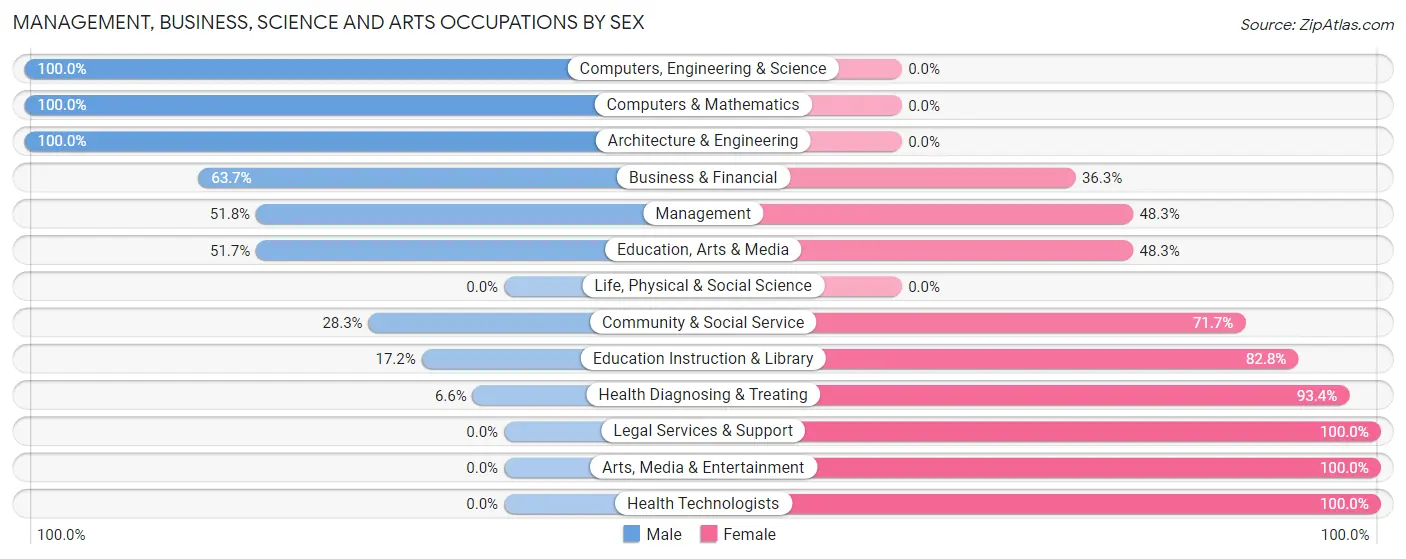
Management, Business, Science and Arts Occupations by Sex
Within the Management, Business, Science and Arts occupations in Gladewater, the most male-oriented occupations are Computers, Engineering & Science (100.0%), Computers & Mathematics (100.0%), and Architecture & Engineering (100.0%), while the most female-oriented occupations are Legal Services & Support (100.0%), Arts, Media & Entertainment (100.0%), and Health Technologists (100.0%).
| Occupation | Male | Female |
| Management | 133 (51.7%) | 124 (48.2%) |
| Business & Financial | 58 (63.7%) | 33 (36.3%) |
| Computers, Engineering & Science | 27 (100.0%) | 0 (0.0%) |
| Computers & Mathematics | 17 (100.0%) | 0 (0.0%) |
| Architecture & Engineering | 10 (100.0%) | 0 (0.0%) |
| Life, Physical & Social Science | 0 (0.0%) | 0 (0.0%) |
| Community & Social Service | 67 (28.3%) | 170 (71.7%) |
| Education, Arts & Media | 45 (51.7%) | 42 (48.3%) |
| Legal Services & Support | 0 (0.0%) | 11 (100.0%) |
| Education Instruction & Library | 22 (17.2%) | 106 (82.8%) |
| Arts, Media & Entertainment | 0 (0.0%) | 11 (100.0%) |
| Health Diagnosing & Treating | 8 (6.6%) | 114 (93.4%) |
| Health Technologists | 0 (0.0%) | 23 (100.0%) |
| Total (Category) | 293 (39.9%) | 441 (60.1%) |
| Total (Overall) | 1,122 (46.9%) | 1,269 (53.1%) |
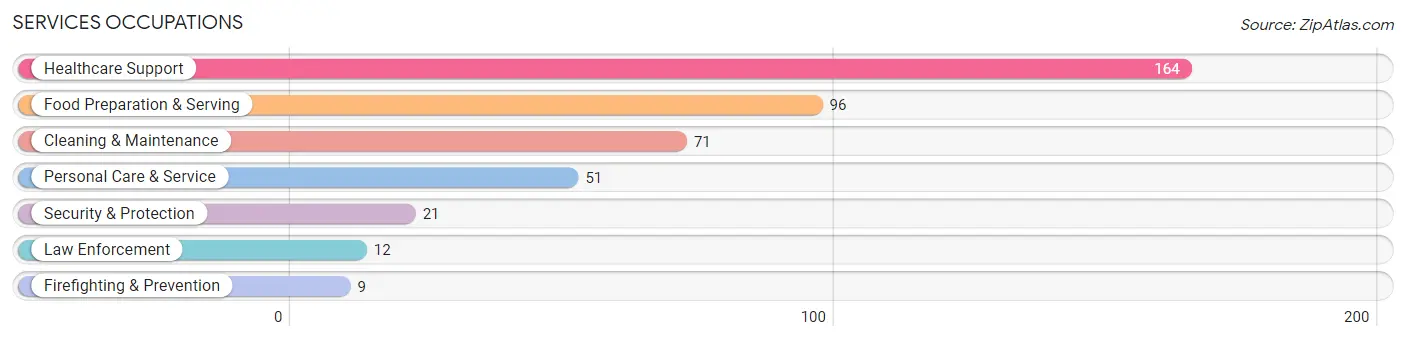
Services Occupations
The most common Services occupations in Gladewater are Healthcare Support (164 | 6.9%), Food Preparation & Serving (96 | 4.0%), Cleaning & Maintenance (71 | 3.0%), Personal Care & Service (51 | 2.1%), and Security & Protection (21 | 0.9%).
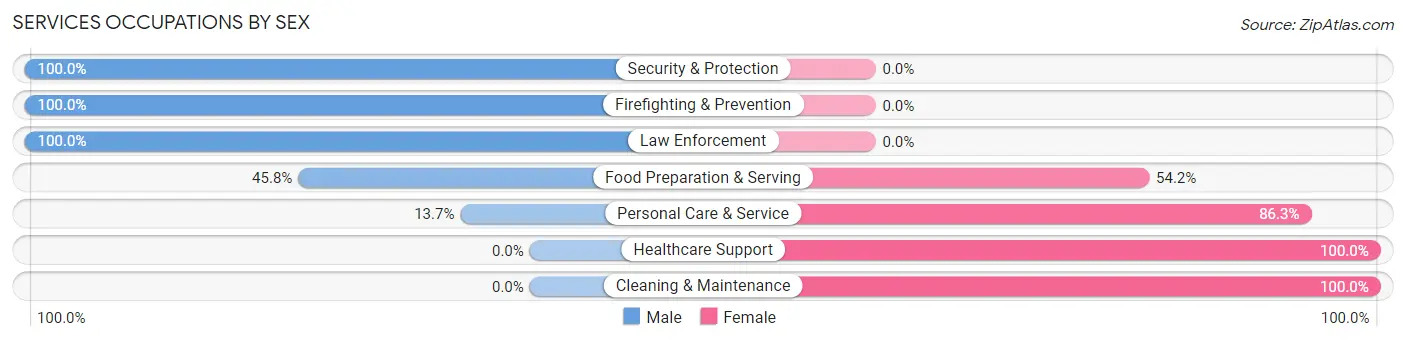
Services Occupations by Sex
Within the Services occupations in Gladewater, the most male-oriented occupations are Security & Protection (100.0%), Firefighting & Prevention (100.0%), and Law Enforcement (100.0%), while the most female-oriented occupations are Healthcare Support (100.0%), Cleaning & Maintenance (100.0%), and Personal Care & Service (86.3%).
| Occupation | Male | Female |
| Healthcare Support | 0 (0.0%) | 164 (100.0%) |
| Security & Protection | 21 (100.0%) | 0 (0.0%) |
| Firefighting & Prevention | 9 (100.0%) | 0 (0.0%) |
| Law Enforcement | 12 (100.0%) | 0 (0.0%) |
| Food Preparation & Serving | 44 (45.8%) | 52 (54.2%) |
| Cleaning & Maintenance | 0 (0.0%) | 71 (100.0%) |
| Personal Care & Service | 7 (13.7%) | 44 (86.3%) |
| Total (Category) | 72 (17.9%) | 331 (82.1%) |
| Total (Overall) | 1,122 (46.9%) | 1,269 (53.1%) |
Sales and Office Occupations
The most common Sales and Office occupations in Gladewater are Sales & Related (350 | 14.6%), and Office & Administration (175 | 7.3%).
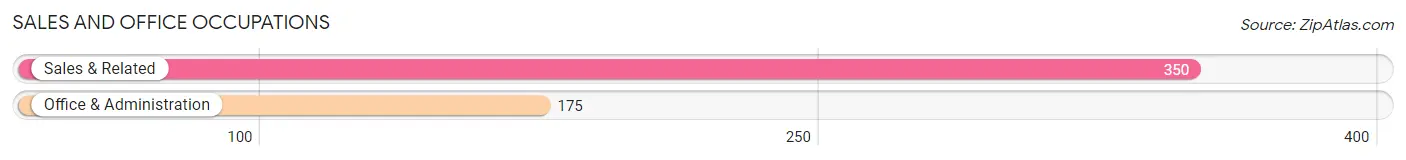
Sales and Office Occupations by Sex
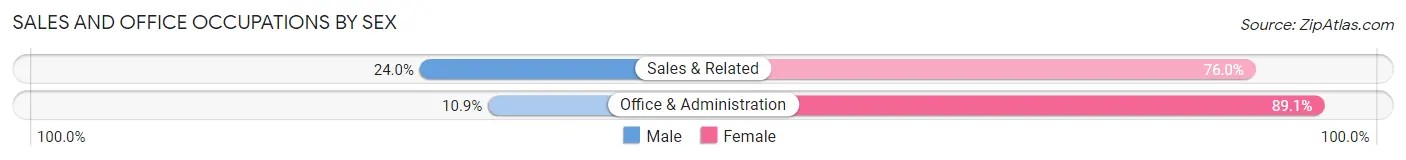
| Occupation | Male | Female |
| Sales & Related | 84 (24.0%) | 266 (76.0%) |
| Office & Administration | 19 (10.9%) | 156 (89.1%) |
| Total (Category) | 103 (19.6%) | 422 (80.4%) |
| Total (Overall) | 1,122 (46.9%) | 1,269 (53.1%) |
Natural Resources, Construction and Maintenance Occupations
The most common Natural Resources, Construction and Maintenance occupations in Gladewater are Installation, Maintenance & Repair (303 | 12.7%), and Construction & Extraction (117 | 4.9%).
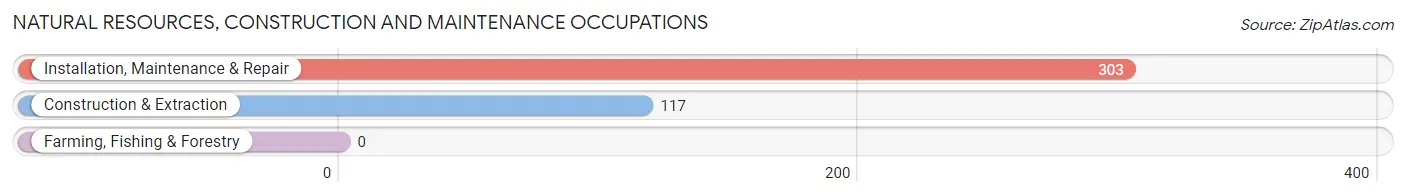
Natural Resources, Construction and Maintenance Occupations by Sex
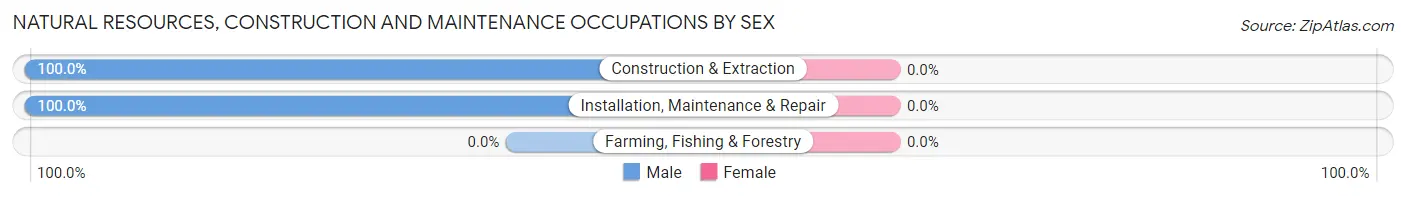
| Occupation | Male | Female |
| Farming, Fishing & Forestry | 0 (0.0%) | 0 (0.0%) |
| Construction & Extraction | 117 (100.0%) | 0 (0.0%) |
| Installation, Maintenance & Repair | 303 (100.0%) | 0 (0.0%) |
| Total (Category) | 420 (100.0%) | 0 (0.0%) |
| Total (Overall) | 1,122 (46.9%) | 1,269 (53.1%) |
Production, Transportation and Moving Occupations
The most common Production, Transportation and Moving occupations in Gladewater are Production (144 | 6.0%), Transportation (110 | 4.6%), and Material Moving (55 | 2.3%).
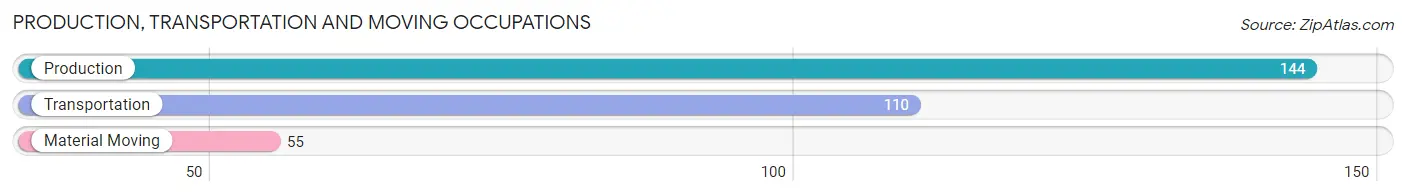
Production, Transportation and Moving Occupations by Sex
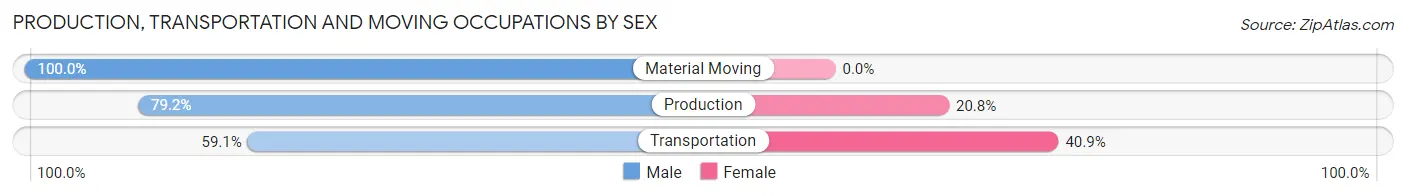
| Occupation | Male | Female |
| Production | 114 (79.2%) | 30 (20.8%) |
| Transportation | 65 (59.1%) | 45 (40.9%) |
| Material Moving | 55 (100.0%) | 0 (0.0%) |
| Total (Category) | 234 (75.7%) | 75 (24.3%) |
| Total (Overall) | 1,122 (46.9%) | 1,269 (53.1%) |
Employment Industries by Sex in Gladewater
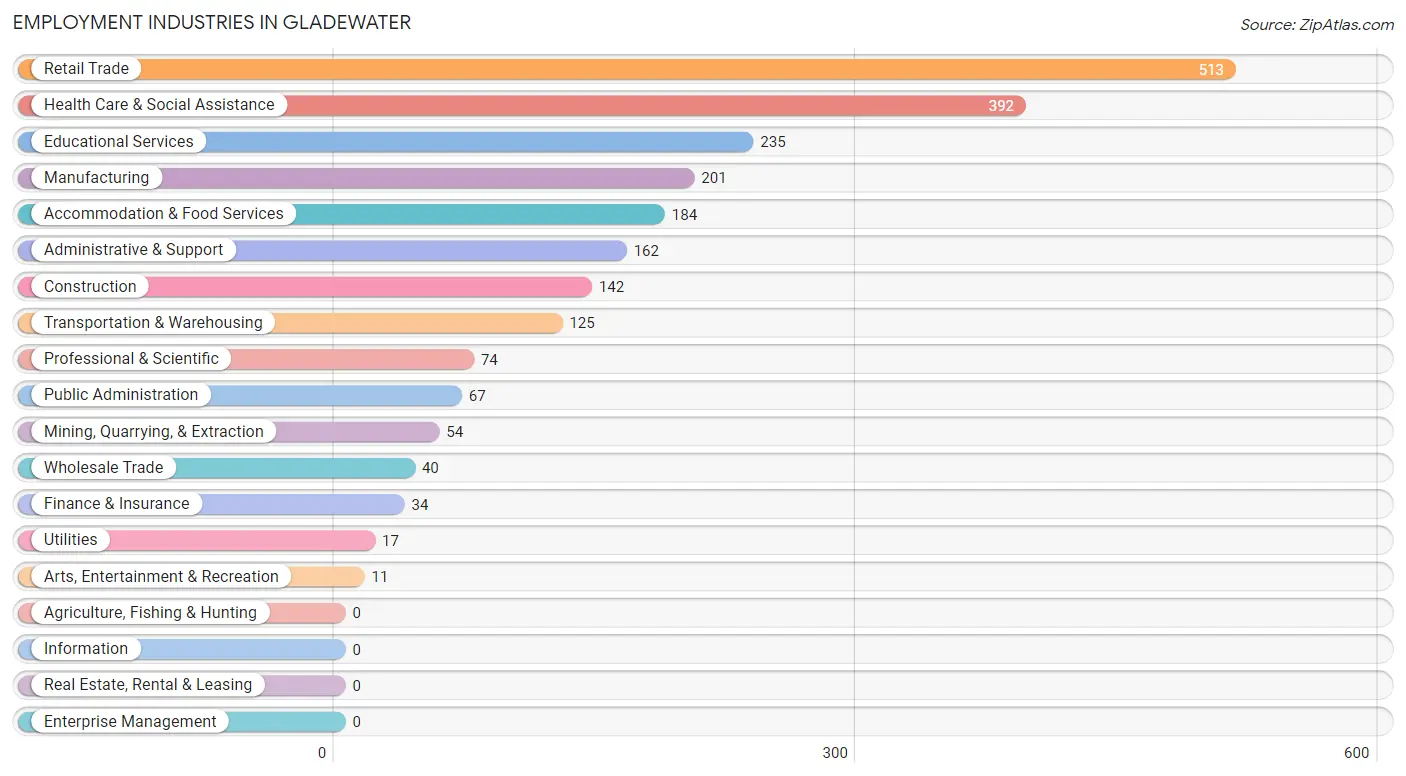
Employment Industries in Gladewater
The major employment industries in Gladewater include Retail Trade (513 | 21.5%), Health Care & Social Assistance (392 | 16.4%), Educational Services (235 | 9.8%), Manufacturing (201 | 8.4%), and Accommodation & Food Services (184 | 7.7%).
Employment Industries by Sex in Gladewater
The Gladewater industries that see more men than women are Mining, Quarrying, & Extraction (100.0%), Construction (100.0%), and Utilities (100.0%), whereas the industries that tend to have a higher number of women are Finance & Insurance (100.0%), Arts, Entertainment & Recreation (100.0%), and Health Care & Social Assistance (94.1%).
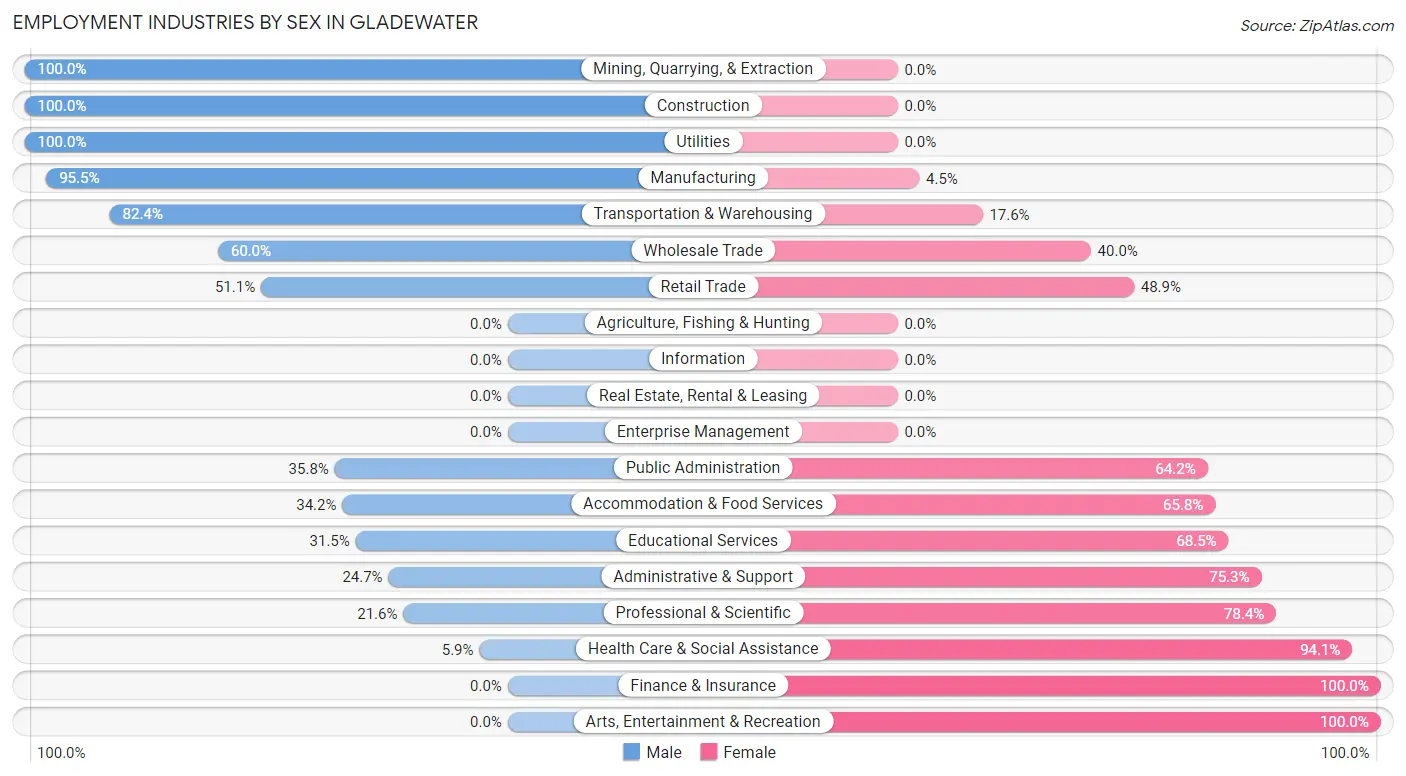
| Industry | Male | Female |
| Agriculture, Fishing & Hunting | 0 (0.0%) | 0 (0.0%) |
| Mining, Quarrying, & Extraction | 54 (100.0%) | 0 (0.0%) |
| Construction | 142 (100.0%) | 0 (0.0%) |
| Manufacturing | 192 (95.5%) | 9 (4.5%) |
| Wholesale Trade | 24 (60.0%) | 16 (40.0%) |
| Retail Trade | 262 (51.1%) | 251 (48.9%) |
| Transportation & Warehousing | 103 (82.4%) | 22 (17.6%) |
| Utilities | 17 (100.0%) | 0 (0.0%) |
| Information | 0 (0.0%) | 0 (0.0%) |
| Finance & Insurance | 0 (0.0%) | 34 (100.0%) |
| Real Estate, Rental & Leasing | 0 (0.0%) | 0 (0.0%) |
| Professional & Scientific | 16 (21.6%) | 58 (78.4%) |
| Enterprise Management | 0 (0.0%) | 0 (0.0%) |
| Administrative & Support | 40 (24.7%) | 122 (75.3%) |
| Educational Services | 74 (31.5%) | 161 (68.5%) |
| Health Care & Social Assistance | 23 (5.9%) | 369 (94.1%) |
| Arts, Entertainment & Recreation | 0 (0.0%) | 11 (100.0%) |
| Accommodation & Food Services | 63 (34.2%) | 121 (65.8%) |
| Public Administration | 24 (35.8%) | 43 (64.2%) |
| Total | 1,122 (46.9%) | 1,269 (53.1%) |
Education in Gladewater
School Enrollment in Gladewater
The most common levels of schooling among the 1,605 students in Gladewater are middle school (711 | 44.3%), elementary school (281 | 17.5%), and nursery / preschool (174 | 10.8%).
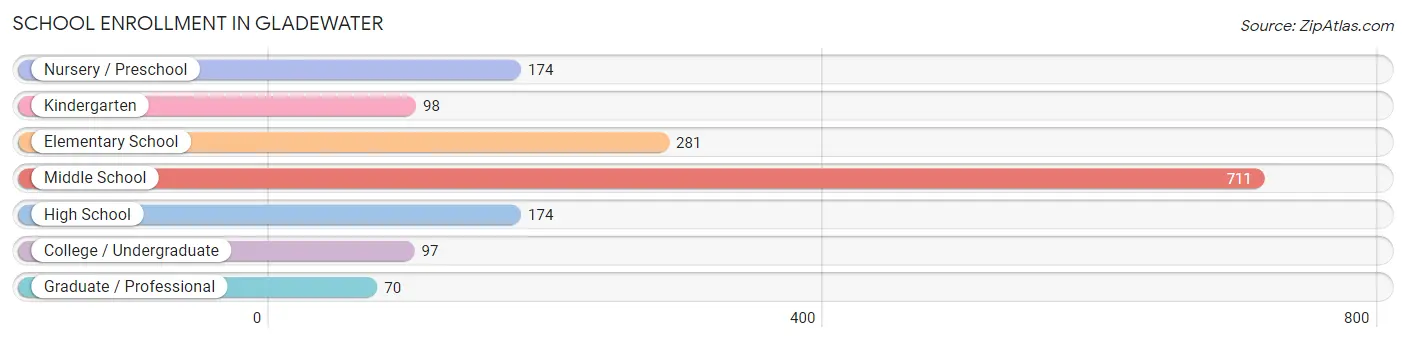
| School Level | # Students | % Students |
| Nursery / Preschool | 174 | 10.8% |
| Kindergarten | 98 | 6.1% |
| Elementary School | 281 | 17.5% |
| Middle School | 711 | 44.3% |
| High School | 174 | 10.8% |
| College / Undergraduate | 97 | 6.0% |
| Graduate / Professional | 70 | 4.4% |
| Total | 1,605 | 100.0% |
School Enrollment by Age by Funding Source in Gladewater
Out of a total of 1,605 students who are enrolled in schools in Gladewater, 56 (3.5%) attend a private institution, while the remaining 1,549 (96.5%) are enrolled in public schools. The age group of 25 to 34 year olds has the highest likelihood of being enrolled in private schools, with 30 (49.2% in the age bracket) enrolled. Conversely, the age group of 3 to 4 year olds has the lowest likelihood of being enrolled in a private school, with 134 (100.0% in the age bracket) attending a public institution.
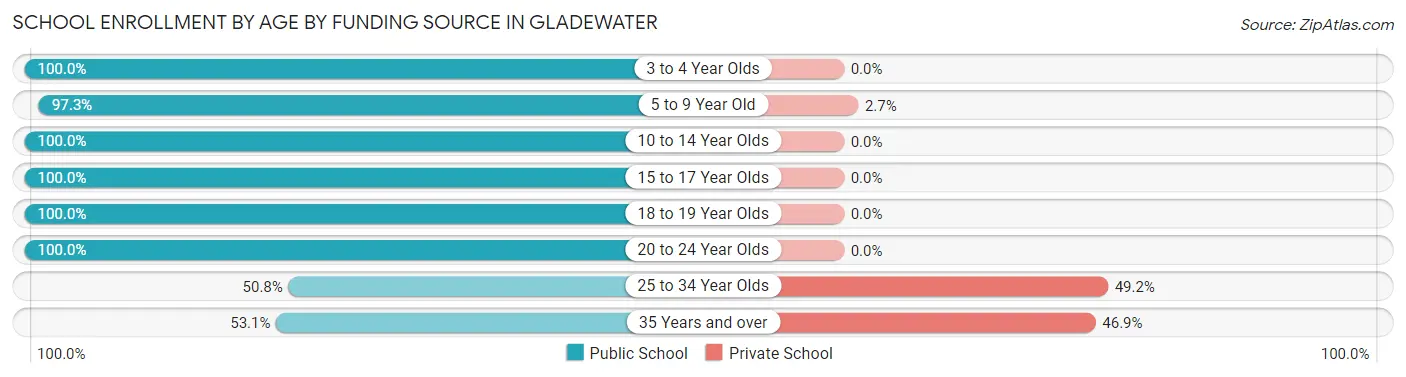
| Age Bracket | Public School | Private School |
| 3 to 4 Year Olds | 134 (100.0%) | 0 (0.0%) |
| 5 to 9 Year Old | 401 (97.3%) | 11 (2.7%) |
| 10 to 14 Year Olds | 742 (100.0%) | 0 (0.0%) |
| 15 to 17 Year Olds | 97 (100.0%) | 0 (0.0%) |
| 18 to 19 Year Olds | 53 (100.0%) | 0 (0.0%) |
| 20 to 24 Year Olds | 74 (100.0%) | 0 (0.0%) |
| 25 to 34 Year Olds | 31 (50.8%) | 30 (49.2%) |
| 35 Years and over | 17 (53.1%) | 15 (46.9%) |
| Total | 1,549 (96.5%) | 56 (3.5%) |
Educational Attainment by Field of Study in Gladewater
Arts & humanities (156 | 29.2%), education (127 | 23.7%), business (88 | 16.5%), visual & performing arts (50 | 9.3%), and engineering (23 | 4.3%) are the most common fields of study among 535 individuals in Gladewater who have obtained a bachelor's degree or higher.
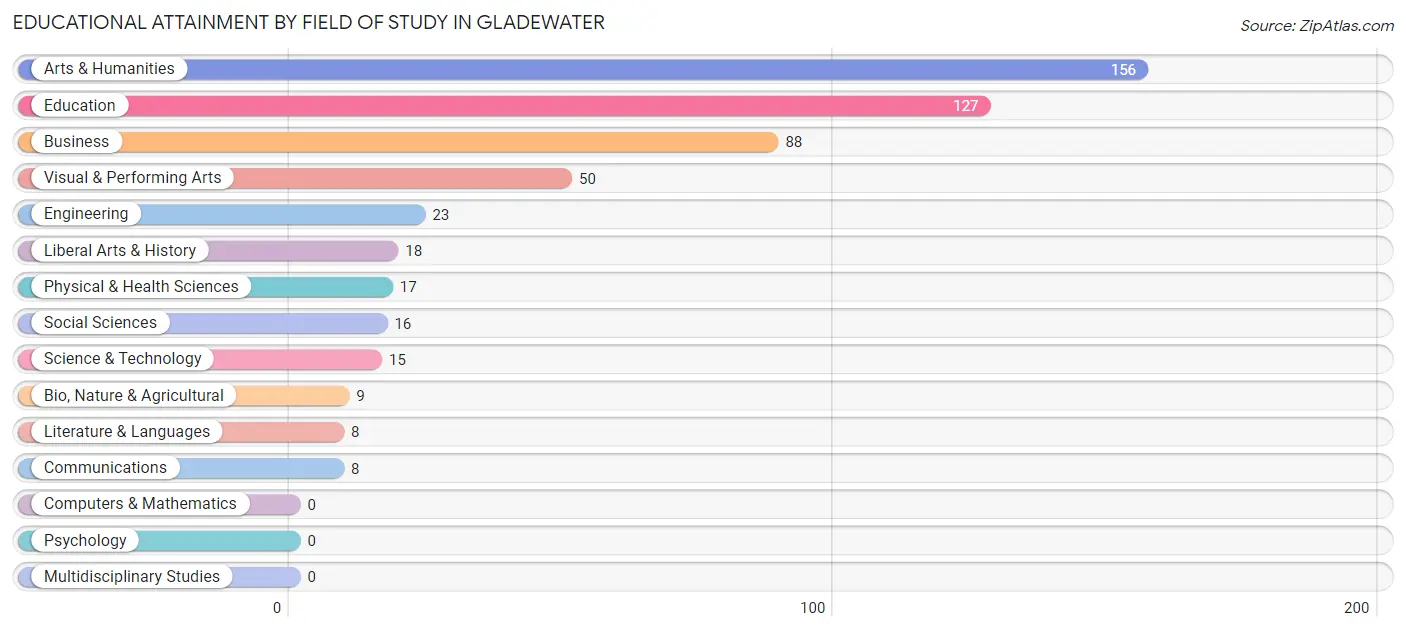
| Field of Study | # Graduates | % Graduates |
| Computers & Mathematics | 0 | 0.0% |
| Bio, Nature & Agricultural | 9 | 1.7% |
| Physical & Health Sciences | 17 | 3.2% |
| Psychology | 0 | 0.0% |
| Social Sciences | 16 | 3.0% |
| Engineering | 23 | 4.3% |
| Multidisciplinary Studies | 0 | 0.0% |
| Science & Technology | 15 | 2.8% |
| Business | 88 | 16.5% |
| Education | 127 | 23.7% |
| Literature & Languages | 8 | 1.5% |
| Liberal Arts & History | 18 | 3.4% |
| Visual & Performing Arts | 50 | 9.3% |
| Communications | 8 | 1.5% |
| Arts & Humanities | 156 | 29.2% |
| Total | 535 | 100.0% |
Transportation & Commute in Gladewater
Vehicle Availability by Sex in Gladewater
The most prevalent vehicle ownership categories in Gladewater are males with 2 vehicles (681, accounting for 61.3%) and females with 2 vehicles (665, making up 55.1%).
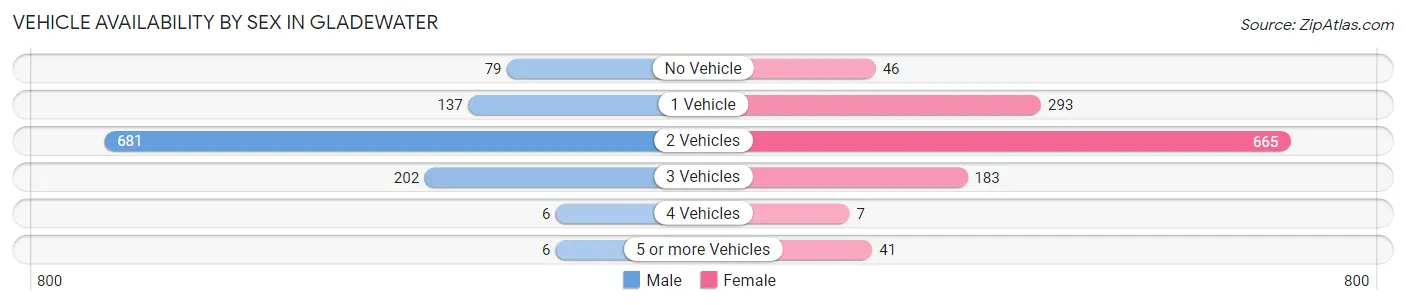
| Vehicles Available | Male | Female |
| No Vehicle | 79 (7.1%) | 46 (3.7%) |
| 1 Vehicle | 137 (12.3%) | 293 (23.7%) |
| 2 Vehicles | 681 (61.3%) | 665 (53.8%) |
| 3 Vehicles | 202 (18.2%) | 183 (14.8%) |
| 4 Vehicles | 6 (0.5%) | 7 (0.6%) |
| 5 or more Vehicles | 6 (0.5%) | 41 (3.3%) |
| Total | 1,111 (100.0%) | 1,235 (100.0%) |
Commute Time in Gladewater
The most frequently occuring commute durations in Gladewater are 15 to 19 minutes (466 commuters, 21.2%), 20 to 24 minutes (412 commuters, 18.8%), and 30 to 34 minutes (403 commuters, 18.3%).
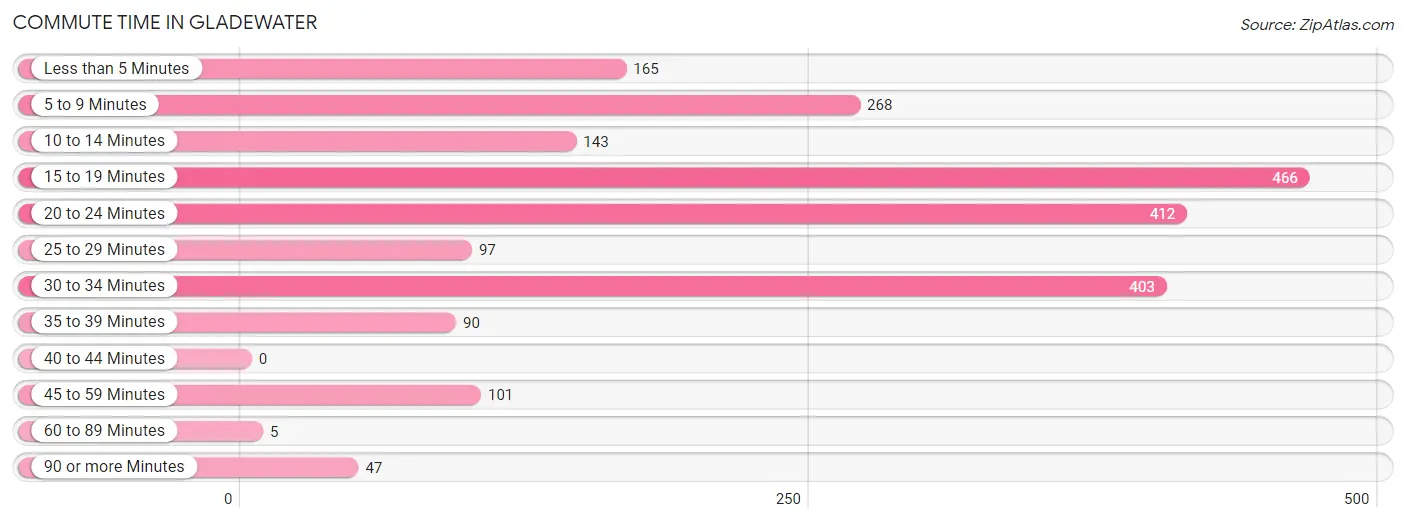
| Commute Time | # Commuters | % Commuters |
| Less than 5 Minutes | 165 | 7.5% |
| 5 to 9 Minutes | 268 | 12.2% |
| 10 to 14 Minutes | 143 | 6.5% |
| 15 to 19 Minutes | 466 | 21.2% |
| 20 to 24 Minutes | 412 | 18.8% |
| 25 to 29 Minutes | 97 | 4.4% |
| 30 to 34 Minutes | 403 | 18.3% |
| 35 to 39 Minutes | 90 | 4.1% |
| 40 to 44 Minutes | 0 | 0.0% |
| 45 to 59 Minutes | 101 | 4.6% |
| 60 to 89 Minutes | 5 | 0.2% |
| 90 or more Minutes | 47 | 2.1% |
Commute Time by Sex in Gladewater
The most common commute times in Gladewater are 15 to 19 minutes (360 commuters, 34.7%) for males and 20 to 24 minutes (263 commuters, 22.7%) for females.
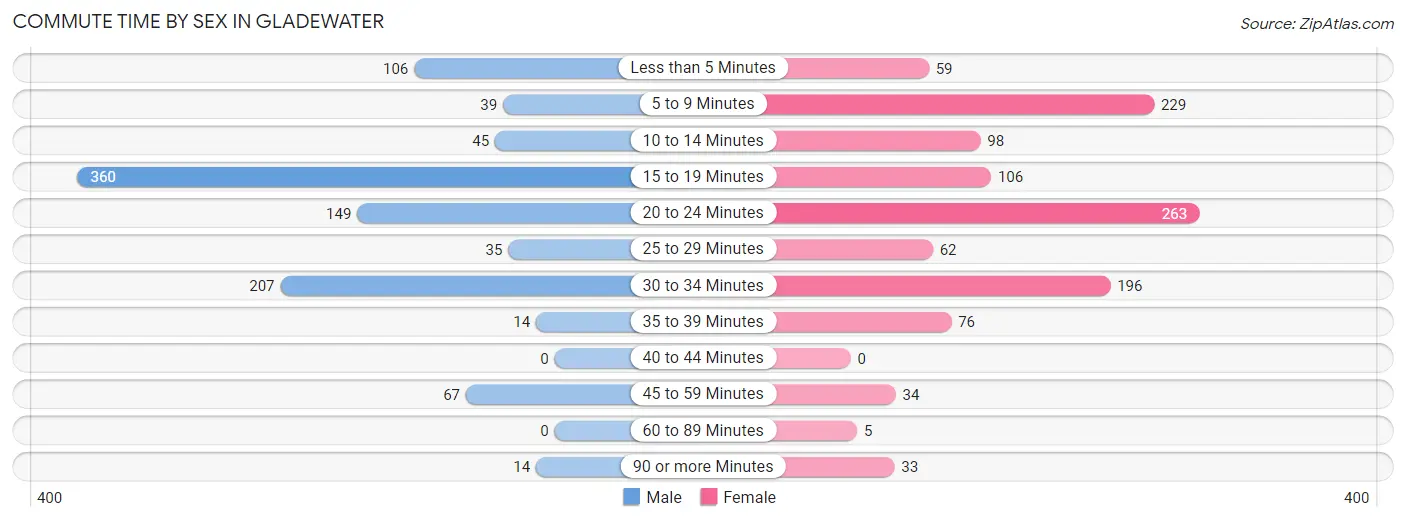
| Commute Time | Male | Female |
| Less than 5 Minutes | 106 (10.2%) | 59 (5.1%) |
| 5 to 9 Minutes | 39 (3.8%) | 229 (19.7%) |
| 10 to 14 Minutes | 45 (4.3%) | 98 (8.4%) |
| 15 to 19 Minutes | 360 (34.7%) | 106 (9.1%) |
| 20 to 24 Minutes | 149 (14.4%) | 263 (22.7%) |
| 25 to 29 Minutes | 35 (3.4%) | 62 (5.3%) |
| 30 to 34 Minutes | 207 (20.0%) | 196 (16.9%) |
| 35 to 39 Minutes | 14 (1.3%) | 76 (6.6%) |
| 40 to 44 Minutes | 0 (0.0%) | 0 (0.0%) |
| 45 to 59 Minutes | 67 (6.5%) | 34 (2.9%) |
| 60 to 89 Minutes | 0 (0.0%) | 5 (0.4%) |
| 90 or more Minutes | 14 (1.3%) | 33 (2.8%) |
Time of Departure to Work by Sex in Gladewater
The most frequent times of departure to work in Gladewater are 7:30 AM to 7:59 AM (290, 28.0%) for males and 5:30 AM to 5:59 AM (194, 16.7%) for females.
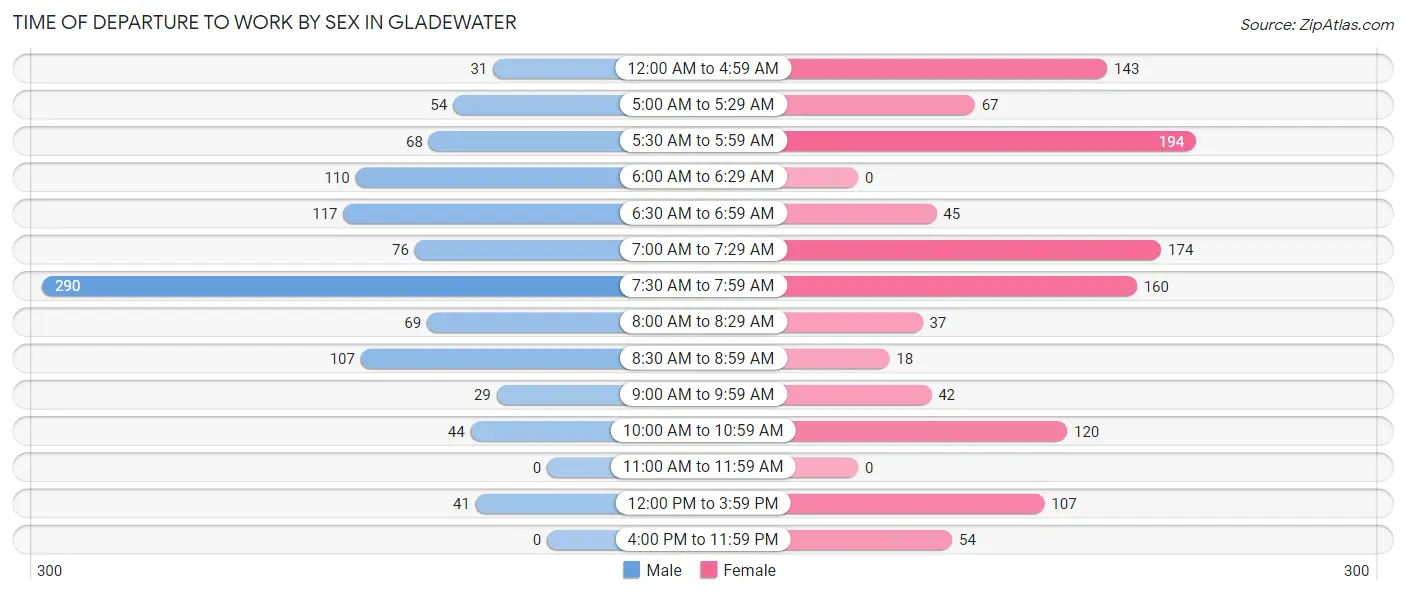
| Time of Departure | Male | Female |
| 12:00 AM to 4:59 AM | 31 (3.0%) | 143 (12.3%) |
| 5:00 AM to 5:29 AM | 54 (5.2%) | 67 (5.8%) |
| 5:30 AM to 5:59 AM | 68 (6.6%) | 194 (16.7%) |
| 6:00 AM to 6:29 AM | 110 (10.6%) | 0 (0.0%) |
| 6:30 AM to 6:59 AM | 117 (11.3%) | 45 (3.9%) |
| 7:00 AM to 7:29 AM | 76 (7.3%) | 174 (15.0%) |
| 7:30 AM to 7:59 AM | 290 (28.0%) | 160 (13.8%) |
| 8:00 AM to 8:29 AM | 69 (6.7%) | 37 (3.2%) |
| 8:30 AM to 8:59 AM | 107 (10.3%) | 18 (1.5%) |
| 9:00 AM to 9:59 AM | 29 (2.8%) | 42 (3.6%) |
| 10:00 AM to 10:59 AM | 44 (4.3%) | 120 (10.3%) |
| 11:00 AM to 11:59 AM | 0 (0.0%) | 0 (0.0%) |
| 12:00 PM to 3:59 PM | 41 (4.0%) | 107 (9.2%) |
| 4:00 PM to 11:59 PM | 0 (0.0%) | 54 (4.6%) |
| Total | 1,036 (100.0%) | 1,161 (100.0%) |
Housing Occupancy in Gladewater
Occupancy by Ownership in Gladewater
Of the total 2,230 dwellings in Gladewater, owner-occupied units account for 1,253 (56.2%), while renter-occupied units make up 977 (43.8%).
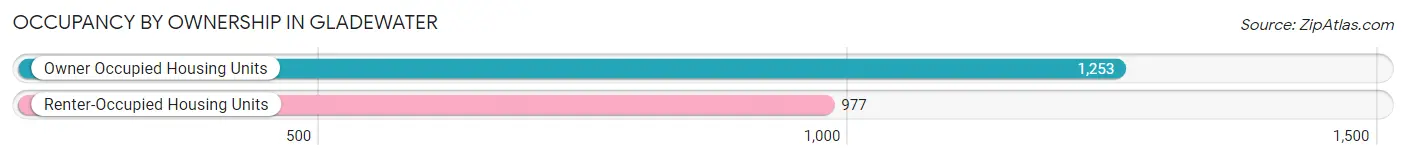
| Occupancy | # Housing Units | % Housing Units |
| Owner Occupied Housing Units | 1,253 | 56.2% |
| Renter-Occupied Housing Units | 977 | 43.8% |
| Total Occupied Housing Units | 2,230 | 100.0% |
Occupancy by Household Size in Gladewater
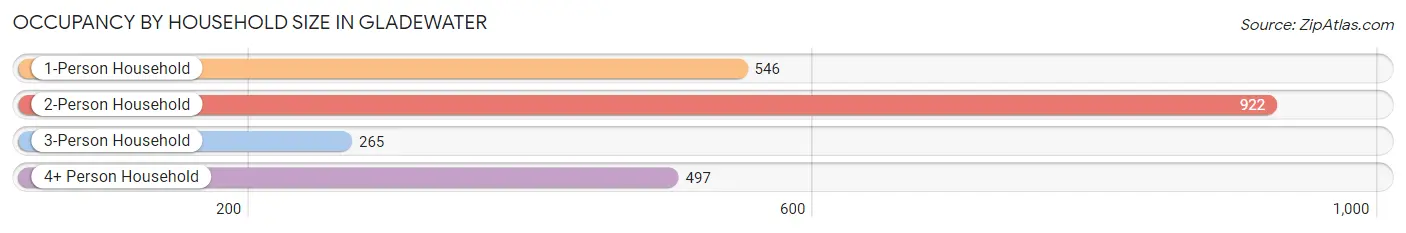
| Household Size | # Housing Units | % Housing Units |
| 1-Person Household | 546 | 24.5% |
| 2-Person Household | 922 | 41.3% |
| 3-Person Household | 265 | 11.9% |
| 4+ Person Household | 497 | 22.3% |
| Total Housing Units | 2,230 | 100.0% |
Occupancy by Ownership by Household Size in Gladewater
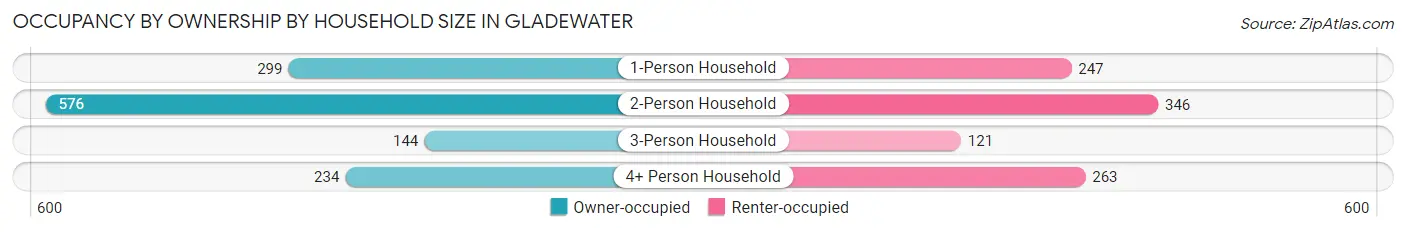
| Household Size | Owner-occupied | Renter-occupied |
| 1-Person Household | 299 (54.8%) | 247 (45.2%) |
| 2-Person Household | 576 (62.5%) | 346 (37.5%) |
| 3-Person Household | 144 (54.3%) | 121 (45.7%) |
| 4+ Person Household | 234 (47.1%) | 263 (52.9%) |
| Total Housing Units | 1,253 (56.2%) | 977 (43.8%) |
Occupancy by Educational Attainment in Gladewater
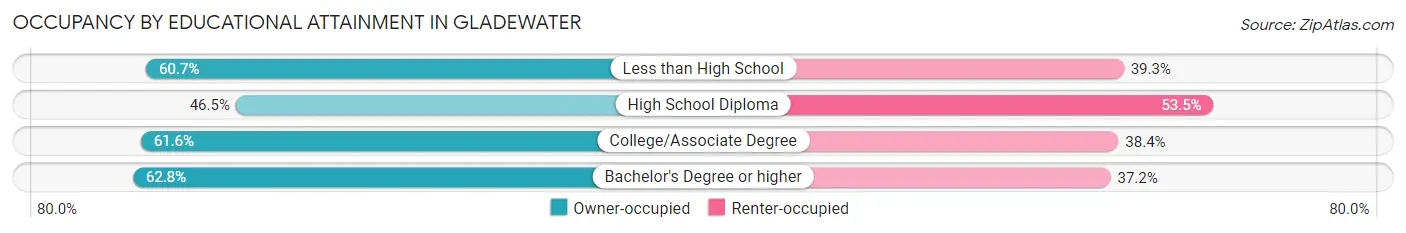
| Household Size | Owner-occupied | Renter-occupied |
| Less than High School | 198 (60.7%) | 128 (39.3%) |
| High School Diploma | 373 (46.5%) | 429 (53.5%) |
| College/Associate Degree | 508 (61.6%) | 317 (38.4%) |
| Bachelor's Degree or higher | 174 (62.8%) | 103 (37.2%) |
Occupancy by Age of Householder in Gladewater
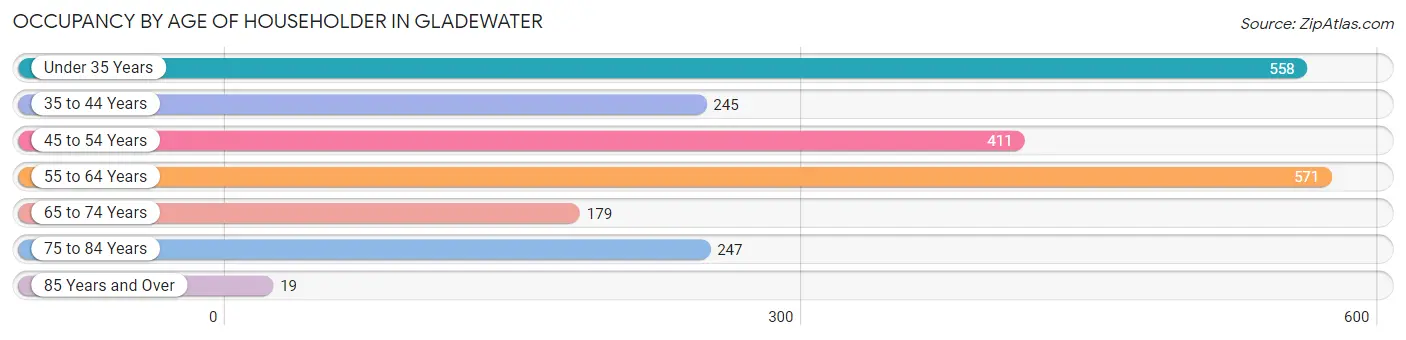
| Age Bracket | # Households | % Households |
| Under 35 Years | 558 | 25.0% |
| 35 to 44 Years | 245 | 11.0% |
| 45 to 54 Years | 411 | 18.4% |
| 55 to 64 Years | 571 | 25.6% |
| 65 to 74 Years | 179 | 8.0% |
| 75 to 84 Years | 247 | 11.1% |
| 85 Years and Over | 19 | 0.9% |
| Total | 2,230 | 100.0% |
Housing Finances in Gladewater
Median Income by Occupancy in Gladewater
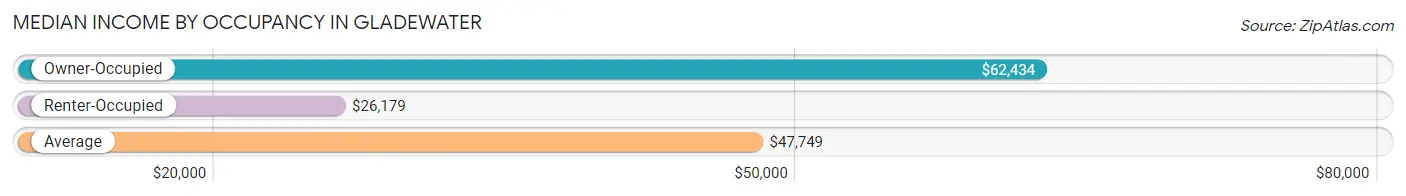
| Occupancy Type | # Households | Median Income |
| Owner-Occupied | 1,253 (56.2%) | $62,434 |
| Renter-Occupied | 977 (43.8%) | $26,179 |
| Average | 2,230 (100.0%) | $47,749 |
Occupancy by Householder Income Bracket in Gladewater
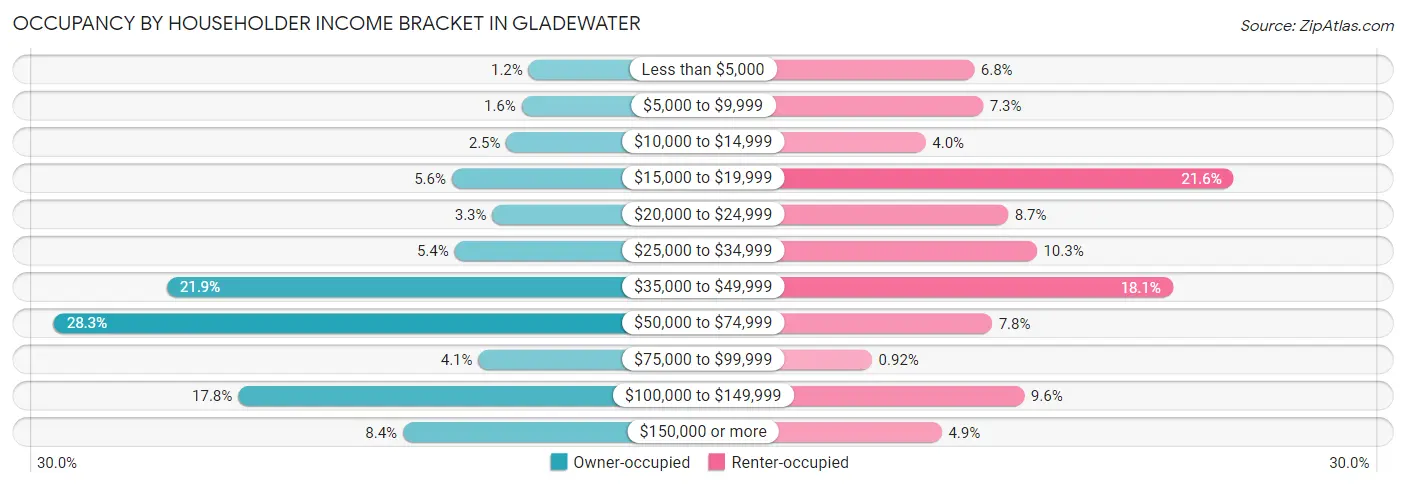
| Income Bracket | Owner-occupied | Renter-occupied |
| Less than $5,000 | 15 (1.2%) | 66 (6.8%) |
| $5,000 to $9,999 | 20 (1.6%) | 71 (7.3%) |
| $10,000 to $14,999 | 31 (2.5%) | 39 (4.0%) |
| $15,000 to $19,999 | 70 (5.6%) | 211 (21.6%) |
| $20,000 to $24,999 | 41 (3.3%) | 85 (8.7%) |
| $25,000 to $34,999 | 68 (5.4%) | 101 (10.3%) |
| $35,000 to $49,999 | 274 (21.9%) | 177 (18.1%) |
| $50,000 to $74,999 | 355 (28.3%) | 76 (7.8%) |
| $75,000 to $99,999 | 51 (4.1%) | 9 (0.9%) |
| $100,000 to $149,999 | 223 (17.8%) | 94 (9.6%) |
| $150,000 or more | 105 (8.4%) | 48 (4.9%) |
| Total | 1,253 (100.0%) | 977 (100.0%) |
Monthly Housing Cost Tiers in Gladewater
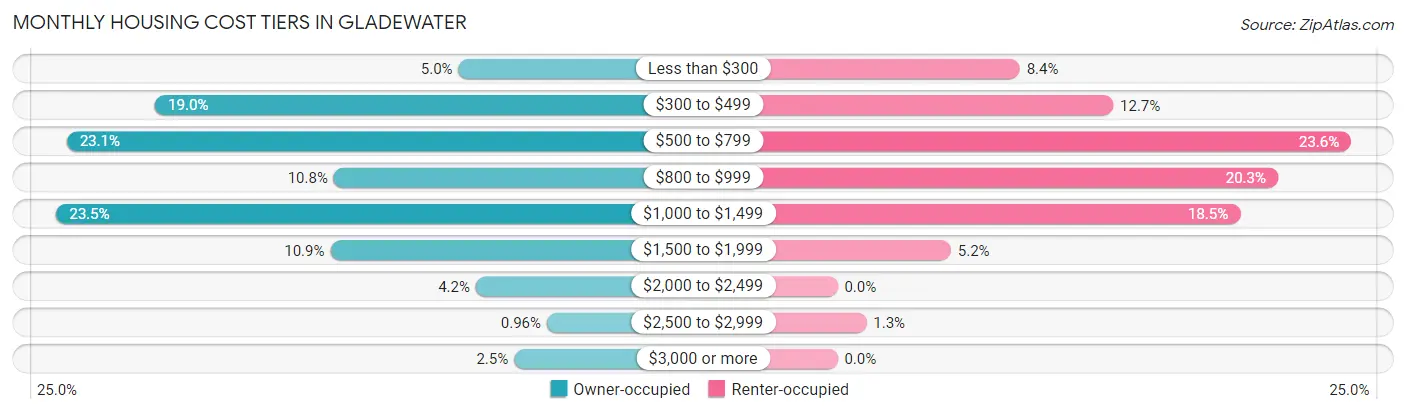
| Monthly Cost | Owner-occupied | Renter-occupied |
| Less than $300 | 63 (5.0%) | 82 (8.4%) |
| $300 to $499 | 238 (19.0%) | 124 (12.7%) |
| $500 to $799 | 289 (23.1%) | 231 (23.6%) |
| $800 to $999 | 135 (10.8%) | 198 (20.3%) |
| $1,000 to $1,499 | 295 (23.5%) | 181 (18.5%) |
| $1,500 to $1,999 | 137 (10.9%) | 51 (5.2%) |
| $2,000 to $2,499 | 53 (4.2%) | 0 (0.0%) |
| $2,500 to $2,999 | 12 (1.0%) | 13 (1.3%) |
| $3,000 or more | 31 (2.5%) | 0 (0.0%) |
| Total | 1,253 (100.0%) | 977 (100.0%) |
Physical Housing Characteristics in Gladewater
Housing Structures in Gladewater
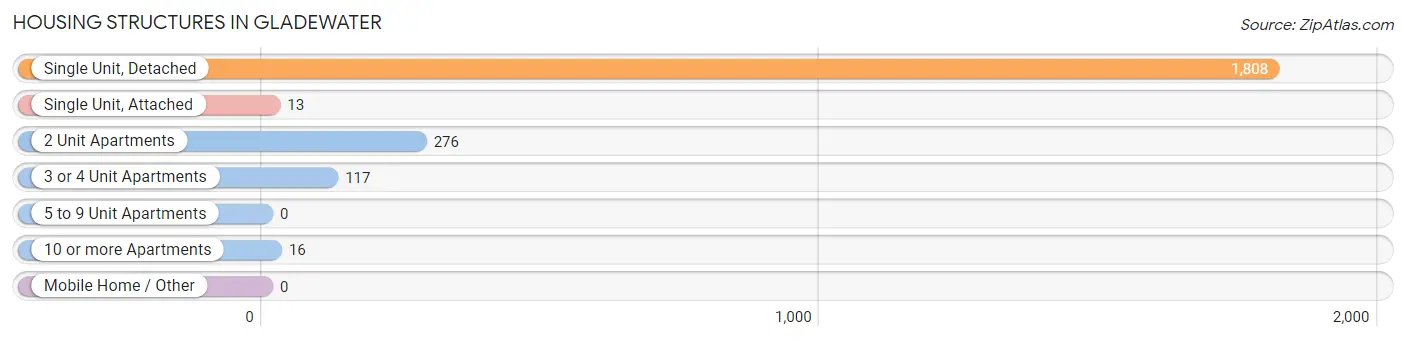
| Structure Type | # Housing Units | % Housing Units |
| Single Unit, Detached | 1,808 | 81.1% |
| Single Unit, Attached | 13 | 0.6% |
| 2 Unit Apartments | 276 | 12.4% |
| 3 or 4 Unit Apartments | 117 | 5.2% |
| 5 to 9 Unit Apartments | 0 | 0.0% |
| 10 or more Apartments | 16 | 0.7% |
| Mobile Home / Other | 0 | 0.0% |
| Total | 2,230 | 100.0% |
Housing Structures by Occupancy in Gladewater
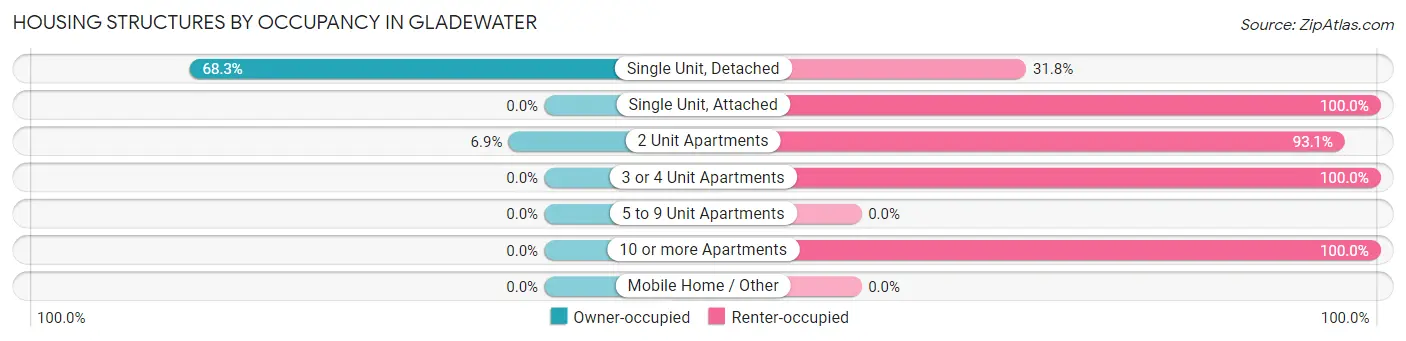
| Structure Type | Owner-occupied | Renter-occupied |
| Single Unit, Detached | 1,234 (68.2%) | 574 (31.8%) |
| Single Unit, Attached | 0 (0.0%) | 13 (100.0%) |
| 2 Unit Apartments | 19 (6.9%) | 257 (93.1%) |
| 3 or 4 Unit Apartments | 0 (0.0%) | 117 (100.0%) |
| 5 to 9 Unit Apartments | 0 (0.0%) | 0 (0.0%) |
| 10 or more Apartments | 0 (0.0%) | 16 (100.0%) |
| Mobile Home / Other | 0 (0.0%) | 0 (0.0%) |
| Total | 1,253 (56.2%) | 977 (43.8%) |
Housing Structures by Number of Rooms in Gladewater
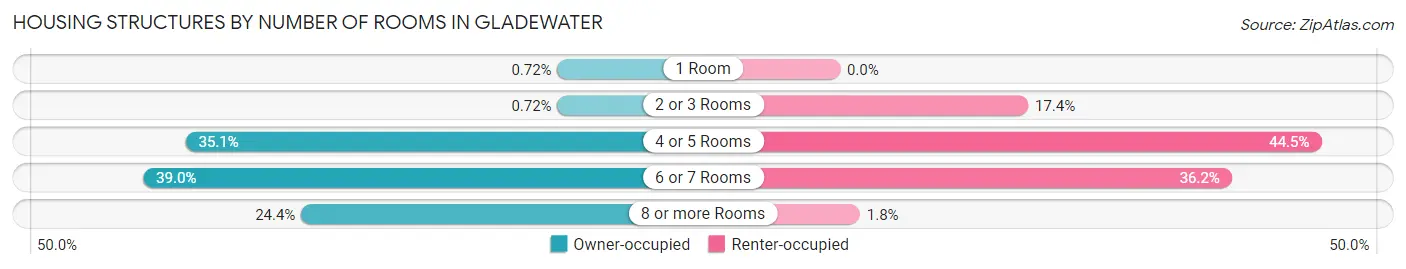
| Number of Rooms | Owner-occupied | Renter-occupied |
| 1 Room | 9 (0.7%) | 0 (0.0%) |
| 2 or 3 Rooms | 9 (0.7%) | 170 (17.4%) |
| 4 or 5 Rooms | 440 (35.1%) | 435 (44.5%) |
| 6 or 7 Rooms | 489 (39.0%) | 354 (36.2%) |
| 8 or more Rooms | 306 (24.4%) | 18 (1.8%) |
| Total | 1,253 (100.0%) | 977 (100.0%) |
Housing Structure by Heating Type in Gladewater
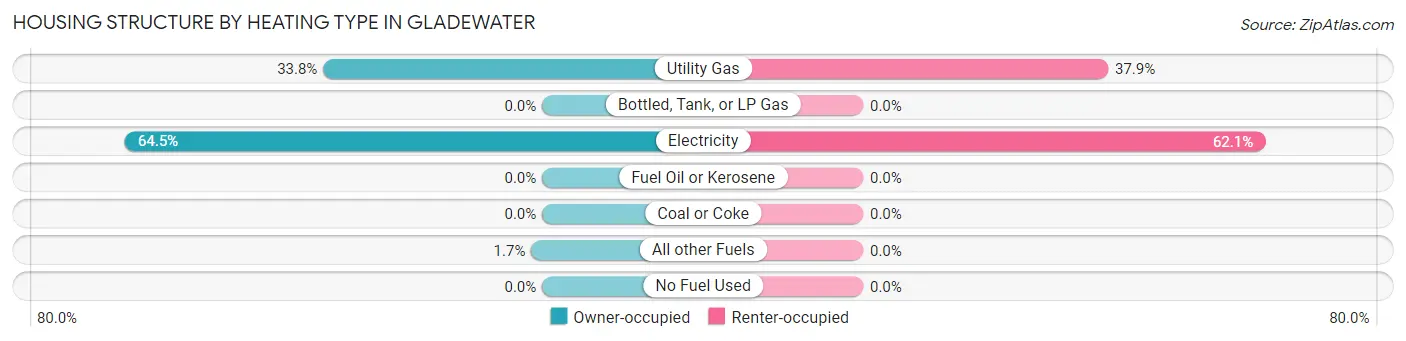
| Heating Type | Owner-occupied | Renter-occupied |
| Utility Gas | 424 (33.8%) | 370 (37.9%) |
| Bottled, Tank, or LP Gas | 0 (0.0%) | 0 (0.0%) |
| Electricity | 808 (64.5%) | 607 (62.1%) |
| Fuel Oil or Kerosene | 0 (0.0%) | 0 (0.0%) |
| Coal or Coke | 0 (0.0%) | 0 (0.0%) |
| All other Fuels | 21 (1.7%) | 0 (0.0%) |
| No Fuel Used | 0 (0.0%) | 0 (0.0%) |
| Total | 1,253 (100.0%) | 977 (100.0%) |
Household Vehicle Usage in Gladewater
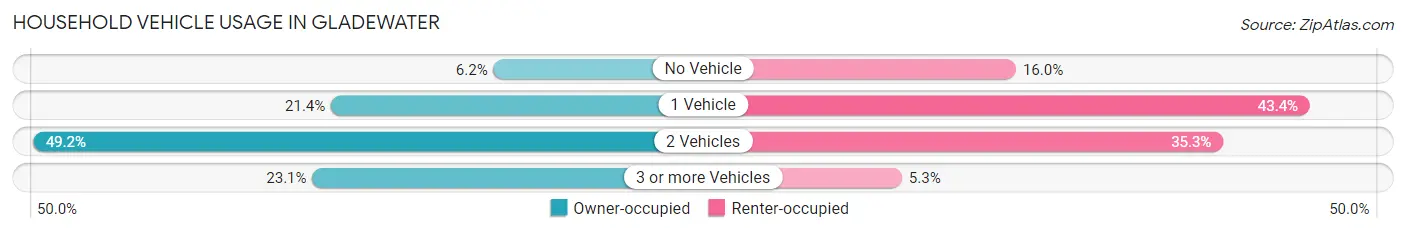
| Vehicles per Household | Owner-occupied | Renter-occupied |
| No Vehicle | 78 (6.2%) | 156 (16.0%) |
| 1 Vehicle | 268 (21.4%) | 424 (43.4%) |
| 2 Vehicles | 617 (49.2%) | 345 (35.3%) |
| 3 or more Vehicles | 290 (23.1%) | 52 (5.3%) |
| Total | 1,253 (100.0%) | 977 (100.0%) |
Real Estate & Mortgages in Gladewater
Real Estate and Mortgage Overview in Gladewater
| Characteristic | Without Mortgage | With Mortgage |
| Housing Units | 618 | 635 |
| Median Property Value | $114,600 | $159,900 |
| Median Household Income | $53,553 | $56 |
| Monthly Housing Costs | $513 | $12 |
| Real Estate Taxes | $1,282 | $73 |
Property Value by Mortgage Status in Gladewater
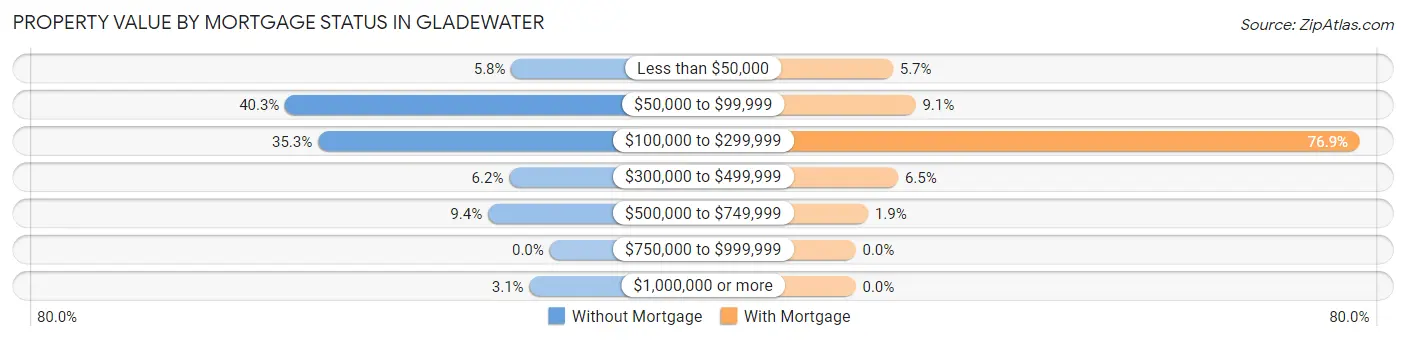
| Property Value | Without Mortgage | With Mortgage |
| Less than $50,000 | 36 (5.8%) | 36 (5.7%) |
| $50,000 to $99,999 | 249 (40.3%) | 58 (9.1%) |
| $100,000 to $299,999 | 218 (35.3%) | 488 (76.8%) |
| $300,000 to $499,999 | 38 (6.1%) | 41 (6.5%) |
| $500,000 to $749,999 | 58 (9.4%) | 12 (1.9%) |
| $750,000 to $999,999 | 0 (0.0%) | 0 (0.0%) |
| $1,000,000 or more | 19 (3.1%) | 0 (0.0%) |
| Total | 618 (100.0%) | 635 (100.0%) |
Household Income by Mortgage Status in Gladewater
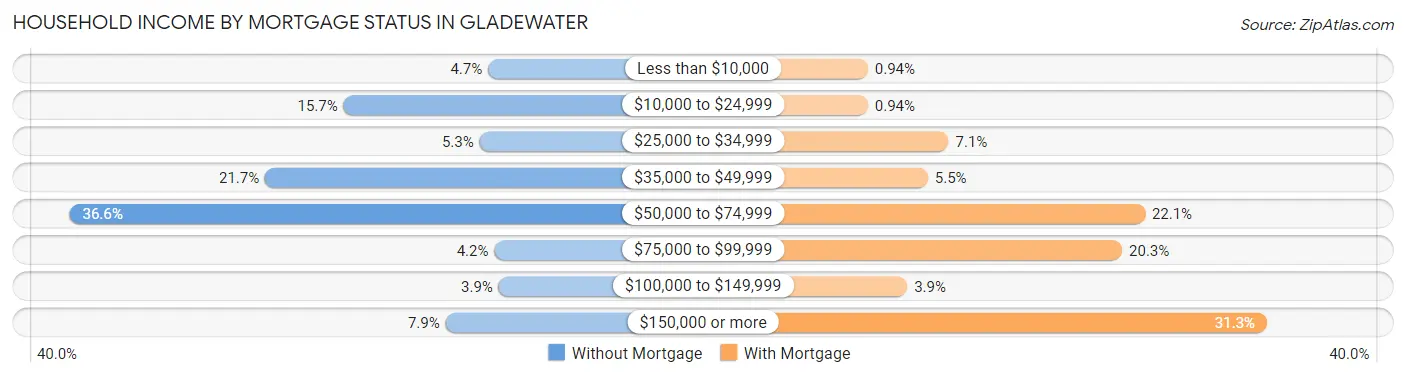
| Household Income | Without Mortgage | With Mortgage |
| Less than $10,000 | 29 (4.7%) | 6 (0.9%) |
| $10,000 to $24,999 | 97 (15.7%) | 6 (0.9%) |
| $25,000 to $34,999 | 33 (5.3%) | 45 (7.1%) |
| $35,000 to $49,999 | 134 (21.7%) | 35 (5.5%) |
| $50,000 to $74,999 | 226 (36.6%) | 140 (22.1%) |
| $75,000 to $99,999 | 26 (4.2%) | 129 (20.3%) |
| $100,000 to $149,999 | 24 (3.9%) | 25 (3.9%) |
| $150,000 or more | 49 (7.9%) | 199 (31.3%) |
| Total | 618 (100.0%) | 635 (100.0%) |
Property Value to Household Income Ratio in Gladewater
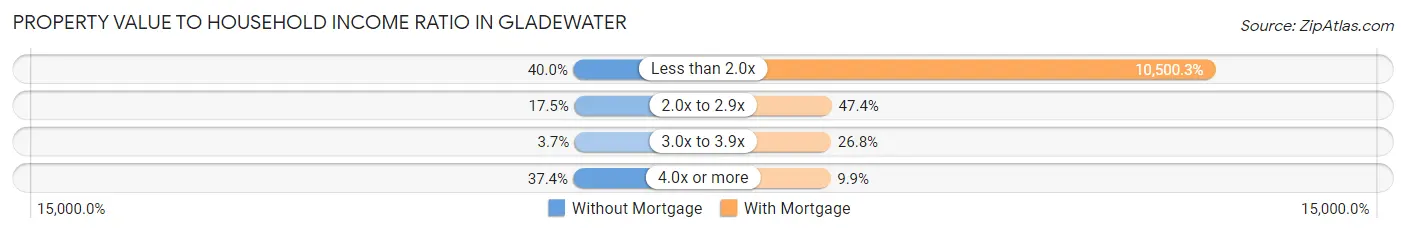
| Value-to-Income Ratio | Without Mortgage | With Mortgage |
| Less than 2.0x | 247 (40.0%) | 66,677 (10,500.3%) |
| 2.0x to 2.9x | 108 (17.5%) | 301 (47.4%) |
| 3.0x to 3.9x | 23 (3.7%) | 170 (26.8%) |
| 4.0x or more | 231 (37.4%) | 63 (9.9%) |
| Total | 618 (100.0%) | 635 (100.0%) |
Real Estate Taxes by Mortgage Status in Gladewater
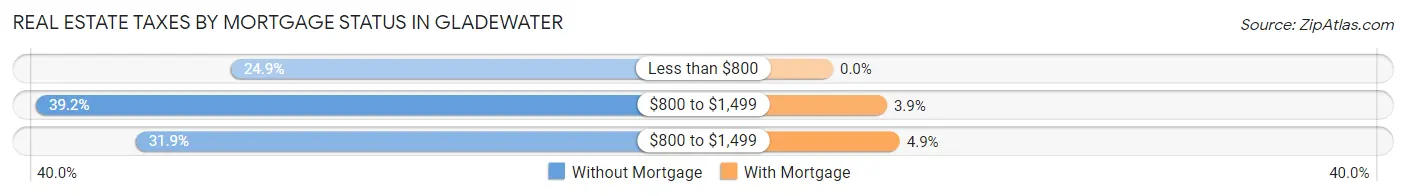
| Property Taxes | Without Mortgage | With Mortgage |
| Less than $800 | 154 (24.9%) | 0 (0.0%) |
| $800 to $1,499 | 242 (39.2%) | 25 (3.9%) |
| $800 to $1,499 | 197 (31.9%) | 31 (4.9%) |
| Total | 618 (100.0%) | 635 (100.0%) |
Health & Disability in Gladewater
Health Insurance Coverage by Age in Gladewater
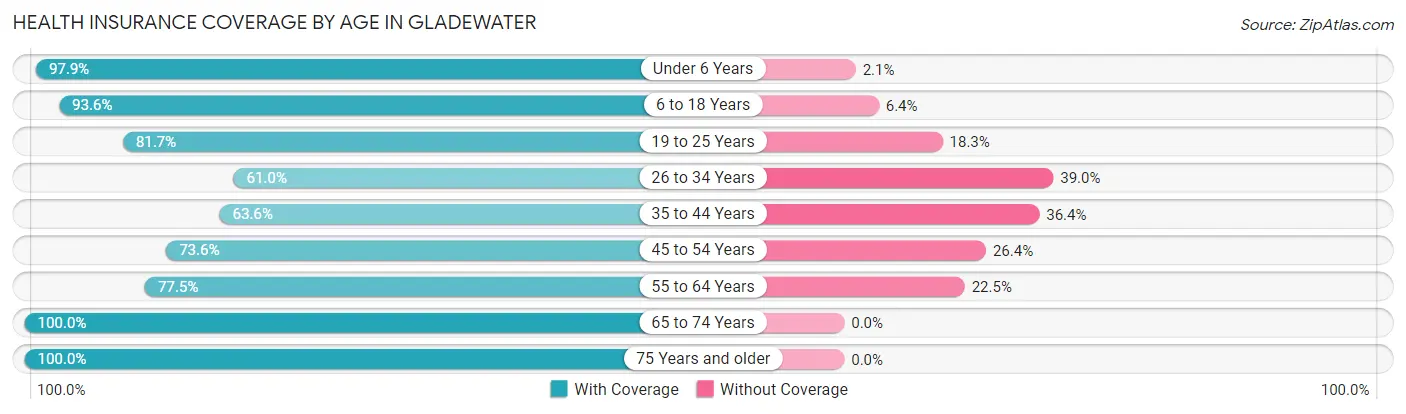
| Age Bracket | With Coverage | Without Coverage |
| Under 6 Years | 783 (97.9%) | 17 (2.1%) |
| 6 to 18 Years | 1,150 (93.6%) | 79 (6.4%) |
| 19 to 25 Years | 303 (81.7%) | 68 (18.3%) |
| 26 to 34 Years | 487 (61.0%) | 311 (39.0%) |
| 35 to 44 Years | 385 (63.6%) | 220 (36.4%) |
| 45 to 54 Years | 440 (73.6%) | 158 (26.4%) |
| 55 to 64 Years | 663 (77.5%) | 192 (22.5%) |
| 65 to 74 Years | 339 (100.0%) | 0 (0.0%) |
| 75 Years and older | 341 (100.0%) | 0 (0.0%) |
| Total | 4,891 (82.4%) | 1,045 (17.6%) |
Health Insurance Coverage by Citizenship Status in Gladewater
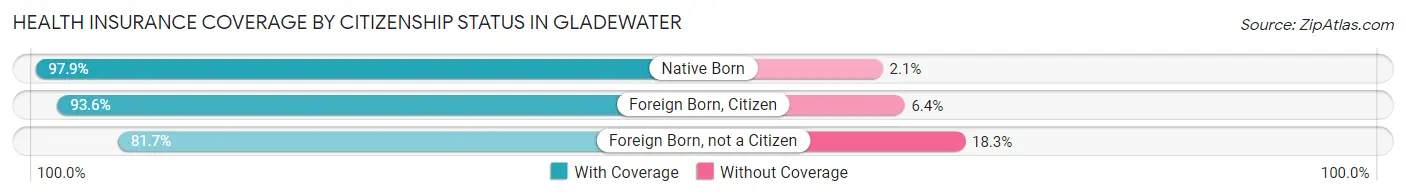
| Citizenship Status | With Coverage | Without Coverage |
| Native Born | 783 (97.9%) | 17 (2.1%) |
| Foreign Born, Citizen | 1,150 (93.6%) | 79 (6.4%) |
| Foreign Born, not a Citizen | 303 (81.7%) | 68 (18.3%) |
Health Insurance Coverage by Household Income in Gladewater
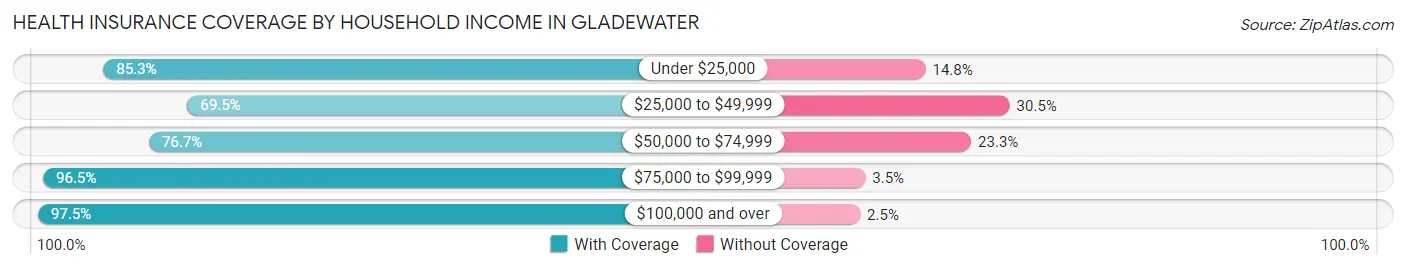
| Household Income | With Coverage | Without Coverage |
| Under $25,000 | 1,318 (85.3%) | 228 (14.7%) |
| $25,000 to $49,999 | 1,157 (69.5%) | 508 (30.5%) |
| $50,000 to $74,999 | 882 (76.7%) | 268 (23.3%) |
| $75,000 to $99,999 | 195 (96.5%) | 7 (3.5%) |
| $100,000 and over | 1,328 (97.5%) | 34 (2.5%) |
Public vs Private Health Insurance Coverage by Age in Gladewater
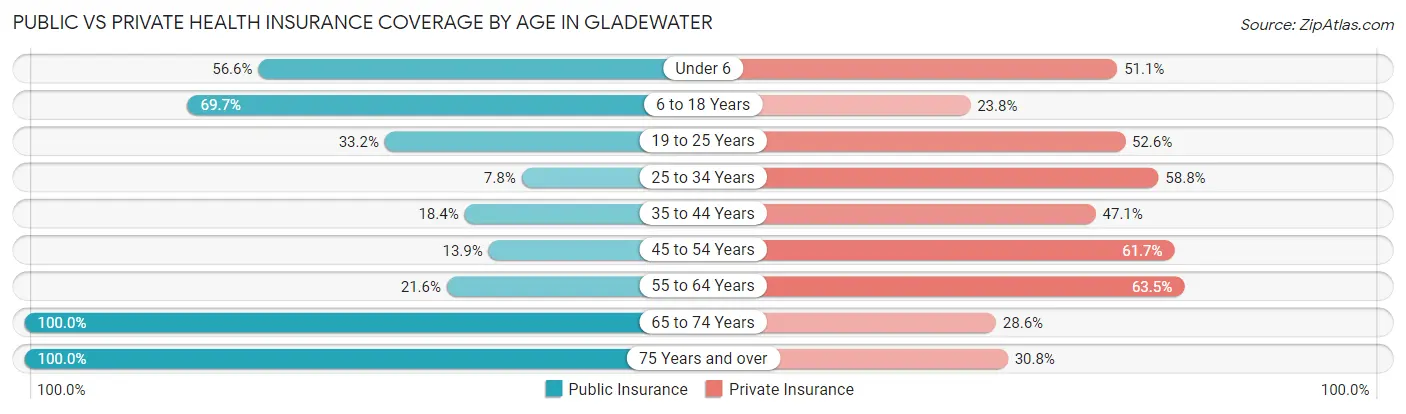
| Age Bracket | Public Insurance | Private Insurance |
| Under 6 | 453 (56.6%) | 409 (51.1%) |
| 6 to 18 Years | 857 (69.7%) | 293 (23.8%) |
| 19 to 25 Years | 123 (33.2%) | 195 (52.6%) |
| 25 to 34 Years | 62 (7.8%) | 469 (58.8%) |
| 35 to 44 Years | 111 (18.3%) | 285 (47.1%) |
| 45 to 54 Years | 83 (13.9%) | 369 (61.7%) |
| 55 to 64 Years | 185 (21.6%) | 543 (63.5%) |
| 65 to 74 Years | 339 (100.0%) | 97 (28.6%) |
| 75 Years and over | 341 (100.0%) | 105 (30.8%) |
| Total | 2,554 (43.0%) | 2,765 (46.6%) |
Disability Status by Sex by Age in Gladewater
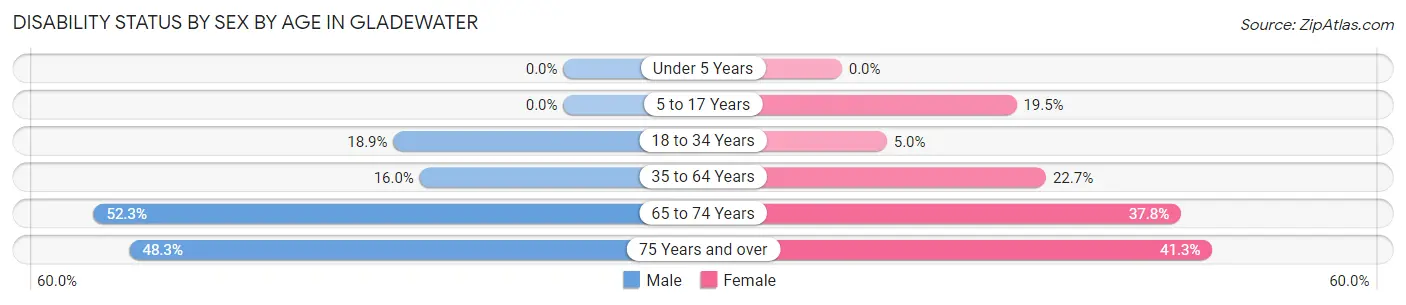
| Age Bracket | Male | Female |
| Under 5 Years | 0 (0.0%) | 0 (0.0%) |
| 5 to 17 Years | 0 (0.0%) | 155 (19.5%) |
| 18 to 34 Years | 103 (18.9%) | 35 (5.0%) |
| 35 to 64 Years | 147 (16.0%) | 259 (22.7%) |
| 65 to 74 Years | 79 (52.3%) | 71 (37.8%) |
| 75 Years and over | 57 (48.3%) | 92 (41.3%) |
Disability Class by Sex by Age in Gladewater
Disability Class: Hearing Difficulty
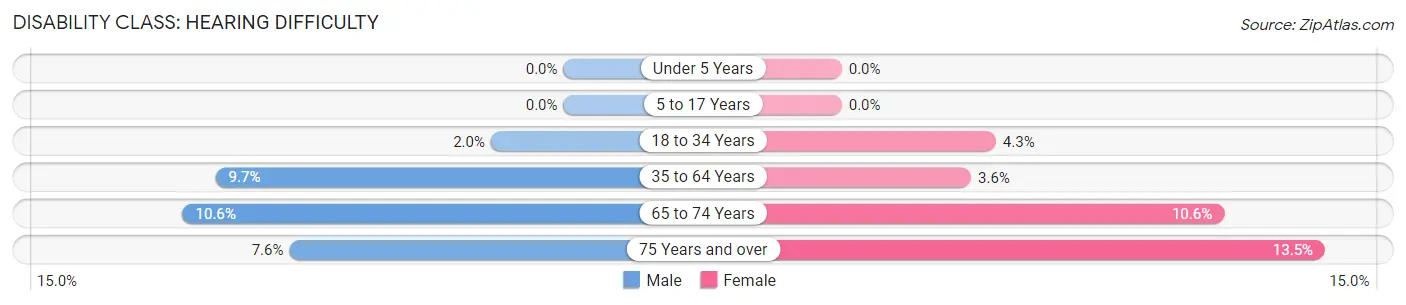
| Age Bracket | Male | Female |
| Under 5 Years | 0 (0.0%) | 0 (0.0%) |
| 5 to 17 Years | 0 (0.0%) | 0 (0.0%) |
| 18 to 34 Years | 11 (2.0%) | 30 (4.3%) |
| 35 to 64 Years | 89 (9.7%) | 41 (3.6%) |
| 65 to 74 Years | 16 (10.6%) | 20 (10.6%) |
| 75 Years and over | 9 (7.6%) | 30 (13.5%) |
Disability Class: Vision Difficulty
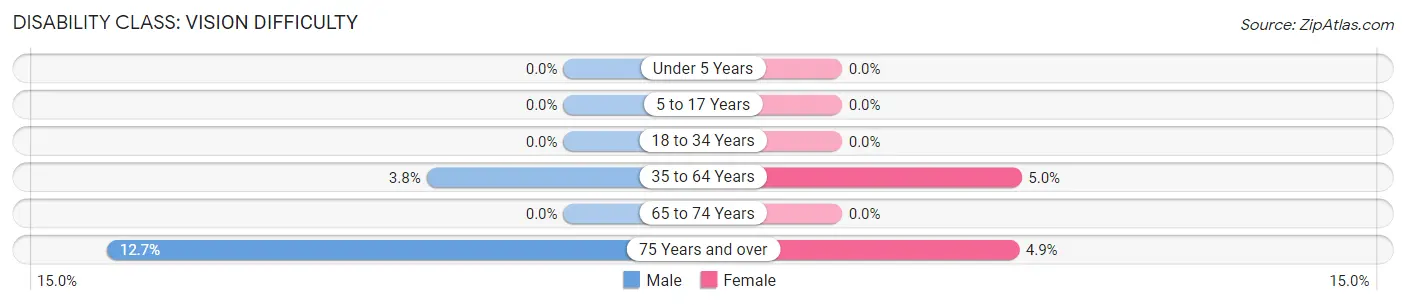
| Age Bracket | Male | Female |
| Under 5 Years | 0 (0.0%) | 0 (0.0%) |
| 5 to 17 Years | 0 (0.0%) | 0 (0.0%) |
| 18 to 34 Years | 0 (0.0%) | 0 (0.0%) |
| 35 to 64 Years | 35 (3.8%) | 57 (5.0%) |
| 65 to 74 Years | 0 (0.0%) | 0 (0.0%) |
| 75 Years and over | 15 (12.7%) | 11 (4.9%) |
Disability Class: Cognitive Difficulty
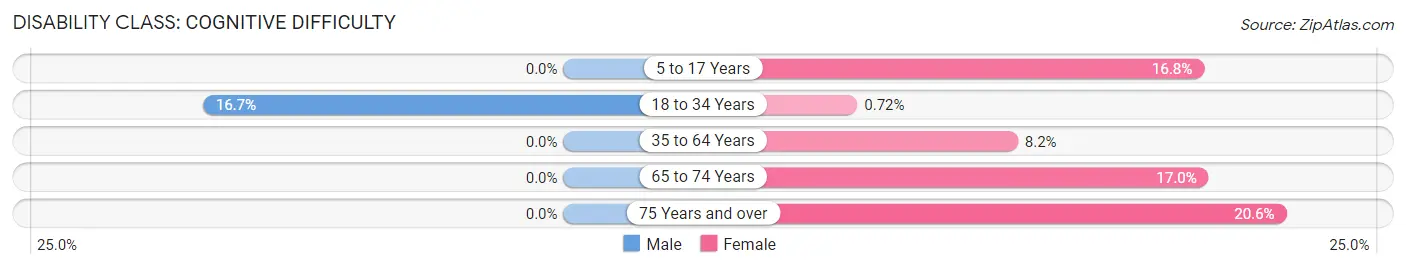
| Age Bracket | Male | Female |
| 5 to 17 Years | 0 (0.0%) | 134 (16.8%) |
| 18 to 34 Years | 91 (16.7%) | 5 (0.7%) |
| 35 to 64 Years | 0 (0.0%) | 93 (8.2%) |
| 65 to 74 Years | 0 (0.0%) | 32 (17.0%) |
| 75 Years and over | 0 (0.0%) | 46 (20.6%) |
Disability Class: Ambulatory Difficulty
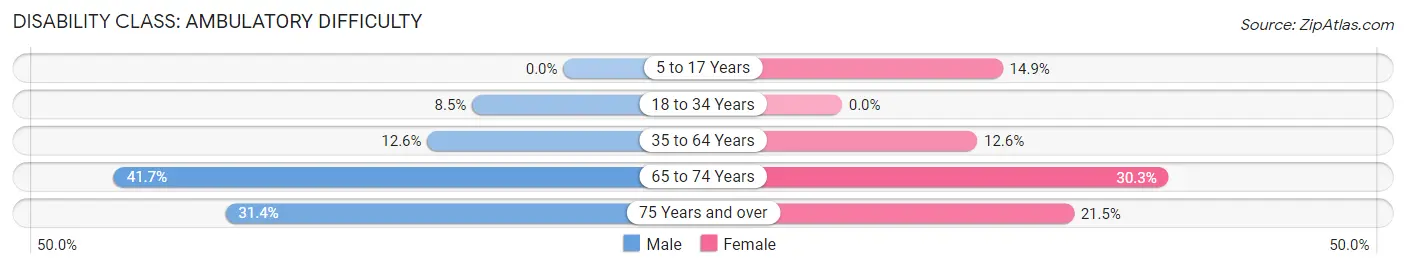
| Age Bracket | Male | Female |
| 5 to 17 Years | 0 (0.0%) | 119 (14.9%) |
| 18 to 34 Years | 46 (8.5%) | 0 (0.0%) |
| 35 to 64 Years | 116 (12.6%) | 143 (12.6%) |
| 65 to 74 Years | 63 (41.7%) | 57 (30.3%) |
| 75 Years and over | 37 (31.4%) | 48 (21.5%) |
Disability Class: Self-Care Difficulty
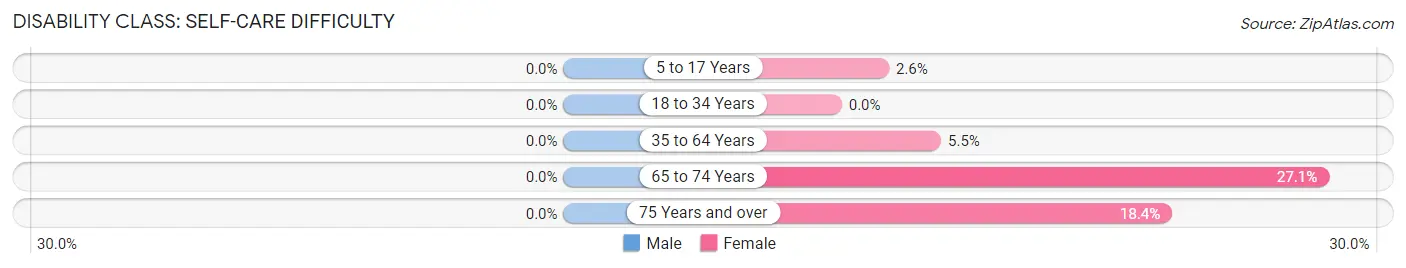
| Age Bracket | Male | Female |
| 5 to 17 Years | 0 (0.0%) | 21 (2.6%) |
| 18 to 34 Years | 0 (0.0%) | 0 (0.0%) |
| 35 to 64 Years | 0 (0.0%) | 63 (5.5%) |
| 65 to 74 Years | 0 (0.0%) | 51 (27.1%) |
| 75 Years and over | 0 (0.0%) | 41 (18.4%) |
Technology Access in Gladewater
Computing Device Access in Gladewater
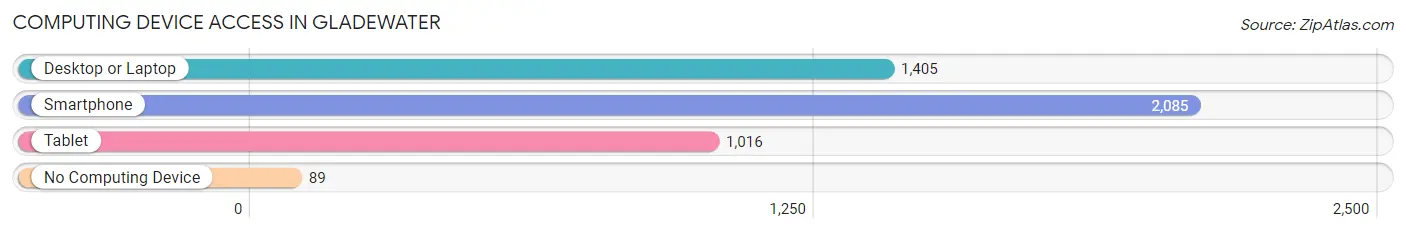
| Device Type | # Households | % Households |
| Desktop or Laptop | 1,405 | 63.0% |
| Smartphone | 2,085 | 93.5% |
| Tablet | 1,016 | 45.6% |
| No Computing Device | 89 | 4.0% |
| Total | 2,230 | 100.0% |
Internet Access in Gladewater
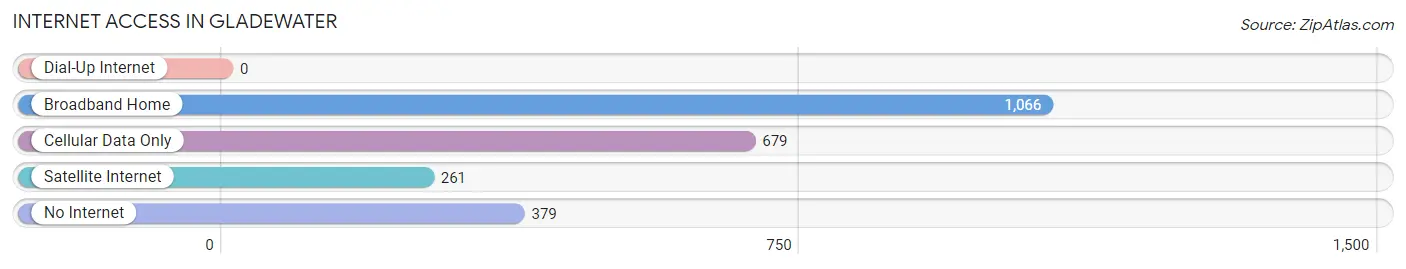
| Internet Type | # Households | % Households |
| Dial-Up Internet | 0 | 0.0% |
| Broadband Home | 1,066 | 47.8% |
| Cellular Data Only | 679 | 30.4% |
| Satellite Internet | 261 | 11.7% |
| No Internet | 379 | 17.0% |
| Total | 2,230 | 100.0% |
Gladewater Summary
Gladewater, Texas is a small city located in the northeastern part of the state, in the county of Gregg. It is situated on the banks of the Sabine River, and is part of the Longview-Marshall Metropolitan Statistical Area. The city has a population of 6,441 as of the 2010 census, and is known for its rich history and culture.
History
Gladewater was founded in 1873 by a group of settlers from the nearby town of Longview. The town was named after the nearby Sabine River, which was known as the “Gladewater” by the local Native American tribes. The town was originally a small farming community, but soon grew into a bustling center of commerce and industry.
In the early 1900s, the town was home to several sawmills, cotton gins, and other businesses. The town was also home to a large number of oil wells, which helped to fuel the local economy. In the 1920s, the town was home to a large number of oil refineries, which helped to make Gladewater a major center of oil production.
In the 1930s, the town was home to a large number of cotton mills, which helped to make Gladewater a major center of cotton production. The town was also home to a large number of brick factories, which helped to make Gladewater a major center of brick production.
In the 1940s, the town was home to a large number of lumber mills, which helped to make Gladewater a major center of lumber production. The town was also home to a large number of paper mills, which helped to make Gladewater a major center of paper production.
In the 1950s, the town was home to a large number of chemical plants, which helped to make Gladewater a major center of chemical production. The town was also home to a large number of food processing plants, which helped to make Gladewater a major center of food production.
In the 1960s, the town was home to a large number of textile mills, which helped to make Gladewater a major center of textile production. The town was also home to a large number of furniture factories, which helped to make Gladewater a major center of furniture production.
In the 1970s, the town was home to a large number of electronics factories, which helped to make Gladewater a major center of electronics production. The town was also home to a large number of automotive parts factories, which helped to make Gladewater a major center of automotive parts production.
In the 1980s, the town was home to a large number of computer parts factories, which helped to make Gladewater a major center of computer parts production. The town was also home to a large number of printing and publishing companies, which helped to make Gladewater a major center of printing and publishing.
Geography
Gladewater is located in the northeastern part of Texas, in the county of Gregg. It is situated on the banks of the Sabine River, and is part of the Longview-Marshall Metropolitan Statistical Area. The city has a total area of 4.3 square miles, all of which is land.
Economy
Gladewater’s economy is largely based on the oil and gas industry, as well as manufacturing and agriculture. The city is home to several oil and gas companies, as well as a number of manufacturing plants. The city is also home to a large number of agricultural businesses, including dairy farms, poultry farms, and cattle ranches.
Demographics
As of the 2010 census, Gladewater had a population of 6,441. The racial makeup of the city was 79.2% White, 15.3% African American, 0.4% Native American, 0.7% Asian, 0.1% Pacific Islander, 2.2% from other races, and 2.1% from two or more races. Hispanic or Latino of any race were 5.3% of the population.
The median income for a household in the city was $31,944, and the median income for a family was $37,917. Males had a median income of $30,917 versus $21,944 for females. The per capita income for the city was $17,845. About 14.2% of families and 17.3% of the population were below the poverty line, including 25.2% of those under age 18 and 11.2% of those age 65 or over.
Common Questions
What is Per Capita Income in Gladewater?
Per Capita income in Gladewater is $24,457.
What is the Median Family Income in Gladewater?
Median Family Income in Gladewater is $54,507.
What is the Median Household income in Gladewater?
Median Household Income in Gladewater is $47,749.
What is Income or Wage Gap in Gladewater?
Income or Wage Gap in Gladewater is 41.9%.
Women in Gladewater earn 58.1 cents for every dollar earned by a man.
What is Inequality or Gini Index in Gladewater?
Inequality or Gini Index in Gladewater is 0.48.
What is the Total Population of Gladewater?
Total Population of Gladewater is 6,166.
What is the Total Male Population of Gladewater?
Total Male Population of Gladewater is 2,639.
What is the Total Female Population of Gladewater?
Total Female Population of Gladewater is 3,527.
What is the Ratio of Males per 100 Females in Gladewater?
There are 74.82 Males per 100 Females in Gladewater.
What is the Ratio of Females per 100 Males in Gladewater?
There are 133.65 Females per 100 Males in Gladewater.
What is the Median Population Age in Gladewater?
Median Population Age in Gladewater is 33.3 Years.
What is the Average Family Size in Gladewater
Average Family Size in Gladewater is 3.2 People.
What is the Average Household Size in Gladewater
Average Household Size in Gladewater is 2.7 People.
How Large is the Labor Force in Gladewater?
There are 2,459 People in the Labor Forcein in Gladewater.
What is the Percentage of People in the Labor Force in Gladewater?
57.4% of People are in the Labor Force in Gladewater.
What is the Unemployment Rate in Gladewater?
Unemployment Rate in Gladewater is 2.8%.