Zip Codes with the Highest Percentage of Population Employed in Installation, Maintenance & Repair in Granbury, TX
RELATED REPORTS & OPTIONS
Installation, Maintenance & Repair
Granbury
Compare Zip Codes
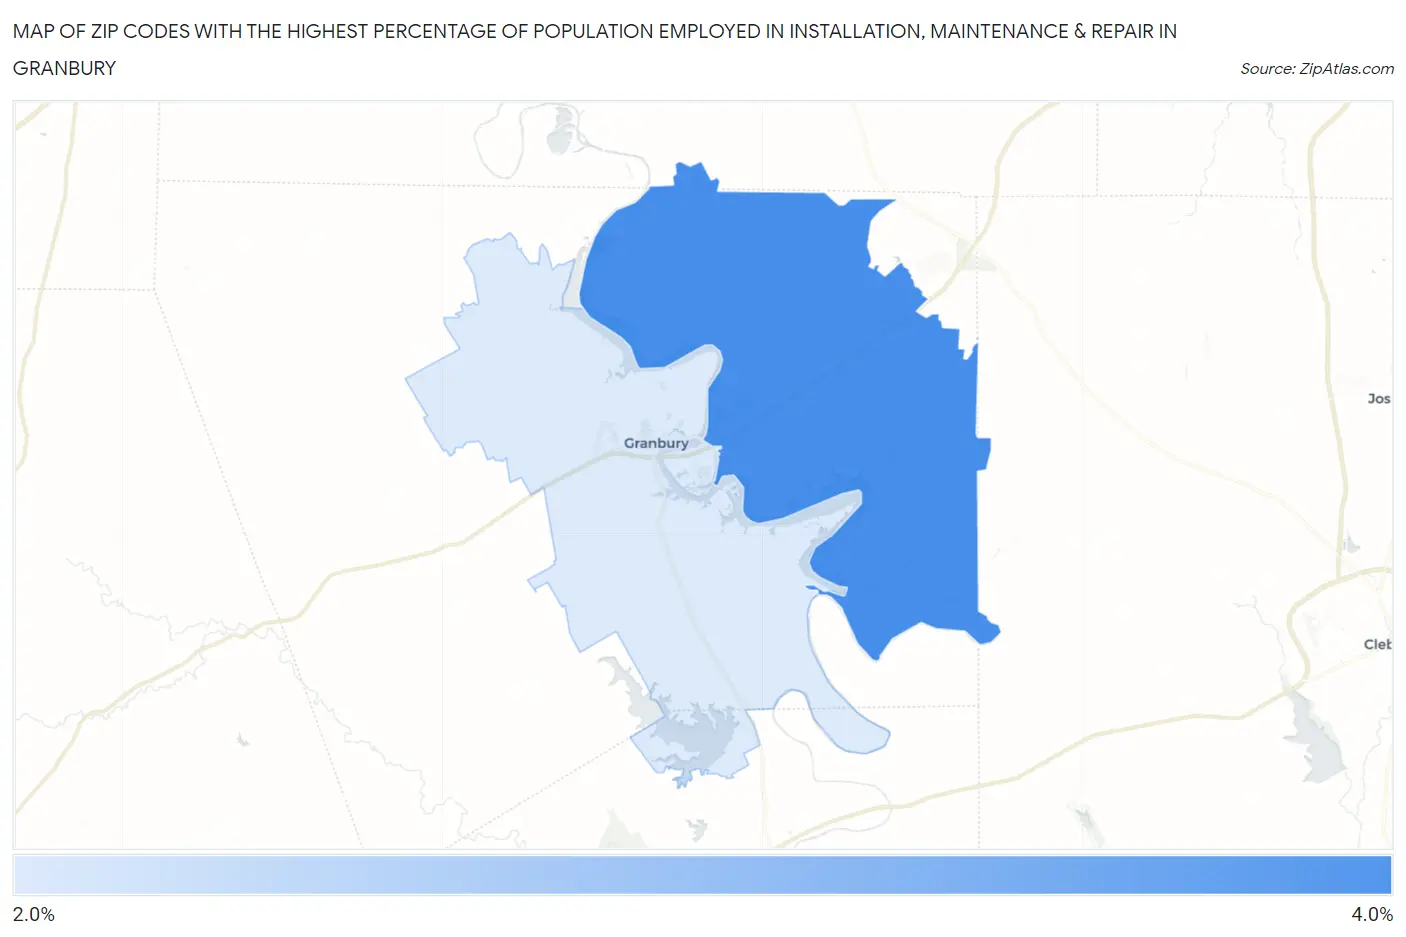
Map of Zip Codes with the Highest Percentage of Population Employed in Installation, Maintenance & Repair in Granbury
2.8%
3.1%
Zip Codes with the Highest Percentage of Population Employed in Installation, Maintenance & Repair in Granbury, TX
| Zip Code | % Employed | vs State | vs National | |
| 1. | 76049 | 3.1% | 3.4%(-0.316)#1,029 | 3.1%(+0.020)#16,583 |
| 2. | 76048 | 2.8% | 3.4%(-0.631)#1,125 | 3.1%(-0.295)#18,153 |
1
Common Questions
What are the Top Zip Codes with the Highest Percentage of Population Employed in Installation, Maintenance & Repair in Granbury, TX?
Top Zip Codes with the Highest Percentage of Population Employed in Installation, Maintenance & Repair in Granbury, TX are:
What zip code has the Highest Percentage of Population Employed in Installation, Maintenance & Repair in Granbury, TX?
76049 has the Highest Percentage of Population Employed in Installation, Maintenance & Repair in Granbury, TX with 3.1%.
What is the Percentage of Population Employed in Installation, Maintenance & Repair in Granbury, TX?
Percentage of Population Employed in Installation, Maintenance & Repair in Granbury is 2.9%.
What is the Percentage of Population Employed in Installation, Maintenance & Repair in Texas?
Percentage of Population Employed in Installation, Maintenance & Repair in Texas is 3.4%.
What is the Percentage of Population Employed in Installation, Maintenance & Repair in the United States?
Percentage of Population Employed in Installation, Maintenance & Repair in the United States is 3.1%.