San Diego, TX Map & Demographics
San Diego Map
San Diego Overview
$21,364
PER CAPITA INCOME
$56,577
AVG FAMILY INCOME
$46,620
AVG HOUSEHOLD INCOME
28.8%
WAGE / INCOME GAP [ % ]
71.2¢/ $1
WAGE / INCOME GAP [ $ ]
0.39
INEQUALITY / GINI INDEX
3,801
TOTAL POPULATION
1,742
MALE POPULATION
2,059
FEMALE POPULATION
84.60
MALES / 100 FEMALES
118.20
FEMALES / 100 MALES
35.8
MEDIAN AGE
3.8
AVG FAMILY SIZE
3.0
AVG HOUSEHOLD SIZE
1,640
LABOR FORCE [ PEOPLE ]
61.0%
PERCENT IN LABOR FORCE
6.4%
UNEMPLOYMENT RATE
San Diego Zip Codes
San Diego Area Codes
Income in San Diego
Income Overview in San Diego
Per Capita Income in San Diego is $21,364, while median incomes of families and households are $56,577 and $46,620 respectively.
| Characteristic | Number | Measure |
| Per Capita Income | 3,801 | $21,364 |
| Median Family Income | 731 | $56,577 |
| Mean Family Income | 731 | $59,968 |
| Median Household Income | 1,238 | $46,620 |
| Mean Household Income | 1,238 | $56,098 |
| Income Deficit | 731 | $0 |
| Wage / Income Gap (%) | 3,801 | 28.82% |
| Wage / Income Gap ($) | 3,801 | 71.18¢ per $1 |
| Gini / Inequality Index | 3,801 | 0.39 |
Earnings by Sex in San Diego
Average Earnings in San Diego are $33,713, $34,569 for men and $24,607 for women, a difference of 28.8%.
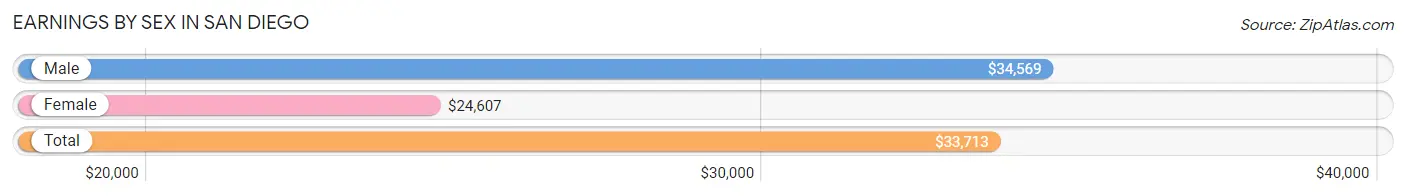
| Sex | Number | Average Earnings |
| Male | 885 (53.4%) | $34,569 |
| Female | 773 (46.6%) | $24,607 |
| Total | 1,658 (100.0%) | $33,713 |
Earnings by Sex by Income Bracket in San Diego
The most common earnings brackets in San Diego are $30,000 to $34,999 for men (291 | 32.9%) and $35,000 to $39,999 for women (131 | 17.0%).
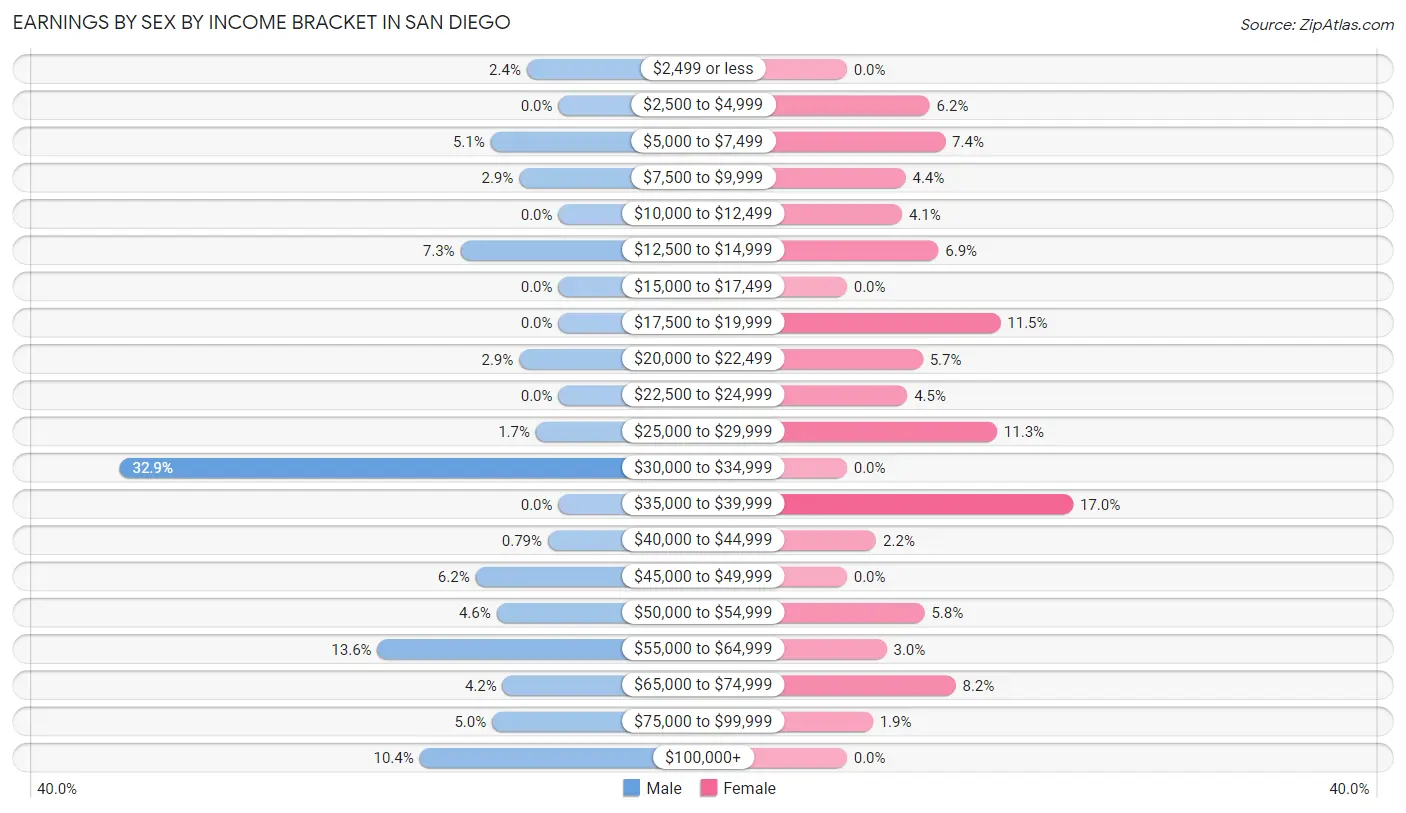
| Income | Male | Female |
| $2,499 or less | 21 (2.4%) | 0 (0.0%) |
| $2,500 to $4,999 | 0 (0.0%) | 48 (6.2%) |
| $5,000 to $7,499 | 45 (5.1%) | 57 (7.4%) |
| $7,500 to $9,999 | 26 (2.9%) | 34 (4.4%) |
| $10,000 to $12,499 | 0 (0.0%) | 32 (4.1%) |
| $12,500 to $14,999 | 65 (7.3%) | 53 (6.9%) |
| $15,000 to $17,499 | 0 (0.0%) | 0 (0.0%) |
| $17,500 to $19,999 | 0 (0.0%) | 89 (11.5%) |
| $20,000 to $22,499 | 26 (2.9%) | 44 (5.7%) |
| $22,500 to $24,999 | 0 (0.0%) | 35 (4.5%) |
| $25,000 to $29,999 | 15 (1.7%) | 87 (11.3%) |
| $30,000 to $34,999 | 291 (32.9%) | 0 (0.0%) |
| $35,000 to $39,999 | 0 (0.0%) | 131 (17.0%) |
| $40,000 to $44,999 | 7 (0.8%) | 17 (2.2%) |
| $45,000 to $49,999 | 55 (6.2%) | 0 (0.0%) |
| $50,000 to $54,999 | 41 (4.6%) | 45 (5.8%) |
| $55,000 to $64,999 | 120 (13.6%) | 23 (3.0%) |
| $65,000 to $74,999 | 37 (4.2%) | 63 (8.2%) |
| $75,000 to $99,999 | 44 (5.0%) | 15 (1.9%) |
| $100,000+ | 92 (10.4%) | 0 (0.0%) |
| Total | 885 (100.0%) | 773 (100.0%) |
Earnings by Sex by Educational Attainment in San Diego
Average earnings in San Diego are $34,769 for men and $27,778 for women, a difference of 20.1%. Men with an educational attainment of high school diploma enjoy the highest average annual earnings of $103,192, while those with less than high school education earn the least with $33,083. Women with an educational attainment of bachelor's degree earn the most with the average annual earnings of $67,870, while those with less than high school education have the smallest earnings of $18,211.
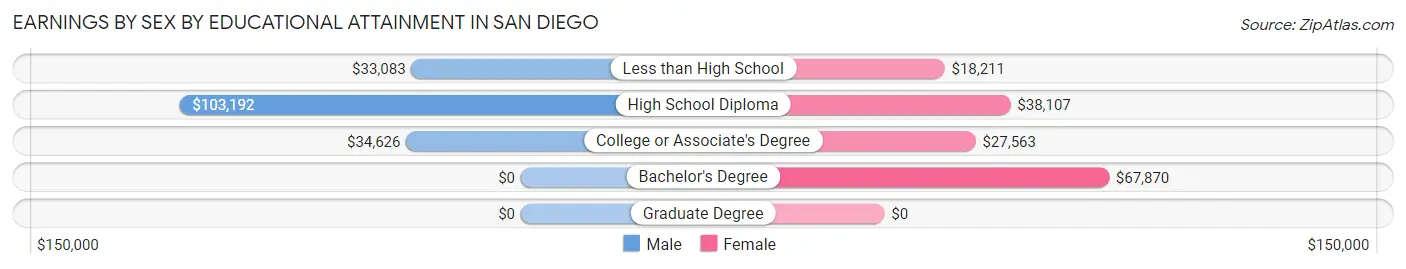
| Educational Attainment | Male Income | Female Income |
| Less than High School | $33,083 | $18,211 |
| High School Diploma | $103,192 | $38,107 |
| College or Associate's Degree | $34,626 | $27,563 |
| Bachelor's Degree | - | - |
| Graduate Degree | - | - |
| Total | $34,769 | $27,778 |
Family Income in San Diego
Family Income Brackets in San Diego
According to the San Diego family income data, there are 218 families falling into the $50,000 to $74,999 income range, which is the most common income bracket and makes up 29.8% of all families.
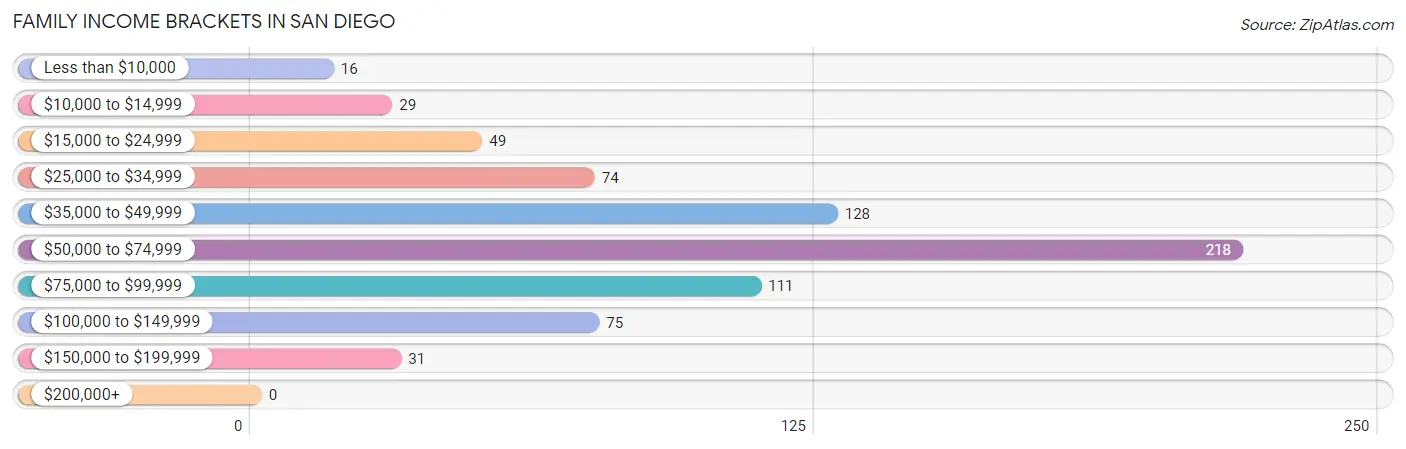
| Income Bracket | # Families | % Families |
| Less than $10,000 | 16 | 2.2% |
| $10,000 to $14,999 | 29 | 4.0% |
| $15,000 to $24,999 | 49 | 6.7% |
| $25,000 to $34,999 | 74 | 10.1% |
| $35,000 to $49,999 | 128 | 17.5% |
| $50,000 to $74,999 | 218 | 29.8% |
| $75,000 to $99,999 | 111 | 15.2% |
| $100,000 to $149,999 | 75 | 10.3% |
| $150,000 to $199,999 | 31 | 4.2% |
| $200,000+ | 0 | 0.0% |
Family Income by Famaliy Size in San Diego
2-person families (348 | 47.6%) account for the highest median family income in San Diego with $61,215 per family, while 2-person families (348 | 47.6%) have the highest median income of $30,608 per family member.
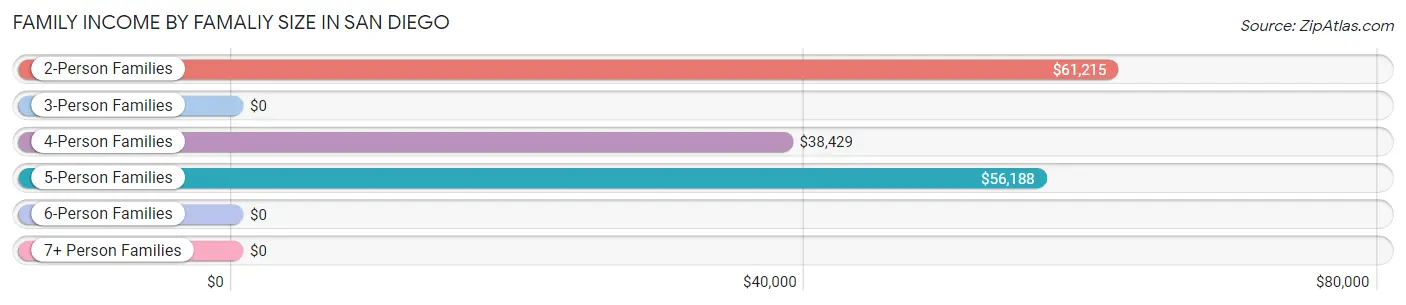
| Income Bracket | # Families | Median Income |
| 2-Person Families | 348 (47.6%) | $61,215 |
| 3-Person Families | 171 (23.4%) | $0 |
| 4-Person Families | 58 (7.9%) | $38,429 |
| 5-Person Families | 111 (15.2%) | $56,188 |
| 6-Person Families | 11 (1.5%) | $0 |
| 7+ Person Families | 32 (4.4%) | $0 |
| Total | 731 (100.0%) | $56,577 |
Family Income by Number of Earners in San Diego
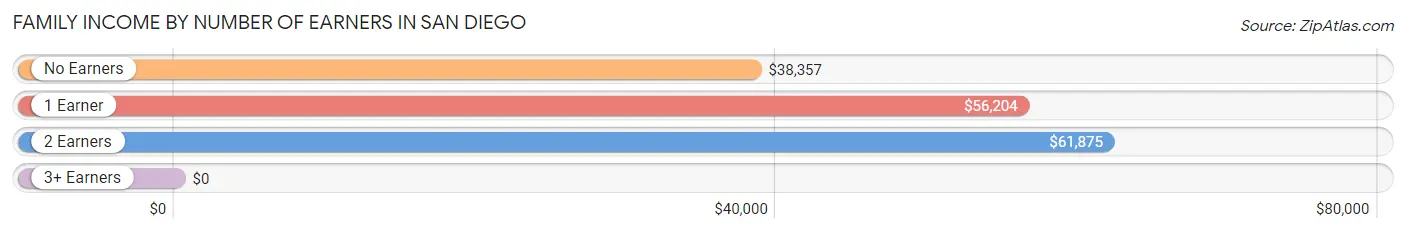
| Number of Earners | # Families | Median Income |
| No Earners | 64 (8.8%) | $38,357 |
| 1 Earner | 434 (59.4%) | $56,204 |
| 2 Earners | 141 (19.3%) | $61,875 |
| 3+ Earners | 92 (12.6%) | $0 |
| Total | 731 (100.0%) | $56,577 |
Household Income in San Diego
Household Income Brackets in San Diego
With 236 households falling in the category, the $75,000 to $99,999 income range is the most frequent in San Diego, accounting for 19.1% of all households. In contrast, only 31 households (2.5%) fall into the $150,000 to $199,999 income bracket, making it the least populous group.
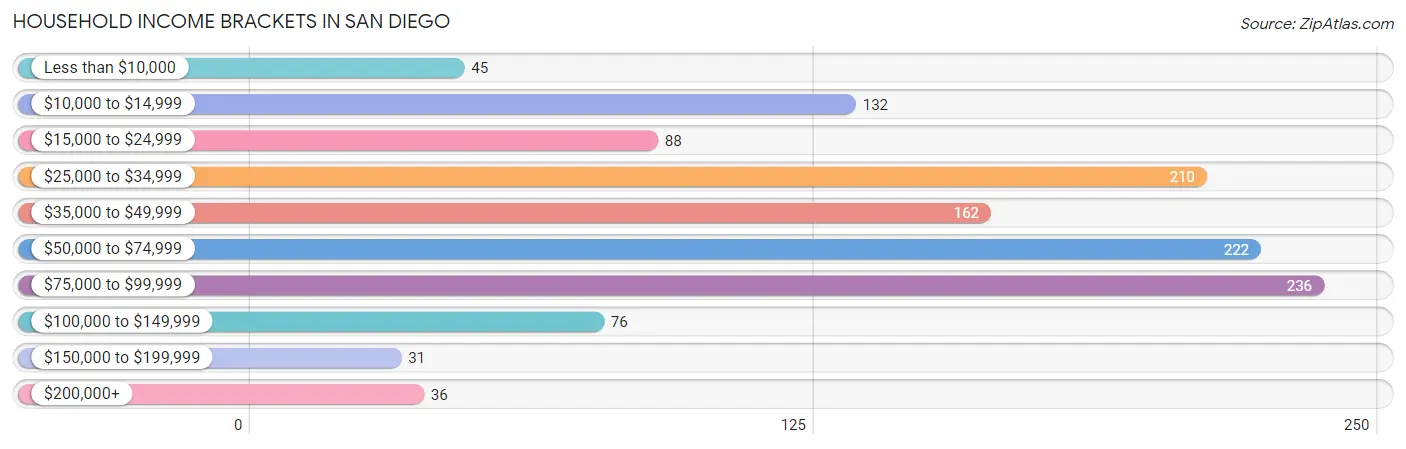
| Income Bracket | # Households | % Households |
| Less than $10,000 | 45 | 3.6% |
| $10,000 to $14,999 | 132 | 10.7% |
| $15,000 to $24,999 | 88 | 7.1% |
| $25,000 to $34,999 | 210 | 17.0% |
| $35,000 to $49,999 | 162 | 13.1% |
| $50,000 to $74,999 | 222 | 17.9% |
| $75,000 to $99,999 | 236 | 19.1% |
| $100,000 to $149,999 | 76 | 6.1% |
| $150,000 to $199,999 | 31 | 2.5% |
| $200,000+ | 36 | 2.9% |
Household Income by Householder Age in San Diego
The median household income in San Diego is $46,620, with the highest median household income of $55,799 found in the 25 to 44 years age bracket for the primary householder. A total of 541 households (43.7%) fall into this category. Meanwhile, the 15 to 24 years age bracket for the primary householder has the lowest median household income of $0, with 17 households (1.4%) in this group.
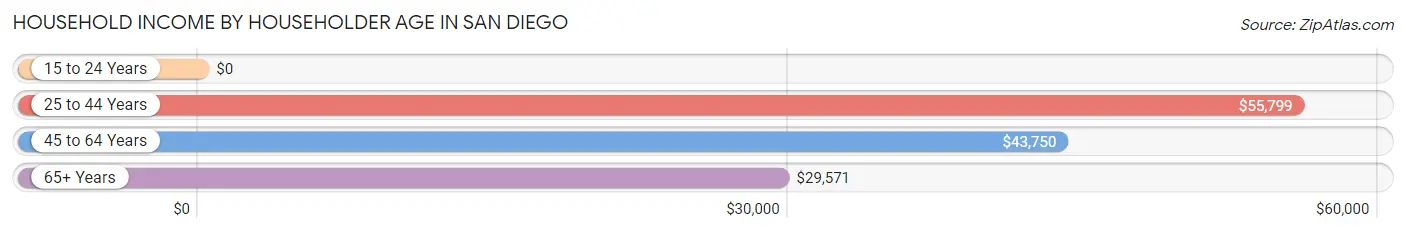
| Income Bracket | # Households | Median Income |
| 15 to 24 Years | 17 (1.4%) | $0 |
| 25 to 44 Years | 541 (43.7%) | $55,799 |
| 45 to 64 Years | 410 (33.1%) | $43,750 |
| 65+ Years | 270 (21.8%) | $29,571 |
| Total | 1,238 (100.0%) | $46,620 |
Poverty in San Diego
Income Below Poverty by Sex and Age in San Diego
With 8.4% poverty level for males and 26.7% for females among the residents of San Diego, 5 year old males and 12 to 14 year old females are the most vulnerable to poverty, with 13 males (100.0%) and 21 females (100.0%) in their respective age groups living below the poverty level.
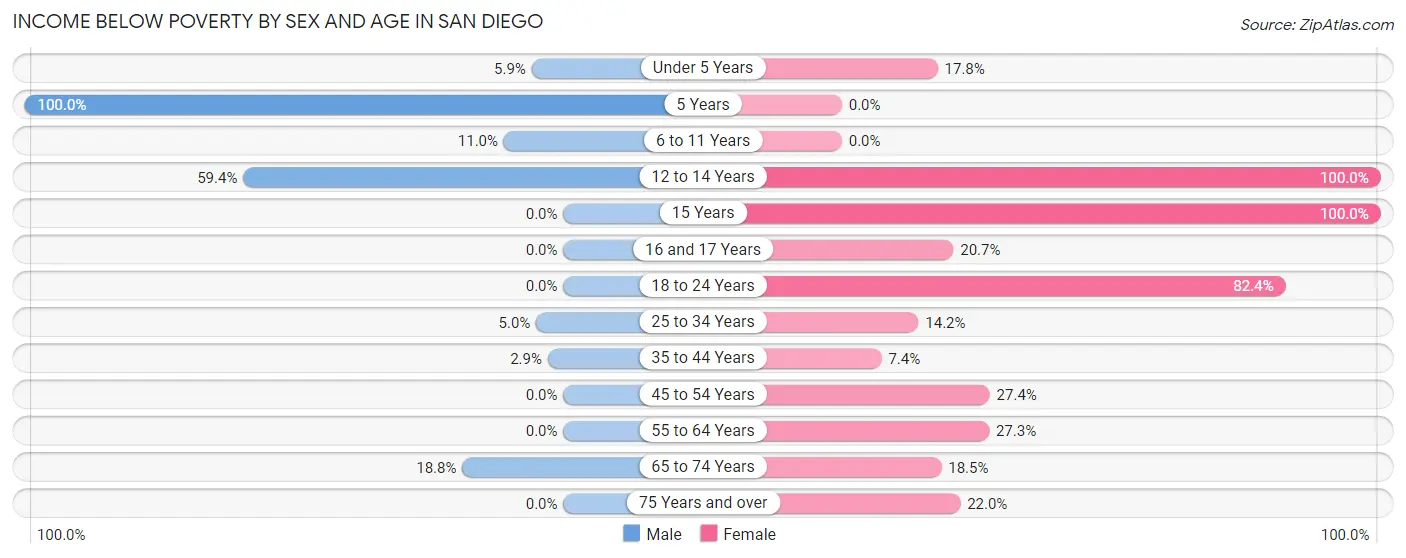
| Age Bracket | Male | Female |
| Under 5 Years | 12 (5.9%) | 16 (17.8%) |
| 5 Years | 13 (100.0%) | 0 (0.0%) |
| 6 to 11 Years | 33 (11.0%) | 0 (0.0%) |
| 12 to 14 Years | 41 (59.4%) | 21 (100.0%) |
| 15 Years | 0 (0.0%) | 64 (100.0%) |
| 16 and 17 Years | 0 (0.0%) | 18 (20.7%) |
| 18 to 24 Years | 0 (0.0%) | 182 (82.4%) |
| 25 to 34 Years | 7 (5.0%) | 26 (14.2%) |
| 35 to 44 Years | 9 (2.9%) | 29 (7.4%) |
| 45 to 54 Years | 0 (0.0%) | 45 (27.4%) |
| 55 to 64 Years | 0 (0.0%) | 53 (27.3%) |
| 65 to 74 Years | 30 (18.8%) | 29 (18.5%) |
| 75 Years and over | 0 (0.0%) | 20 (22.0%) |
| Total | 145 (8.4%) | 503 (26.7%) |
Income Above Poverty by Sex and Age in San Diego
According to the poverty statistics in San Diego, males aged 18 to 24 years and females aged 6 to 11 years are the age groups that are most secure financially, with 100.0% of males and 100.0% of females in these age groups living above the poverty line.
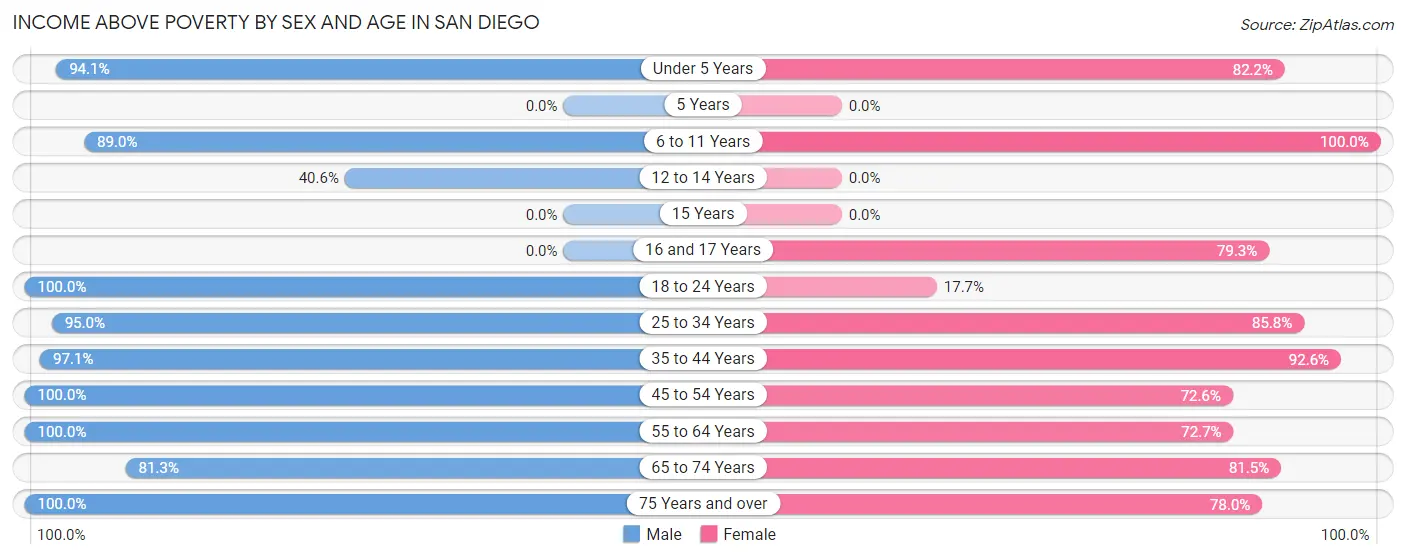
| Age Bracket | Male | Female |
| Under 5 Years | 192 (94.1%) | 74 (82.2%) |
| 5 Years | 0 (0.0%) | 0 (0.0%) |
| 6 to 11 Years | 266 (89.0%) | 217 (100.0%) |
| 12 to 14 Years | 28 (40.6%) | 0 (0.0%) |
| 15 Years | 0 (0.0%) | 0 (0.0%) |
| 16 and 17 Years | 0 (0.0%) | 69 (79.3%) |
| 18 to 24 Years | 52 (100.0%) | 39 (17.6%) |
| 25 to 34 Years | 132 (95.0%) | 157 (85.8%) |
| 35 to 44 Years | 304 (97.1%) | 365 (92.6%) |
| 45 to 54 Years | 201 (100.0%) | 119 (72.6%) |
| 55 to 64 Years | 236 (100.0%) | 141 (72.7%) |
| 65 to 74 Years | 130 (81.2%) | 128 (81.5%) |
| 75 Years and over | 44 (100.0%) | 71 (78.0%) |
| Total | 1,585 (91.6%) | 1,380 (73.3%) |
Income Below Poverty Among Married-Couple Families in San Diego
The poverty statistics for married-couple families in San Diego show that 8.2% or 24 of the total 293 families live below the poverty line. Families with 1 or 2 children have the highest poverty rate of 40.0%, comprising of 16 families. On the other hand, families with 3 or 4 children have the lowest poverty rate of 0.0%, which includes 0 families.
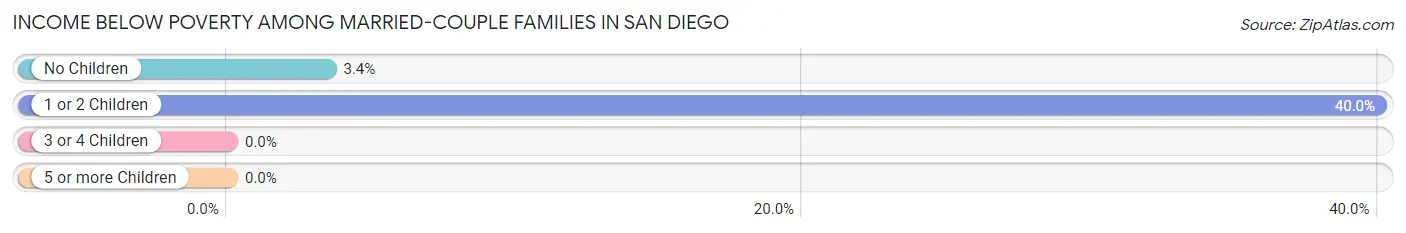
| Children | Above Poverty | Below Poverty |
| No Children | 225 (96.6%) | 8 (3.4%) |
| 1 or 2 Children | 24 (60.0%) | 16 (40.0%) |
| 3 or 4 Children | 20 (100.0%) | 0 (0.0%) |
| 5 or more Children | 0 (0.0%) | 0 (0.0%) |
| Total | 269 (91.8%) | 24 (8.2%) |
Income Below Poverty Among Single-Parent Households in San Diego
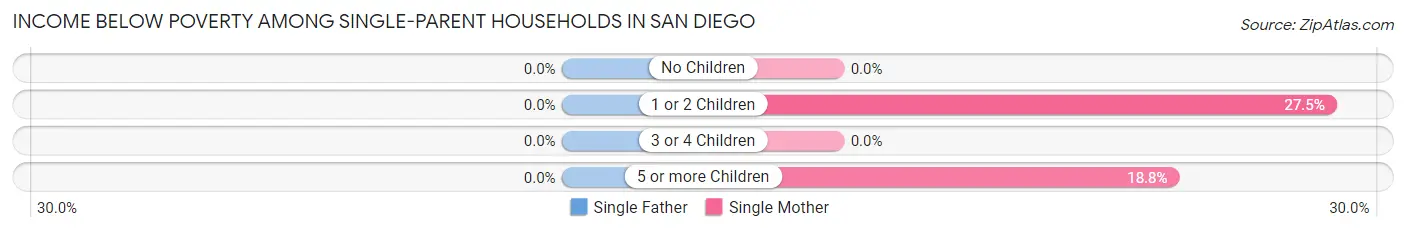
| Children | Single Father | Single Mother |
| No Children | 0 (0.0%) | 0 (0.0%) |
| 1 or 2 Children | 0 (0.0%) | 46 (27.5%) |
| 3 or 4 Children | 0 (0.0%) | 0 (0.0%) |
| 5 or more Children | 0 (0.0%) | 6 (18.8%) |
| Total | 0 (0.0%) | 52 (15.0%) |
Income Below Poverty Among Married-Couple vs Single-Parent Households in San Diego
The poverty data for San Diego shows that 24 of the married-couple family households (8.2%) and 52 of the single-parent households (11.9%) are living below the poverty level. Within the married-couple family households, those with 1 or 2 children have the highest poverty rate, with 16 households (40.0%) falling below the poverty line. Among the single-parent households, those with 1 or 2 children have the highest poverty rate, with 46 household (19.3%) living below poverty.
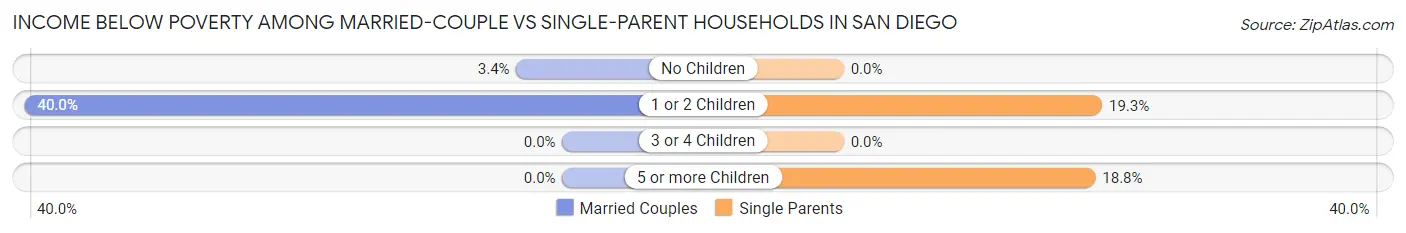
| Children | Married-Couple Families | Single-Parent Households |
| No Children | 8 (3.4%) | 0 (0.0%) |
| 1 or 2 Children | 16 (40.0%) | 46 (19.3%) |
| 3 or 4 Children | 0 (0.0%) | 0 (0.0%) |
| 5 or more Children | 0 (0.0%) | 6 (18.8%) |
| Total | 24 (8.2%) | 52 (11.9%) |
Race in San Diego
The most populous races in San Diego are Hispanic or Latino (3,705 | 97.5%), White / Caucasian (3,422 | 90.0%), and Two or more Races (318 | 8.4%).
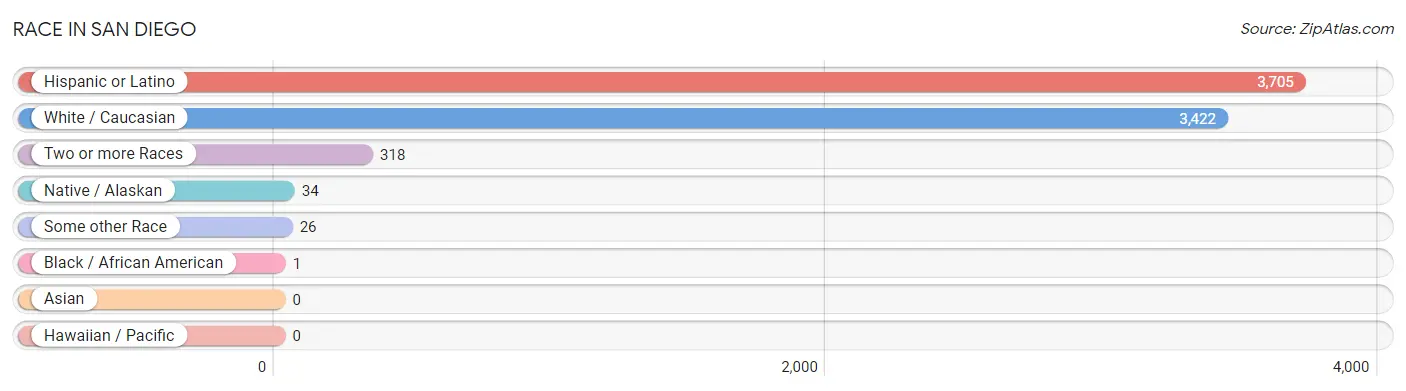
| Race | # Population | % Population |
| Asian | 0 | 0.0% |
| Black / African American | 1 | 0.0% |
| Hawaiian / Pacific | 0 | 0.0% |
| Hispanic or Latino | 3,705 | 97.5% |
| Native / Alaskan | 34 | 0.9% |
| White / Caucasian | 3,422 | 90.0% |
| Two or more Races | 318 | 8.4% |
| Some other Race | 26 | 0.7% |
| Total | 3,801 | 100.0% |
Ancestry in San Diego
The most populous ancestries reported in San Diego are Mexican (3,325 | 87.5%), American (101 | 2.7%), Colombian (76 | 2.0%), South American (76 | 2.0%), and Dutch (60 | 1.6%), together accounting for 95.7% of all San Diego residents.
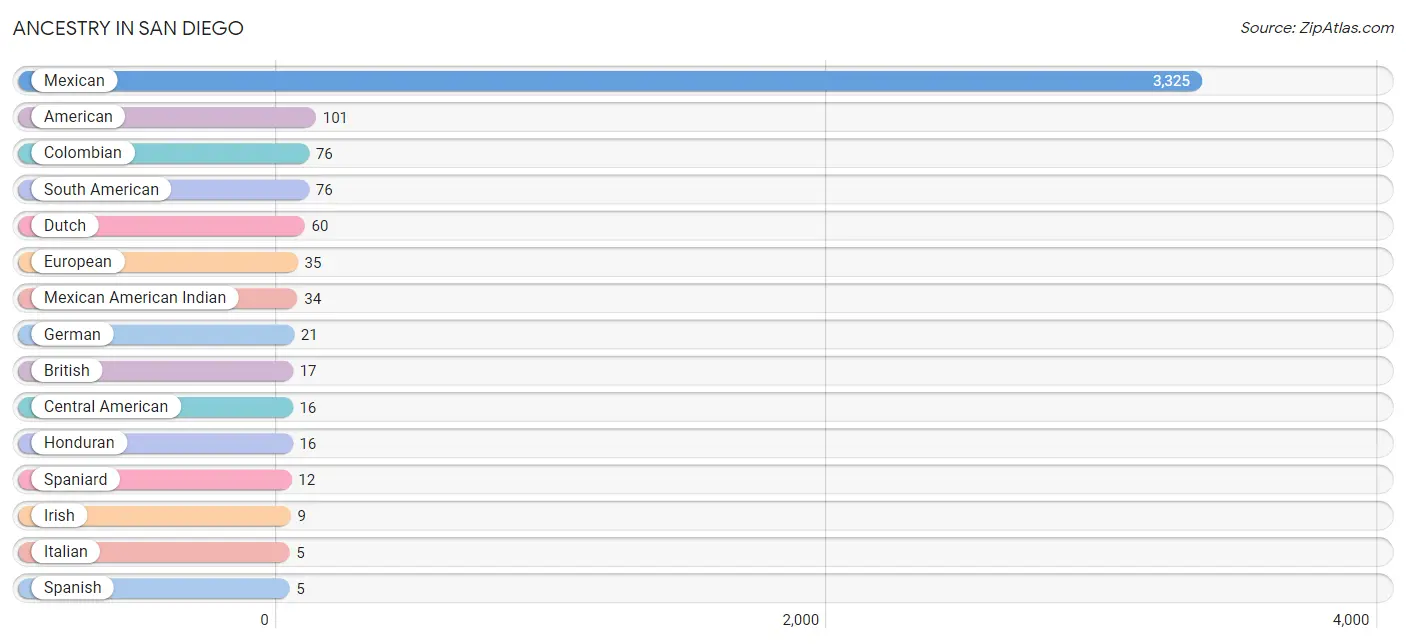
| Ancestry | # Population | % Population |
| American | 101 | 2.7% |
| British | 17 | 0.4% |
| Central American | 16 | 0.4% |
| Colombian | 76 | 2.0% |
| Dutch | 60 | 1.6% |
| English | 1 | 0.0% |
| European | 35 | 0.9% |
| German | 21 | 0.5% |
| Honduran | 16 | 0.4% |
| Irish | 9 | 0.2% |
| Italian | 5 | 0.1% |
| Mexican | 3,325 | 87.5% |
| Mexican American Indian | 34 | 0.9% |
| South American | 76 | 2.0% |
| Spaniard | 12 | 0.3% |
| Spanish | 5 | 0.1% | View All 16 Rows |
Immigrants in San Diego
The most numerous immigrant groups reported in San Diego came from Latin America (44 | 1.2%), Central America (22 | 0.6%), Colombia (22 | 0.6%), Mexico (22 | 0.6%), and South America (22 | 0.6%), together accounting for 3.5% of all San Diego residents.
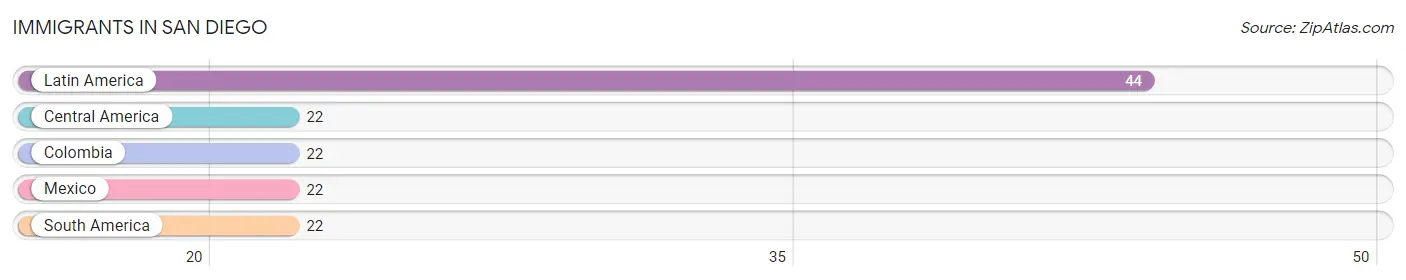
| Immigration Origin | # Population | % Population |
| Central America | 22 | 0.6% |
| Colombia | 22 | 0.6% |
| Latin America | 44 | 1.2% |
| Mexico | 22 | 0.6% |
| South America | 22 | 0.6% | View All 5 Rows |
Sex and Age in San Diego
Sex and Age in San Diego
The most populous age groups in San Diego are Under 5 Years (204 | 11.7%) for men and 35 to 39 Years (296 | 14.4%) for women.
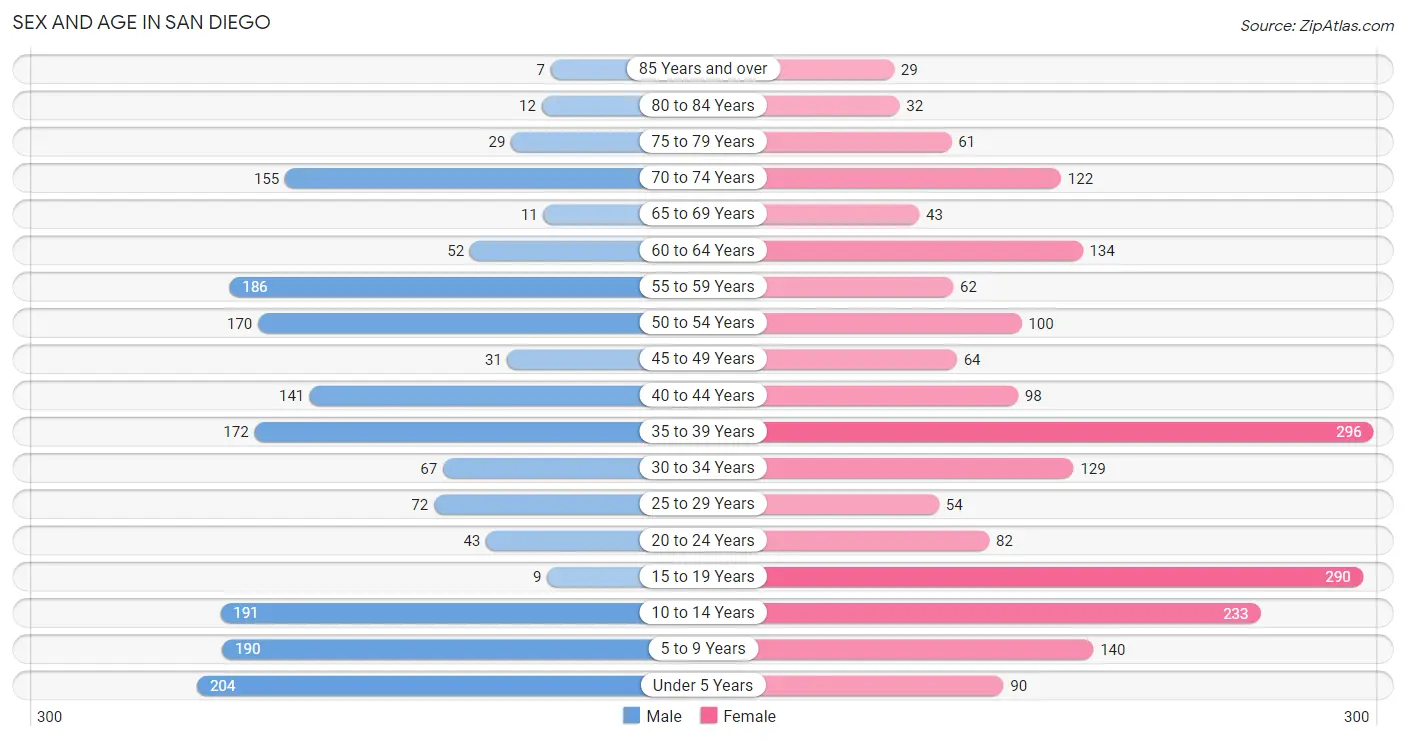
| Age Bracket | Male | Female |
| Under 5 Years | 204 (11.7%) | 90 (4.4%) |
| 5 to 9 Years | 190 (10.9%) | 140 (6.8%) |
| 10 to 14 Years | 191 (11.0%) | 233 (11.3%) |
| 15 to 19 Years | 9 (0.5%) | 290 (14.1%) |
| 20 to 24 Years | 43 (2.5%) | 82 (4.0%) |
| 25 to 29 Years | 72 (4.1%) | 54 (2.6%) |
| 30 to 34 Years | 67 (3.8%) | 129 (6.3%) |
| 35 to 39 Years | 172 (9.9%) | 296 (14.4%) |
| 40 to 44 Years | 141 (8.1%) | 98 (4.8%) |
| 45 to 49 Years | 31 (1.8%) | 64 (3.1%) |
| 50 to 54 Years | 170 (9.8%) | 100 (4.9%) |
| 55 to 59 Years | 186 (10.7%) | 62 (3.0%) |
| 60 to 64 Years | 52 (3.0%) | 134 (6.5%) |
| 65 to 69 Years | 11 (0.6%) | 43 (2.1%) |
| 70 to 74 Years | 155 (8.9%) | 122 (5.9%) |
| 75 to 79 Years | 29 (1.7%) | 61 (3.0%) |
| 80 to 84 Years | 12 (0.7%) | 32 (1.5%) |
| 85 Years and over | 7 (0.4%) | 29 (1.4%) |
| Total | 1,742 (100.0%) | 2,059 (100.0%) |
Families and Households in San Diego
Median Family Size in San Diego
The median family size in San Diego is 3.77 persons per family, with single female/mother families (346 | 47.3%) accounting for the largest median family size of 4.12 persons per family. On the other hand, single male/father families (92 | 12.6%) represent the smallest median family size with 1.87 persons per family.
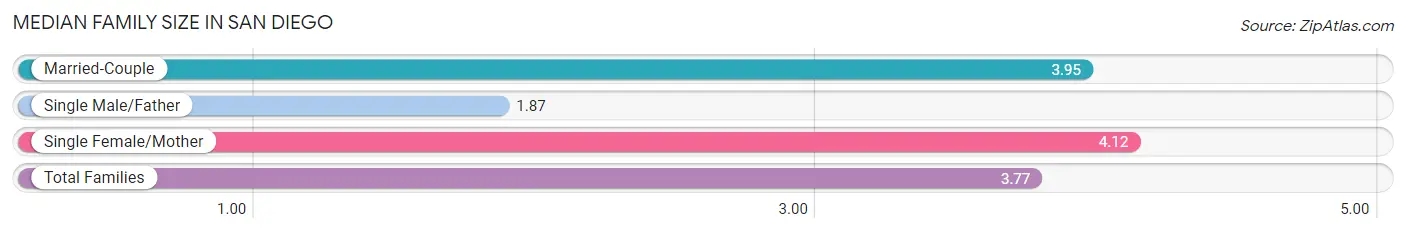
| Family Type | # Families | Family Size |
| Married-Couple | 293 (40.1%) | 3.95 |
| Single Male/Father | 92 (12.6%) | 1.87 |
| Single Female/Mother | 346 (47.3%) | 4.12 |
| Total Families | 731 (100.0%) | 3.77 |
Median Household Size in San Diego
The median household size in San Diego is 3.03 persons per household, with single female/mother households (346 | 28.0%) accounting for the largest median household size of 4.64 persons per household. non-family households (507 | 40.9%) represent the smallest median household size with 1.52 persons per household.
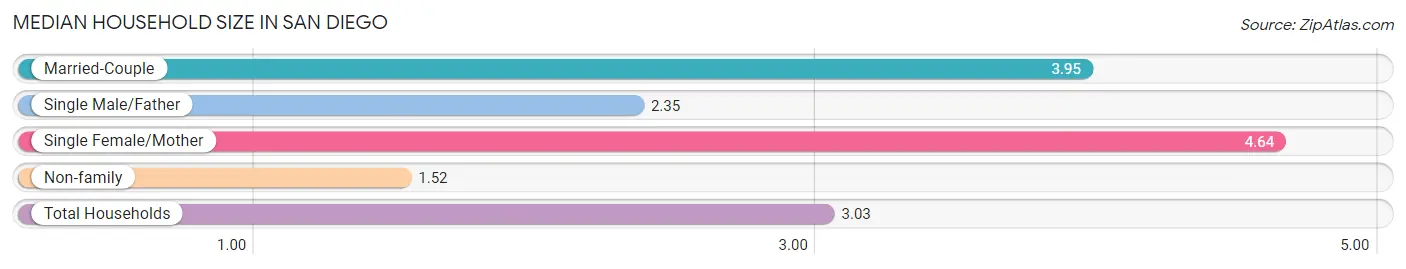
| Household Type | # Households | Household Size |
| Married-Couple | 293 (23.7%) | 3.95 |
| Single Male/Father | 92 (7.4%) | 2.35 |
| Single Female/Mother | 346 (28.0%) | 4.64 |
| Non-family | 507 (40.9%) | 1.52 |
| Total Households | 1,238 (100.0%) | 3.03 |
Household Size by Marriage Status in San Diego
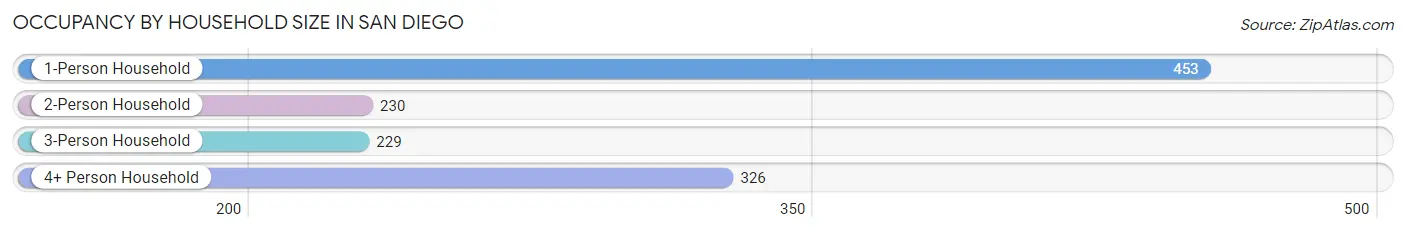
Out of a total of 1,238 households in San Diego, 731 (59.1%) are family households, while 507 (40.9%) are nonfamily households. The most numerous type of family households are 2-person households, comprising 230, and the most common type of nonfamily households are 1-person households, comprising 453.
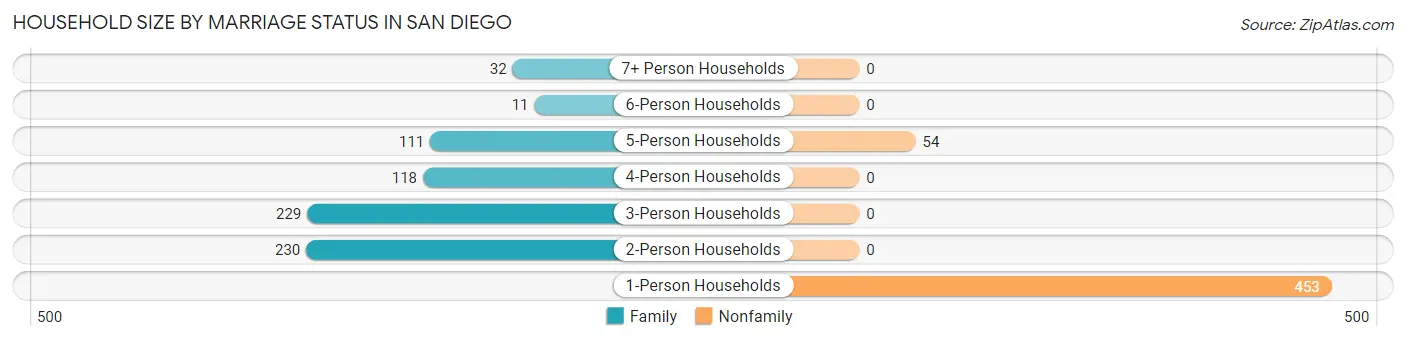
| Household Size | Family Households | Nonfamily Households |
| 1-Person Households | - | 453 (36.6%) |
| 2-Person Households | 230 (18.6%) | 0 (0.0%) |
| 3-Person Households | 229 (18.5%) | 0 (0.0%) |
| 4-Person Households | 118 (9.5%) | 0 (0.0%) |
| 5-Person Households | 111 (9.0%) | 54 (4.4%) |
| 6-Person Households | 11 (0.9%) | 0 (0.0%) |
| 7+ Person Households | 32 (2.6%) | 0 (0.0%) |
| Total | 731 (59.1%) | 507 (40.9%) |
Female Fertility in San Diego
Fertility by Age in San Diego
Average fertility rate in San Diego is 42.0 births per 1,000 women. Women in the age bracket of 20 to 34 years have the highest fertility rate with 166.0 births per 1,000 women. Women in the age bracket of 20 to 34 years acount for 100.0% of all women with births.
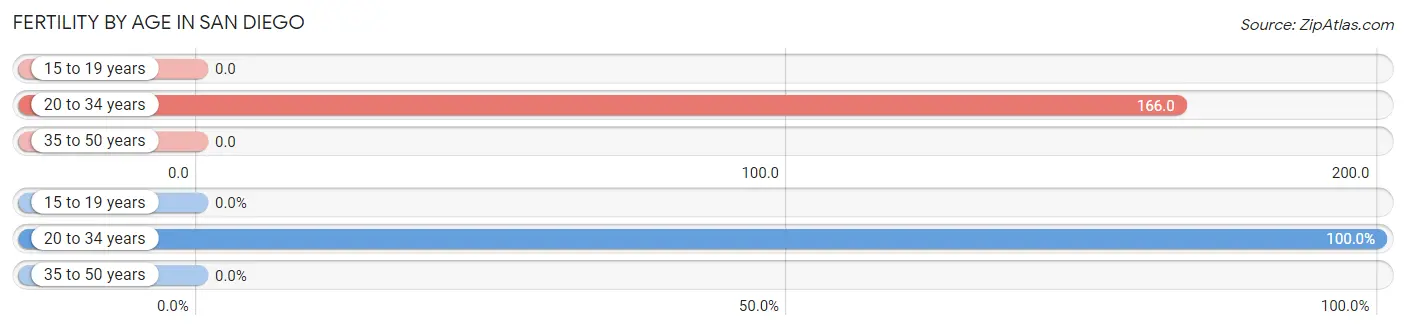
| Age Bracket | Women with Births | Births / 1,000 Women |
| 15 to 19 years | 0 (0.0%) | 0.0 |
| 20 to 34 years | 44 (100.0%) | 166.0 |
| 35 to 50 years | 0 (0.0%) | 0.0 |
| Total | 44 (100.0%) | 42.0 |
Fertility by Age by Marriage Status in San Diego
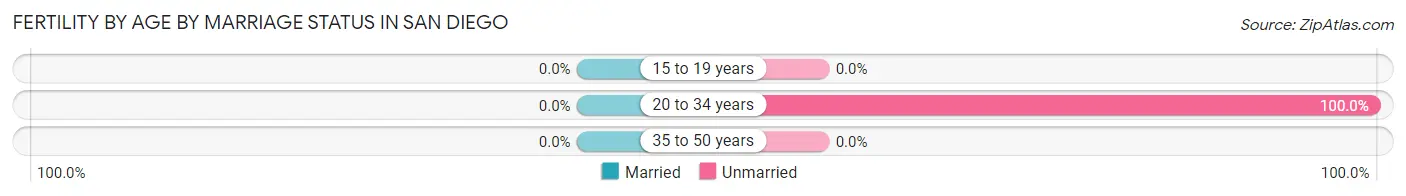
| Age Bracket | Married | Unmarried |
| 15 to 19 years | 0 (0.0%) | 0 (0.0%) |
| 20 to 34 years | 0 (0.0%) | 44 (100.0%) |
| 35 to 50 years | 0 (0.0%) | 0 (0.0%) |
| Total | 0 (0.0%) | 44 (100.0%) |
Fertility by Education in San Diego
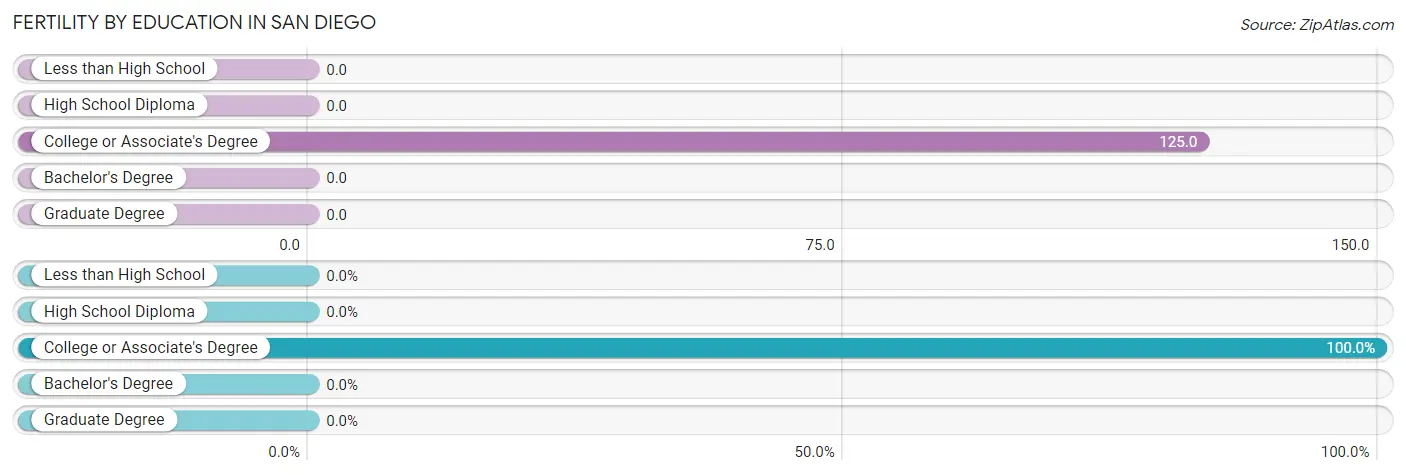
| Educational Attainment | Women with Births | Births / 1,000 Women |
| Less than High School | 0 (0.0%) | 0.0 |
| High School Diploma | 0 (0.0%) | 0.0 |
| College or Associate's Degree | 44 (100.0%) | 125.0 |
| Bachelor's Degree | 0 (0.0%) | 0.0 |
| Graduate Degree | 0 (0.0%) | 0.0 |
| Total | 44 (100.0%) | 42.0 |
Fertility by Education by Marriage Status in San Diego
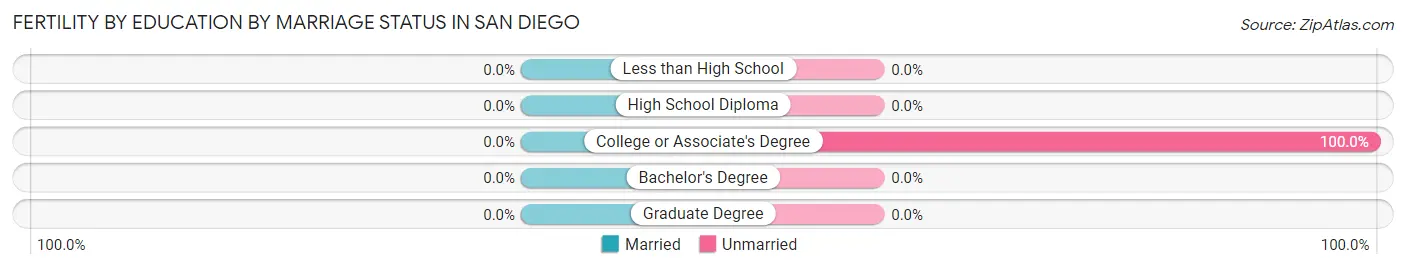
| Educational Attainment | Married | Unmarried |
| Less than High School | 0 (0.0%) | 0 (0.0%) |
| High School Diploma | 0 (0.0%) | 0 (0.0%) |
| College or Associate's Degree | 0 (0.0%) | 44 (100.0%) |
| Bachelor's Degree | 0 (0.0%) | 0 (0.0%) |
| Graduate Degree | 0 (0.0%) | 0 (0.0%) |
| Total | 0 (0.0%) | 44 (100.0%) |
Employment Characteristics in San Diego
Employment by Class of Employer in San Diego
Among the 1,492 employed individuals in San Diego, private company employees (993 | 66.5%), state government employees (164 | 11.0%), and not-for-profit organizations (120 | 8.0%) make up the most common classes of employment.
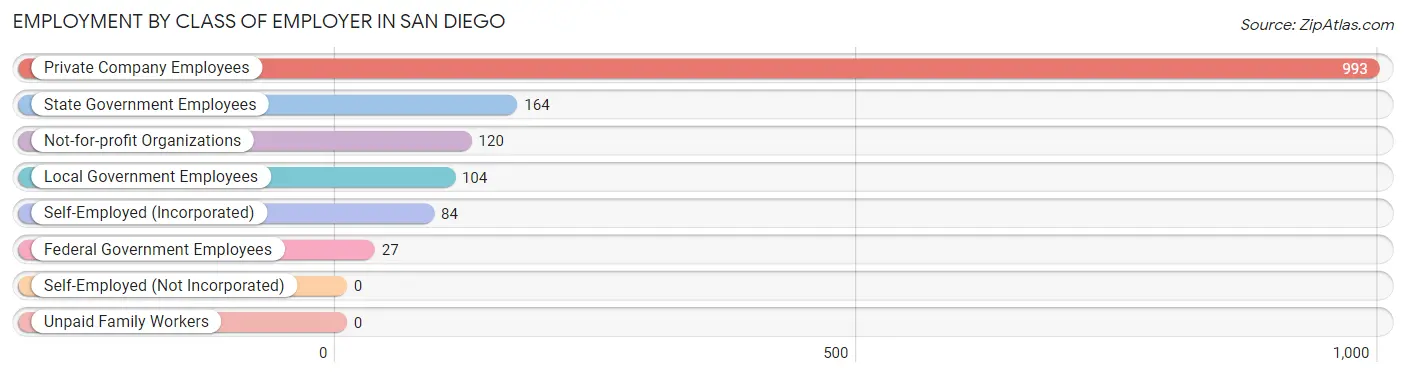
| Employer Class | # Employees | % Employees |
| Private Company Employees | 993 | 66.5% |
| Self-Employed (Incorporated) | 84 | 5.6% |
| Self-Employed (Not Incorporated) | 0 | 0.0% |
| Not-for-profit Organizations | 120 | 8.0% |
| Local Government Employees | 104 | 7.0% |
| State Government Employees | 164 | 11.0% |
| Federal Government Employees | 27 | 1.8% |
| Unpaid Family Workers | 0 | 0.0% |
| Total | 1,492 | 100.0% |
Employment Status by Age in San Diego
According to the labor force statistics for San Diego, out of the total population over 16 years of age (2,689), 61.0% or 1,640 individuals are in the labor force, with 6.4% or 105 of them unemployed. The age group with the highest labor force participation rate is 25 to 29 years, with 92.1% or 116 individuals in the labor force. Within the labor force, the 30 to 34 years age range has the highest percentage of unemployed individuals, with 10.3% or 15 of them being unemployed.
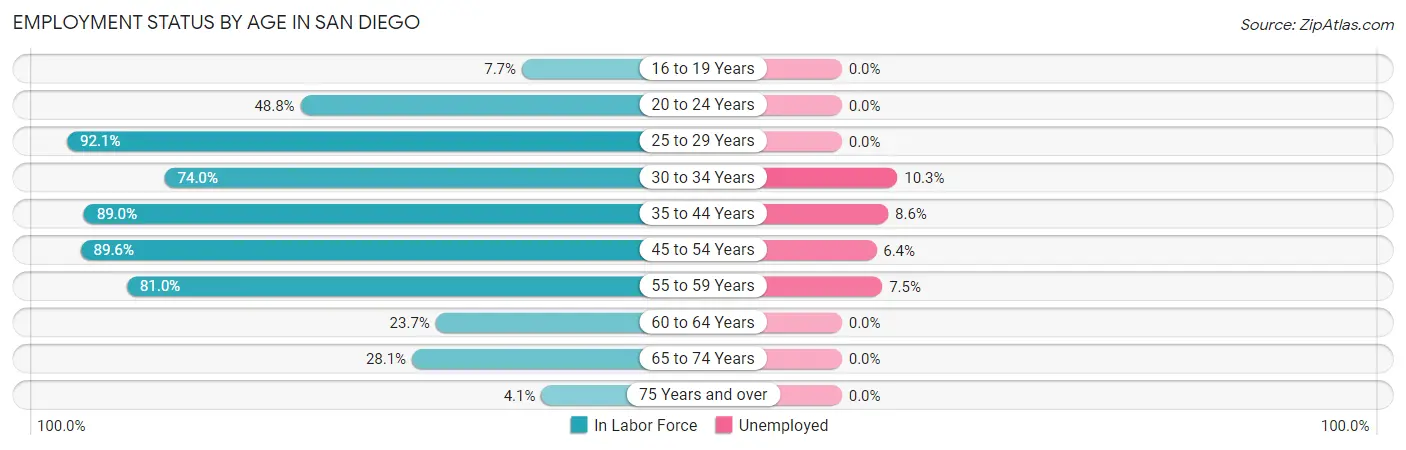
| Age Bracket | In Labor Force | Unemployed |
| 16 to 19 Years | 18 (7.7%) | 0 (0.0%) |
| 20 to 24 Years | 61 (48.8%) | 0 (0.0%) |
| 25 to 29 Years | 116 (92.1%) | 0 (0.0%) |
| 30 to 34 Years | 145 (74.0%) | 15 (10.3%) |
| 35 to 44 Years | 629 (89.0%) | 54 (8.6%) |
| 45 to 54 Years | 327 (89.6%) | 21 (6.4%) |
| 55 to 59 Years | 201 (81.0%) | 15 (7.5%) |
| 60 to 64 Years | 44 (23.7%) | 0 (0.0%) |
| 65 to 74 Years | 93 (28.1%) | 0 (0.0%) |
| 75 Years and over | 7 (4.1%) | 0 (0.0%) |
| Total | 1,640 (61.0%) | 105 (6.4%) |
Employment Status by Educational Attainment in San Diego
According to labor force statistics for San Diego, 80.0% of individuals (1,462) out of the total population between 25 and 64 years of age (1,828) are in the labor force, with 7.2% or 105 of them being unemployed. The group with the highest labor force participation rate are those with the educational attainment of college / associate degree, with 89.5% or 778 individuals in the labor force. Within the labor force, individuals with high school diploma education have the highest percentage of unemployment, with 18.4% or 54 of them being unemployed.
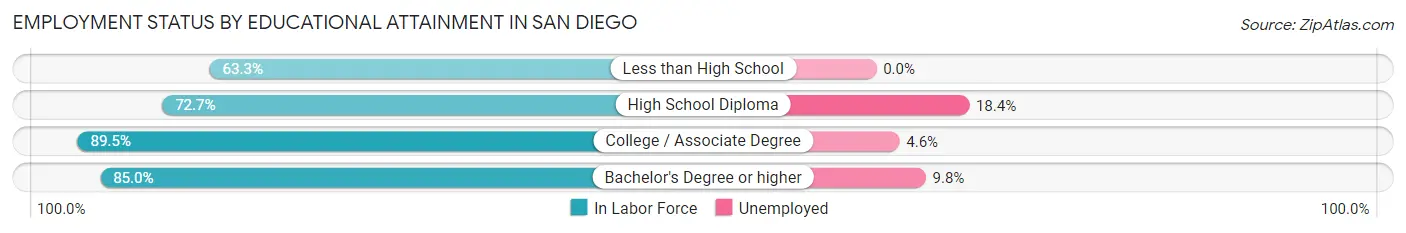
| Educational Attainment | In Labor Force | Unemployed |
| Less than High School | 238 (63.3%) | 0 (0.0%) |
| High School Diploma | 293 (72.7%) | 74 (18.4%) |
| College / Associate Degree | 778 (89.5%) | 40 (4.6%) |
| Bachelor's Degree or higher | 153 (85.0%) | 18 (9.8%) |
| Total | 1,462 (80.0%) | 132 (7.2%) |
Employment Occupations by Sex in San Diego
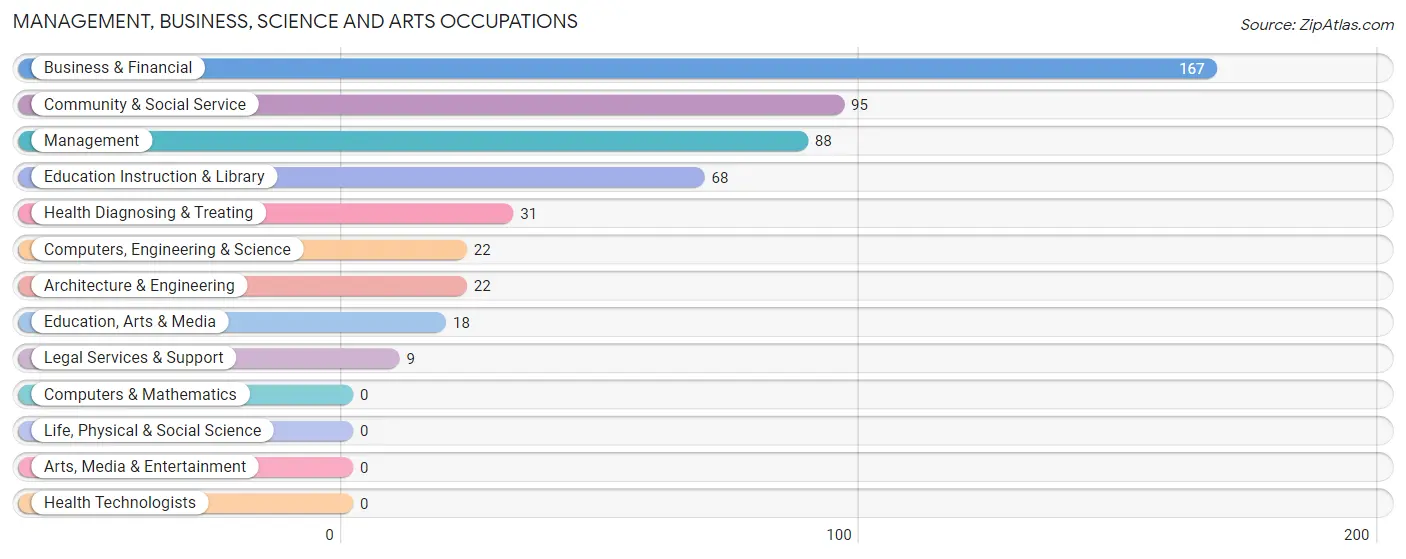
Management, Business, Science and Arts Occupations
The most common Management, Business, Science and Arts occupations in San Diego are Business & Financial (167 | 10.9%), Community & Social Service (95 | 6.2%), Management (88 | 5.7%), Education Instruction & Library (68 | 4.4%), and Health Diagnosing & Treating (31 | 2.0%).
Management, Business, Science and Arts Occupations by Sex
Within the Management, Business, Science and Arts occupations in San Diego, the most male-oriented occupations are Computers, Engineering & Science (100.0%), Architecture & Engineering (100.0%), and Management (73.9%), while the most female-oriented occupations are Education, Arts & Media (100.0%), Legal Services & Support (100.0%), and Community & Social Service (85.3%).
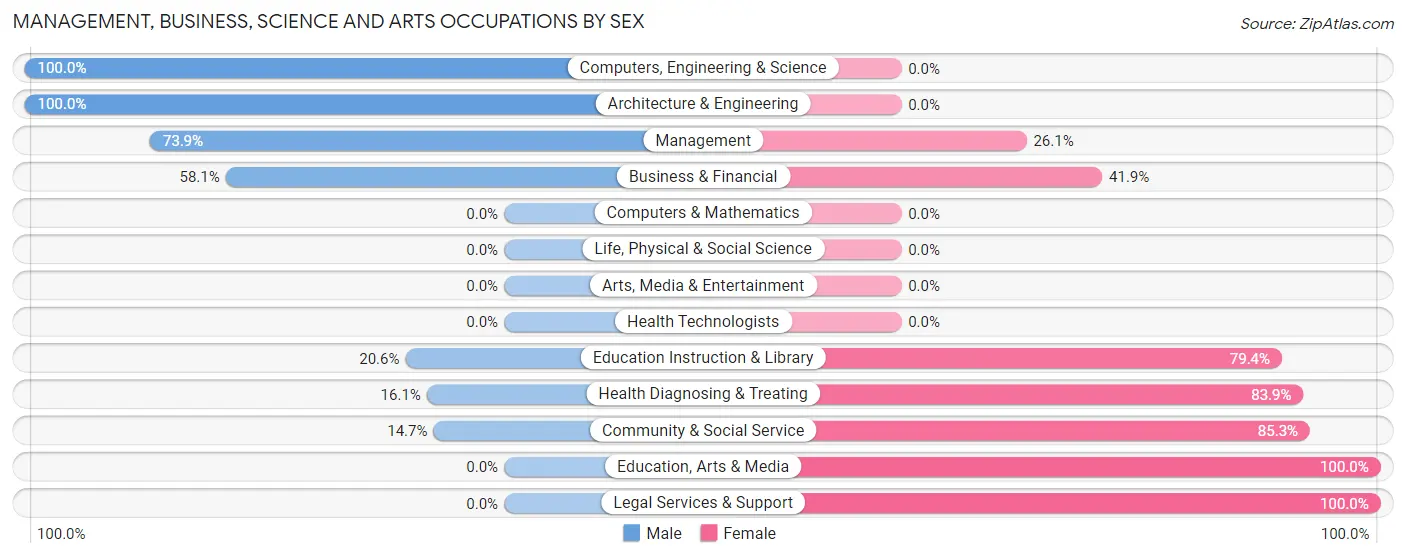
| Occupation | Male | Female |
| Management | 65 (73.9%) | 23 (26.1%) |
| Business & Financial | 97 (58.1%) | 70 (41.9%) |
| Computers, Engineering & Science | 22 (100.0%) | 0 (0.0%) |
| Computers & Mathematics | 0 (0.0%) | 0 (0.0%) |
| Architecture & Engineering | 22 (100.0%) | 0 (0.0%) |
| Life, Physical & Social Science | 0 (0.0%) | 0 (0.0%) |
| Community & Social Service | 14 (14.7%) | 81 (85.3%) |
| Education, Arts & Media | 0 (0.0%) | 18 (100.0%) |
| Legal Services & Support | 0 (0.0%) | 9 (100.0%) |
| Education Instruction & Library | 14 (20.6%) | 54 (79.4%) |
| Arts, Media & Entertainment | 0 (0.0%) | 0 (0.0%) |
| Health Diagnosing & Treating | 5 (16.1%) | 26 (83.9%) |
| Health Technologists | 0 (0.0%) | 0 (0.0%) |
| Total (Category) | 203 (50.4%) | 200 (49.6%) |
| Total (Overall) | 835 (54.4%) | 701 (45.6%) |
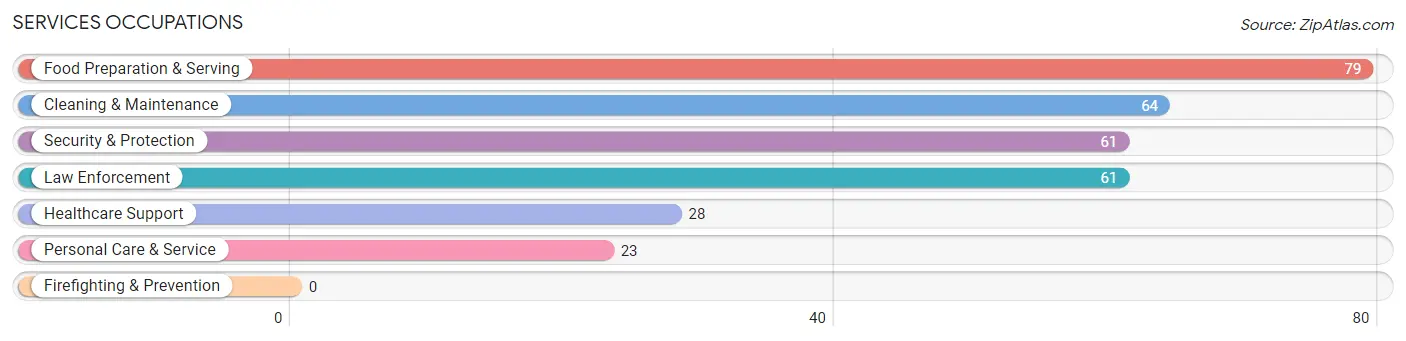
Services Occupations
The most common Services occupations in San Diego are Food Preparation & Serving (79 | 5.1%), Cleaning & Maintenance (64 | 4.2%), Security & Protection (61 | 4.0%), Law Enforcement (61 | 4.0%), and Healthcare Support (28 | 1.8%).
Services Occupations by Sex
Within the Services occupations in San Diego, the most male-oriented occupations are Personal Care & Service (100.0%), and Cleaning & Maintenance (29.7%), while the most female-oriented occupations are Healthcare Support (100.0%), Security & Protection (100.0%), and Law Enforcement (100.0%).
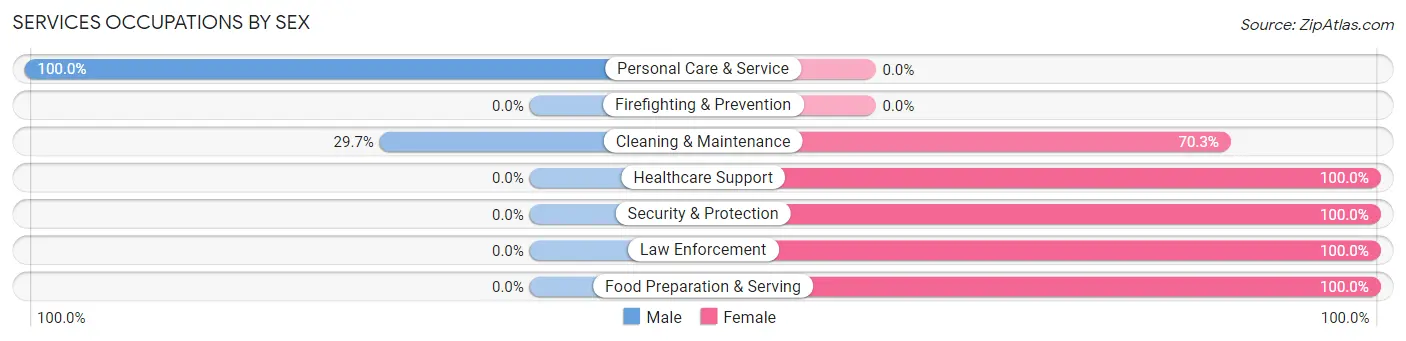
| Occupation | Male | Female |
| Healthcare Support | 0 (0.0%) | 28 (100.0%) |
| Security & Protection | 0 (0.0%) | 61 (100.0%) |
| Firefighting & Prevention | 0 (0.0%) | 0 (0.0%) |
| Law Enforcement | 0 (0.0%) | 61 (100.0%) |
| Food Preparation & Serving | 0 (0.0%) | 79 (100.0%) |
| Cleaning & Maintenance | 19 (29.7%) | 45 (70.3%) |
| Personal Care & Service | 23 (100.0%) | 0 (0.0%) |
| Total (Category) | 42 (16.5%) | 213 (83.5%) |
| Total (Overall) | 835 (54.4%) | 701 (45.6%) |
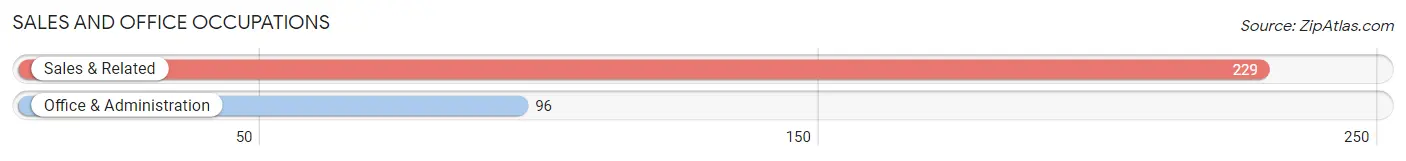
Sales and Office Occupations
The most common Sales and Office occupations in San Diego are Sales & Related (229 | 14.9%), and Office & Administration (96 | 6.2%).
Sales and Office Occupations by Sex
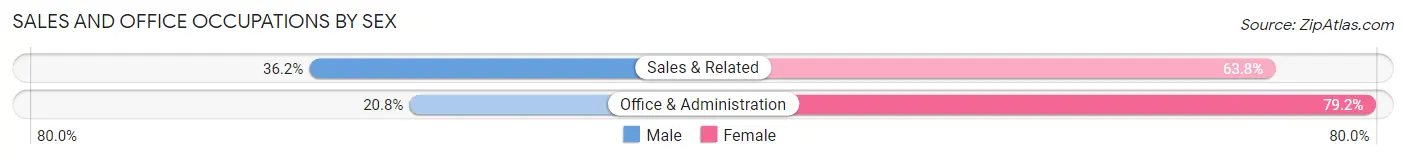
| Occupation | Male | Female |
| Sales & Related | 83 (36.2%) | 146 (63.8%) |
| Office & Administration | 20 (20.8%) | 76 (79.2%) |
| Total (Category) | 103 (31.7%) | 222 (68.3%) |
| Total (Overall) | 835 (54.4%) | 701 (45.6%) |
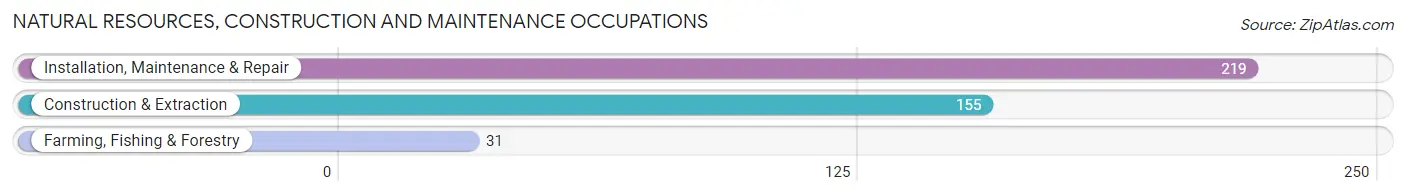
Natural Resources, Construction and Maintenance Occupations
The most common Natural Resources, Construction and Maintenance occupations in San Diego are Installation, Maintenance & Repair (219 | 14.3%), Construction & Extraction (155 | 10.1%), and Farming, Fishing & Forestry (31 | 2.0%).
Natural Resources, Construction and Maintenance Occupations by Sex
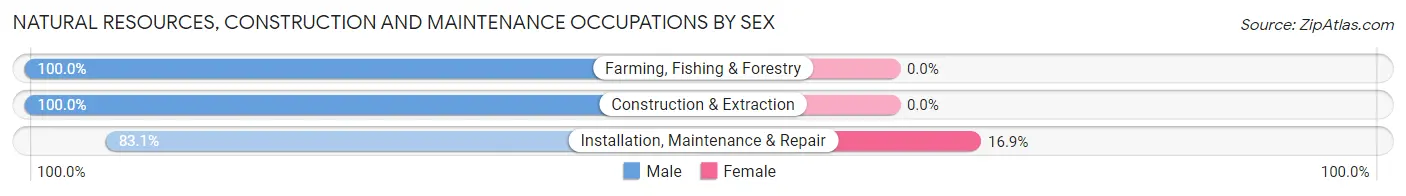
| Occupation | Male | Female |
| Farming, Fishing & Forestry | 31 (100.0%) | 0 (0.0%) |
| Construction & Extraction | 155 (100.0%) | 0 (0.0%) |
| Installation, Maintenance & Repair | 182 (83.1%) | 37 (16.9%) |
| Total (Category) | 368 (90.9%) | 37 (9.1%) |
| Total (Overall) | 835 (54.4%) | 701 (45.6%) |
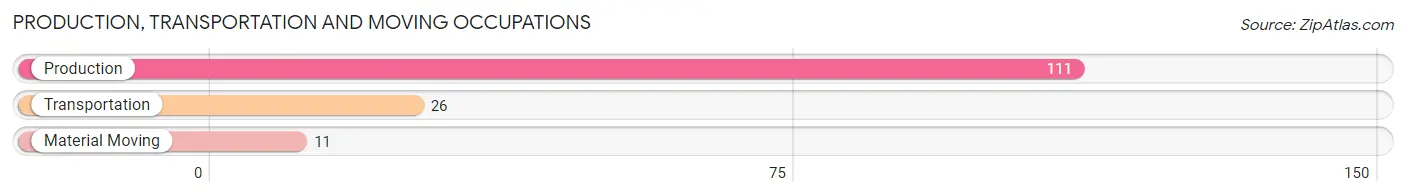
Production, Transportation and Moving Occupations
The most common Production, Transportation and Moving occupations in San Diego are Production (111 | 7.2%), Transportation (26 | 1.7%), and Material Moving (11 | 0.7%).
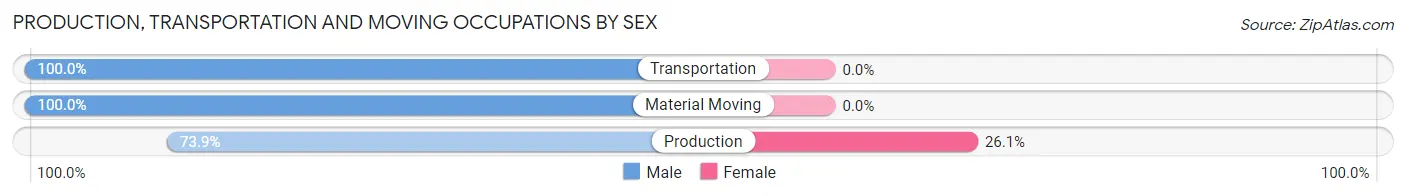
Production, Transportation and Moving Occupations by Sex
| Occupation | Male | Female |
| Production | 82 (73.9%) | 29 (26.1%) |
| Transportation | 26 (100.0%) | 0 (0.0%) |
| Material Moving | 11 (100.0%) | 0 (0.0%) |
| Total (Category) | 119 (80.4%) | 29 (19.6%) |
| Total (Overall) | 835 (54.4%) | 701 (45.6%) |
Employment Industries by Sex in San Diego
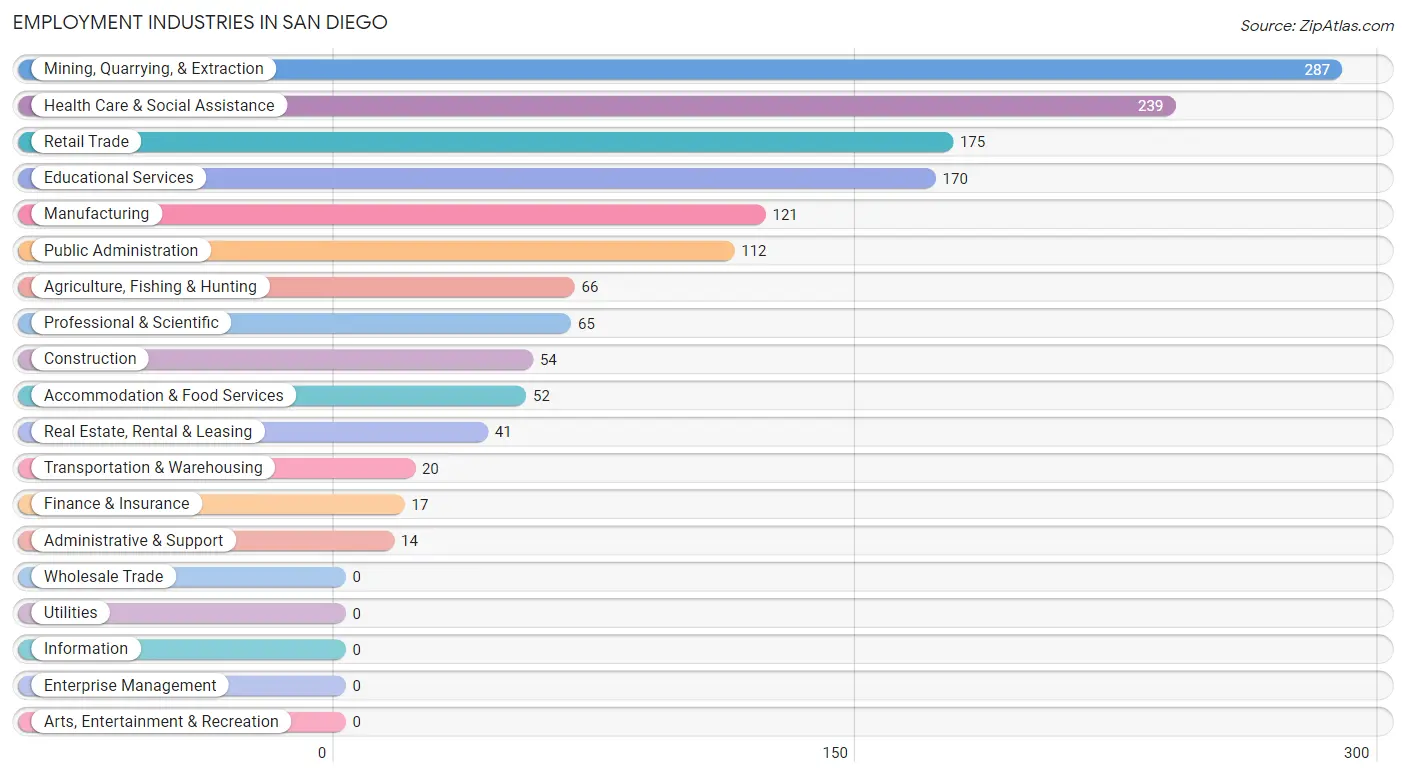
Employment Industries in San Diego
The major employment industries in San Diego include Mining, Quarrying, & Extraction (287 | 18.7%), Health Care & Social Assistance (239 | 15.6%), Retail Trade (175 | 11.4%), Educational Services (170 | 11.1%), and Manufacturing (121 | 7.9%).
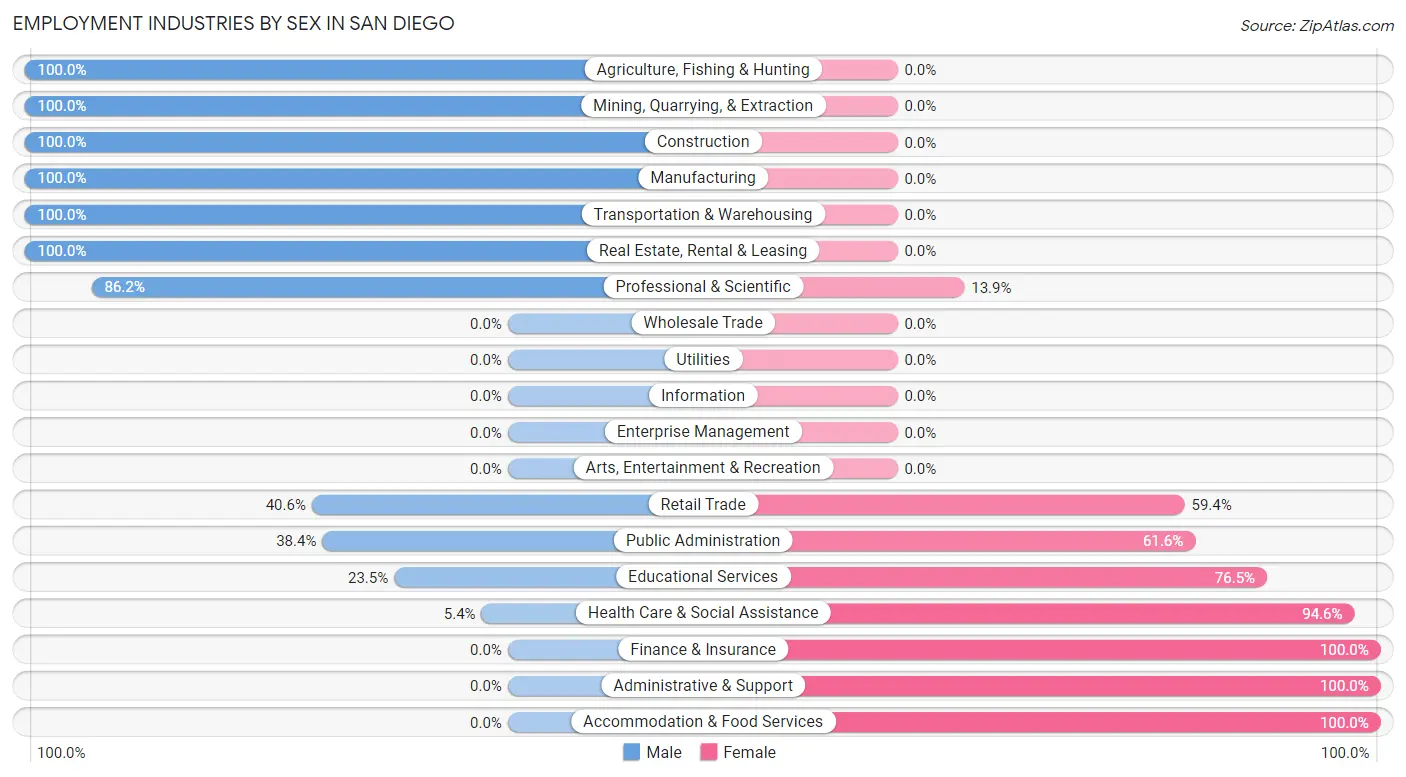
Employment Industries by Sex in San Diego
The San Diego industries that see more men than women are Agriculture, Fishing & Hunting (100.0%), Mining, Quarrying, & Extraction (100.0%), and Construction (100.0%), whereas the industries that tend to have a higher number of women are Finance & Insurance (100.0%), Administrative & Support (100.0%), and Accommodation & Food Services (100.0%).
| Industry | Male | Female |
| Agriculture, Fishing & Hunting | 66 (100.0%) | 0 (0.0%) |
| Mining, Quarrying, & Extraction | 287 (100.0%) | 0 (0.0%) |
| Construction | 54 (100.0%) | 0 (0.0%) |
| Manufacturing | 121 (100.0%) | 0 (0.0%) |
| Wholesale Trade | 0 (0.0%) | 0 (0.0%) |
| Retail Trade | 71 (40.6%) | 104 (59.4%) |
| Transportation & Warehousing | 20 (100.0%) | 0 (0.0%) |
| Utilities | 0 (0.0%) | 0 (0.0%) |
| Information | 0 (0.0%) | 0 (0.0%) |
| Finance & Insurance | 0 (0.0%) | 17 (100.0%) |
| Real Estate, Rental & Leasing | 41 (100.0%) | 0 (0.0%) |
| Professional & Scientific | 56 (86.2%) | 9 (13.9%) |
| Enterprise Management | 0 (0.0%) | 0 (0.0%) |
| Administrative & Support | 0 (0.0%) | 14 (100.0%) |
| Educational Services | 40 (23.5%) | 130 (76.5%) |
| Health Care & Social Assistance | 13 (5.4%) | 226 (94.6%) |
| Arts, Entertainment & Recreation | 0 (0.0%) | 0 (0.0%) |
| Accommodation & Food Services | 0 (0.0%) | 52 (100.0%) |
| Public Administration | 43 (38.4%) | 69 (61.6%) |
| Total | 835 (54.4%) | 701 (45.6%) |
Education in San Diego
School Enrollment in San Diego
The most common levels of schooling among the 1,320 students in San Diego are middle school (387 | 29.3%), high school (337 | 25.5%), and elementary school (260 | 19.7%).
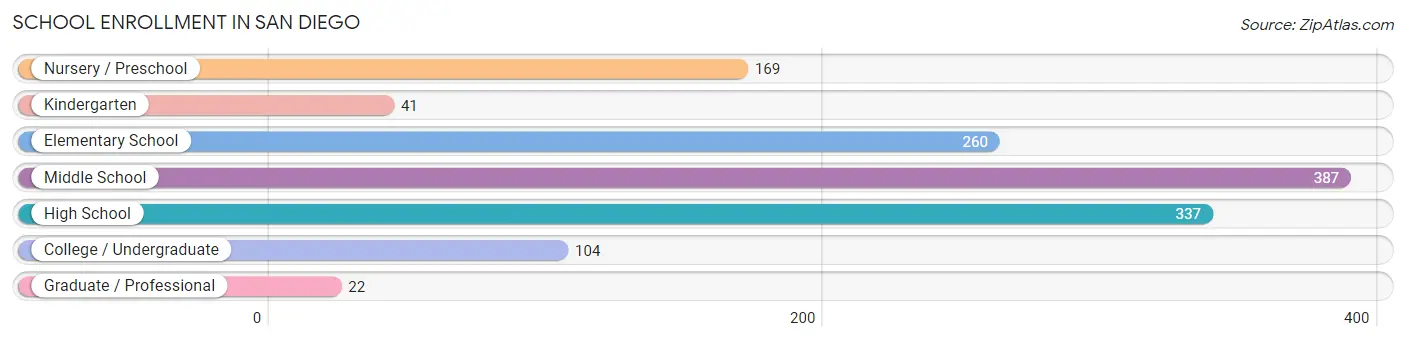
| School Level | # Students | % Students |
| Nursery / Preschool | 169 | 12.8% |
| Kindergarten | 41 | 3.1% |
| Elementary School | 260 | 19.7% |
| Middle School | 387 | 29.3% |
| High School | 337 | 25.5% |
| College / Undergraduate | 104 | 7.9% |
| Graduate / Professional | 22 | 1.7% |
| Total | 1,320 | 100.0% |
School Enrollment by Age by Funding Source in San Diego
Out of a total of 1,320 students who are enrolled in schools in San Diego, 62 (4.7%) attend a private institution, while the remaining 1,258 (95.3%) are enrolled in public schools. The age group of 3 to 4 year olds has the highest likelihood of being enrolled in private schools, with 21 (12.4% in the age bracket) enrolled. Conversely, the age group of 5 to 9 year old has the lowest likelihood of being enrolled in a private school, with 264 (100.0% in the age bracket) attending a public institution.
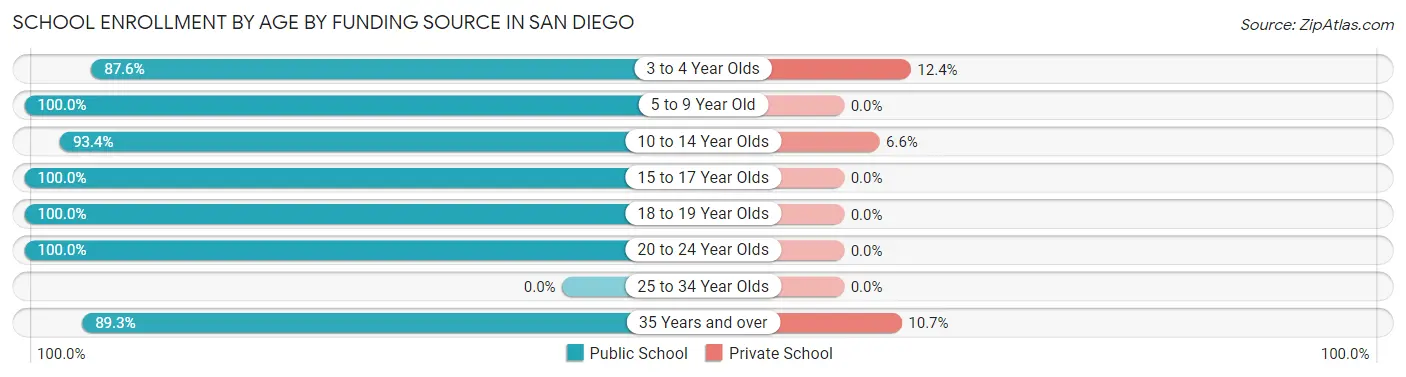
| Age Bracket | Public School | Private School |
| 3 to 4 Year Olds | 148 (87.6%) | 21 (12.4%) |
| 5 to 9 Year Old | 264 (100.0%) | 0 (0.0%) |
| 10 to 14 Year Olds | 396 (93.4%) | 28 (6.6%) |
| 15 to 17 Year Olds | 151 (100.0%) | 0 (0.0%) |
| 18 to 19 Year Olds | 148 (100.0%) | 0 (0.0%) |
| 20 to 24 Year Olds | 43 (100.0%) | 0 (0.0%) |
| 25 to 34 Year Olds | 0 (0.0%) | 0 (0.0%) |
| 35 Years and over | 108 (89.3%) | 13 (10.7%) |
| Total | 1,258 (95.3%) | 62 (4.7%) |
Educational Attainment by Field of Study in San Diego
Business (76 | 34.5%), education (59 | 26.8%), computers & mathematics (20 | 9.1%), literature & languages (17 | 7.7%), and visual & performing arts (15 | 6.8%) are the most common fields of study among 220 individuals in San Diego who have obtained a bachelor's degree or higher.
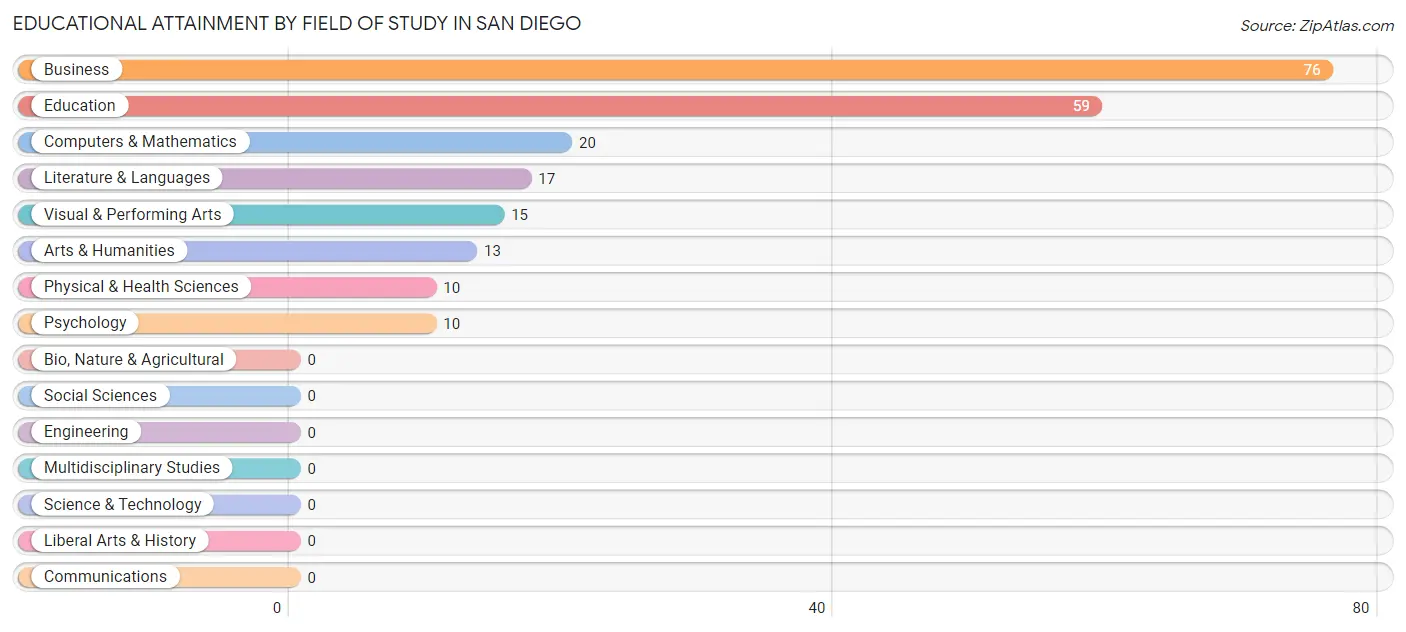
| Field of Study | # Graduates | % Graduates |
| Computers & Mathematics | 20 | 9.1% |
| Bio, Nature & Agricultural | 0 | 0.0% |
| Physical & Health Sciences | 10 | 4.5% |
| Psychology | 10 | 4.5% |
| Social Sciences | 0 | 0.0% |
| Engineering | 0 | 0.0% |
| Multidisciplinary Studies | 0 | 0.0% |
| Science & Technology | 0 | 0.0% |
| Business | 76 | 34.5% |
| Education | 59 | 26.8% |
| Literature & Languages | 17 | 7.7% |
| Liberal Arts & History | 0 | 0.0% |
| Visual & Performing Arts | 15 | 6.8% |
| Communications | 0 | 0.0% |
| Arts & Humanities | 13 | 5.9% |
| Total | 220 | 100.0% |
Transportation & Commute in San Diego
Vehicle Availability by Sex in San Diego
The most prevalent vehicle ownership categories in San Diego are males with 3 vehicles (391, accounting for 46.8%) and females with 3 vehicles (60, making up 59.5%).
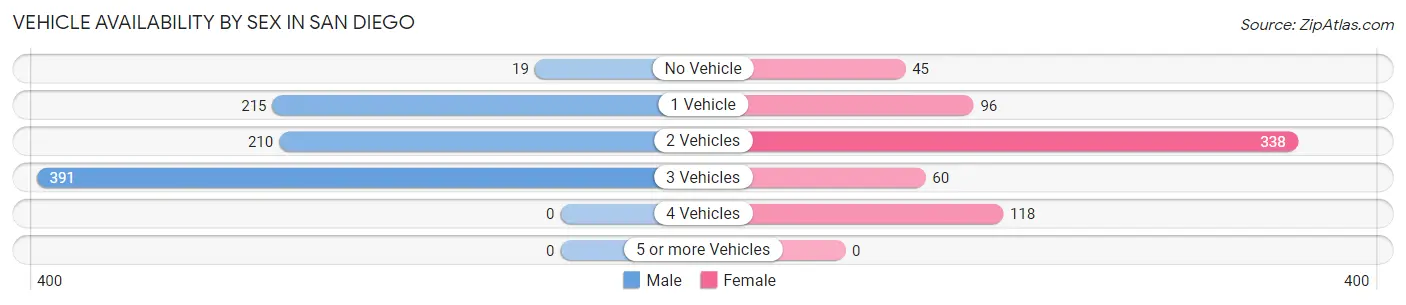
| Vehicles Available | Male | Female |
| No Vehicle | 19 (2.3%) | 45 (6.9%) |
| 1 Vehicle | 215 (25.8%) | 96 (14.6%) |
| 2 Vehicles | 210 (25.2%) | 338 (51.4%) |
| 3 Vehicles | 391 (46.8%) | 60 (9.1%) |
| 4 Vehicles | 0 (0.0%) | 118 (18.0%) |
| 5 or more Vehicles | 0 (0.0%) | 0 (0.0%) |
| Total | 835 (100.0%) | 657 (100.0%) |
Commute Time in San Diego
The most frequently occuring commute durations in San Diego are 15 to 19 minutes (215 commuters, 16.0%), 45 to 59 minutes (205 commuters, 15.2%), and 60 to 89 minutes (203 commuters, 15.1%).
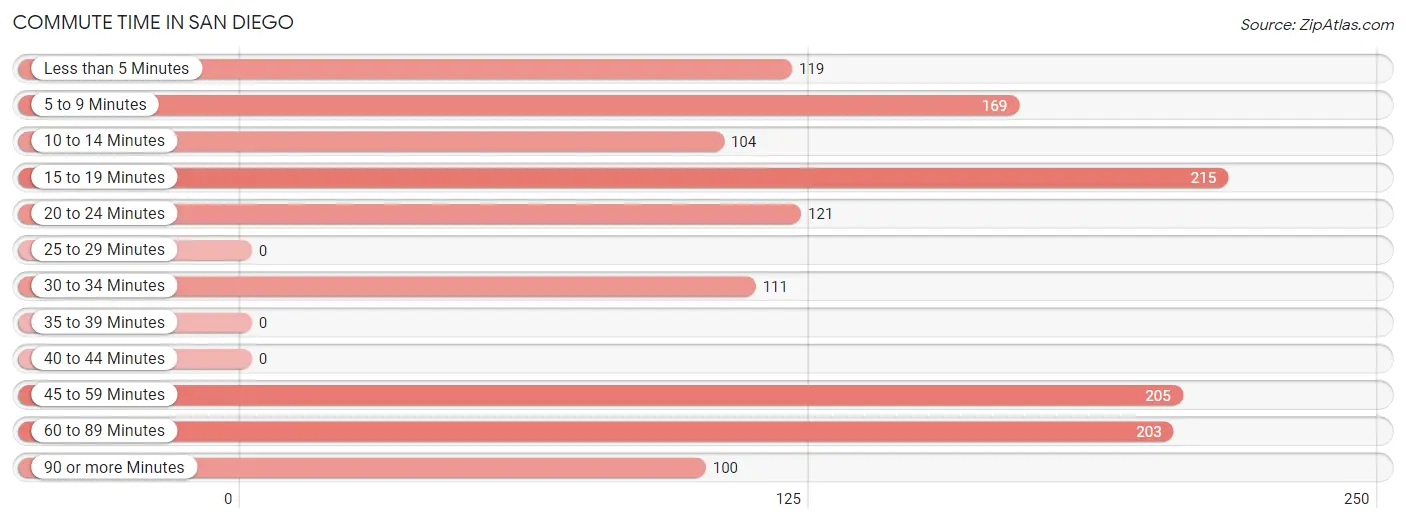
| Commute Time | # Commuters | % Commuters |
| Less than 5 Minutes | 119 | 8.8% |
| 5 to 9 Minutes | 169 | 12.6% |
| 10 to 14 Minutes | 104 | 7.7% |
| 15 to 19 Minutes | 215 | 16.0% |
| 20 to 24 Minutes | 121 | 9.0% |
| 25 to 29 Minutes | 0 | 0.0% |
| 30 to 34 Minutes | 111 | 8.2% |
| 35 to 39 Minutes | 0 | 0.0% |
| 40 to 44 Minutes | 0 | 0.0% |
| 45 to 59 Minutes | 205 | 15.2% |
| 60 to 89 Minutes | 203 | 15.1% |
| 90 or more Minutes | 100 | 7.4% |
Commute Time by Sex in San Diego
The most common commute times in San Diego are 45 to 59 minutes (205 commuters, 26.9%) for males and 15 to 19 minutes (154 commuters, 26.4%) for females.
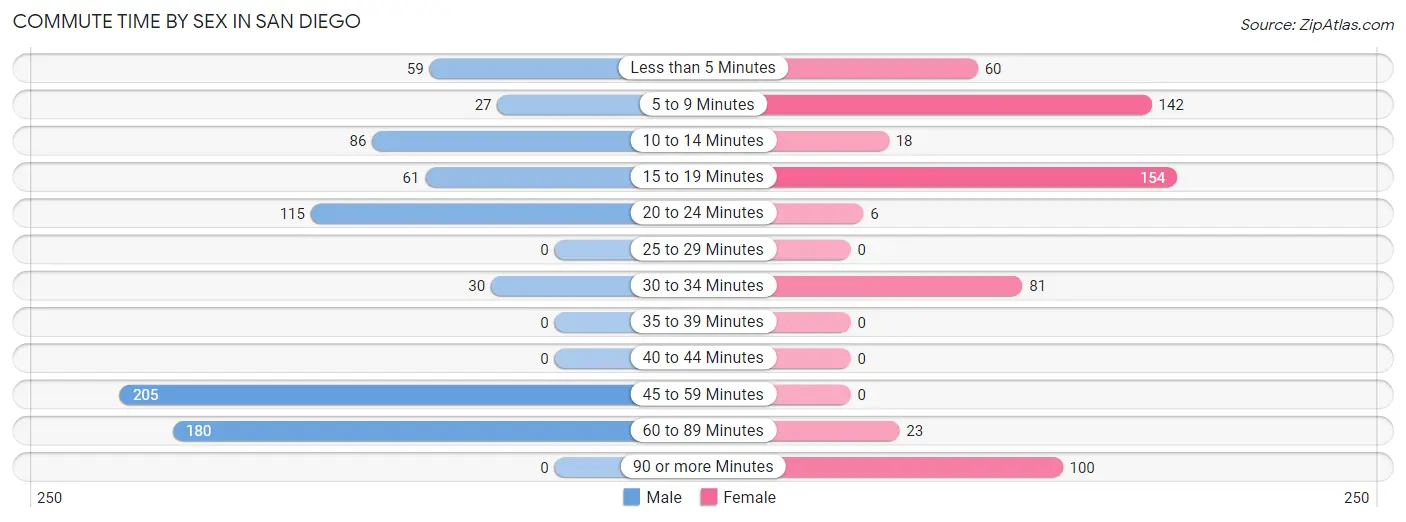
| Commute Time | Male | Female |
| Less than 5 Minutes | 59 (7.7%) | 60 (10.3%) |
| 5 to 9 Minutes | 27 (3.5%) | 142 (24.3%) |
| 10 to 14 Minutes | 86 (11.3%) | 18 (3.1%) |
| 15 to 19 Minutes | 61 (8.0%) | 154 (26.4%) |
| 20 to 24 Minutes | 115 (15.1%) | 6 (1.0%) |
| 25 to 29 Minutes | 0 (0.0%) | 0 (0.0%) |
| 30 to 34 Minutes | 30 (3.9%) | 81 (13.9%) |
| 35 to 39 Minutes | 0 (0.0%) | 0 (0.0%) |
| 40 to 44 Minutes | 0 (0.0%) | 0 (0.0%) |
| 45 to 59 Minutes | 205 (26.9%) | 0 (0.0%) |
| 60 to 89 Minutes | 180 (23.6%) | 23 (3.9%) |
| 90 or more Minutes | 0 (0.0%) | 100 (17.1%) |
Time of Departure to Work by Sex in San Diego
The most frequent times of departure to work in San Diego are 6:30 AM to 6:59 AM (166, 21.8%) for males and 6:30 AM to 6:59 AM (173, 29.6%) for females.
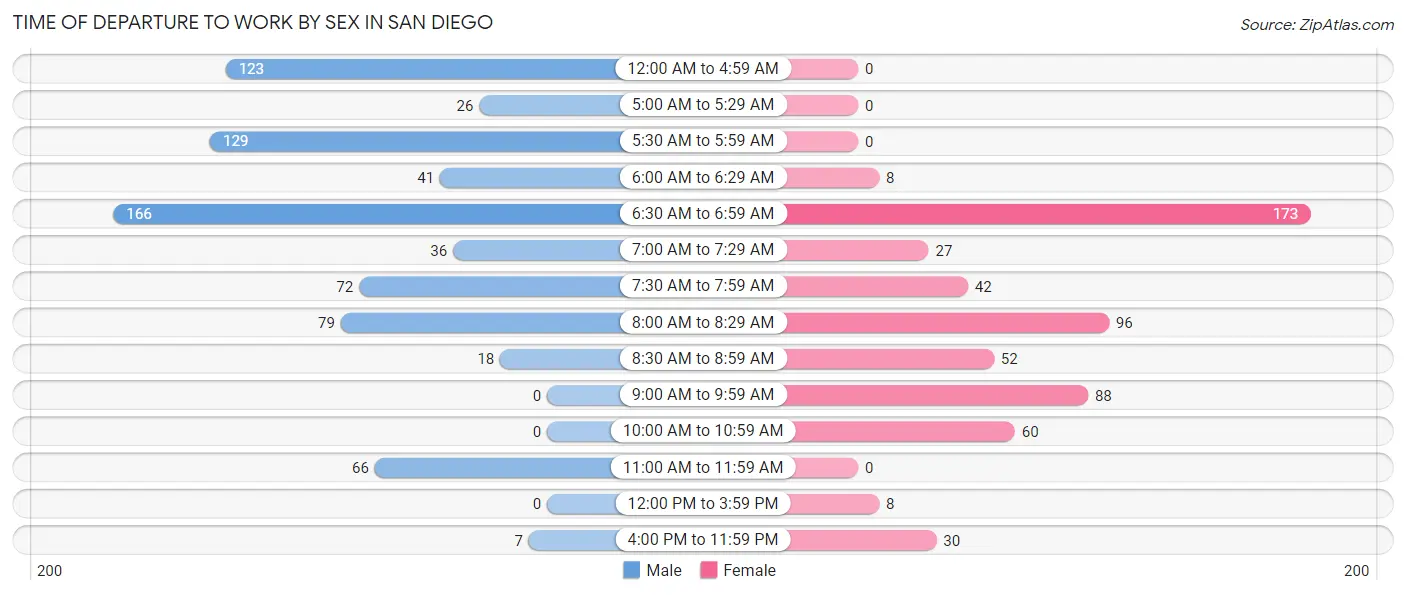
| Time of Departure | Male | Female |
| 12:00 AM to 4:59 AM | 123 (16.1%) | 0 (0.0%) |
| 5:00 AM to 5:29 AM | 26 (3.4%) | 0 (0.0%) |
| 5:30 AM to 5:59 AM | 129 (16.9%) | 0 (0.0%) |
| 6:00 AM to 6:29 AM | 41 (5.4%) | 8 (1.4%) |
| 6:30 AM to 6:59 AM | 166 (21.8%) | 173 (29.6%) |
| 7:00 AM to 7:29 AM | 36 (4.7%) | 27 (4.6%) |
| 7:30 AM to 7:59 AM | 72 (9.4%) | 42 (7.2%) |
| 8:00 AM to 8:29 AM | 79 (10.3%) | 96 (16.4%) |
| 8:30 AM to 8:59 AM | 18 (2.4%) | 52 (8.9%) |
| 9:00 AM to 9:59 AM | 0 (0.0%) | 88 (15.1%) |
| 10:00 AM to 10:59 AM | 0 (0.0%) | 60 (10.3%) |
| 11:00 AM to 11:59 AM | 66 (8.6%) | 0 (0.0%) |
| 12:00 PM to 3:59 PM | 0 (0.0%) | 8 (1.4%) |
| 4:00 PM to 11:59 PM | 7 (0.9%) | 30 (5.1%) |
| Total | 763 (100.0%) | 584 (100.0%) |
Housing Occupancy in San Diego
Occupancy by Ownership in San Diego
Of the total 1,238 dwellings in San Diego, owner-occupied units account for 987 (79.7%), while renter-occupied units make up 251 (20.3%).
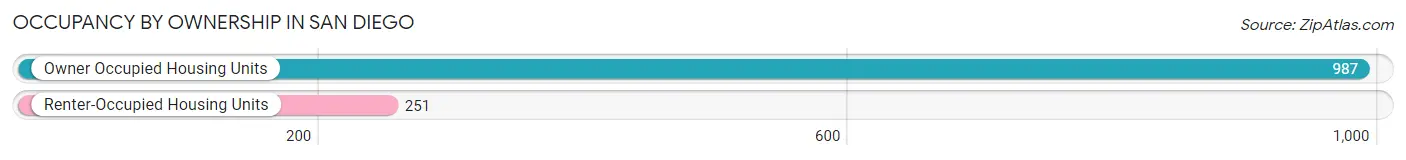
| Occupancy | # Housing Units | % Housing Units |
| Owner Occupied Housing Units | 987 | 79.7% |
| Renter-Occupied Housing Units | 251 | 20.3% |
| Total Occupied Housing Units | 1,238 | 100.0% |
Occupancy by Household Size in San Diego
| Household Size | # Housing Units | % Housing Units |
| 1-Person Household | 453 | 36.6% |
| 2-Person Household | 230 | 18.6% |
| 3-Person Household | 229 | 18.5% |
| 4+ Person Household | 326 | 26.3% |
| Total Housing Units | 1,238 | 100.0% |
Occupancy by Ownership by Household Size in San Diego
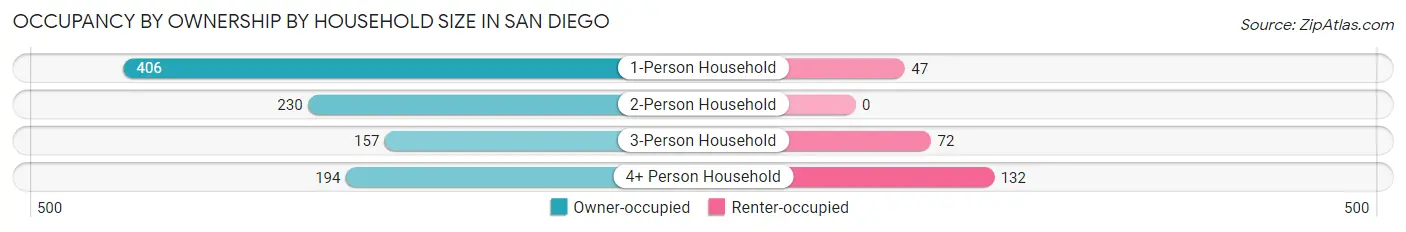
| Household Size | Owner-occupied | Renter-occupied |
| 1-Person Household | 406 (89.6%) | 47 (10.4%) |
| 2-Person Household | 230 (100.0%) | 0 (0.0%) |
| 3-Person Household | 157 (68.6%) | 72 (31.4%) |
| 4+ Person Household | 194 (59.5%) | 132 (40.5%) |
| Total Housing Units | 987 (79.7%) | 251 (20.3%) |
Occupancy by Educational Attainment in San Diego
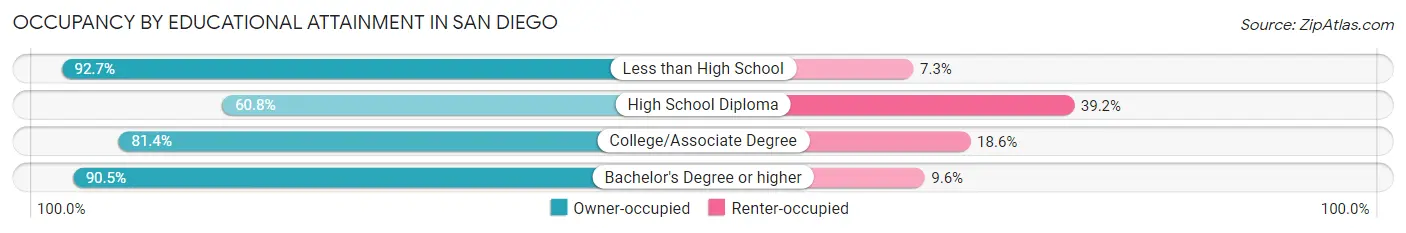
| Household Size | Owner-occupied | Renter-occupied |
| Less than High School | 215 (92.7%) | 17 (7.3%) |
| High School Diploma | 180 (60.8%) | 116 (39.2%) |
| College/Associate Degree | 450 (81.4%) | 103 (18.6%) |
| Bachelor's Degree or higher | 142 (90.4%) | 15 (9.6%) |
Occupancy by Age of Householder in San Diego
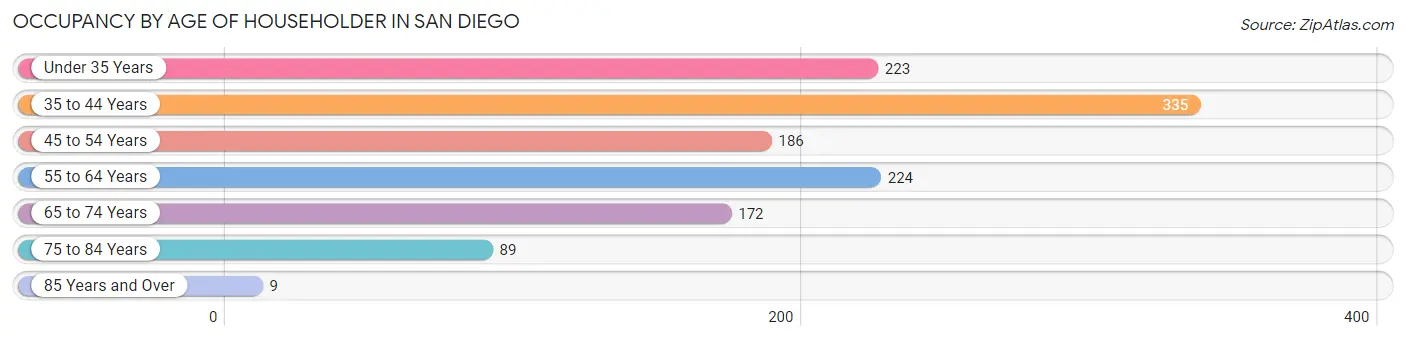
| Age Bracket | # Households | % Households |
| Under 35 Years | 223 | 18.0% |
| 35 to 44 Years | 335 | 27.1% |
| 45 to 54 Years | 186 | 15.0% |
| 55 to 64 Years | 224 | 18.1% |
| 65 to 74 Years | 172 | 13.9% |
| 75 to 84 Years | 89 | 7.2% |
| 85 Years and Over | 9 | 0.7% |
| Total | 1,238 | 100.0% |
Housing Finances in San Diego
Median Income by Occupancy in San Diego
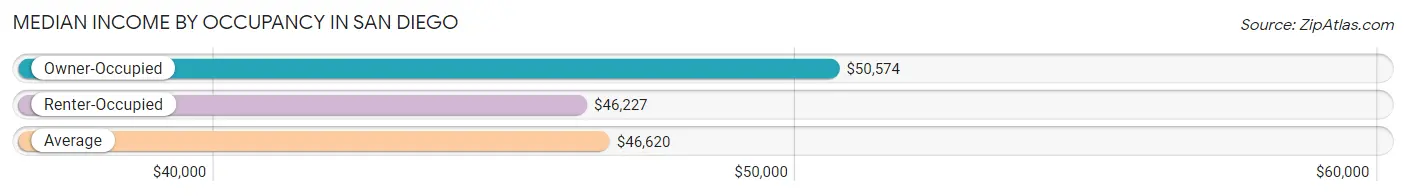
| Occupancy Type | # Households | Median Income |
| Owner-Occupied | 987 (79.7%) | $50,574 |
| Renter-Occupied | 251 (20.3%) | $46,227 |
| Average | 1,238 (100.0%) | $46,620 |
Occupancy by Householder Income Bracket in San Diego
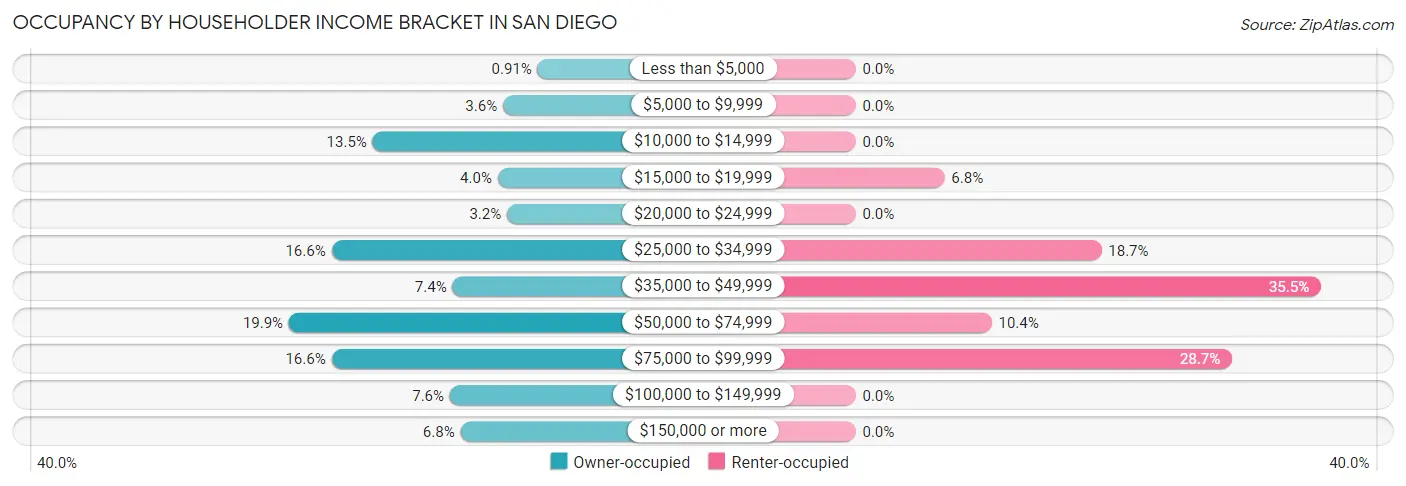
| Income Bracket | Owner-occupied | Renter-occupied |
| Less than $5,000 | 9 (0.9%) | 0 (0.0%) |
| $5,000 to $9,999 | 35 (3.5%) | 0 (0.0%) |
| $10,000 to $14,999 | 133 (13.5%) | 0 (0.0%) |
| $15,000 to $19,999 | 39 (4.0%) | 17 (6.8%) |
| $20,000 to $24,999 | 32 (3.2%) | 0 (0.0%) |
| $25,000 to $34,999 | 164 (16.6%) | 47 (18.7%) |
| $35,000 to $49,999 | 73 (7.4%) | 89 (35.5%) |
| $50,000 to $74,999 | 196 (19.9%) | 26 (10.4%) |
| $75,000 to $99,999 | 164 (16.6%) | 72 (28.7%) |
| $100,000 to $149,999 | 75 (7.6%) | 0 (0.0%) |
| $150,000 or more | 67 (6.8%) | 0 (0.0%) |
| Total | 987 (100.0%) | 251 (100.0%) |
Monthly Housing Cost Tiers in San Diego
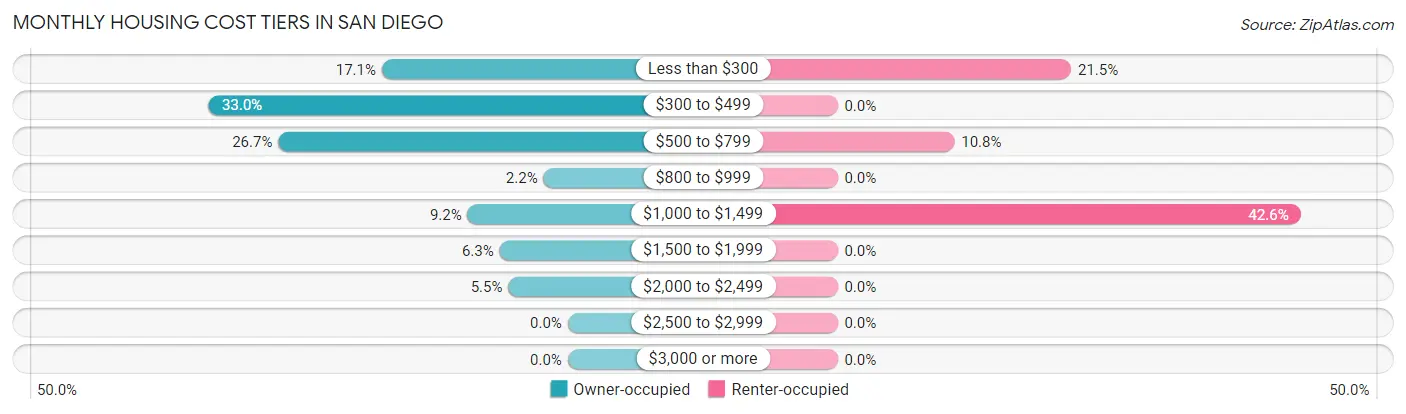
| Monthly Cost | Owner-occupied | Renter-occupied |
| Less than $300 | 169 (17.1%) | 54 (21.5%) |
| $300 to $499 | 326 (33.0%) | 0 (0.0%) |
| $500 to $799 | 263 (26.7%) | 27 (10.8%) |
| $800 to $999 | 22 (2.2%) | 0 (0.0%) |
| $1,000 to $1,499 | 91 (9.2%) | 107 (42.6%) |
| $1,500 to $1,999 | 62 (6.3%) | 0 (0.0%) |
| $2,000 to $2,499 | 54 (5.5%) | 0 (0.0%) |
| $2,500 to $2,999 | 0 (0.0%) | 0 (0.0%) |
| $3,000 or more | 0 (0.0%) | 0 (0.0%) |
| Total | 987 (100.0%) | 251 (100.0%) |
Physical Housing Characteristics in San Diego
Housing Structures in San Diego
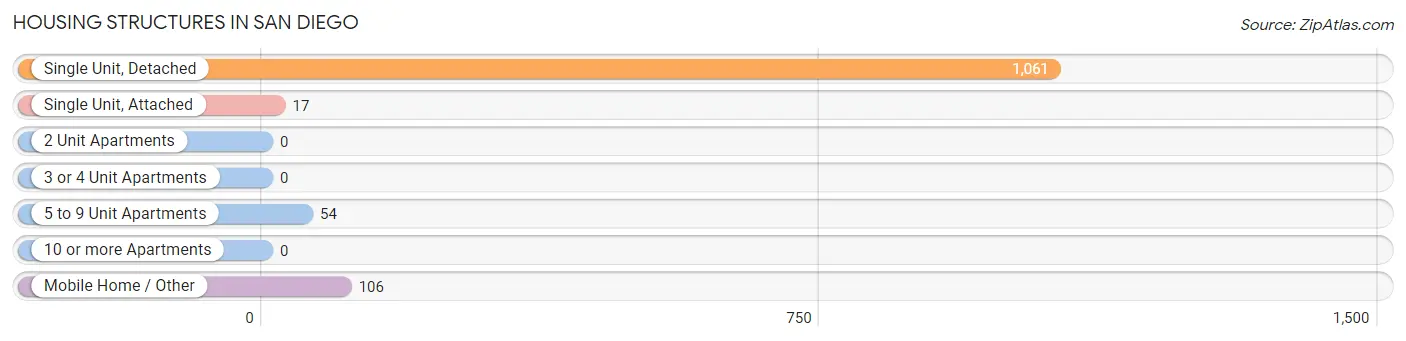
| Structure Type | # Housing Units | % Housing Units |
| Single Unit, Detached | 1,061 | 85.7% |
| Single Unit, Attached | 17 | 1.4% |
| 2 Unit Apartments | 0 | 0.0% |
| 3 or 4 Unit Apartments | 0 | 0.0% |
| 5 to 9 Unit Apartments | 54 | 4.4% |
| 10 or more Apartments | 0 | 0.0% |
| Mobile Home / Other | 106 | 8.6% |
| Total | 1,238 | 100.0% |
Housing Structures by Occupancy in San Diego
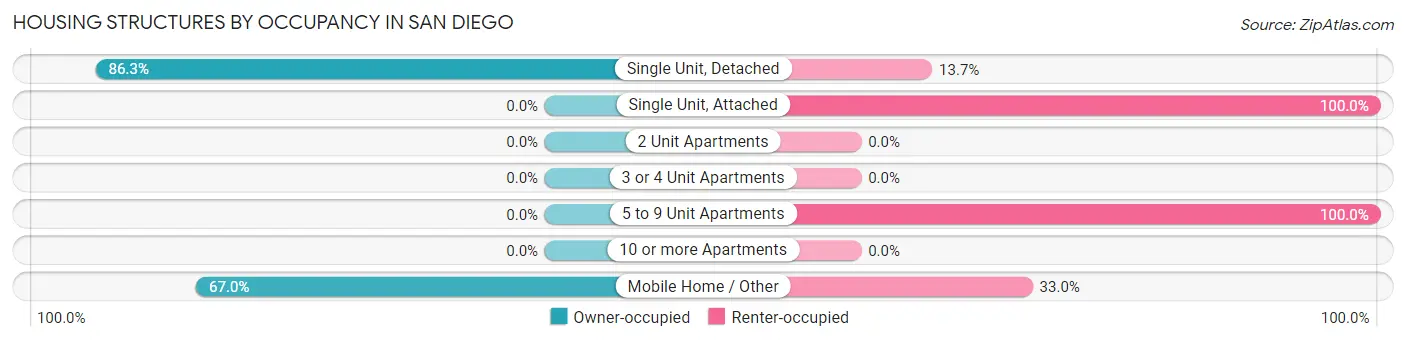
| Structure Type | Owner-occupied | Renter-occupied |
| Single Unit, Detached | 916 (86.3%) | 145 (13.7%) |
| Single Unit, Attached | 0 (0.0%) | 17 (100.0%) |
| 2 Unit Apartments | 0 (0.0%) | 0 (0.0%) |
| 3 or 4 Unit Apartments | 0 (0.0%) | 0 (0.0%) |
| 5 to 9 Unit Apartments | 0 (0.0%) | 54 (100.0%) |
| 10 or more Apartments | 0 (0.0%) | 0 (0.0%) |
| Mobile Home / Other | 71 (67.0%) | 35 (33.0%) |
| Total | 987 (79.7%) | 251 (20.3%) |
Housing Structures by Number of Rooms in San Diego
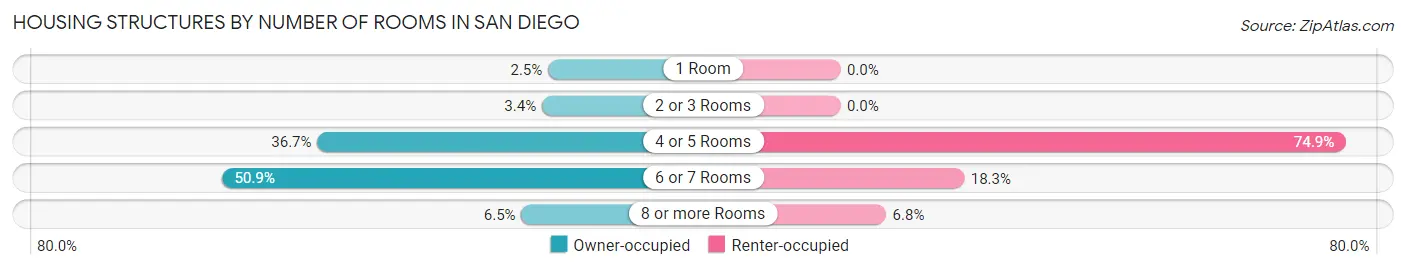
| Number of Rooms | Owner-occupied | Renter-occupied |
| 1 Room | 25 (2.5%) | 0 (0.0%) |
| 2 or 3 Rooms | 34 (3.4%) | 0 (0.0%) |
| 4 or 5 Rooms | 362 (36.7%) | 188 (74.9%) |
| 6 or 7 Rooms | 502 (50.9%) | 46 (18.3%) |
| 8 or more Rooms | 64 (6.5%) | 17 (6.8%) |
| Total | 987 (100.0%) | 251 (100.0%) |
Housing Structure by Heating Type in San Diego
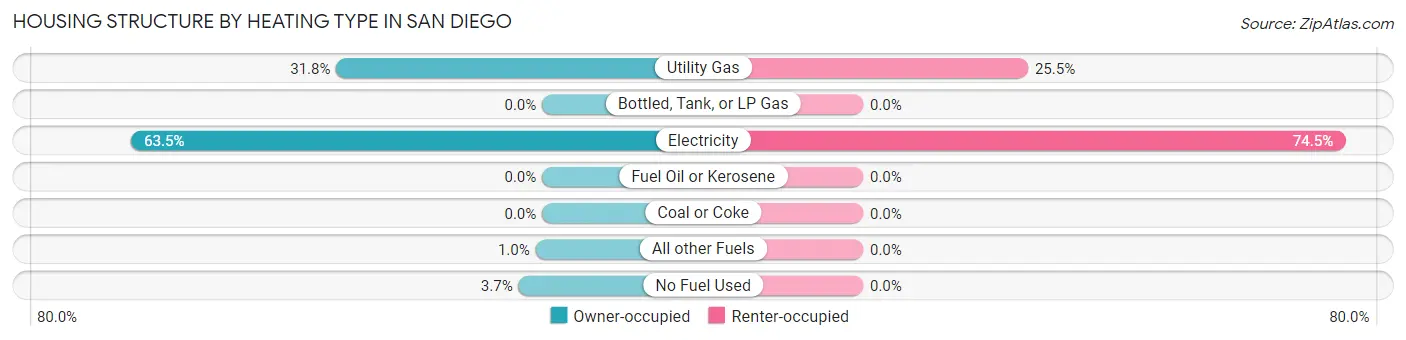
| Heating Type | Owner-occupied | Renter-occupied |
| Utility Gas | 314 (31.8%) | 64 (25.5%) |
| Bottled, Tank, or LP Gas | 0 (0.0%) | 0 (0.0%) |
| Electricity | 627 (63.5%) | 187 (74.5%) |
| Fuel Oil or Kerosene | 0 (0.0%) | 0 (0.0%) |
| Coal or Coke | 0 (0.0%) | 0 (0.0%) |
| All other Fuels | 10 (1.0%) | 0 (0.0%) |
| No Fuel Used | 36 (3.6%) | 0 (0.0%) |
| Total | 987 (100.0%) | 251 (100.0%) |
Household Vehicle Usage in San Diego
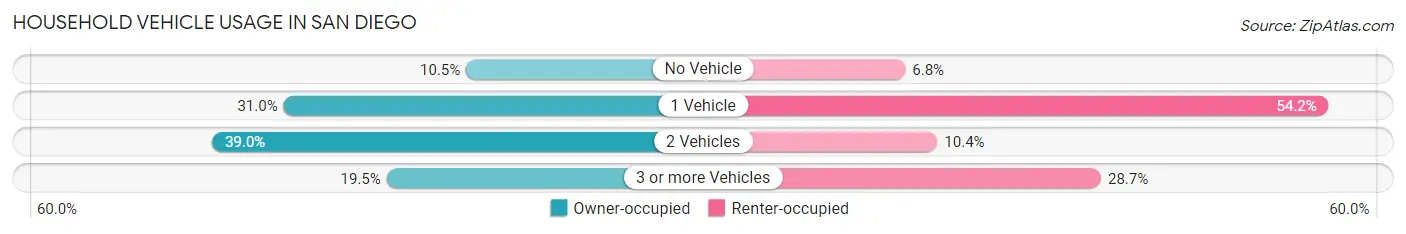
| Vehicles per Household | Owner-occupied | Renter-occupied |
| No Vehicle | 104 (10.5%) | 17 (6.8%) |
| 1 Vehicle | 306 (31.0%) | 136 (54.2%) |
| 2 Vehicles | 385 (39.0%) | 26 (10.4%) |
| 3 or more Vehicles | 192 (19.5%) | 72 (28.7%) |
| Total | 987 (100.0%) | 251 (100.0%) |
Real Estate & Mortgages in San Diego
Real Estate and Mortgage Overview in San Diego
| Characteristic | Without Mortgage | With Mortgage |
| Housing Units | 686 | 301 |
| Median Property Value | $48,700 | $136,300 |
| Median Household Income | $34,392 | $0 |
| Monthly Housing Costs | $385 | $0 |
| Real Estate Taxes | $767 | $0 |
Property Value by Mortgage Status in San Diego
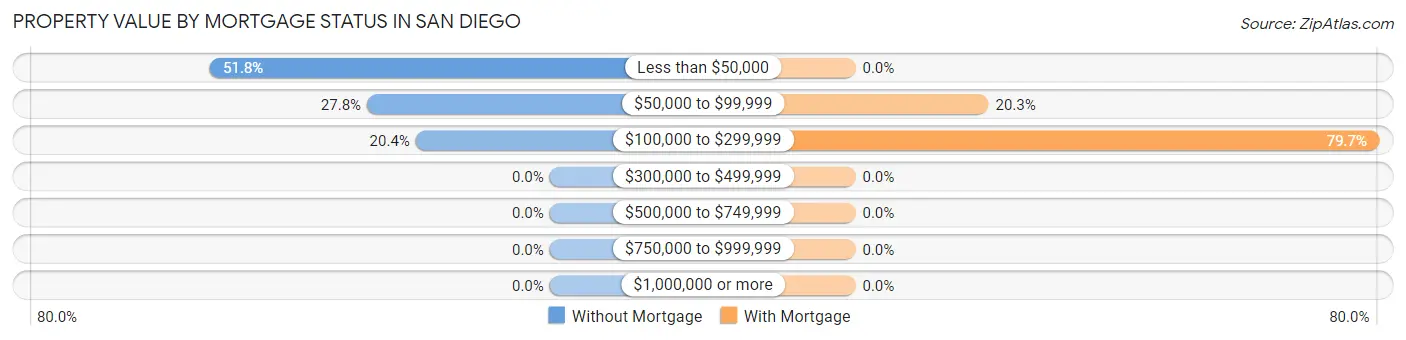
| Property Value | Without Mortgage | With Mortgage |
| Less than $50,000 | 355 (51.7%) | 0 (0.0%) |
| $50,000 to $99,999 | 191 (27.8%) | 61 (20.3%) |
| $100,000 to $299,999 | 140 (20.4%) | 240 (79.7%) |
| $300,000 to $499,999 | 0 (0.0%) | 0 (0.0%) |
| $500,000 to $749,999 | 0 (0.0%) | 0 (0.0%) |
| $750,000 to $999,999 | 0 (0.0%) | 0 (0.0%) |
| $1,000,000 or more | 0 (0.0%) | 0 (0.0%) |
| Total | 686 (100.0%) | 301 (100.0%) |
Household Income by Mortgage Status in San Diego
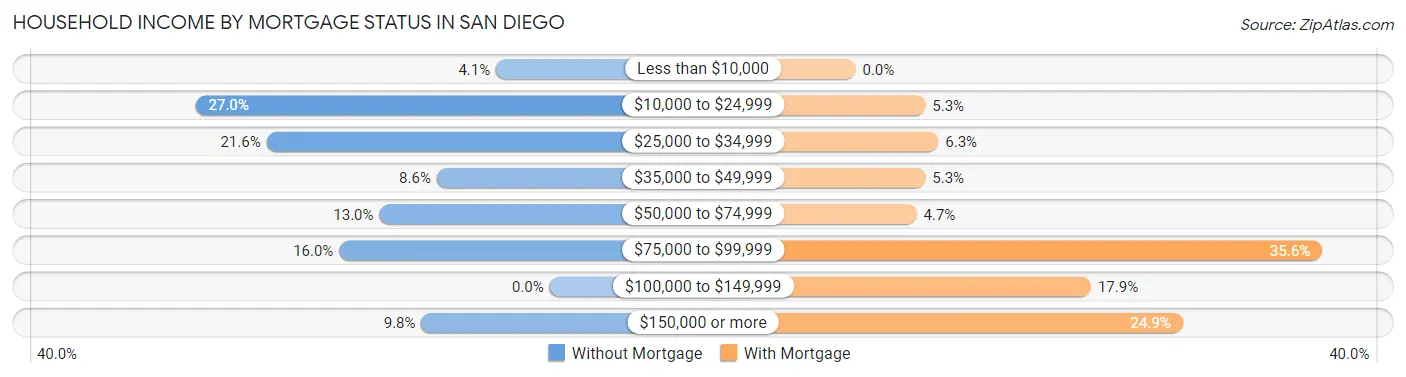
| Household Income | Without Mortgage | With Mortgage |
| Less than $10,000 | 28 (4.1%) | 0 (0.0%) |
| $10,000 to $24,999 | 185 (27.0%) | 16 (5.3%) |
| $25,000 to $34,999 | 148 (21.6%) | 19 (6.3%) |
| $35,000 to $49,999 | 59 (8.6%) | 16 (5.3%) |
| $50,000 to $74,999 | 89 (13.0%) | 14 (4.6%) |
| $75,000 to $99,999 | 110 (16.0%) | 107 (35.5%) |
| $100,000 to $149,999 | 0 (0.0%) | 54 (17.9%) |
| $150,000 or more | 67 (9.8%) | 75 (24.9%) |
| Total | 686 (100.0%) | 301 (100.0%) |
Property Value to Household Income Ratio in San Diego
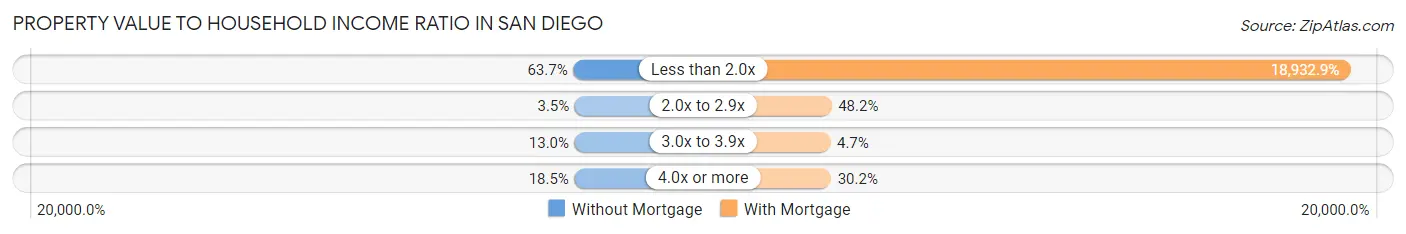
| Value-to-Income Ratio | Without Mortgage | With Mortgage |
| Less than 2.0x | 437 (63.7%) | 56,988 (18,932.9%) |
| 2.0x to 2.9x | 24 (3.5%) | 145 (48.2%) |
| 3.0x to 3.9x | 89 (13.0%) | 14 (4.6%) |
| 4.0x or more | 127 (18.5%) | 91 (30.2%) |
| Total | 686 (100.0%) | 301 (100.0%) |
Real Estate Taxes by Mortgage Status in San Diego
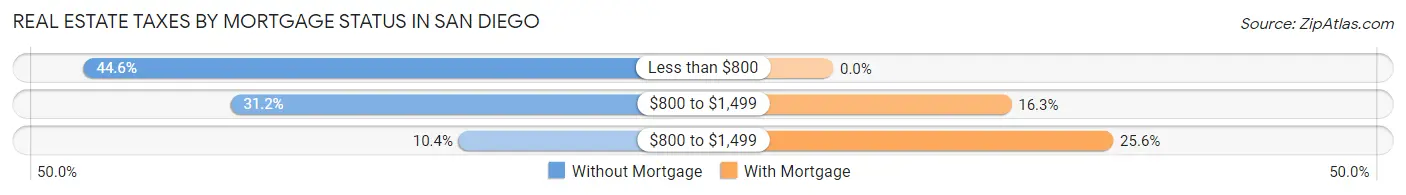
| Property Taxes | Without Mortgage | With Mortgage |
| Less than $800 | 306 (44.6%) | 0 (0.0%) |
| $800 to $1,499 | 214 (31.2%) | 49 (16.3%) |
| $800 to $1,499 | 71 (10.3%) | 77 (25.6%) |
| Total | 686 (100.0%) | 301 (100.0%) |
Health & Disability in San Diego
Health Insurance Coverage by Age in San Diego
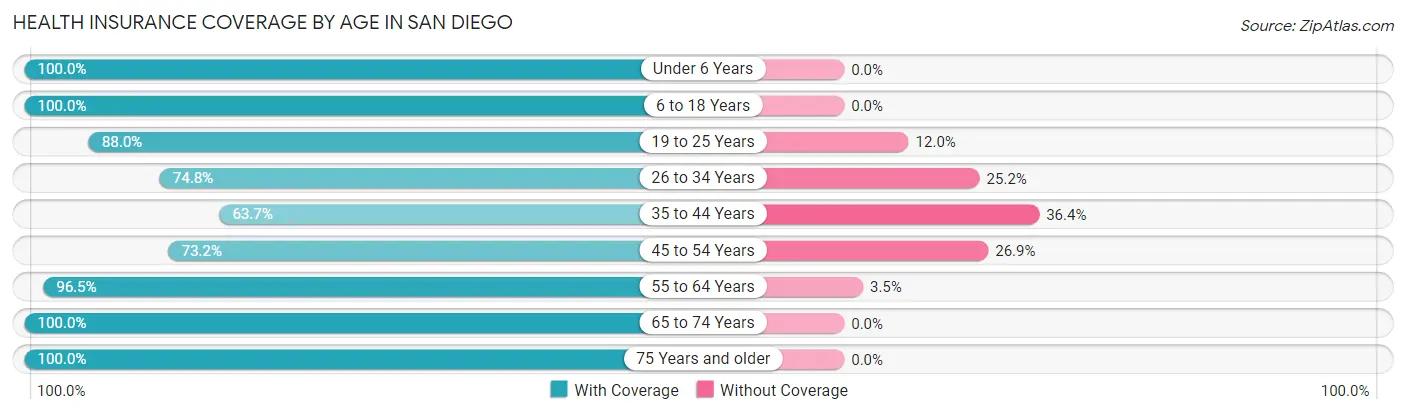
| Age Bracket | With Coverage | Without Coverage |
| Under 6 Years | 307 (100.0%) | 0 (0.0%) |
| 6 to 18 Years | 1,031 (100.0%) | 0 (0.0%) |
| 19 to 25 Years | 220 (88.0%) | 30 (12.0%) |
| 26 to 34 Years | 154 (74.8%) | 52 (25.2%) |
| 35 to 44 Years | 450 (63.6%) | 257 (36.3%) |
| 45 to 54 Years | 267 (73.2%) | 98 (26.9%) |
| 55 to 64 Years | 415 (96.5%) | 15 (3.5%) |
| 65 to 74 Years | 317 (100.0%) | 0 (0.0%) |
| 75 Years and older | 135 (100.0%) | 0 (0.0%) |
| Total | 3,296 (87.9%) | 452 (12.1%) |
Health Insurance Coverage by Citizenship Status in San Diego
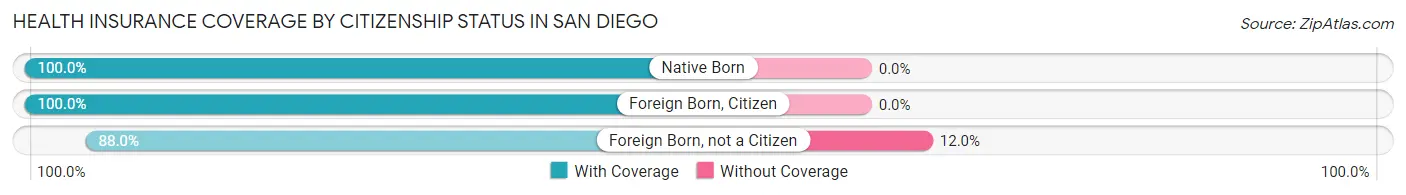
| Citizenship Status | With Coverage | Without Coverage |
| Native Born | 307 (100.0%) | 0 (0.0%) |
| Foreign Born, Citizen | 1,031 (100.0%) | 0 (0.0%) |
| Foreign Born, not a Citizen | 220 (88.0%) | 30 (12.0%) |
Health Insurance Coverage by Household Income in San Diego
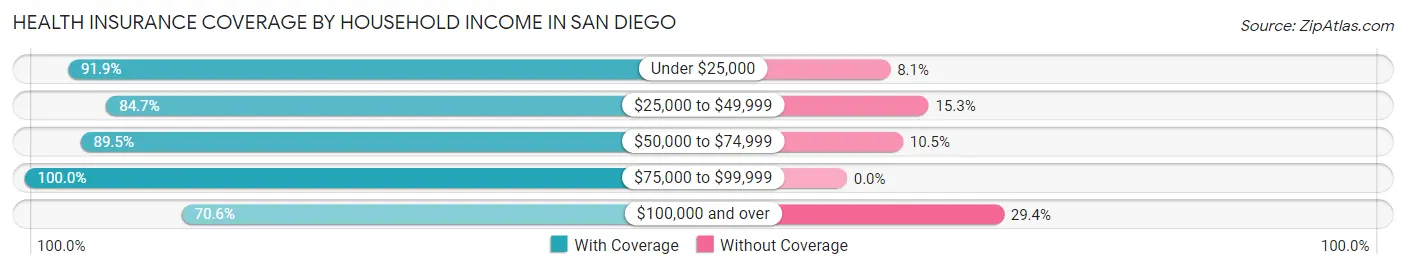
| Household Income | With Coverage | Without Coverage |
| Under $25,000 | 508 (91.9%) | 45 (8.1%) |
| $25,000 to $49,999 | 951 (84.7%) | 172 (15.3%) |
| $50,000 to $74,999 | 870 (89.5%) | 102 (10.5%) |
| $75,000 to $99,999 | 648 (100.0%) | 0 (0.0%) |
| $100,000 and over | 319 (70.6%) | 133 (29.4%) |
Public vs Private Health Insurance Coverage by Age in San Diego
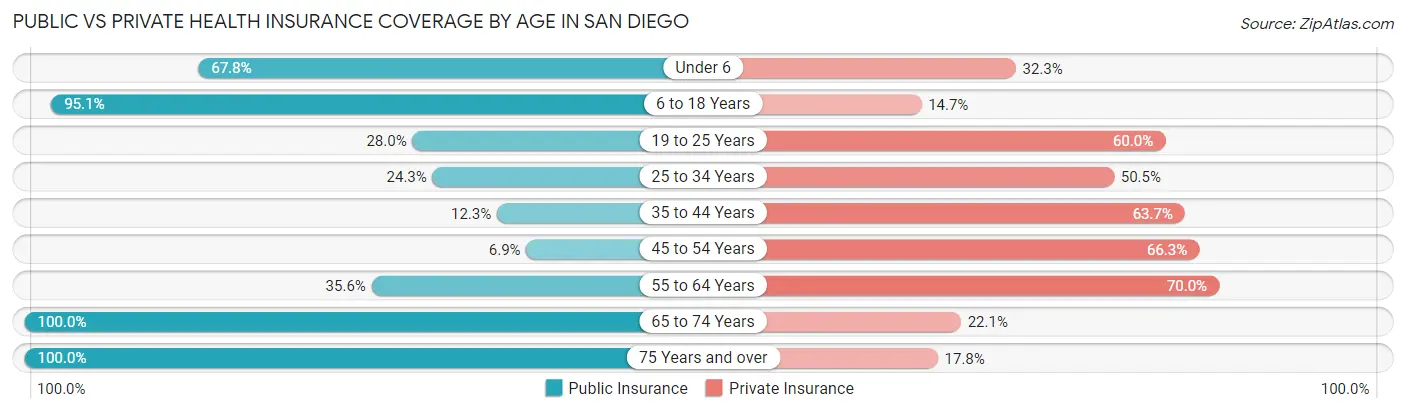
| Age Bracket | Public Insurance | Private Insurance |
| Under 6 | 208 (67.7%) | 99 (32.3%) |
| 6 to 18 Years | 980 (95.1%) | 152 (14.7%) |
| 19 to 25 Years | 70 (28.0%) | 150 (60.0%) |
| 25 to 34 Years | 50 (24.3%) | 104 (50.5%) |
| 35 to 44 Years | 87 (12.3%) | 450 (63.6%) |
| 45 to 54 Years | 25 (6.9%) | 242 (66.3%) |
| 55 to 64 Years | 153 (35.6%) | 301 (70.0%) |
| 65 to 74 Years | 317 (100.0%) | 70 (22.1%) |
| 75 Years and over | 135 (100.0%) | 24 (17.8%) |
| Total | 2,025 (54.0%) | 1,592 (42.5%) |
Disability Status by Sex by Age in San Diego
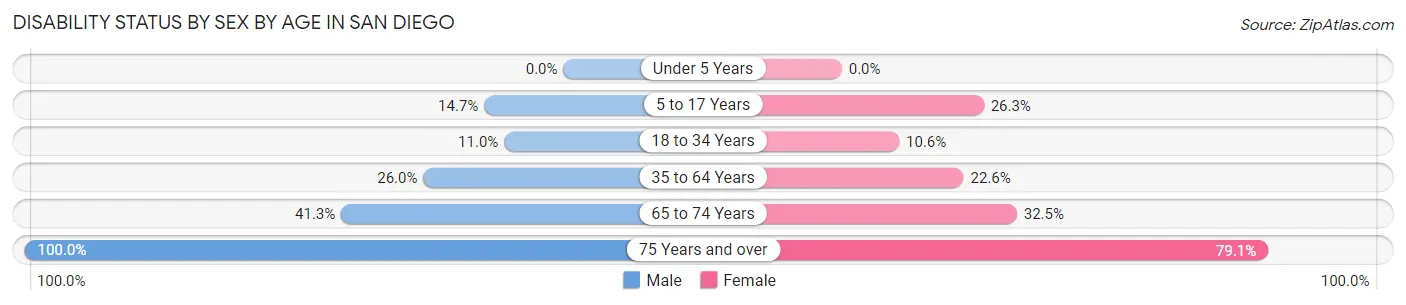
| Age Bracket | Male | Female |
| Under 5 Years | 0 (0.0%) | 0 (0.0%) |
| 5 to 17 Years | 56 (14.7%) | 138 (26.3%) |
| 18 to 34 Years | 21 (11.0%) | 43 (10.6%) |
| 35 to 64 Years | 195 (26.0%) | 170 (22.6%) |
| 65 to 74 Years | 66 (41.2%) | 51 (32.5%) |
| 75 Years and over | 44 (100.0%) | 72 (79.1%) |
Disability Class by Sex by Age in San Diego
Disability Class: Hearing Difficulty
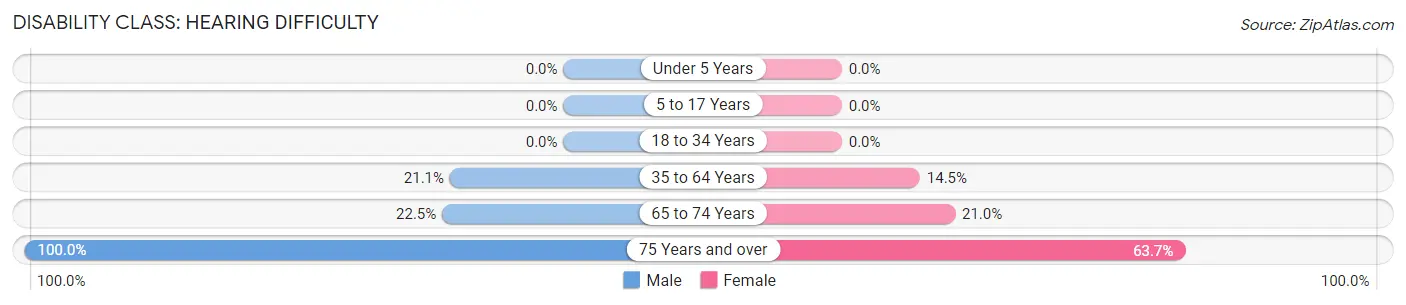
| Age Bracket | Male | Female |
| Under 5 Years | 0 (0.0%) | 0 (0.0%) |
| 5 to 17 Years | 0 (0.0%) | 0 (0.0%) |
| 18 to 34 Years | 0 (0.0%) | 0 (0.0%) |
| 35 to 64 Years | 158 (21.1%) | 109 (14.5%) |
| 65 to 74 Years | 36 (22.5%) | 33 (21.0%) |
| 75 Years and over | 44 (100.0%) | 58 (63.7%) |
Disability Class: Vision Difficulty
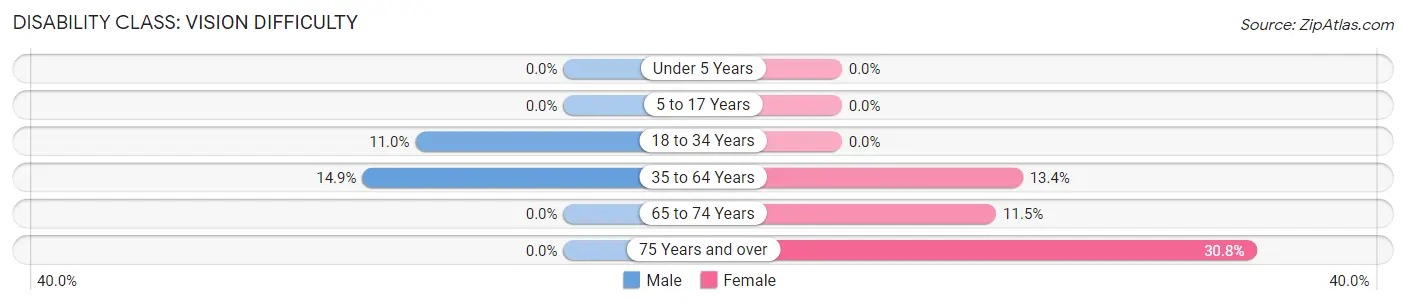
| Age Bracket | Male | Female |
| Under 5 Years | 0 (0.0%) | 0 (0.0%) |
| 5 to 17 Years | 0 (0.0%) | 0 (0.0%) |
| 18 to 34 Years | 21 (11.0%) | 0 (0.0%) |
| 35 to 64 Years | 112 (14.9%) | 101 (13.4%) |
| 65 to 74 Years | 0 (0.0%) | 18 (11.5%) |
| 75 Years and over | 0 (0.0%) | 28 (30.8%) |
Disability Class: Cognitive Difficulty
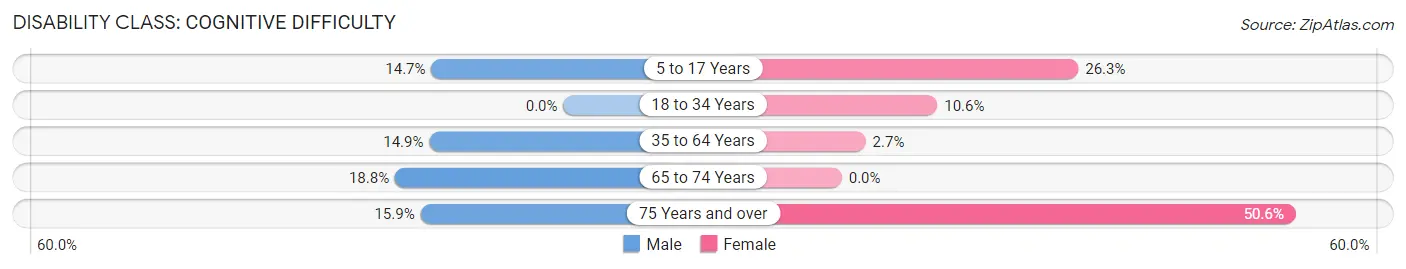
| Age Bracket | Male | Female |
| 5 to 17 Years | 56 (14.7%) | 138 (26.3%) |
| 18 to 34 Years | 0 (0.0%) | 43 (10.6%) |
| 35 to 64 Years | 112 (14.9%) | 20 (2.7%) |
| 65 to 74 Years | 30 (18.8%) | 0 (0.0%) |
| 75 Years and over | 7 (15.9%) | 46 (50.5%) |
Disability Class: Ambulatory Difficulty
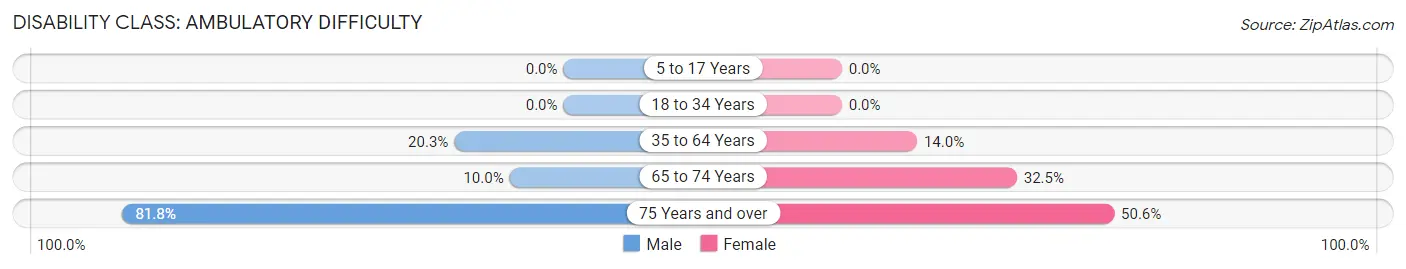
| Age Bracket | Male | Female |
| 5 to 17 Years | 0 (0.0%) | 0 (0.0%) |
| 18 to 34 Years | 0 (0.0%) | 0 (0.0%) |
| 35 to 64 Years | 152 (20.3%) | 105 (14.0%) |
| 65 to 74 Years | 16 (10.0%) | 51 (32.5%) |
| 75 Years and over | 36 (81.8%) | 46 (50.5%) |
Disability Class: Self-Care Difficulty
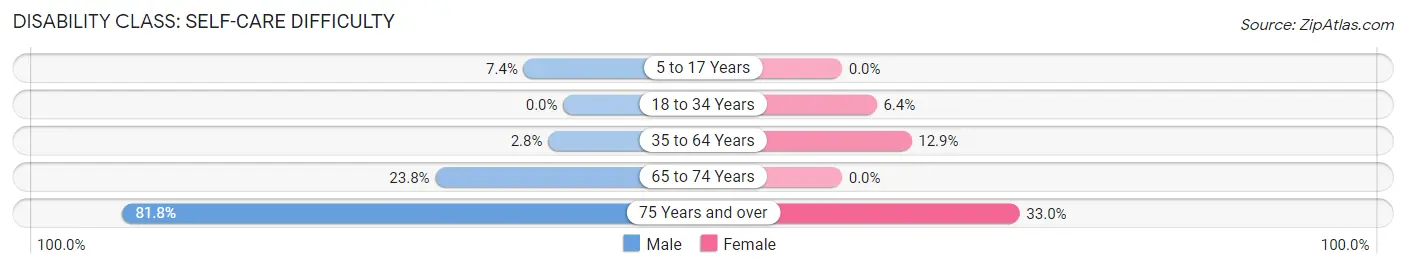
| Age Bracket | Male | Female |
| 5 to 17 Years | 28 (7.3%) | 0 (0.0%) |
| 18 to 34 Years | 0 (0.0%) | 26 (6.4%) |
| 35 to 64 Years | 21 (2.8%) | 97 (12.9%) |
| 65 to 74 Years | 38 (23.7%) | 0 (0.0%) |
| 75 Years and over | 36 (81.8%) | 30 (33.0%) |
Technology Access in San Diego
Computing Device Access in San Diego
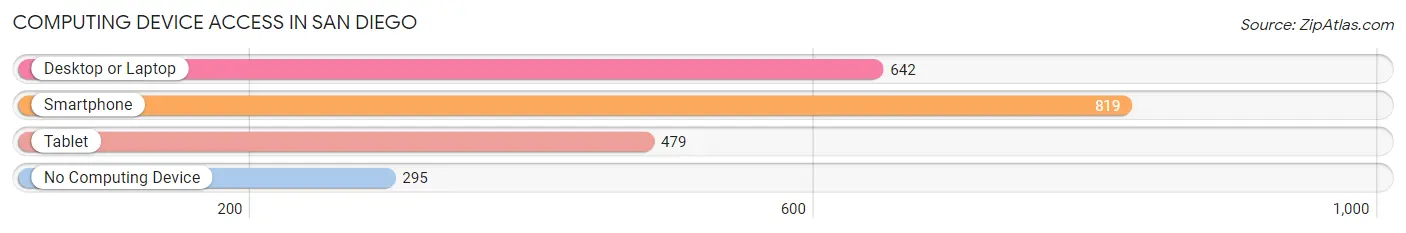
| Device Type | # Households | % Households |
| Desktop or Laptop | 642 | 51.9% |
| Smartphone | 819 | 66.2% |
| Tablet | 479 | 38.7% |
| No Computing Device | 295 | 23.8% |
| Total | 1,238 | 100.0% |
Internet Access in San Diego
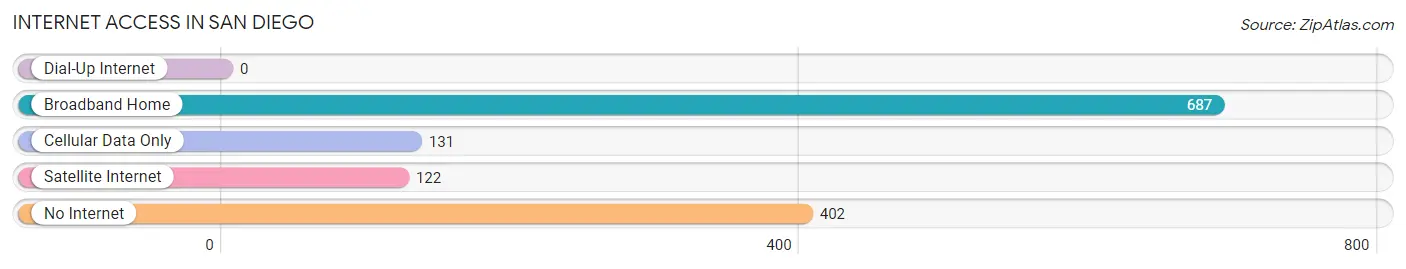
| Internet Type | # Households | % Households |
| Dial-Up Internet | 0 | 0.0% |
| Broadband Home | 687 | 55.5% |
| Cellular Data Only | 131 | 10.6% |
| Satellite Internet | 122 | 9.9% |
| No Internet | 402 | 32.5% |
| Total | 1,238 | 100.0% |
San Diego Summary
San Diego, Texas is a small city located in Duval County, Texas. It is situated on the banks of the San Diego River, approximately 30 miles south of Corpus Christi. The city has a population of approximately 2,500 people and is the county seat of Duval County.
History
San Diego was founded in 1848 by a group of settlers from the Mexican state of Coahuila. The settlers named the town after San Diego de Alcala, a Spanish missionary who had been martyred in Mexico in 1540. The town was originally intended to be a trading post for the local Native American tribes, but it quickly grew into a small farming community.
In 1876, the San Diego and Rio Grande Railroad was built, connecting San Diego to Corpus Christi. This allowed the town to become a major shipping center for the region. The railroad also brought in new settlers, and the population of San Diego began to grow.
In the early 1900s, San Diego was a thriving agricultural center. The town was home to several cotton gins, a sugar mill, and a number of other businesses. The town also had a number of churches, schools, and other civic organizations.
Geography
San Diego is located in the Coastal Plains region of Texas. The city is situated on the banks of the San Diego River, approximately 30 miles south of Corpus Christi. The city is surrounded by a number of small towns and rural communities, including Freer, Benavides, and San Isidro.
The climate in San Diego is generally hot and humid, with temperatures ranging from the mid-80s in the summer to the mid-50s in the winter. The area receives an average of 33 inches of rain per year.
Economy
San Diego’s economy is largely based on agriculture and oil production. The town is home to several cotton gins, a sugar mill, and a number of other businesses. The town also has a number of churches, schools, and other civic organizations.
The town is also home to a number of oil and gas production companies, including Chevron, ExxonMobil, and Shell. These companies employ a number of people in the area, and the town is also home to a number of oil and gas related businesses.
Demographics
As of the 2010 census, San Diego had a population of 2,500 people. The racial makeup of the town was 79.2% White, 0.4% African American, 0.2% Native American, 0.2% Asian, 0.2% Pacific Islander, 17.6% from other races, and 2.4% from two or more races. Hispanic or Latino of any race were 33.2% of the population.
The median income for a household in San Diego was $25,000, and the median income for a family was $30,000. The per capita income for the town was $13,000. About 20.2% of families and 24.2% of the population were below the poverty line, including 33.3% of those under age 18 and 16.7% of those age 65 or over.
San Diego is a small town with a rich history and a diverse population. The town is home to a number of businesses, churches, schools, and other civic organizations. The town is also home to a number of oil and gas production companies, which provide employment opportunities for many of the town’s residents.
Common Questions
What is Per Capita Income in San Diego?
Per Capita income in San Diego is $21,364.
What is the Median Family Income in San Diego?
Median Family Income in San Diego is $56,577.
What is the Median Household income in San Diego?
Median Household Income in San Diego is $46,620.
What is Income or Wage Gap in San Diego?
Income or Wage Gap in San Diego is 28.8%.
Women in San Diego earn 71.2 cents for every dollar earned by a man.
What is Inequality or Gini Index in San Diego?
Inequality or Gini Index in San Diego is 0.39.
What is the Total Population of San Diego?
Total Population of San Diego is 3,801.
What is the Total Male Population of San Diego?
Total Male Population of San Diego is 1,742.
What is the Total Female Population of San Diego?
Total Female Population of San Diego is 2,059.
What is the Ratio of Males per 100 Females in San Diego?
There are 84.60 Males per 100 Females in San Diego.
What is the Ratio of Females per 100 Males in San Diego?
There are 118.20 Females per 100 Males in San Diego.
What is the Median Population Age in San Diego?
Median Population Age in San Diego is 35.8 Years.
What is the Average Family Size in San Diego
Average Family Size in San Diego is 3.8 People.
What is the Average Household Size in San Diego
Average Household Size in San Diego is 3.0 People.
How Large is the Labor Force in San Diego?
There are 1,640 People in the Labor Forcein in San Diego.
What is the Percentage of People in the Labor Force in San Diego?
61.0% of People are in the Labor Force in San Diego.
What is the Unemployment Rate in San Diego?
Unemployment Rate in San Diego is 6.4%.