Nocona Hills, TX Map & Demographics
Nocona Hills Map
Nocona Hills Overview
$36,284
PER CAPITA INCOME
$97,841
AVG FAMILY INCOME
$76,667
AVG HOUSEHOLD INCOME
0.39
INEQUALITY / GINI INDEX
620
TOTAL POPULATION
318
MALE POPULATION
302
FEMALE POPULATION
105.30
MALES / 100 FEMALES
94.97
FEMALES / 100 MALES
60.1
MEDIAN AGE
2.4
AVG FAMILY SIZE
2.1
AVG HOUSEHOLD SIZE
282
LABOR FORCE [ PEOPLE ]
47.8%
PERCENT IN LABOR FORCE
14.5%
UNEMPLOYMENT RATE
Income in Nocona Hills
Income Overview in Nocona Hills
Per Capita Income in Nocona Hills is $36,284, while median incomes of families and households are $97,841 and $76,667 respectively.
| Characteristic | Number | Measure |
| Per Capita Income | 620 | $36,284 |
| Median Family Income | 199 | $97,841 |
| Mean Family Income | 199 | $95,342 |
| Median Household Income | 294 | $76,667 |
| Mean Household Income | 294 | $75,819 |
| Income Deficit | 199 | $0 |
| Wage / Income Gap (%) | 620 | 0.00% |
| Wage / Income Gap ($) | 620 | 100.00¢ per $1 |
| Gini / Inequality Index | 620 | 0.39 |
Earnings by Sex in Nocona Hills
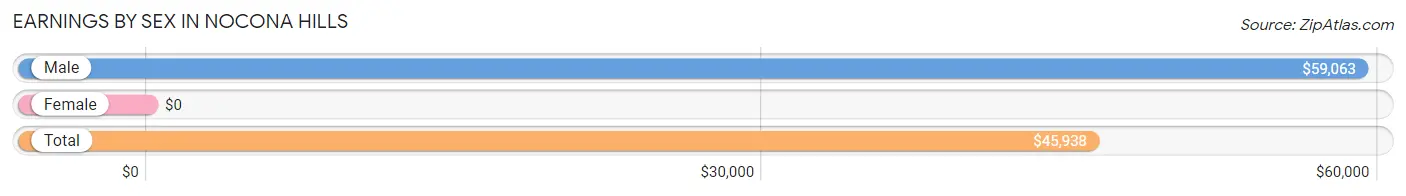
| Sex | Number | Average Earnings |
| Male | 174 (63.3%) | $59,063 |
| Female | 101 (36.7%) | $0 |
| Total | 275 (100.0%) | $45,938 |
Earnings by Sex by Income Bracket in Nocona Hills
The most common earnings brackets in Nocona Hills are $75,000 to $99,999 for men (71 | 40.8%) and $10,000 to $12,499 for women (24 | 23.8%).
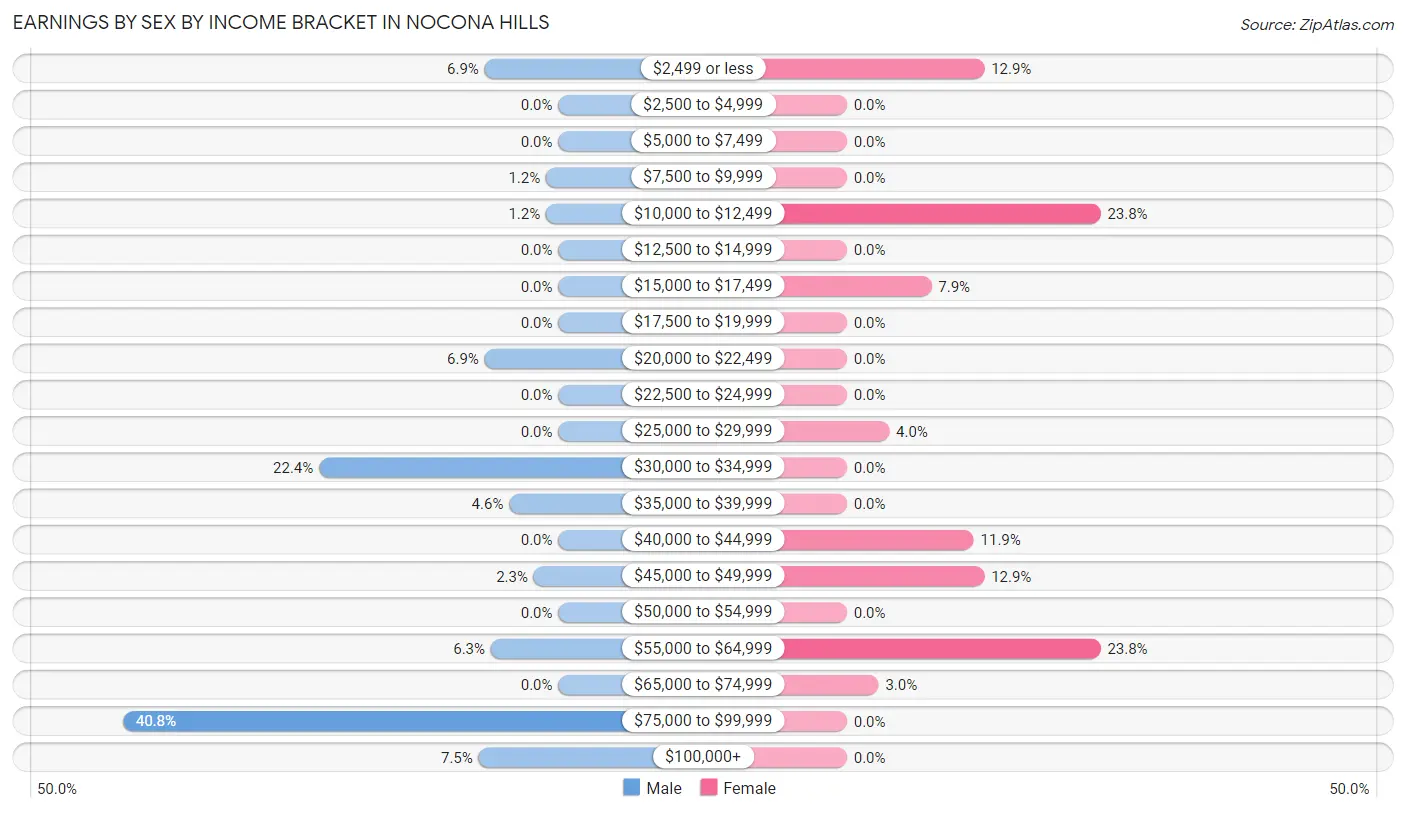
| Income | Male | Female |
| $2,499 or less | 12 (6.9%) | 13 (12.9%) |
| $2,500 to $4,999 | 0 (0.0%) | 0 (0.0%) |
| $5,000 to $7,499 | 0 (0.0%) | 0 (0.0%) |
| $7,500 to $9,999 | 2 (1.1%) | 0 (0.0%) |
| $10,000 to $12,499 | 2 (1.1%) | 24 (23.8%) |
| $12,500 to $14,999 | 0 (0.0%) | 0 (0.0%) |
| $15,000 to $17,499 | 0 (0.0%) | 8 (7.9%) |
| $17,500 to $19,999 | 0 (0.0%) | 0 (0.0%) |
| $20,000 to $22,499 | 12 (6.9%) | 0 (0.0%) |
| $22,500 to $24,999 | 0 (0.0%) | 0 (0.0%) |
| $25,000 to $29,999 | 0 (0.0%) | 4 (4.0%) |
| $30,000 to $34,999 | 39 (22.4%) | 0 (0.0%) |
| $35,000 to $39,999 | 8 (4.6%) | 0 (0.0%) |
| $40,000 to $44,999 | 0 (0.0%) | 12 (11.9%) |
| $45,000 to $49,999 | 4 (2.3%) | 13 (12.9%) |
| $50,000 to $54,999 | 0 (0.0%) | 0 (0.0%) |
| $55,000 to $64,999 | 11 (6.3%) | 24 (23.8%) |
| $65,000 to $74,999 | 0 (0.0%) | 3 (3.0%) |
| $75,000 to $99,999 | 71 (40.8%) | 0 (0.0%) |
| $100,000+ | 13 (7.5%) | 0 (0.0%) |
| Total | 174 (100.0%) | 101 (100.0%) |
Earnings by Sex by Educational Attainment in Nocona Hills
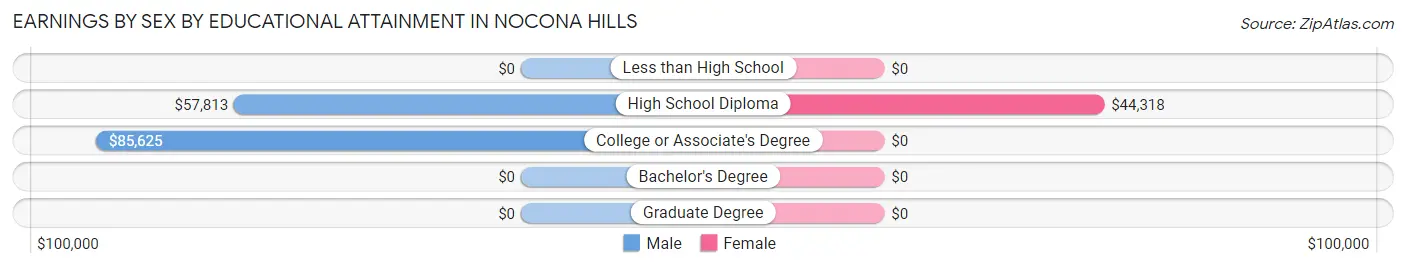
| Educational Attainment | Male Income | Female Income |
| Less than High School | - | - |
| High School Diploma | $57,813 | $44,318 |
| College or Associate's Degree | $85,625 | $0 |
| Bachelor's Degree | - | - |
| Graduate Degree | - | - |
| Total | $82,644 | $0 |
Family Income in Nocona Hills
Family Income Brackets in Nocona Hills
According to the Nocona Hills family income data, there are 77 families falling into the $100,000 to $149,999 income range, which is the most common income bracket and makes up 38.7% of all families.
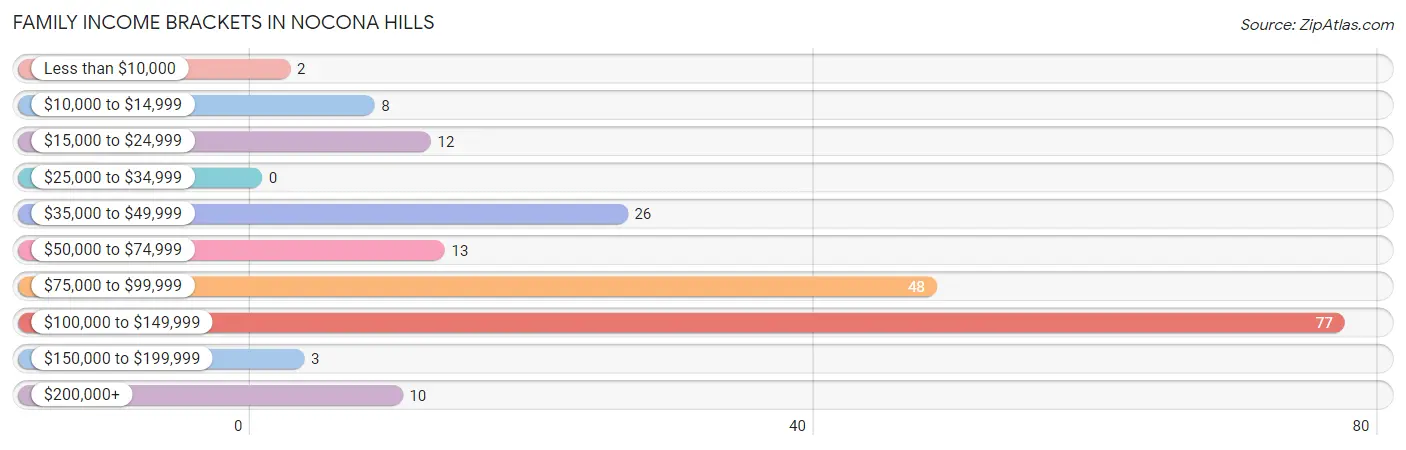
| Income Bracket | # Families | % Families |
| Less than $10,000 | 2 | 1.0% |
| $10,000 to $14,999 | 8 | 4.0% |
| $15,000 to $24,999 | 12 | 6.0% |
| $25,000 to $34,999 | 0 | 0.0% |
| $35,000 to $49,999 | 26 | 13.1% |
| $50,000 to $74,999 | 13 | 6.5% |
| $75,000 to $99,999 | 48 | 24.1% |
| $100,000 to $149,999 | 77 | 38.7% |
| $150,000 to $199,999 | 3 | 1.5% |
| $200,000+ | 10 | 5.0% |
Family Income by Famaliy Size in Nocona Hills
2-person families (161 | 80.9%) account for the highest median family income in Nocona Hills with $95,795 per family, while 2-person families (161 | 80.9%) have the highest median income of $47,898 per family member.
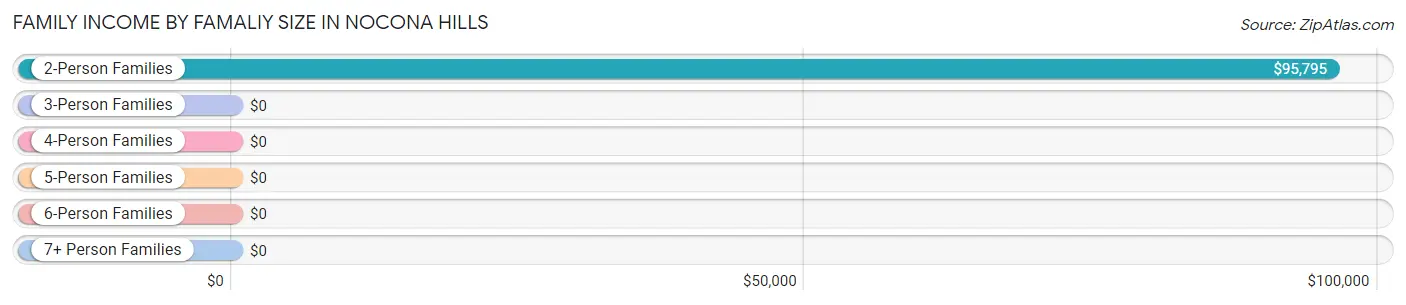
| Income Bracket | # Families | Median Income |
| 2-Person Families | 161 (80.9%) | $95,795 |
| 3-Person Families | 29 (14.6%) | $0 |
| 4-Person Families | 2 (1.0%) | $0 |
| 5-Person Families | 7 (3.5%) | $0 |
| 6-Person Families | 0 (0.0%) | $0 |
| 7+ Person Families | 0 (0.0%) | $0 |
| Total | 199 (100.0%) | $97,841 |
Family Income by Number of Earners in Nocona Hills
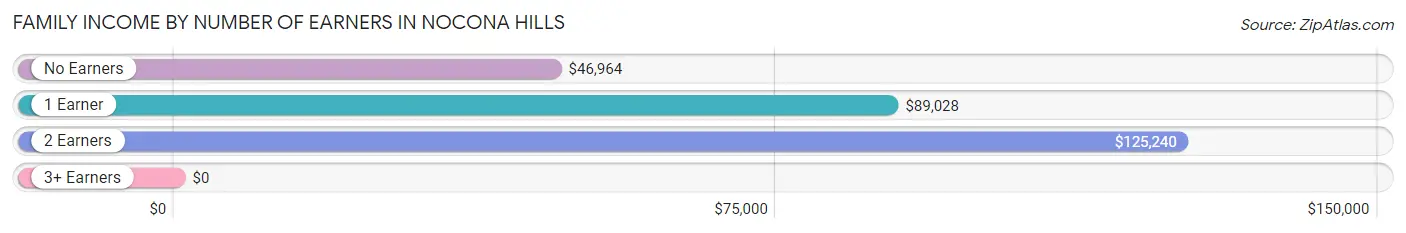
| Number of Earners | # Families | Median Income |
| No Earners | 51 (25.6%) | $46,964 |
| 1 Earner | 57 (28.6%) | $89,028 |
| 2 Earners | 87 (43.7%) | $125,240 |
| 3+ Earners | 4 (2.0%) | $0 |
| Total | 199 (100.0%) | $97,841 |
Household Income in Nocona Hills
Household Income Brackets in Nocona Hills
With 77 households falling in the category, the $100,000 to $149,999 income range is the most frequent in Nocona Hills, accounting for 26.2% of all households. In contrast, only 3 households (1.0%) fall into the $150,000 to $199,999 income bracket, making it the least populous group.
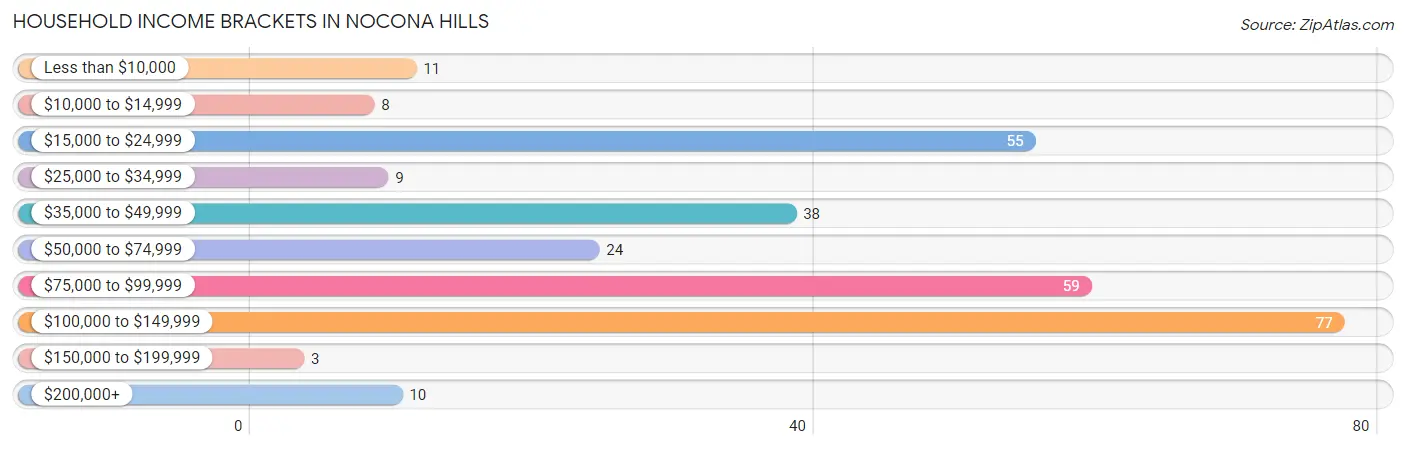
| Income Bracket | # Households | % Households |
| Less than $10,000 | 11 | 3.7% |
| $10,000 to $14,999 | 8 | 2.7% |
| $15,000 to $24,999 | 55 | 18.7% |
| $25,000 to $34,999 | 9 | 3.1% |
| $35,000 to $49,999 | 38 | 12.9% |
| $50,000 to $74,999 | 24 | 8.2% |
| $75,000 to $99,999 | 59 | 20.1% |
| $100,000 to $149,999 | 77 | 26.2% |
| $150,000 to $199,999 | 3 | 1.0% |
| $200,000+ | 10 | 3.4% |
Household Income by Householder Age in Nocona Hills
The median household income in Nocona Hills is $76,667, with the highest median household income of $105,968 found in the 25 to 44 years age bracket for the primary householder. A total of 38 households (12.9%) fall into this category.
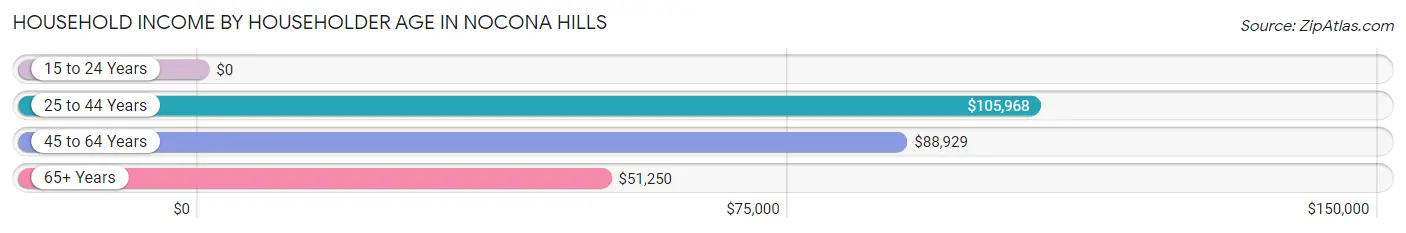
| Income Bracket | # Households | Median Income |
| 15 to 24 Years | 0 (0.0%) | $0 |
| 25 to 44 Years | 38 (12.9%) | $105,968 |
| 45 to 64 Years | 124 (42.2%) | $88,929 |
| 65+ Years | 132 (44.9%) | $51,250 |
| Total | 294 (100.0%) | $76,667 |
Poverty in Nocona Hills
Income Below Poverty by Sex and Age in Nocona Hills
With 6.9% poverty level for males and 13.6% for females among the residents of Nocona Hills, 12 to 14 year old males and 55 to 64 year old females are the most vulnerable to poverty, with 3 males (21.4%) and 34 females (29.6%) in their respective age groups living below the poverty level.
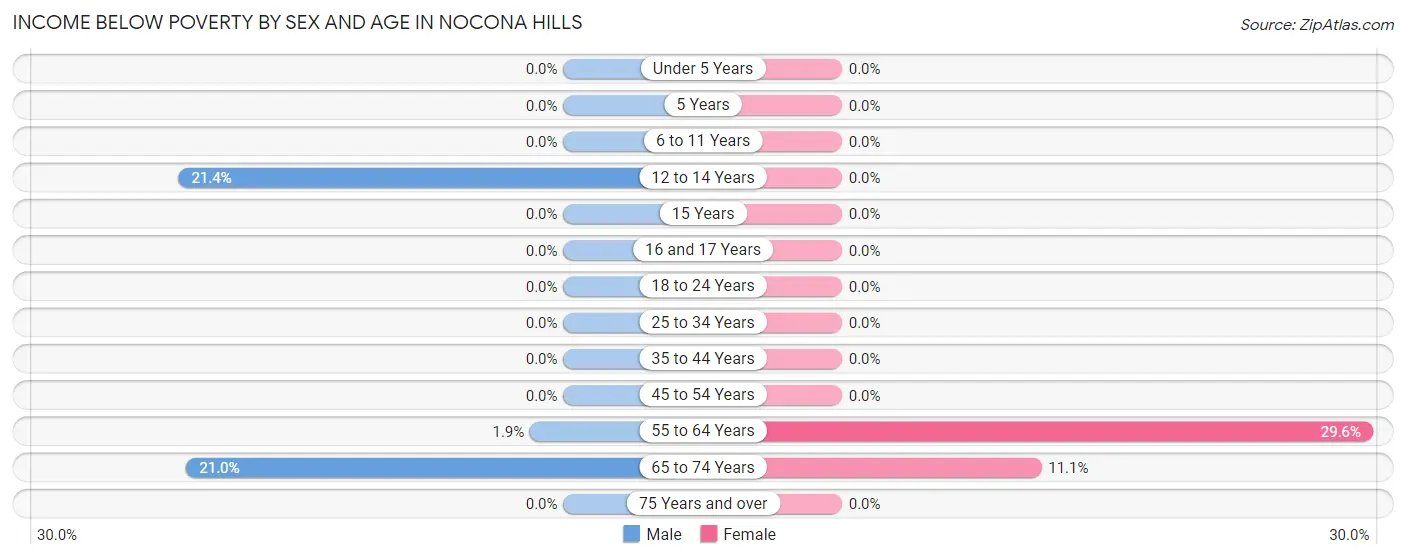
| Age Bracket | Male | Female |
| Under 5 Years | 0 (0.0%) | 0 (0.0%) |
| 5 Years | 0 (0.0%) | 0 (0.0%) |
| 6 to 11 Years | 0 (0.0%) | 0 (0.0%) |
| 12 to 14 Years | 3 (21.4%) | 0 (0.0%) |
| 15 Years | 0 (0.0%) | 0 (0.0%) |
| 16 and 17 Years | 0 (0.0%) | 0 (0.0%) |
| 18 to 24 Years | 0 (0.0%) | 0 (0.0%) |
| 25 to 34 Years | 0 (0.0%) | 0 (0.0%) |
| 35 to 44 Years | 0 (0.0%) | 0 (0.0%) |
| 45 to 54 Years | 0 (0.0%) | 0 (0.0%) |
| 55 to 64 Years | 2 (1.8%) | 34 (29.6%) |
| 65 to 74 Years | 17 (21.0%) | 7 (11.1%) |
| 75 Years and over | 0 (0.0%) | 0 (0.0%) |
| Total | 22 (6.9%) | 41 (13.6%) |
Income Above Poverty by Sex and Age in Nocona Hills
According to the poverty statistics in Nocona Hills, males aged 6 to 11 years and females aged 12 to 14 years are the age groups that are most secure financially, with 100.0% of males and 100.0% of females in these age groups living above the poverty line.
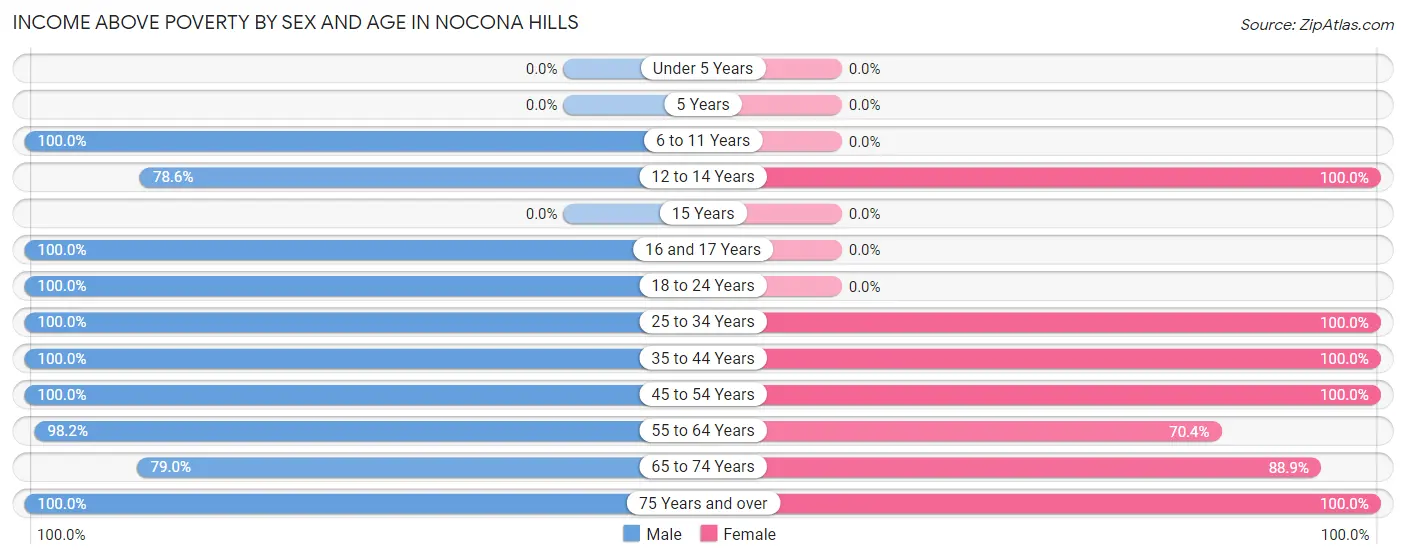
| Age Bracket | Male | Female |
| Under 5 Years | 0 (0.0%) | 0 (0.0%) |
| 5 Years | 0 (0.0%) | 0 (0.0%) |
| 6 to 11 Years | 8 (100.0%) | 0 (0.0%) |
| 12 to 14 Years | 11 (78.6%) | 8 (100.0%) |
| 15 Years | 0 (0.0%) | 0 (0.0%) |
| 16 and 17 Years | 7 (100.0%) | 0 (0.0%) |
| 18 to 24 Years | 2 (100.0%) | 0 (0.0%) |
| 25 to 34 Years | 31 (100.0%) | 27 (100.0%) |
| 35 to 44 Years | 8 (100.0%) | 10 (100.0%) |
| 45 to 54 Years | 41 (100.0%) | 43 (100.0%) |
| 55 to 64 Years | 106 (98.2%) | 81 (70.4%) |
| 65 to 74 Years | 64 (79.0%) | 56 (88.9%) |
| 75 Years and over | 18 (100.0%) | 36 (100.0%) |
| Total | 296 (93.1%) | 261 (86.4%) |
Income Below Poverty Among Married-Couple Families in Nocona Hills
The poverty statistics for married-couple families in Nocona Hills show that 5.0% or 8 of the total 161 families live below the poverty line. Families with no children have the highest poverty rate of 5.3%, comprising of 8 families. On the other hand, families with 1 or 2 children have the lowest poverty rate of 0.0%, which includes 0 families.
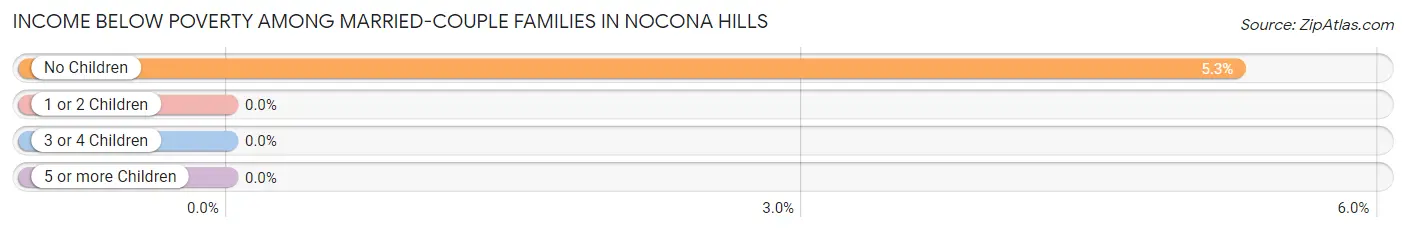
| Children | Above Poverty | Below Poverty |
| No Children | 144 (94.7%) | 8 (5.3%) |
| 1 or 2 Children | 9 (100.0%) | 0 (0.0%) |
| 3 or 4 Children | 0 (0.0%) | 0 (0.0%) |
| 5 or more Children | 0 (0.0%) | 0 (0.0%) |
| Total | 153 (95.0%) | 8 (5.0%) |
Income Below Poverty Among Single-Parent Households in Nocona Hills
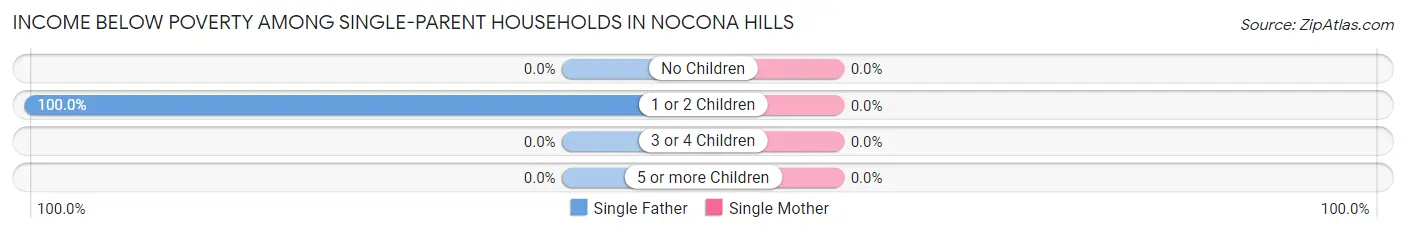
| Children | Single Father | Single Mother |
| No Children | 0 (0.0%) | 0 (0.0%) |
| 1 or 2 Children | 2 (100.0%) | 0 (0.0%) |
| 3 or 4 Children | 0 (0.0%) | 0 (0.0%) |
| 5 or more Children | 0 (0.0%) | 0 (0.0%) |
| Total | 2 (7.1%) | 0 (0.0%) |
Income Below Poverty Among Married-Couple vs Single-Parent Households in Nocona Hills
The poverty data for Nocona Hills shows that 8 of the married-couple family households (5.0%) and 2 of the single-parent households (5.3%) are living below the poverty level. Within the married-couple family households, those with no children have the highest poverty rate, with 8 households (5.3%) falling below the poverty line. Among the single-parent households, those with 1 or 2 children have the highest poverty rate, with 2 household (40.0%) living below poverty.
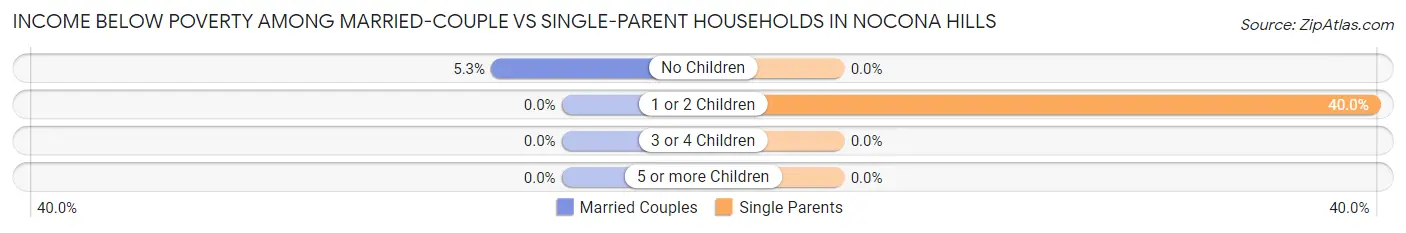
| Children | Married-Couple Families | Single-Parent Households |
| No Children | 8 (5.3%) | 0 (0.0%) |
| 1 or 2 Children | 0 (0.0%) | 2 (40.0%) |
| 3 or 4 Children | 0 (0.0%) | 0 (0.0%) |
| 5 or more Children | 0 (0.0%) | 0 (0.0%) |
| Total | 8 (5.0%) | 2 (5.3%) |
Race in Nocona Hills
The most populous races in Nocona Hills are White / Caucasian (603 | 97.3%), Hispanic or Latino (57 | 9.2%), and Two or more Races (17 | 2.7%).
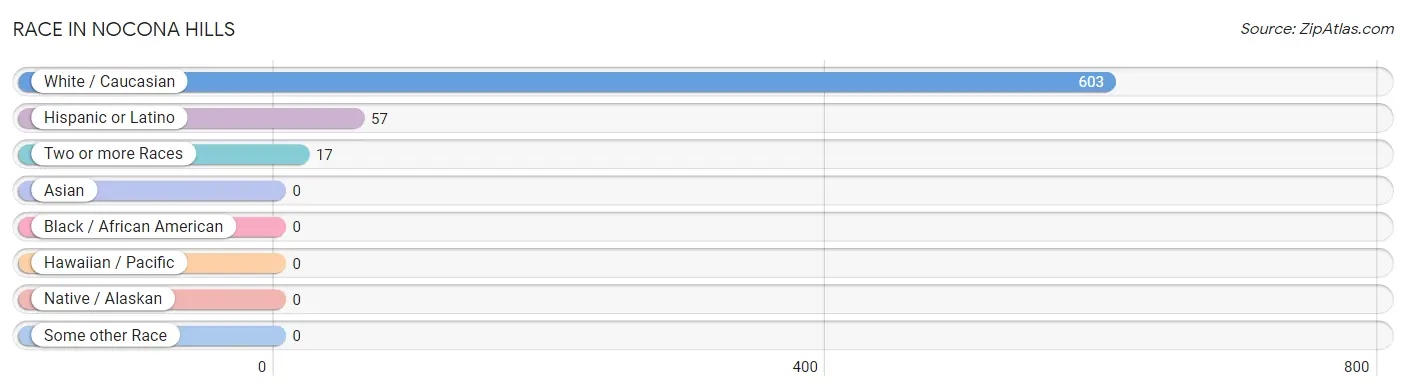
| Race | # Population | % Population |
| Asian | 0 | 0.0% |
| Black / African American | 0 | 0.0% |
| Hawaiian / Pacific | 0 | 0.0% |
| Hispanic or Latino | 57 | 9.2% |
| Native / Alaskan | 0 | 0.0% |
| White / Caucasian | 603 | 97.3% |
| Two or more Races | 17 | 2.7% |
| Some other Race | 0 | 0.0% |
| Total | 620 | 100.0% |
Ancestry in Nocona Hills
The most populous ancestries reported in Nocona Hills are English (119 | 19.2%), German (64 | 10.3%), Irish (61 | 9.8%), Mexican (48 | 7.7%), and American (45 | 7.3%), together accounting for 54.3% of all Nocona Hills residents.
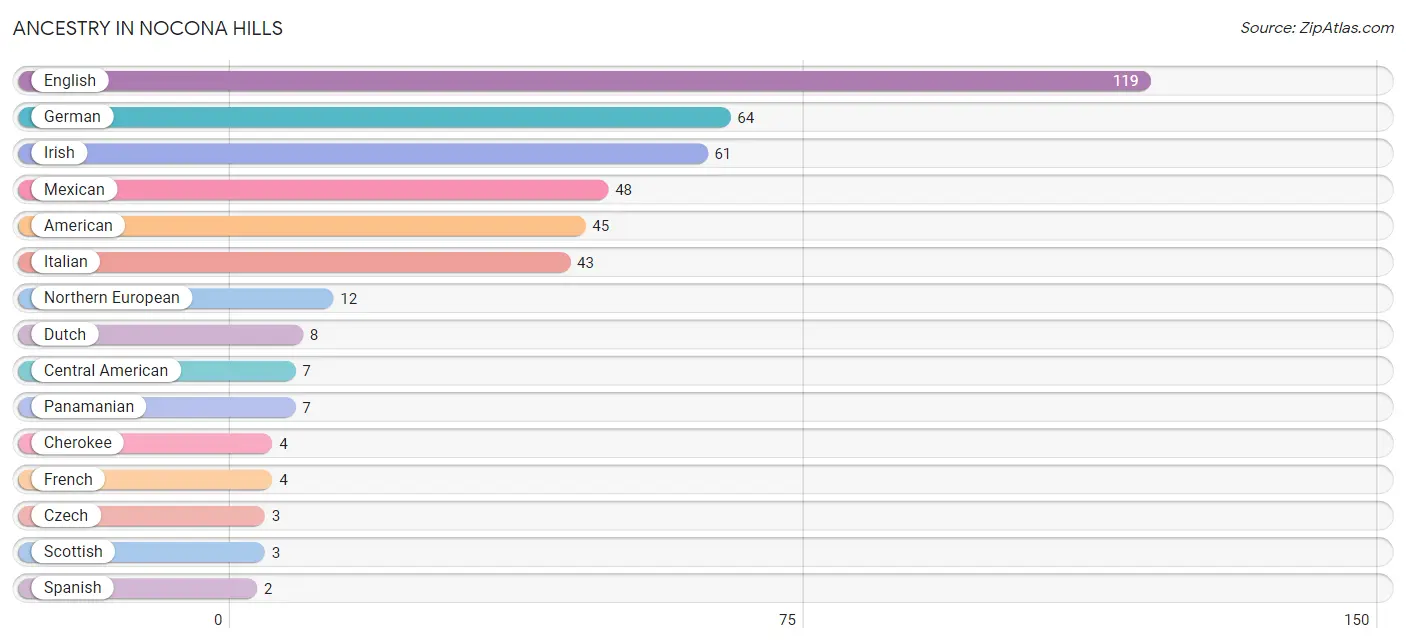
| Ancestry | # Population | % Population |
| American | 45 | 7.3% |
| Central American | 7 | 1.1% |
| Cherokee | 4 | 0.6% |
| Czech | 3 | 0.5% |
| Dutch | 8 | 1.3% |
| English | 119 | 19.2% |
| French | 4 | 0.6% |
| German | 64 | 10.3% |
| Irish | 61 | 9.8% |
| Italian | 43 | 6.9% |
| Mexican | 48 | 7.7% |
| Northern European | 12 | 1.9% |
| Panamanian | 7 | 1.1% |
| Scottish | 3 | 0.5% |
| Spanish | 2 | 0.3% | View All 15 Rows |
Immigrants in Nocona Hills
The most numerous immigrant groups reported in Nocona Hills came from Central America (12 | 1.9%), Latin America (12 | 1.9%), Panama (7 | 1.1%), Mexico (5 | 0.8%), and England (2 | 0.3%), together accounting for 6.1% of all Nocona Hills residents.
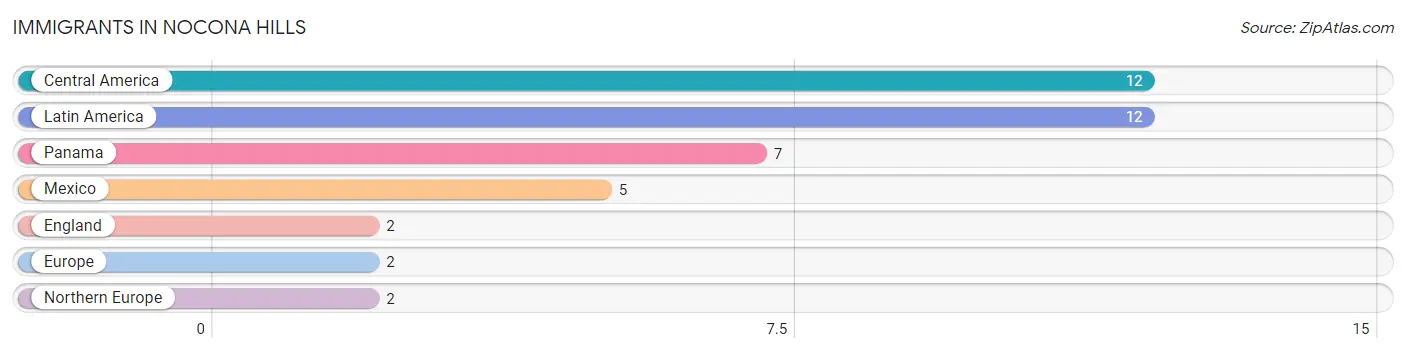
| Immigration Origin | # Population | % Population |
| Central America | 12 | 1.9% |
| England | 2 | 0.3% |
| Europe | 2 | 0.3% |
| Latin America | 12 | 1.9% |
| Mexico | 5 | 0.8% |
| Northern Europe | 2 | 0.3% |
| Panama | 7 | 1.1% | View All 7 Rows |
Sex and Age in Nocona Hills
Sex and Age in Nocona Hills
The most populous age groups in Nocona Hills are 70 to 74 Years (67 | 21.1%) for men and 55 to 59 Years (63 | 20.9%) for women.
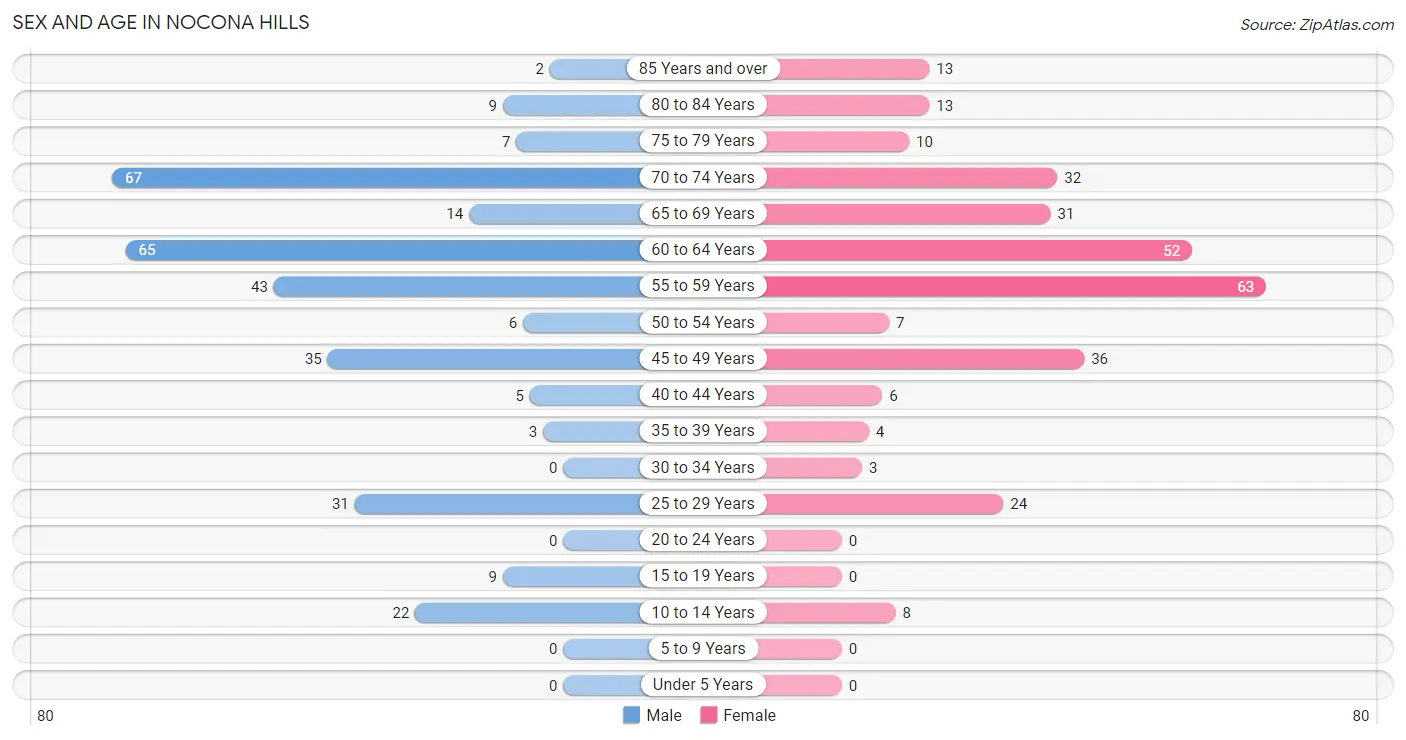
| Age Bracket | Male | Female |
| Under 5 Years | 0 (0.0%) | 0 (0.0%) |
| 5 to 9 Years | 0 (0.0%) | 0 (0.0%) |
| 10 to 14 Years | 22 (6.9%) | 8 (2.6%) |
| 15 to 19 Years | 9 (2.8%) | 0 (0.0%) |
| 20 to 24 Years | 0 (0.0%) | 0 (0.0%) |
| 25 to 29 Years | 31 (9.8%) | 24 (8.0%) |
| 30 to 34 Years | 0 (0.0%) | 3 (1.0%) |
| 35 to 39 Years | 3 (0.9%) | 4 (1.3%) |
| 40 to 44 Years | 5 (1.6%) | 6 (2.0%) |
| 45 to 49 Years | 35 (11.0%) | 36 (11.9%) |
| 50 to 54 Years | 6 (1.9%) | 7 (2.3%) |
| 55 to 59 Years | 43 (13.5%) | 63 (20.9%) |
| 60 to 64 Years | 65 (20.4%) | 52 (17.2%) |
| 65 to 69 Years | 14 (4.4%) | 31 (10.3%) |
| 70 to 74 Years | 67 (21.1%) | 32 (10.6%) |
| 75 to 79 Years | 7 (2.2%) | 10 (3.3%) |
| 80 to 84 Years | 9 (2.8%) | 13 (4.3%) |
| 85 Years and over | 2 (0.6%) | 13 (4.3%) |
| Total | 318 (100.0%) | 302 (100.0%) |
Families and Households in Nocona Hills
Median Family Size in Nocona Hills
The median family size in Nocona Hills is 2.43 persons per family, with single female/mother families (10 | 5.0%) accounting for the largest median family size of 4.4 persons per family. On the other hand, married-couple families (161 | 80.9%) represent the smallest median family size with 2.15 persons per family.
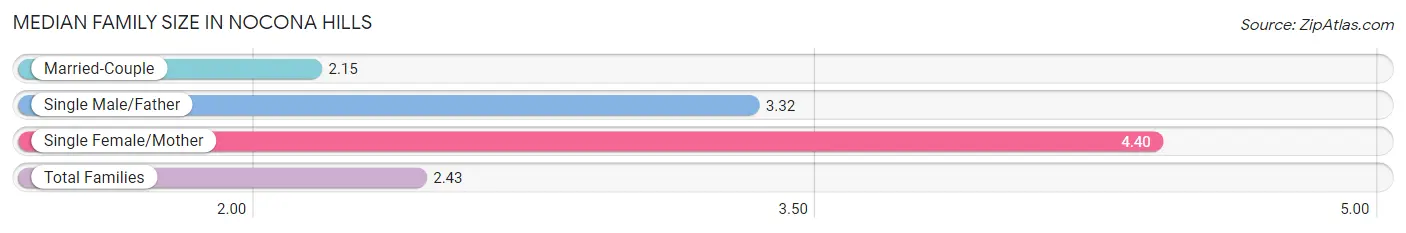
| Family Type | # Families | Family Size |
| Married-Couple | 161 (80.9%) | 2.15 |
| Single Male/Father | 28 (14.1%) | 3.32 |
| Single Female/Mother | 10 (5.0%) | 4.40 |
| Total Families | 199 (100.0%) | 2.43 |
Median Household Size in Nocona Hills
The median household size in Nocona Hills is 2.11 persons per household, with single female/mother households (10 | 3.4%) accounting for the largest median household size of 4.4 persons per household. non-family households (95 | 32.3%) represent the smallest median household size with 1.44 persons per household.
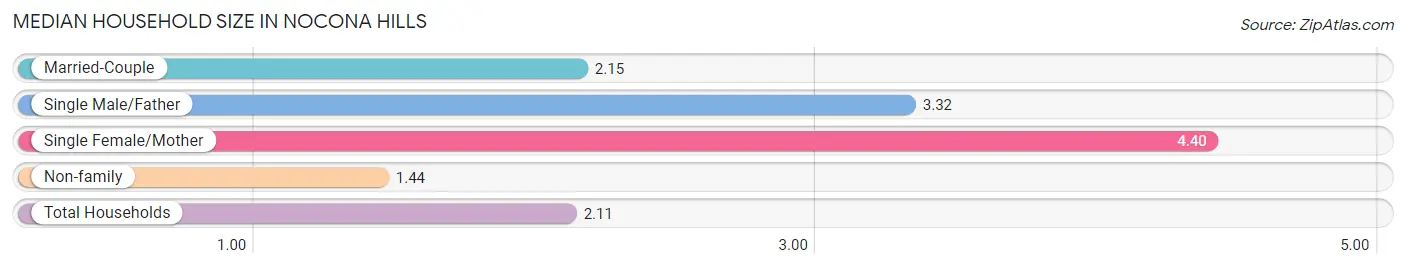
| Household Type | # Households | Household Size |
| Married-Couple | 161 (54.8%) | 2.15 |
| Single Male/Father | 28 (9.5%) | 3.32 |
| Single Female/Mother | 10 (3.4%) | 4.40 |
| Non-family | 95 (32.3%) | 1.44 |
| Total Households | 294 (100.0%) | 2.11 |
Household Size by Marriage Status in Nocona Hills
Out of a total of 294 households in Nocona Hills, 199 (67.7%) are family households, while 95 (32.3%) are nonfamily households. The most numerous type of family households are 2-person households, comprising 161, and the most common type of nonfamily households are 1-person households, comprising 54.
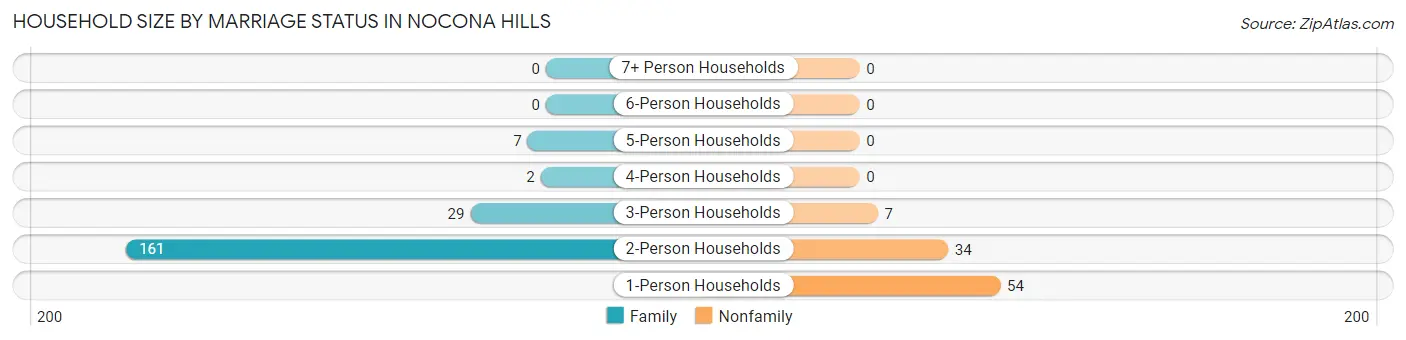
| Household Size | Family Households | Nonfamily Households |
| 1-Person Households | - | 54 (18.4%) |
| 2-Person Households | 161 (54.8%) | 34 (11.6%) |
| 3-Person Households | 29 (9.9%) | 7 (2.4%) |
| 4-Person Households | 2 (0.7%) | 0 (0.0%) |
| 5-Person Households | 7 (2.4%) | 0 (0.0%) |
| 6-Person Households | 0 (0.0%) | 0 (0.0%) |
| 7+ Person Households | 0 (0.0%) | 0 (0.0%) |
| Total | 199 (67.7%) | 95 (32.3%) |
Female Fertility in Nocona Hills
Fertility by Age in Nocona Hills
| Age Bracket | Women with Births | Births / 1,000 Women |
| 15 to 19 years | 0 (0.0%) | 0.0 |
| 20 to 34 years | 0 (0.0%) | 0.0 |
| 35 to 50 years | 0 (0.0%) | 0.0 |
| Total | 0 (0.0%) | 0.0 |
Fertility by Age by Marriage Status in Nocona Hills
| Age Bracket | Married | Unmarried |
| 15 to 19 years | 0 (0.0%) | 0 (0.0%) |
| 20 to 34 years | 0 (0.0%) | 0 (0.0%) |
| 35 to 50 years | 0 (0.0%) | 0 (0.0%) |
| Total | 0 (0.0%) | 0 (0.0%) |
Fertility by Education in Nocona Hills
| Educational Attainment | Women with Births | Births / 1,000 Women |
| Less than High School | 0 (0.0%) | 0.0 |
| High School Diploma | 0 (0.0%) | 0.0 |
| College or Associate's Degree | 0 (0.0%) | 0.0 |
| Bachelor's Degree | 0 (0.0%) | 0.0 |
| Graduate Degree | 0 (0.0%) | 0.0 |
| Total | 0 (0.0%) | 0.0 |
Fertility by Education by Marriage Status in Nocona Hills
| Educational Attainment | Married | Unmarried |
| Less than High School | 0 (0.0%) | 0 (0.0%) |
| High School Diploma | 0 (0.0%) | 0 (0.0%) |
| College or Associate's Degree | 0 (0.0%) | 0 (0.0%) |
| Bachelor's Degree | 0 (0.0%) | 0 (0.0%) |
| Graduate Degree | 0 (0.0%) | 0 (0.0%) |
| Total | 0 (0.0%) | 0 (0.0%) |
Employment Characteristics in Nocona Hills
Employment by Class of Employer in Nocona Hills
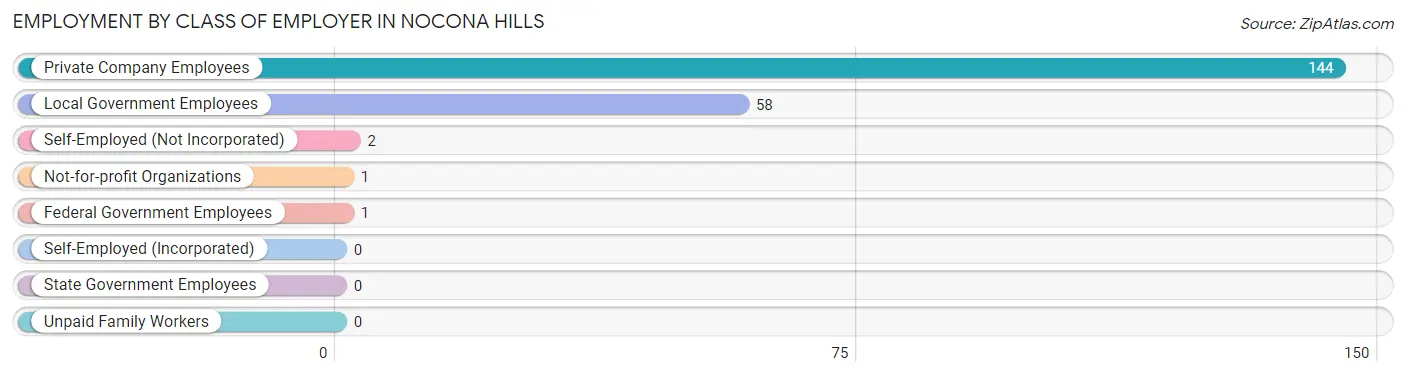
Among the 206 employed individuals in Nocona Hills, private company employees (144 | 69.9%), local government employees (58 | 28.2%), and self-employed (not incorporated) (2 | 1.0%) make up the most common classes of employment.
| Employer Class | # Employees | % Employees |
| Private Company Employees | 144 | 69.9% |
| Self-Employed (Incorporated) | 0 | 0.0% |
| Self-Employed (Not Incorporated) | 2 | 1.0% |
| Not-for-profit Organizations | 1 | 0.5% |
| Local Government Employees | 58 | 28.2% |
| State Government Employees | 0 | 0.0% |
| Federal Government Employees | 1 | 0.5% |
| Unpaid Family Workers | 0 | 0.0% |
| Total | 206 | 100.0% |
Employment Status by Age in Nocona Hills
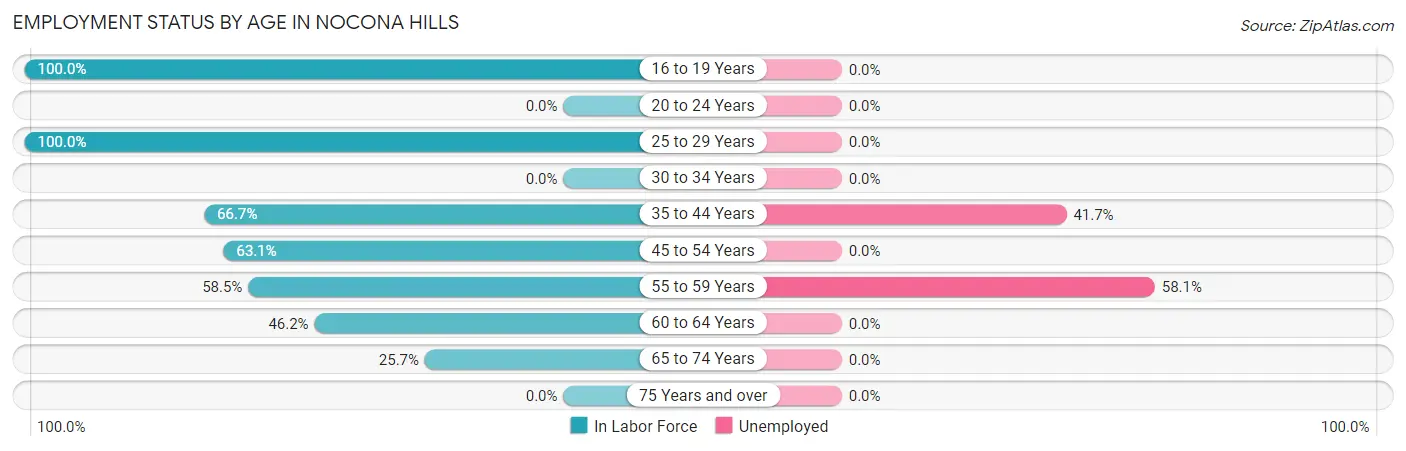
According to the labor force statistics for Nocona Hills, out of the total population over 16 years of age (590), 47.8% or 282 individuals are in the labor force, with 14.5% or 41 of them unemployed. The age group with the highest labor force participation rate is 16 to 19 years, with 100.0% or 9 individuals in the labor force. Within the labor force, the 55 to 59 years age range has the highest percentage of unemployed individuals, with 58.1% or 36 of them being unemployed.
| Age Bracket | In Labor Force | Unemployed |
| 16 to 19 Years | 9 (100.0%) | 0 (0.0%) |
| 20 to 24 Years | 0 (0.0%) | 0 (0.0%) |
| 25 to 29 Years | 55 (100.0%) | 0 (0.0%) |
| 30 to 34 Years | 0 (0.0%) | 0 (0.0%) |
| 35 to 44 Years | 12 (66.7%) | 5 (41.7%) |
| 45 to 54 Years | 53 (63.1%) | 0 (0.0%) |
| 55 to 59 Years | 62 (58.5%) | 36 (58.1%) |
| 60 to 64 Years | 54 (46.2%) | 0 (0.0%) |
| 65 to 74 Years | 37 (25.7%) | 0 (0.0%) |
| 75 Years and over | 0 (0.0%) | 0 (0.0%) |
| Total | 282 (47.8%) | 41 (14.5%) |
Employment Status by Educational Attainment in Nocona Hills
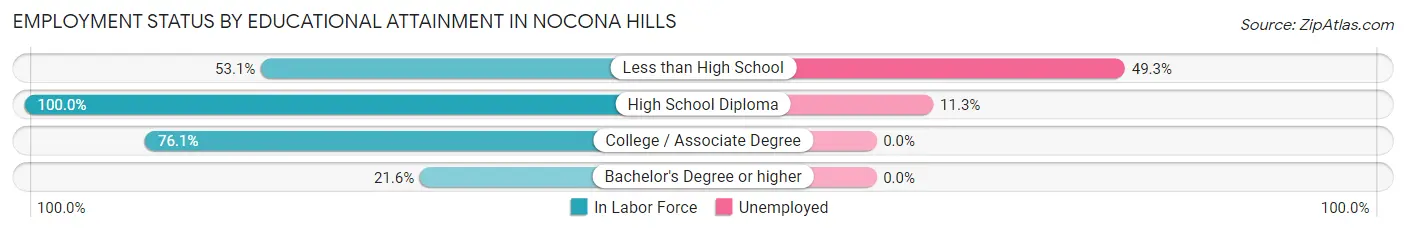
According to labor force statistics for Nocona Hills, 61.6% of individuals (236) out of the total population between 25 and 64 years of age (383) are in the labor force, with 17.4% or 41 of them being unemployed. The group with the highest labor force participation rate are those with the educational attainment of high school diploma, with 100.0% or 62 individuals in the labor force. Within the labor force, individuals with less than high school education have the highest percentage of unemployment, with 49.3% or 34 of them being unemployed.
| Educational Attainment | In Labor Force | Unemployed |
| Less than High School | 69 (53.1%) | 64 (49.3%) |
| High School Diploma | 62 (100.0%) | 7 (11.3%) |
| College / Associate Degree | 89 (76.1%) | 0 (0.0%) |
| Bachelor's Degree or higher | 16 (21.6%) | 0 (0.0%) |
| Total | 236 (61.6%) | 67 (17.4%) |
Employment Occupations by Sex in Nocona Hills
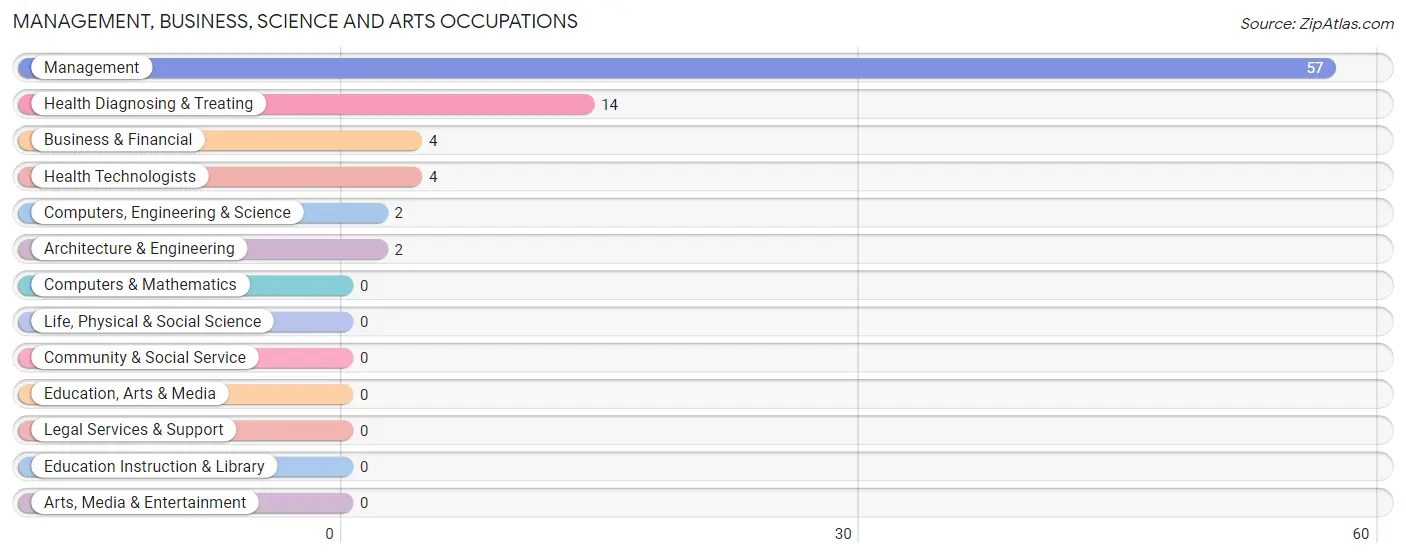
Management, Business, Science and Arts Occupations
The most common Management, Business, Science and Arts occupations in Nocona Hills are Management (57 | 23.6%), Health Diagnosing & Treating (14 | 5.8%), Business & Financial (4 | 1.7%), Health Technologists (4 | 1.7%), and Computers, Engineering & Science (2 | 0.8%).
Management, Business, Science and Arts Occupations by Sex
Within the Management, Business, Science and Arts occupations in Nocona Hills, the most male-oriented occupations are Computers, Engineering & Science (100.0%), Architecture & Engineering (100.0%), and Management (64.9%), while the most female-oriented occupations are Business & Financial (100.0%), Health Diagnosing & Treating (85.7%), and Health Technologists (50.0%).
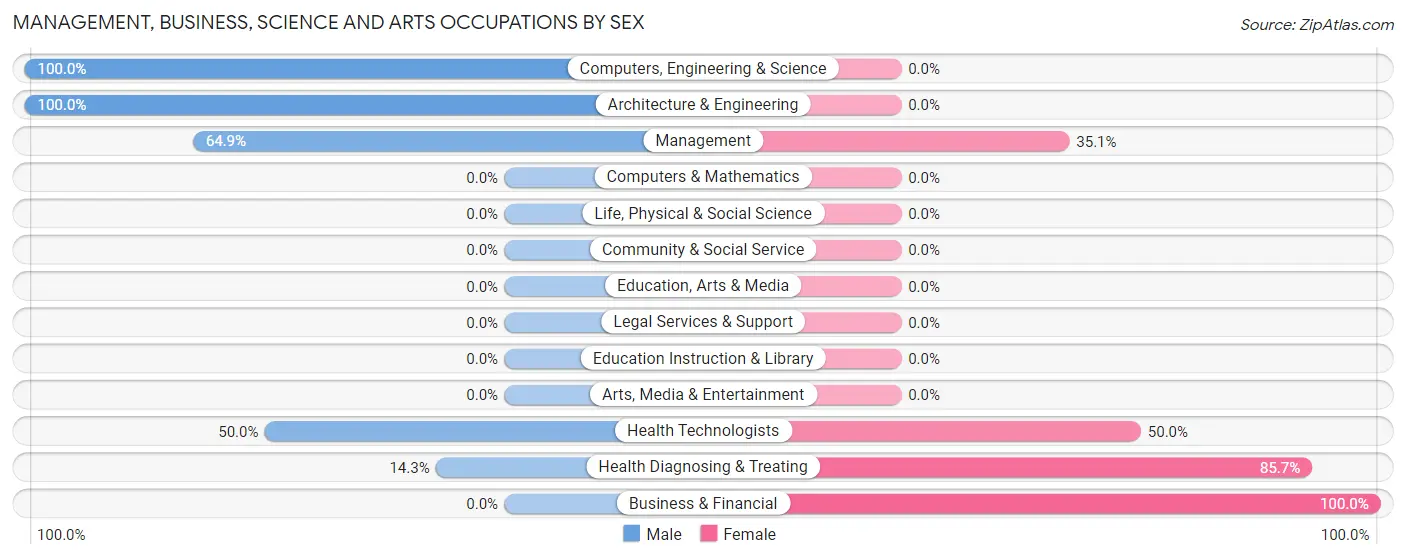
| Occupation | Male | Female |
| Management | 37 (64.9%) | 20 (35.1%) |
| Business & Financial | 0 (0.0%) | 4 (100.0%) |
| Computers, Engineering & Science | 2 (100.0%) | 0 (0.0%) |
| Computers & Mathematics | 0 (0.0%) | 0 (0.0%) |
| Architecture & Engineering | 2 (100.0%) | 0 (0.0%) |
| Life, Physical & Social Science | 0 (0.0%) | 0 (0.0%) |
| Community & Social Service | 0 (0.0%) | 0 (0.0%) |
| Education, Arts & Media | 0 (0.0%) | 0 (0.0%) |
| Legal Services & Support | 0 (0.0%) | 0 (0.0%) |
| Education Instruction & Library | 0 (0.0%) | 0 (0.0%) |
| Arts, Media & Entertainment | 0 (0.0%) | 0 (0.0%) |
| Health Diagnosing & Treating | 2 (14.3%) | 12 (85.7%) |
| Health Technologists | 2 (50.0%) | 2 (50.0%) |
| Total (Category) | 41 (53.2%) | 36 (46.8%) |
| Total (Overall) | 151 (62.7%) | 90 (37.3%) |
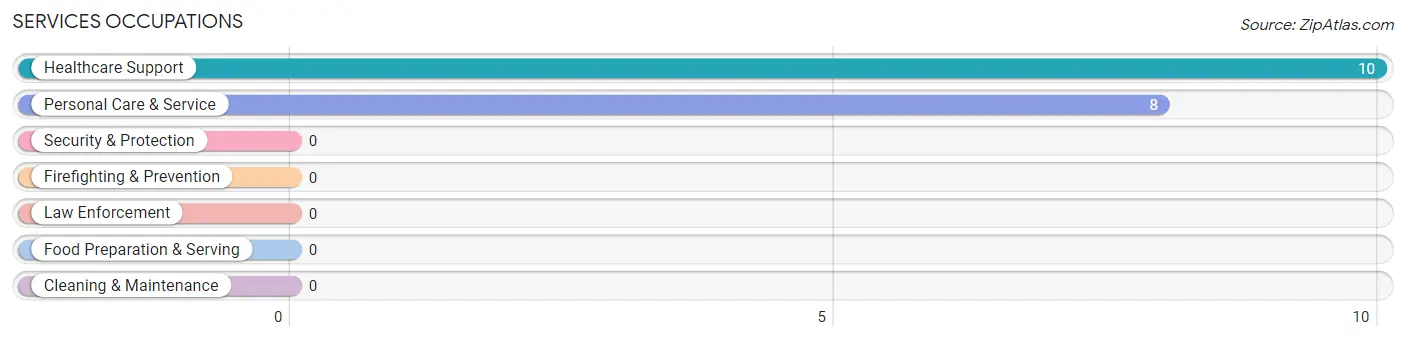
Services Occupations
The most common Services occupations in Nocona Hills are Healthcare Support (10 | 4.2%), and Personal Care & Service (8 | 3.3%).
Services Occupations by Sex
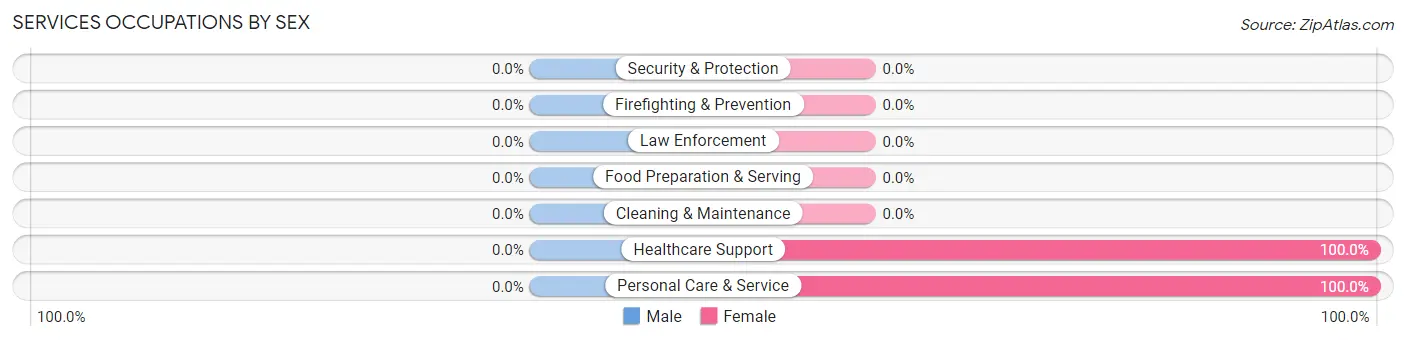
| Occupation | Male | Female |
| Healthcare Support | 0 (0.0%) | 10 (100.0%) |
| Security & Protection | 0 (0.0%) | 0 (0.0%) |
| Firefighting & Prevention | 0 (0.0%) | 0 (0.0%) |
| Law Enforcement | 0 (0.0%) | 0 (0.0%) |
| Food Preparation & Serving | 0 (0.0%) | 0 (0.0%) |
| Cleaning & Maintenance | 0 (0.0%) | 0 (0.0%) |
| Personal Care & Service | 0 (0.0%) | 8 (100.0%) |
| Total (Category) | 0 (0.0%) | 18 (100.0%) |
| Total (Overall) | 151 (62.7%) | 90 (37.3%) |
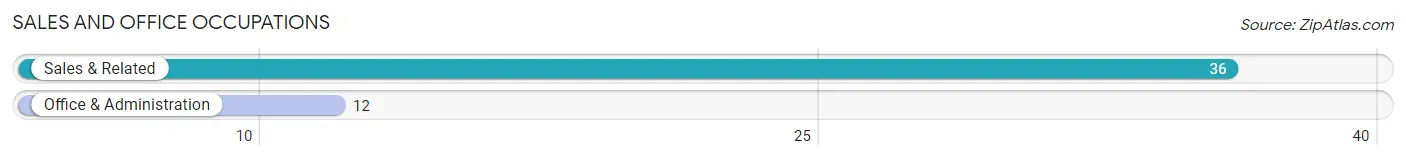
Sales and Office Occupations
The most common Sales and Office occupations in Nocona Hills are Sales & Related (36 | 14.9%), and Office & Administration (12 | 5.0%).
Sales and Office Occupations by Sex
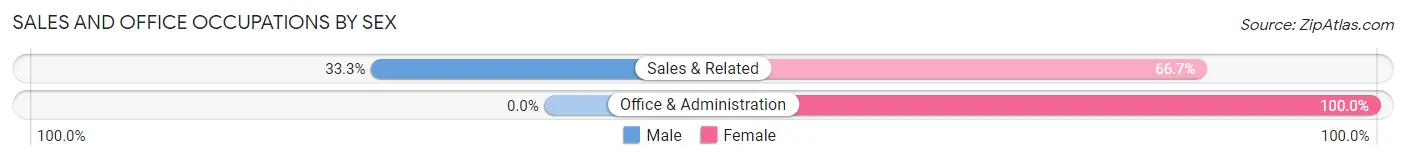
| Occupation | Male | Female |
| Sales & Related | 12 (33.3%) | 24 (66.7%) |
| Office & Administration | 0 (0.0%) | 12 (100.0%) |
| Total (Category) | 12 (25.0%) | 36 (75.0%) |
| Total (Overall) | 151 (62.7%) | 90 (37.3%) |
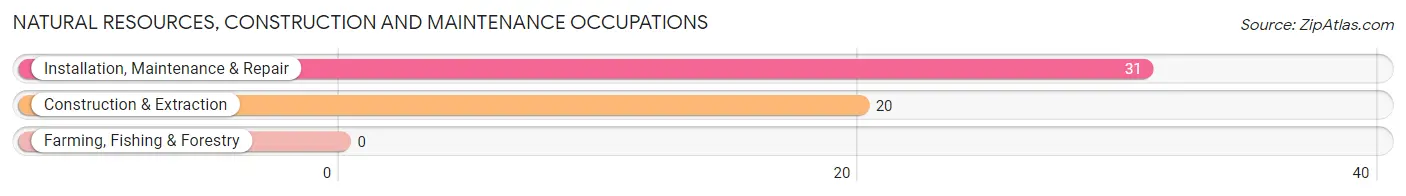
Natural Resources, Construction and Maintenance Occupations
The most common Natural Resources, Construction and Maintenance occupations in Nocona Hills are Installation, Maintenance & Repair (31 | 12.9%), and Construction & Extraction (20 | 8.3%).
Natural Resources, Construction and Maintenance Occupations by Sex
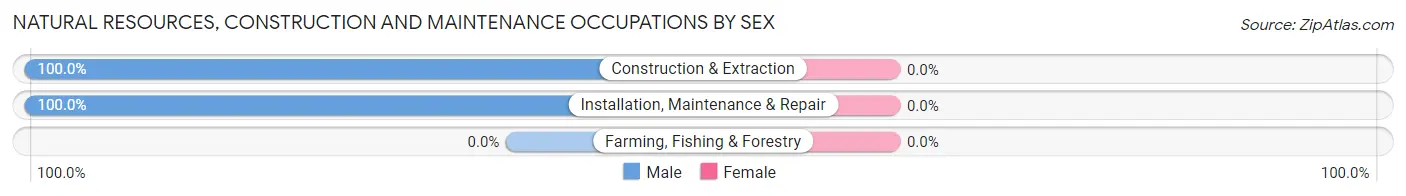
| Occupation | Male | Female |
| Farming, Fishing & Forestry | 0 (0.0%) | 0 (0.0%) |
| Construction & Extraction | 20 (100.0%) | 0 (0.0%) |
| Installation, Maintenance & Repair | 31 (100.0%) | 0 (0.0%) |
| Total (Category) | 51 (100.0%) | 0 (0.0%) |
| Total (Overall) | 151 (62.7%) | 90 (37.3%) |
Production, Transportation and Moving Occupations
The most common Production, Transportation and Moving occupations in Nocona Hills are Transportation (37 | 15.3%), Material Moving (7 | 2.9%), and Production (3 | 1.2%).
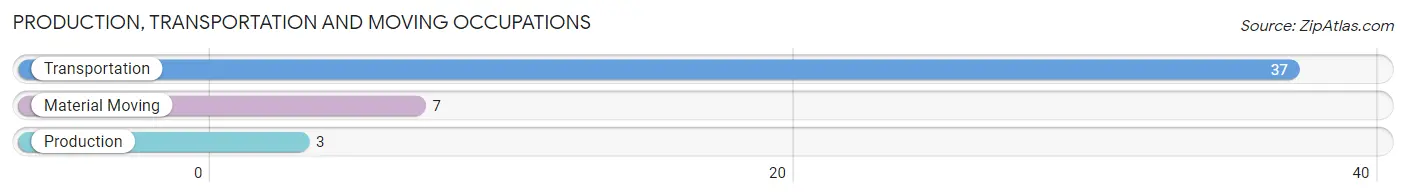
Production, Transportation and Moving Occupations by Sex
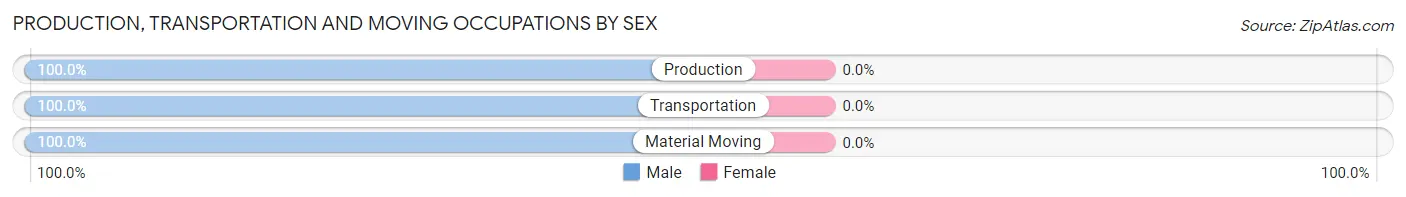
| Occupation | Male | Female |
| Production | 3 (100.0%) | 0 (0.0%) |
| Transportation | 37 (100.0%) | 0 (0.0%) |
| Material Moving | 7 (100.0%) | 0 (0.0%) |
| Total (Category) | 47 (100.0%) | 0 (0.0%) |
| Total (Overall) | 151 (62.7%) | 90 (37.3%) |
Employment Industries by Sex in Nocona Hills
Employment Industries in Nocona Hills
The major employment industries in Nocona Hills include Utilities (57 | 23.6%), Transportation & Warehousing (35 | 14.5%), Health Care & Social Assistance (31 | 12.9%), Finance & Insurance (24 | 10.0%), and Public Administration (23 | 9.5%).
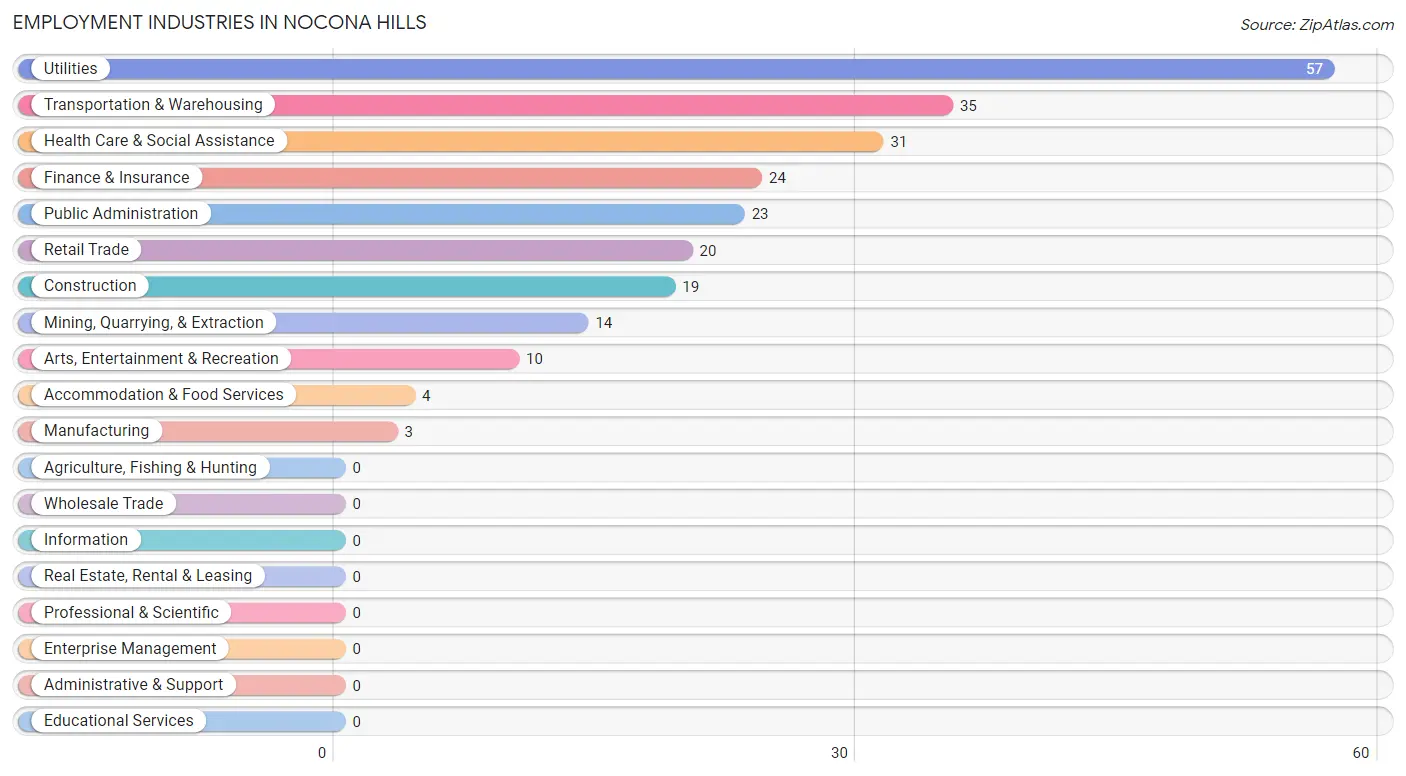
Employment Industries by Sex in Nocona Hills
The Nocona Hills industries that see more men than women are Mining, Quarrying, & Extraction (100.0%), Manufacturing (100.0%), and Transportation & Warehousing (100.0%), whereas the industries that tend to have a higher number of women are Finance & Insurance (100.0%), Accommodation & Food Services (100.0%), and Public Administration (95.7%).
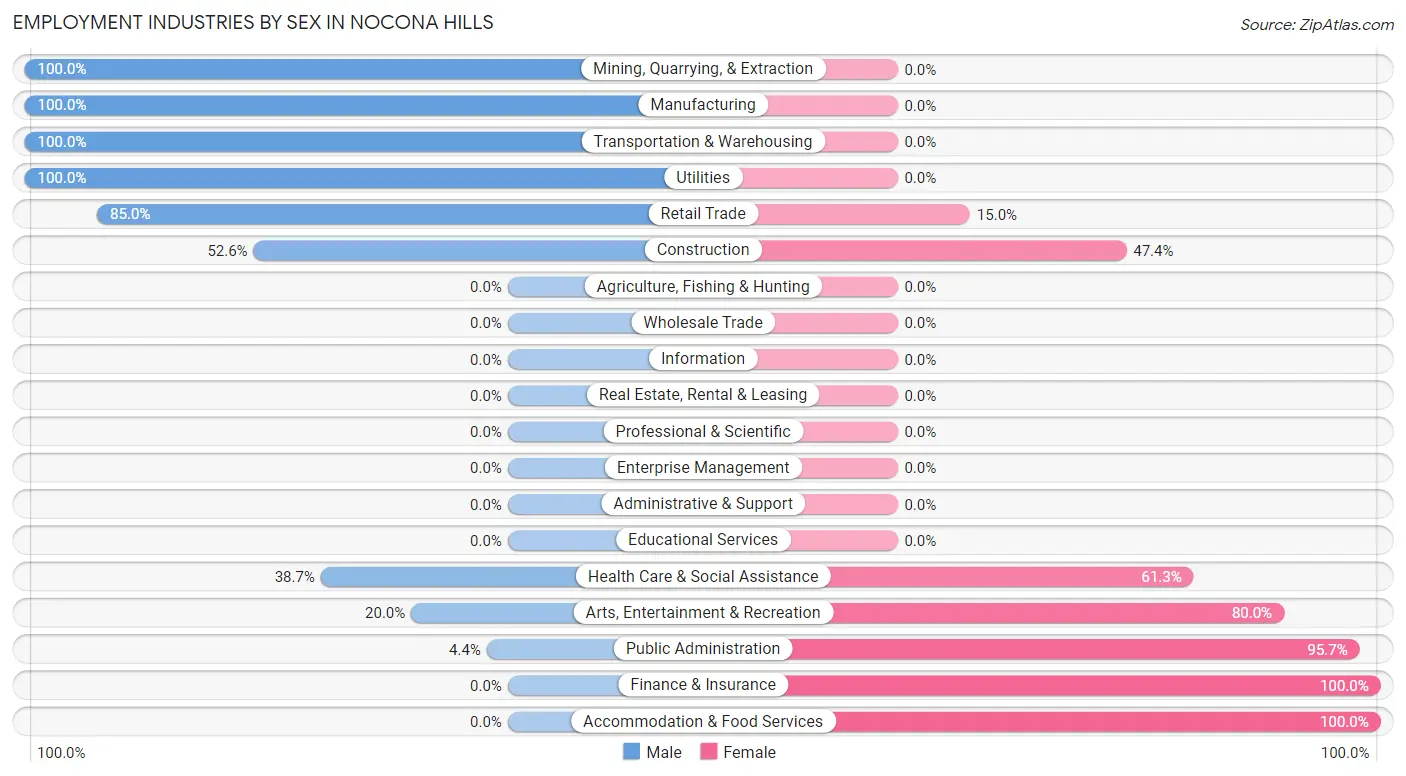
| Industry | Male | Female |
| Agriculture, Fishing & Hunting | 0 (0.0%) | 0 (0.0%) |
| Mining, Quarrying, & Extraction | 14 (100.0%) | 0 (0.0%) |
| Construction | 10 (52.6%) | 9 (47.4%) |
| Manufacturing | 3 (100.0%) | 0 (0.0%) |
| Wholesale Trade | 0 (0.0%) | 0 (0.0%) |
| Retail Trade | 17 (85.0%) | 3 (15.0%) |
| Transportation & Warehousing | 35 (100.0%) | 0 (0.0%) |
| Utilities | 57 (100.0%) | 0 (0.0%) |
| Information | 0 (0.0%) | 0 (0.0%) |
| Finance & Insurance | 0 (0.0%) | 24 (100.0%) |
| Real Estate, Rental & Leasing | 0 (0.0%) | 0 (0.0%) |
| Professional & Scientific | 0 (0.0%) | 0 (0.0%) |
| Enterprise Management | 0 (0.0%) | 0 (0.0%) |
| Administrative & Support | 0 (0.0%) | 0 (0.0%) |
| Educational Services | 0 (0.0%) | 0 (0.0%) |
| Health Care & Social Assistance | 12 (38.7%) | 19 (61.3%) |
| Arts, Entertainment & Recreation | 2 (20.0%) | 8 (80.0%) |
| Accommodation & Food Services | 0 (0.0%) | 4 (100.0%) |
| Public Administration | 1 (4.3%) | 22 (95.7%) |
| Total | 151 (62.7%) | 90 (37.3%) |
Education in Nocona Hills
School Enrollment in Nocona Hills
The most common levels of schooling among the 41 students in Nocona Hills are middle school (26 | 63.4%), high school (11 | 26.8%), and college / undergraduate (4 | 9.8%).
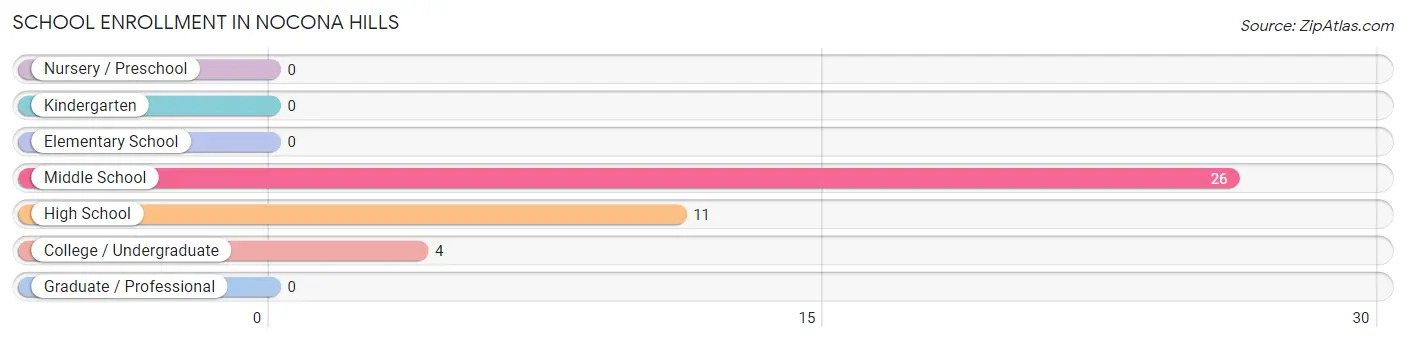
| School Level | # Students | % Students |
| Nursery / Preschool | 0 | 0.0% |
| Kindergarten | 0 | 0.0% |
| Elementary School | 0 | 0.0% |
| Middle School | 26 | 63.4% |
| High School | 11 | 26.8% |
| College / Undergraduate | 4 | 9.8% |
| Graduate / Professional | 0 | 0.0% |
| Total | 41 | 100.0% |
School Enrollment by Age by Funding Source in Nocona Hills
Out of a total of 41 students who are enrolled in schools in Nocona Hills, 4 (9.8%) attend a private institution, while the remaining 37 (90.2%) are enrolled in public schools. The age group of 10 to 14 year olds has the highest likelihood of being enrolled in private schools, with 4 (13.3% in the age bracket) enrolled. Conversely, the age group of 15 to 17 year olds has the lowest likelihood of being enrolled in a private school, with 7 (100.0% in the age bracket) attending a public institution.
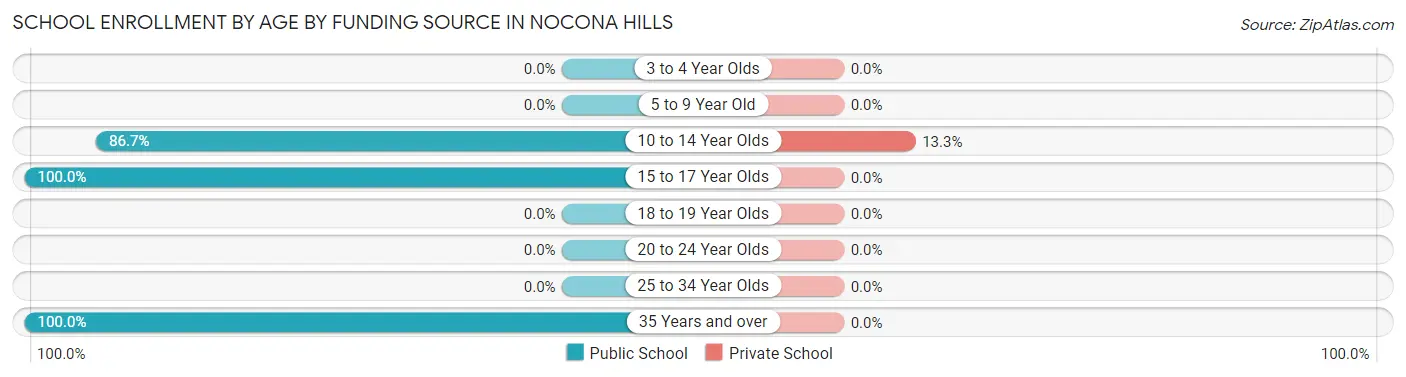
| Age Bracket | Public School | Private School |
| 3 to 4 Year Olds | 0 (0.0%) | 0 (0.0%) |
| 5 to 9 Year Old | 0 (0.0%) | 0 (0.0%) |
| 10 to 14 Year Olds | 26 (86.7%) | 4 (13.3%) |
| 15 to 17 Year Olds | 7 (100.0%) | 0 (0.0%) |
| 18 to 19 Year Olds | 0 (0.0%) | 0 (0.0%) |
| 20 to 24 Year Olds | 0 (0.0%) | 0 (0.0%) |
| 25 to 34 Year Olds | 0 (0.0%) | 0 (0.0%) |
| 35 Years and over | 4 (100.0%) | 0 (0.0%) |
| Total | 37 (90.2%) | 4 (9.8%) |
Educational Attainment by Field of Study in Nocona Hills
Business (37 | 31.9%), education (24 | 20.7%), science & technology (23 | 19.8%), literature & languages (14 | 12.1%), and arts & humanities (11 | 9.5%) are the most common fields of study among 116 individuals in Nocona Hills who have obtained a bachelor's degree or higher.
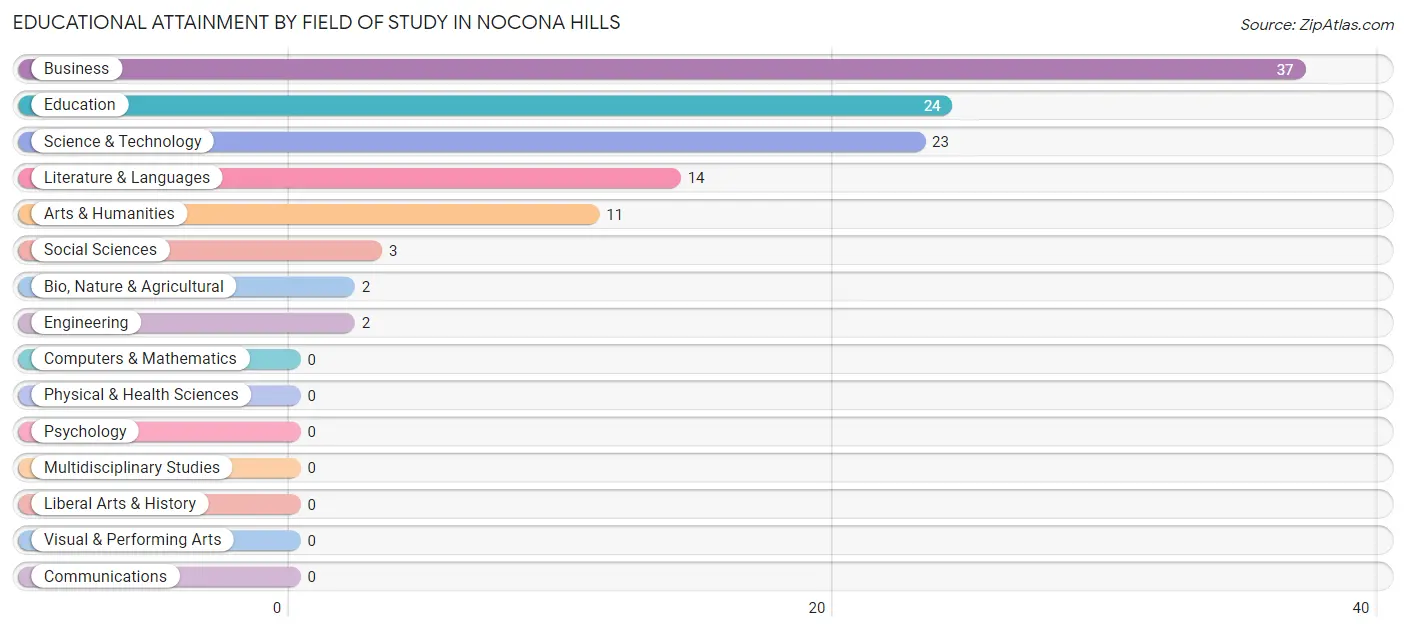
| Field of Study | # Graduates | % Graduates |
| Computers & Mathematics | 0 | 0.0% |
| Bio, Nature & Agricultural | 2 | 1.7% |
| Physical & Health Sciences | 0 | 0.0% |
| Psychology | 0 | 0.0% |
| Social Sciences | 3 | 2.6% |
| Engineering | 2 | 1.7% |
| Multidisciplinary Studies | 0 | 0.0% |
| Science & Technology | 23 | 19.8% |
| Business | 37 | 31.9% |
| Education | 24 | 20.7% |
| Literature & Languages | 14 | 12.1% |
| Liberal Arts & History | 0 | 0.0% |
| Visual & Performing Arts | 0 | 0.0% |
| Communications | 0 | 0.0% |
| Arts & Humanities | 11 | 9.5% |
| Total | 116 | 100.0% |
Transportation & Commute in Nocona Hills
Vehicle Availability by Sex in Nocona Hills
The most prevalent vehicle ownership categories in Nocona Hills are males with 2 vehicles (76, accounting for 65.5%) and females with 2 vehicles (66, making up 84.4%).
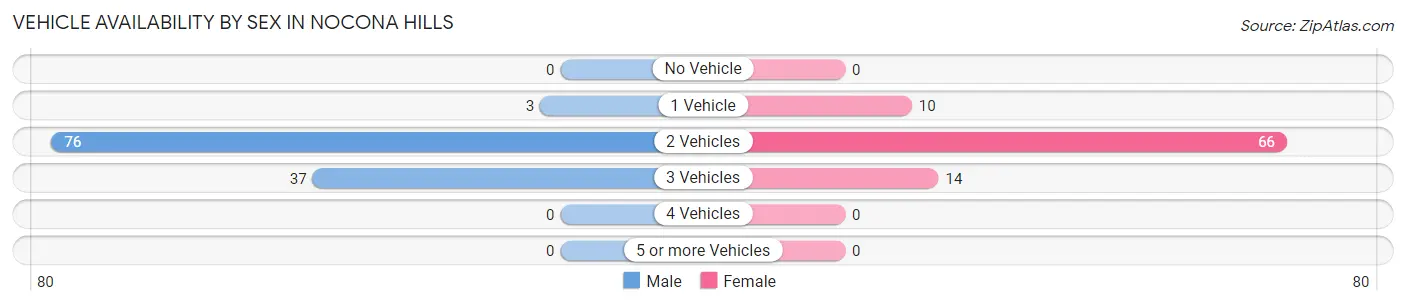
| Vehicles Available | Male | Female |
| No Vehicle | 0 (0.0%) | 0 (0.0%) |
| 1 Vehicle | 3 (2.6%) | 10 (11.1%) |
| 2 Vehicles | 76 (65.5%) | 66 (73.3%) |
| 3 Vehicles | 37 (31.9%) | 14 (15.6%) |
| 4 Vehicles | 0 (0.0%) | 0 (0.0%) |
| 5 or more Vehicles | 0 (0.0%) | 0 (0.0%) |
| Total | 116 (100.0%) | 90 (100.0%) |
Commute Time in Nocona Hills
The most frequently occuring commute durations in Nocona Hills are 20 to 24 minutes (57 commuters, 28.6%), 45 to 59 minutes (46 commuters, 23.1%), and 25 to 29 minutes (23 commuters, 11.6%).
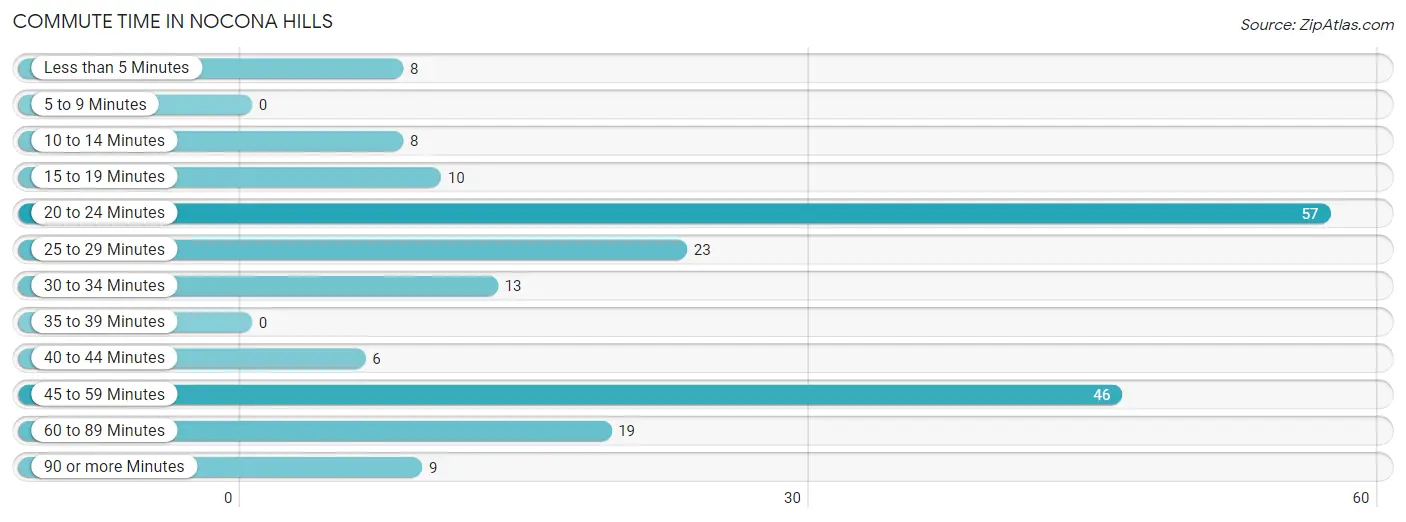
| Commute Time | # Commuters | % Commuters |
| Less than 5 Minutes | 8 | 4.0% |
| 5 to 9 Minutes | 0 | 0.0% |
| 10 to 14 Minutes | 8 | 4.0% |
| 15 to 19 Minutes | 10 | 5.0% |
| 20 to 24 Minutes | 57 | 28.6% |
| 25 to 29 Minutes | 23 | 11.6% |
| 30 to 34 Minutes | 13 | 6.5% |
| 35 to 39 Minutes | 0 | 0.0% |
| 40 to 44 Minutes | 6 | 3.0% |
| 45 to 59 Minutes | 46 | 23.1% |
| 60 to 89 Minutes | 19 | 9.6% |
| 90 or more Minutes | 9 | 4.5% |
Commute Time by Sex in Nocona Hills
The most common commute times in Nocona Hills are 45 to 59 minutes (35 commuters, 30.2%) for males and 20 to 24 minutes (24 commuters, 28.9%) for females.
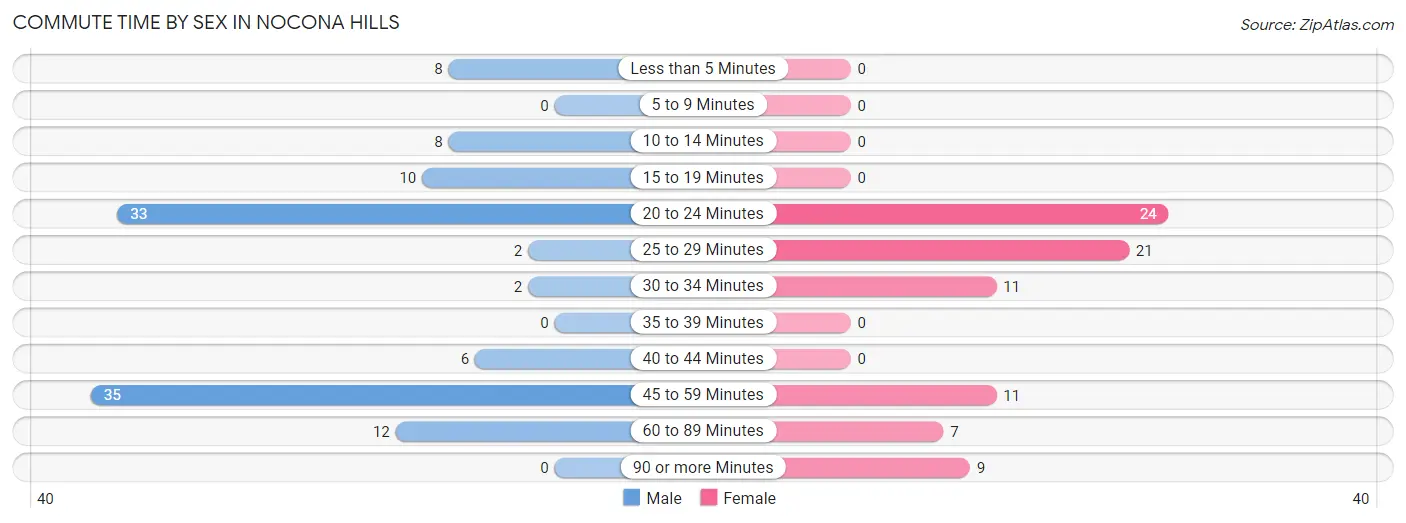
| Commute Time | Male | Female |
| Less than 5 Minutes | 8 (6.9%) | 0 (0.0%) |
| 5 to 9 Minutes | 0 (0.0%) | 0 (0.0%) |
| 10 to 14 Minutes | 8 (6.9%) | 0 (0.0%) |
| 15 to 19 Minutes | 10 (8.6%) | 0 (0.0%) |
| 20 to 24 Minutes | 33 (28.4%) | 24 (28.9%) |
| 25 to 29 Minutes | 2 (1.7%) | 21 (25.3%) |
| 30 to 34 Minutes | 2 (1.7%) | 11 (13.3%) |
| 35 to 39 Minutes | 0 (0.0%) | 0 (0.0%) |
| 40 to 44 Minutes | 6 (5.2%) | 0 (0.0%) |
| 45 to 59 Minutes | 35 (30.2%) | 11 (13.3%) |
| 60 to 89 Minutes | 12 (10.3%) | 7 (8.4%) |
| 90 or more Minutes | 0 (0.0%) | 9 (10.8%) |
Time of Departure to Work by Sex in Nocona Hills
The most frequent times of departure to work in Nocona Hills are 6:00 AM to 6:29 AM (31, 26.7%) for males and 7:30 AM to 7:59 AM (24, 28.9%) for females.
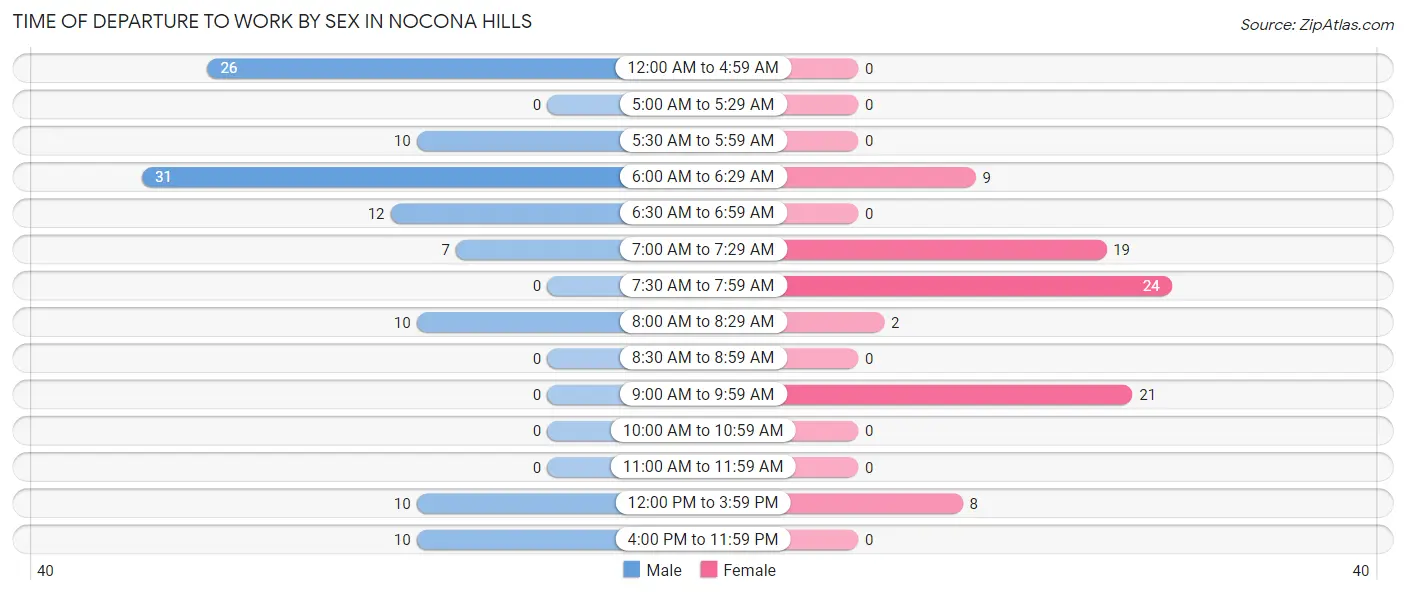
| Time of Departure | Male | Female |
| 12:00 AM to 4:59 AM | 26 (22.4%) | 0 (0.0%) |
| 5:00 AM to 5:29 AM | 0 (0.0%) | 0 (0.0%) |
| 5:30 AM to 5:59 AM | 10 (8.6%) | 0 (0.0%) |
| 6:00 AM to 6:29 AM | 31 (26.7%) | 9 (10.8%) |
| 6:30 AM to 6:59 AM | 12 (10.3%) | 0 (0.0%) |
| 7:00 AM to 7:29 AM | 7 (6.0%) | 19 (22.9%) |
| 7:30 AM to 7:59 AM | 0 (0.0%) | 24 (28.9%) |
| 8:00 AM to 8:29 AM | 10 (8.6%) | 2 (2.4%) |
| 8:30 AM to 8:59 AM | 0 (0.0%) | 0 (0.0%) |
| 9:00 AM to 9:59 AM | 0 (0.0%) | 21 (25.3%) |
| 10:00 AM to 10:59 AM | 0 (0.0%) | 0 (0.0%) |
| 11:00 AM to 11:59 AM | 0 (0.0%) | 0 (0.0%) |
| 12:00 PM to 3:59 PM | 10 (8.6%) | 8 (9.6%) |
| 4:00 PM to 11:59 PM | 10 (8.6%) | 0 (0.0%) |
| Total | 116 (100.0%) | 83 (100.0%) |
Housing Occupancy in Nocona Hills
Occupancy by Ownership in Nocona Hills
Of the total 294 dwellings in Nocona Hills, owner-occupied units account for 241 (82.0%), while renter-occupied units make up 53 (18.0%).
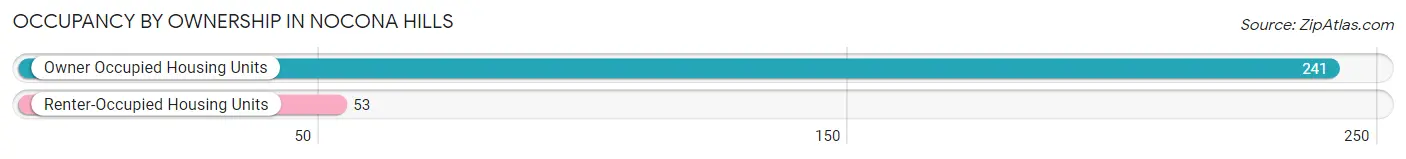
| Occupancy | # Housing Units | % Housing Units |
| Owner Occupied Housing Units | 241 | 82.0% |
| Renter-Occupied Housing Units | 53 | 18.0% |
| Total Occupied Housing Units | 294 | 100.0% |
Occupancy by Household Size in Nocona Hills
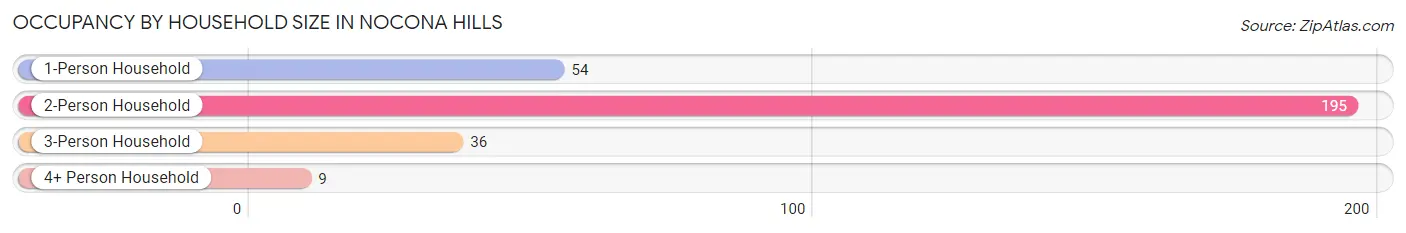
| Household Size | # Housing Units | % Housing Units |
| 1-Person Household | 54 | 18.4% |
| 2-Person Household | 195 | 66.3% |
| 3-Person Household | 36 | 12.2% |
| 4+ Person Household | 9 | 3.1% |
| Total Housing Units | 294 | 100.0% |
Occupancy by Ownership by Household Size in Nocona Hills
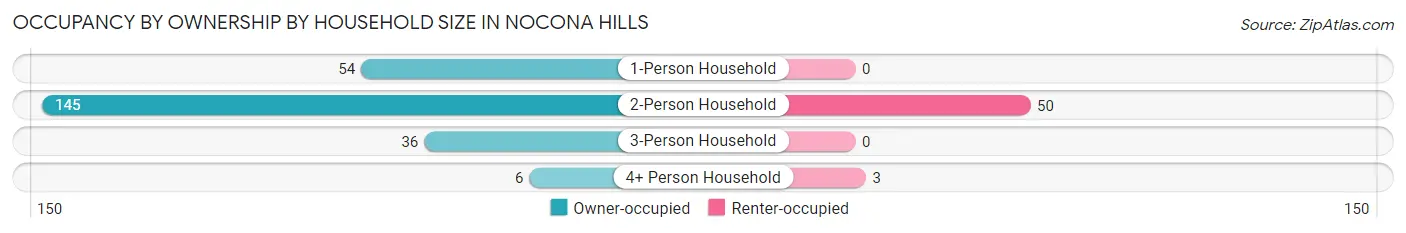
| Household Size | Owner-occupied | Renter-occupied |
| 1-Person Household | 54 (100.0%) | 0 (0.0%) |
| 2-Person Household | 145 (74.4%) | 50 (25.6%) |
| 3-Person Household | 36 (100.0%) | 0 (0.0%) |
| 4+ Person Household | 6 (66.7%) | 3 (33.3%) |
| Total Housing Units | 241 (82.0%) | 53 (18.0%) |
Occupancy by Educational Attainment in Nocona Hills
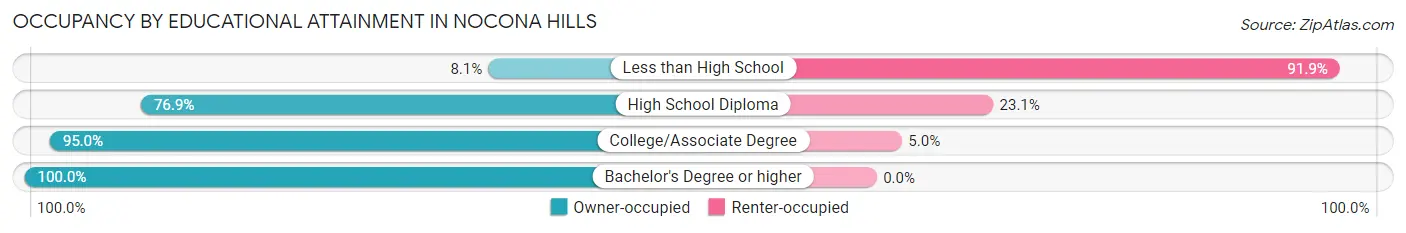
| Household Size | Owner-occupied | Renter-occupied |
| Less than High School | 3 (8.1%) | 34 (91.9%) |
| High School Diploma | 40 (76.9%) | 12 (23.1%) |
| College/Associate Degree | 133 (95.0%) | 7 (5.0%) |
| Bachelor's Degree or higher | 65 (100.0%) | 0 (0.0%) |
Occupancy by Age of Householder in Nocona Hills
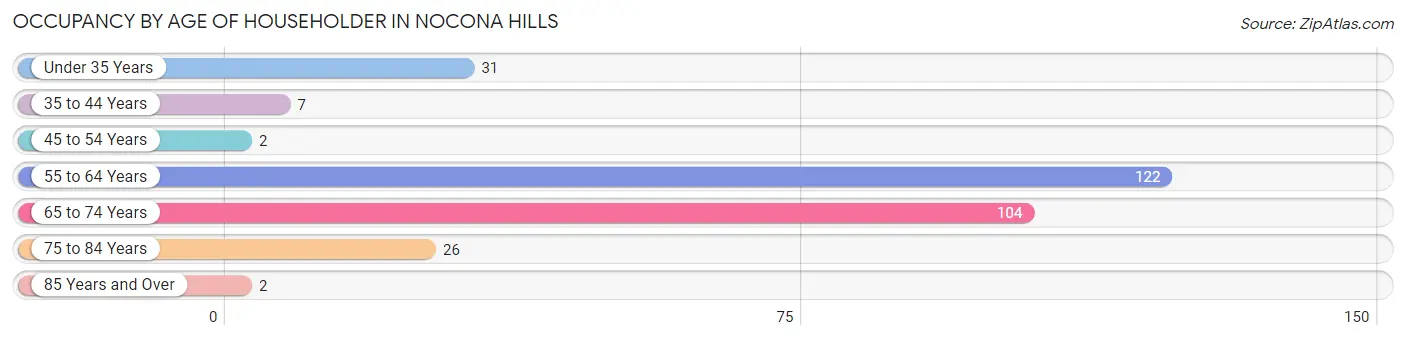
| Age Bracket | # Households | % Households |
| Under 35 Years | 31 | 10.5% |
| 35 to 44 Years | 7 | 2.4% |
| 45 to 54 Years | 2 | 0.7% |
| 55 to 64 Years | 122 | 41.5% |
| 65 to 74 Years | 104 | 35.4% |
| 75 to 84 Years | 26 | 8.8% |
| 85 Years and Over | 2 | 0.7% |
| Total | 294 | 100.0% |
Housing Finances in Nocona Hills
Median Income by Occupancy in Nocona Hills
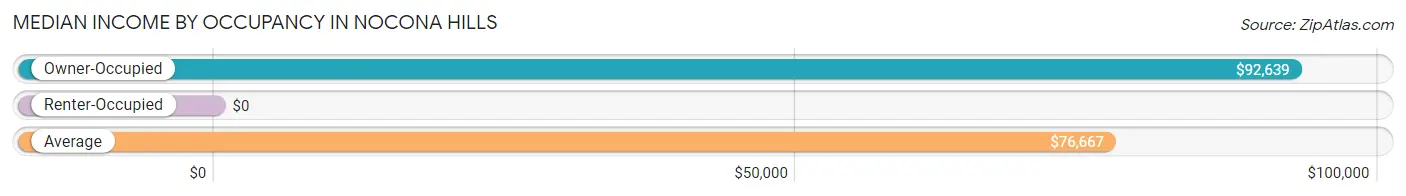
| Occupancy Type | # Households | Median Income |
| Owner-Occupied | 241 (82.0%) | $92,639 |
| Renter-Occupied | 53 (18.0%) | $0 |
| Average | 294 (100.0%) | $76,667 |
Occupancy by Householder Income Bracket in Nocona Hills
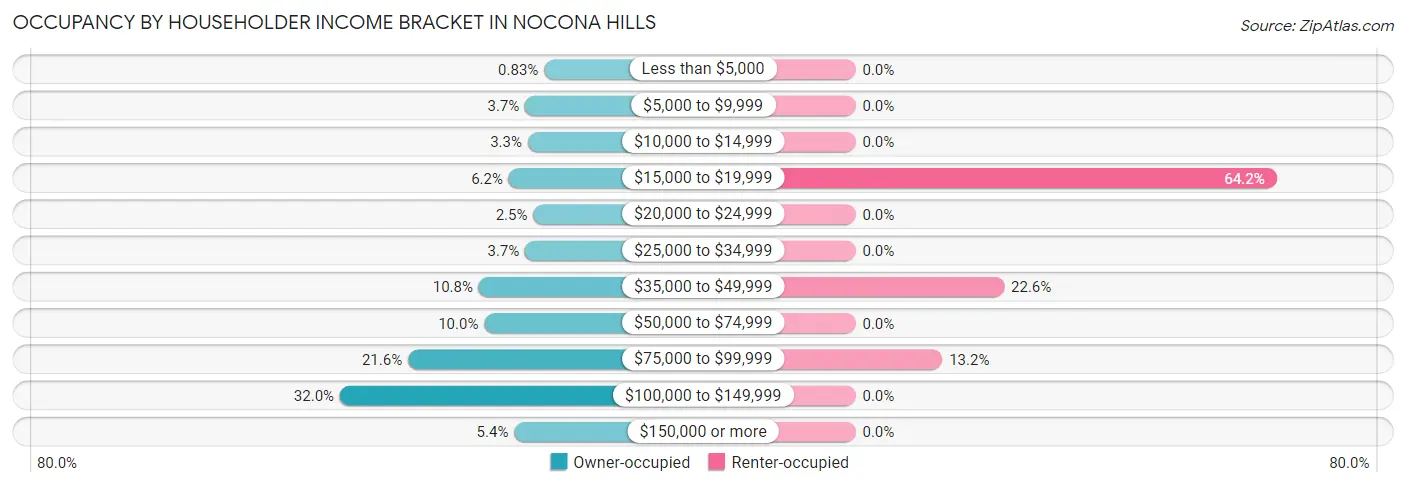
| Income Bracket | Owner-occupied | Renter-occupied |
| Less than $5,000 | 2 (0.8%) | 0 (0.0%) |
| $5,000 to $9,999 | 9 (3.7%) | 0 (0.0%) |
| $10,000 to $14,999 | 8 (3.3%) | 0 (0.0%) |
| $15,000 to $19,999 | 15 (6.2%) | 34 (64.1%) |
| $20,000 to $24,999 | 6 (2.5%) | 0 (0.0%) |
| $25,000 to $34,999 | 9 (3.7%) | 0 (0.0%) |
| $35,000 to $49,999 | 26 (10.8%) | 12 (22.6%) |
| $50,000 to $74,999 | 24 (10.0%) | 0 (0.0%) |
| $75,000 to $99,999 | 52 (21.6%) | 7 (13.2%) |
| $100,000 to $149,999 | 77 (32.0%) | 0 (0.0%) |
| $150,000 or more | 13 (5.4%) | 0 (0.0%) |
| Total | 241 (100.0%) | 53 (100.0%) |
Monthly Housing Cost Tiers in Nocona Hills
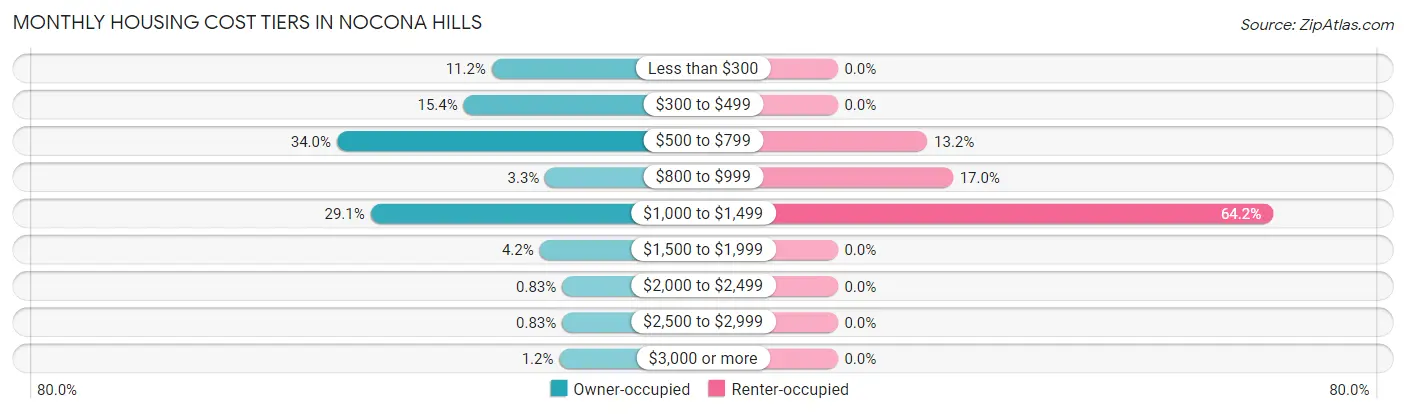
| Monthly Cost | Owner-occupied | Renter-occupied |
| Less than $300 | 27 (11.2%) | 0 (0.0%) |
| $300 to $499 | 37 (15.3%) | 0 (0.0%) |
| $500 to $799 | 82 (34.0%) | 7 (13.2%) |
| $800 to $999 | 8 (3.3%) | 9 (17.0%) |
| $1,000 to $1,499 | 70 (29.0%) | 34 (64.1%) |
| $1,500 to $1,999 | 10 (4.2%) | 0 (0.0%) |
| $2,000 to $2,499 | 2 (0.8%) | 0 (0.0%) |
| $2,500 to $2,999 | 2 (0.8%) | 0 (0.0%) |
| $3,000 or more | 3 (1.2%) | 0 (0.0%) |
| Total | 241 (100.0%) | 53 (100.0%) |
Physical Housing Characteristics in Nocona Hills
Housing Structures in Nocona Hills
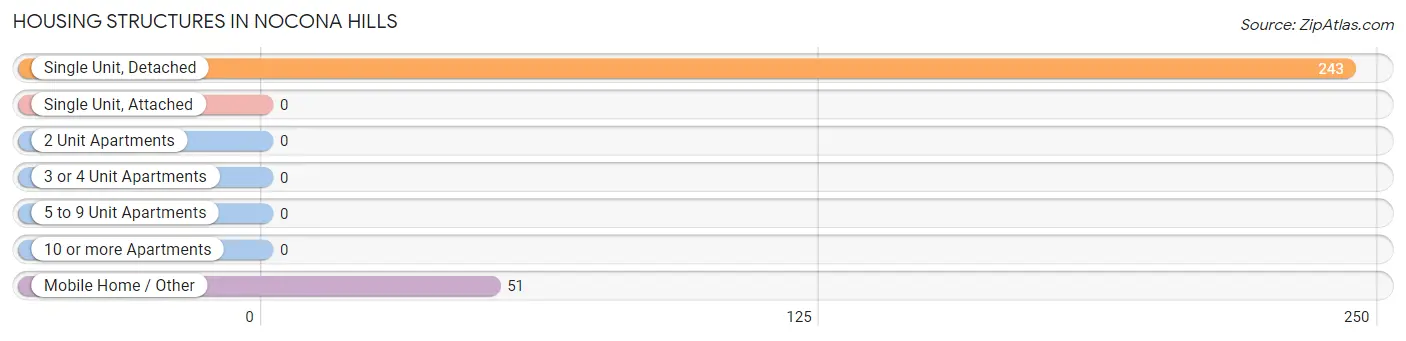
| Structure Type | # Housing Units | % Housing Units |
| Single Unit, Detached | 243 | 82.7% |
| Single Unit, Attached | 0 | 0.0% |
| 2 Unit Apartments | 0 | 0.0% |
| 3 or 4 Unit Apartments | 0 | 0.0% |
| 5 to 9 Unit Apartments | 0 | 0.0% |
| 10 or more Apartments | 0 | 0.0% |
| Mobile Home / Other | 51 | 17.3% |
| Total | 294 | 100.0% |
Housing Structures by Occupancy in Nocona Hills
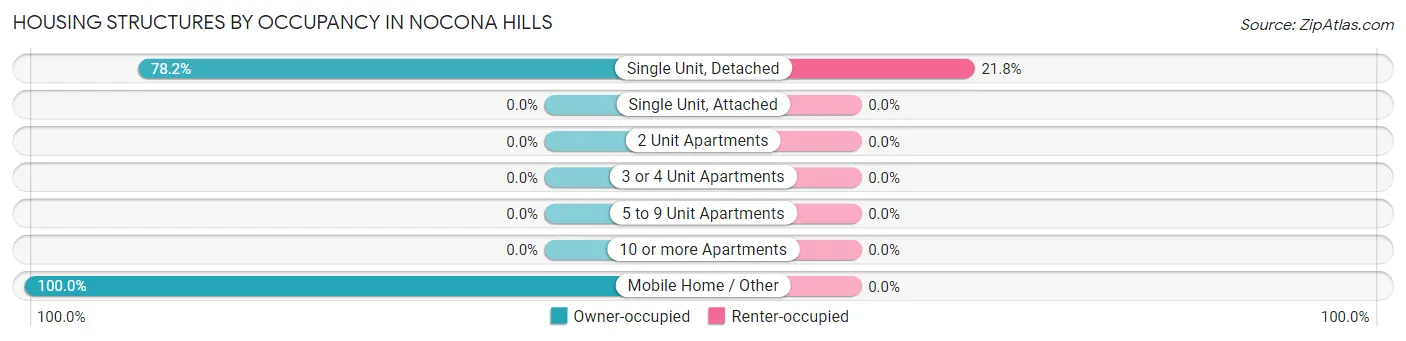
| Structure Type | Owner-occupied | Renter-occupied |
| Single Unit, Detached | 190 (78.2%) | 53 (21.8%) |
| Single Unit, Attached | 0 (0.0%) | 0 (0.0%) |
| 2 Unit Apartments | 0 (0.0%) | 0 (0.0%) |
| 3 or 4 Unit Apartments | 0 (0.0%) | 0 (0.0%) |
| 5 to 9 Unit Apartments | 0 (0.0%) | 0 (0.0%) |
| 10 or more Apartments | 0 (0.0%) | 0 (0.0%) |
| Mobile Home / Other | 51 (100.0%) | 0 (0.0%) |
| Total | 241 (82.0%) | 53 (18.0%) |
Housing Structures by Number of Rooms in Nocona Hills
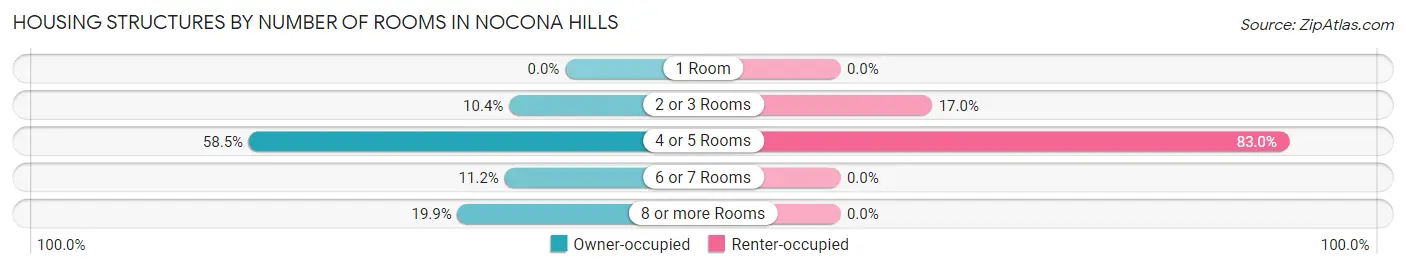
| Number of Rooms | Owner-occupied | Renter-occupied |
| 1 Room | 0 (0.0%) | 0 (0.0%) |
| 2 or 3 Rooms | 25 (10.4%) | 9 (17.0%) |
| 4 or 5 Rooms | 141 (58.5%) | 44 (83.0%) |
| 6 or 7 Rooms | 27 (11.2%) | 0 (0.0%) |
| 8 or more Rooms | 48 (19.9%) | 0 (0.0%) |
| Total | 241 (100.0%) | 53 (100.0%) |
Housing Structure by Heating Type in Nocona Hills
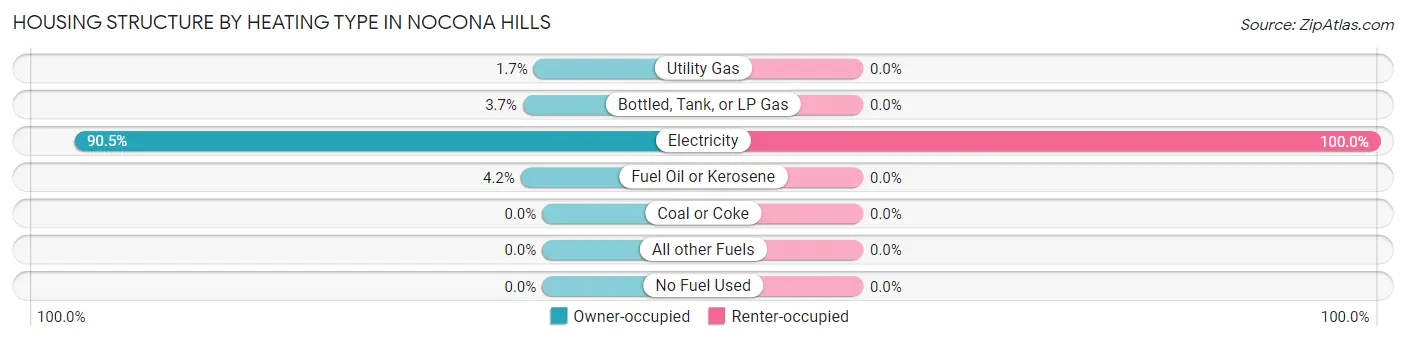
| Heating Type | Owner-occupied | Renter-occupied |
| Utility Gas | 4 (1.7%) | 0 (0.0%) |
| Bottled, Tank, or LP Gas | 9 (3.7%) | 0 (0.0%) |
| Electricity | 218 (90.5%) | 53 (100.0%) |
| Fuel Oil or Kerosene | 10 (4.2%) | 0 (0.0%) |
| Coal or Coke | 0 (0.0%) | 0 (0.0%) |
| All other Fuels | 0 (0.0%) | 0 (0.0%) |
| No Fuel Used | 0 (0.0%) | 0 (0.0%) |
| Total | 241 (100.0%) | 53 (100.0%) |
Household Vehicle Usage in Nocona Hills
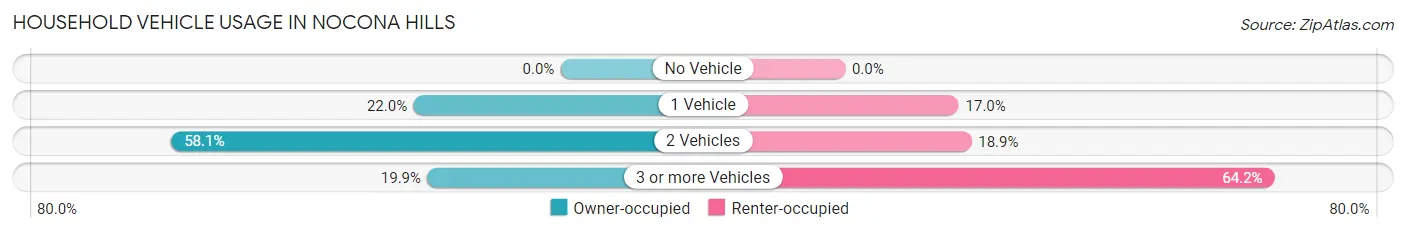
| Vehicles per Household | Owner-occupied | Renter-occupied |
| No Vehicle | 0 (0.0%) | 0 (0.0%) |
| 1 Vehicle | 53 (22.0%) | 9 (17.0%) |
| 2 Vehicles | 140 (58.1%) | 10 (18.9%) |
| 3 or more Vehicles | 48 (19.9%) | 34 (64.1%) |
| Total | 241 (100.0%) | 53 (100.0%) |
Real Estate & Mortgages in Nocona Hills
Real Estate and Mortgage Overview in Nocona Hills
| Characteristic | Without Mortgage | With Mortgage |
| Housing Units | 159 | 82 |
| Median Property Value | $167,500 | $117,300 |
| Median Household Income | - | - |
| Monthly Housing Costs | $534 | $3 |
| Real Estate Taxes | $1,630 | $0 |
Property Value by Mortgage Status in Nocona Hills
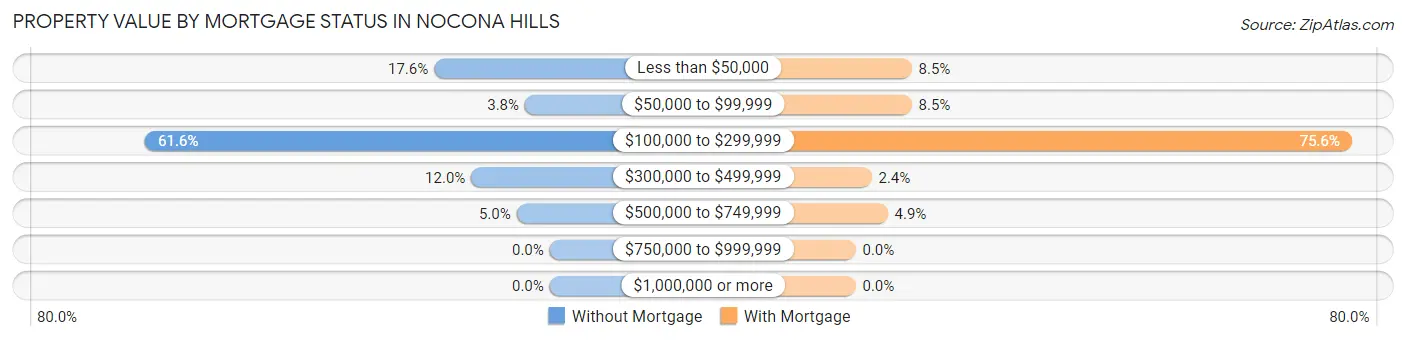
| Property Value | Without Mortgage | With Mortgage |
| Less than $50,000 | 28 (17.6%) | 7 (8.5%) |
| $50,000 to $99,999 | 6 (3.8%) | 7 (8.5%) |
| $100,000 to $299,999 | 98 (61.6%) | 62 (75.6%) |
| $300,000 to $499,999 | 19 (11.9%) | 2 (2.4%) |
| $500,000 to $749,999 | 8 (5.0%) | 4 (4.9%) |
| $750,000 to $999,999 | 0 (0.0%) | 0 (0.0%) |
| $1,000,000 or more | 0 (0.0%) | 0 (0.0%) |
| Total | 159 (100.0%) | 82 (100.0%) |
Household Income by Mortgage Status in Nocona Hills
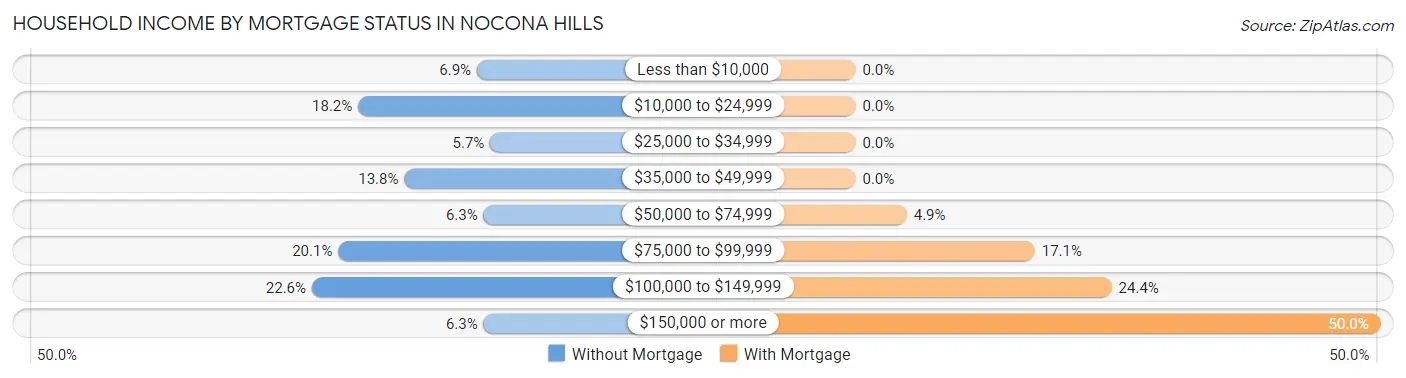
| Household Income | Without Mortgage | With Mortgage |
| Less than $10,000 | 11 (6.9%) | 0 (0.0%) |
| $10,000 to $24,999 | 29 (18.2%) | 0 (0.0%) |
| $25,000 to $34,999 | 9 (5.7%) | 0 (0.0%) |
| $35,000 to $49,999 | 22 (13.8%) | 0 (0.0%) |
| $50,000 to $74,999 | 10 (6.3%) | 4 (4.9%) |
| $75,000 to $99,999 | 32 (20.1%) | 14 (17.1%) |
| $100,000 to $149,999 | 36 (22.6%) | 20 (24.4%) |
| $150,000 or more | 10 (6.3%) | 41 (50.0%) |
| Total | 159 (100.0%) | 82 (100.0%) |
Property Value to Household Income Ratio in Nocona Hills
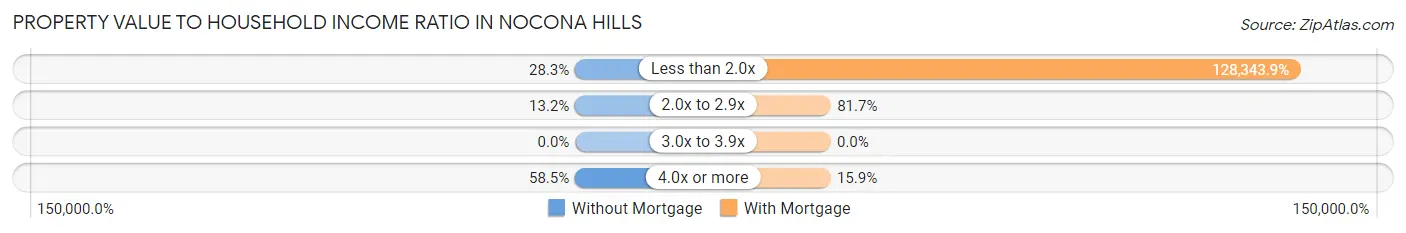
| Value-to-Income Ratio | Without Mortgage | With Mortgage |
| Less than 2.0x | 45 (28.3%) | 105,242 (128,343.9%) |
| 2.0x to 2.9x | 21 (13.2%) | 67 (81.7%) |
| 3.0x to 3.9x | 0 (0.0%) | 0 (0.0%) |
| 4.0x or more | 93 (58.5%) | 13 (15.9%) |
| Total | 159 (100.0%) | 82 (100.0%) |
Real Estate Taxes by Mortgage Status in Nocona Hills
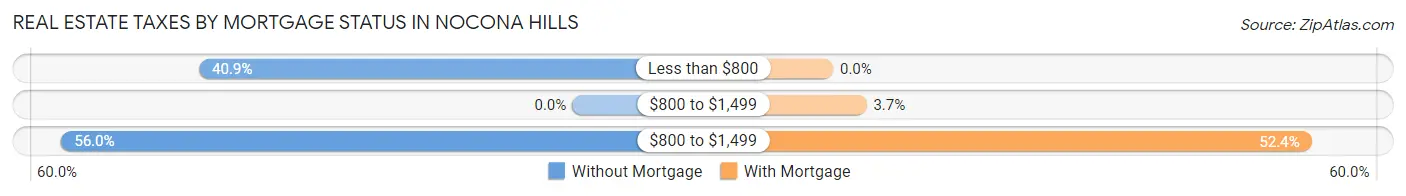
| Property Taxes | Without Mortgage | With Mortgage |
| Less than $800 | 65 (40.9%) | 0 (0.0%) |
| $800 to $1,499 | 0 (0.0%) | 3 (3.7%) |
| $800 to $1,499 | 89 (56.0%) | 43 (52.4%) |
| Total | 159 (100.0%) | 82 (100.0%) |
Health & Disability in Nocona Hills
Health Insurance Coverage by Age in Nocona Hills
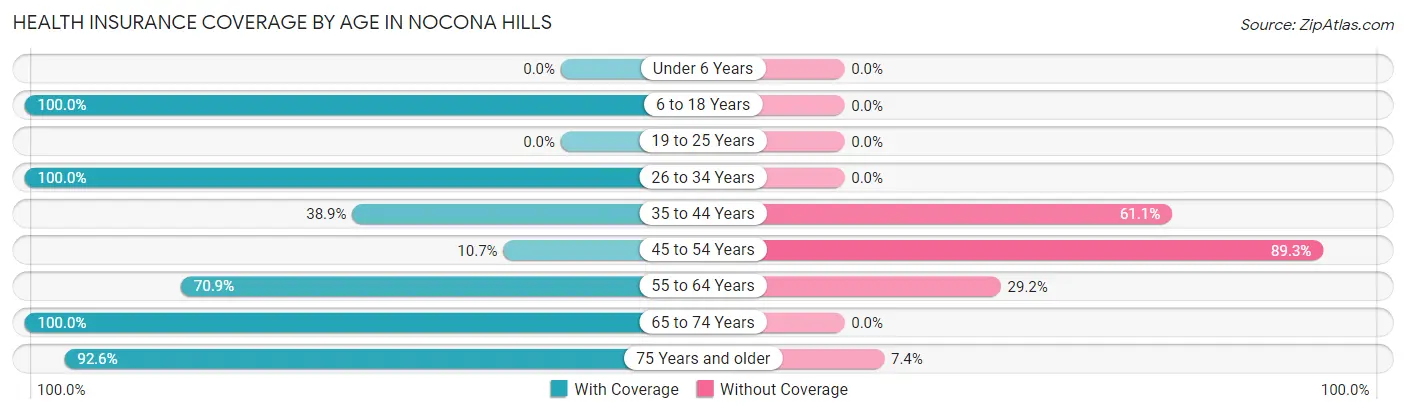
| Age Bracket | With Coverage | Without Coverage |
| Under 6 Years | 0 (0.0%) | 0 (0.0%) |
| 6 to 18 Years | 39 (100.0%) | 0 (0.0%) |
| 19 to 25 Years | 0 (0.0%) | 0 (0.0%) |
| 26 to 34 Years | 58 (100.0%) | 0 (0.0%) |
| 35 to 44 Years | 7 (38.9%) | 11 (61.1%) |
| 45 to 54 Years | 9 (10.7%) | 75 (89.3%) |
| 55 to 64 Years | 158 (70.9%) | 65 (29.1%) |
| 65 to 74 Years | 144 (100.0%) | 0 (0.0%) |
| 75 Years and older | 50 (92.6%) | 4 (7.4%) |
| Total | 465 (75.0%) | 155 (25.0%) |
Health Insurance Coverage by Citizenship Status in Nocona Hills
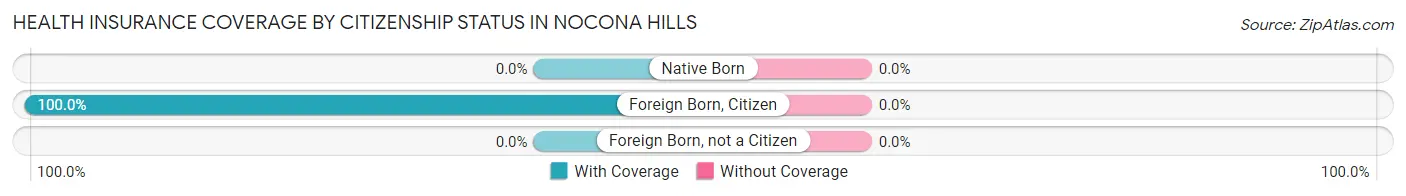
| Citizenship Status | With Coverage | Without Coverage |
| Native Born | 0 (0.0%) | 0 (0.0%) |
| Foreign Born, Citizen | 39 (100.0%) | 0 (0.0%) |
| Foreign Born, not a Citizen | 0 (0.0%) | 0 (0.0%) |
Health Insurance Coverage by Household Income in Nocona Hills
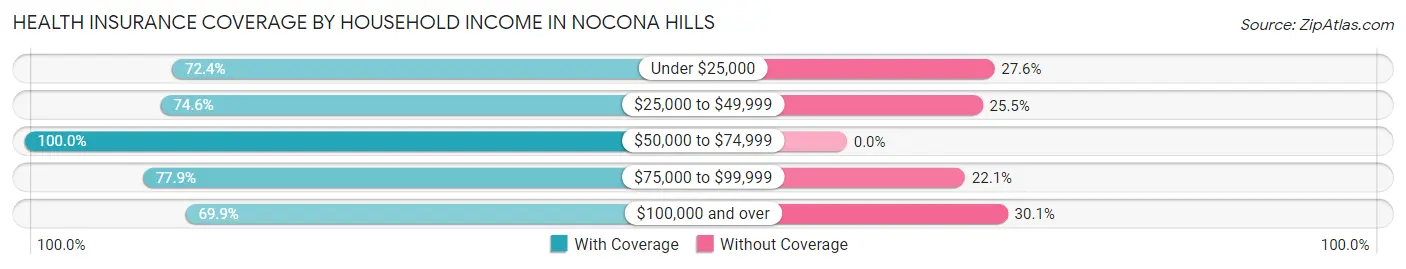
| Household Income | With Coverage | Without Coverage |
| Under $25,000 | 89 (72.4%) | 34 (27.6%) |
| $25,000 to $49,999 | 82 (74.6%) | 28 (25.5%) |
| $50,000 to $74,999 | 46 (100.0%) | 0 (0.0%) |
| $75,000 to $99,999 | 95 (77.9%) | 27 (22.1%) |
| $100,000 and over | 153 (69.9%) | 66 (30.1%) |
Public vs Private Health Insurance Coverage by Age in Nocona Hills
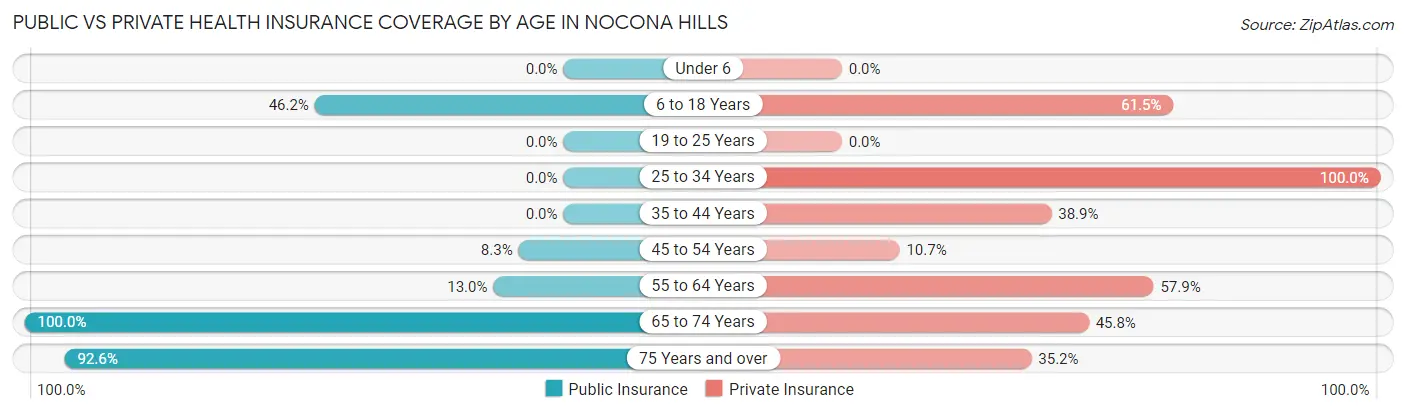
| Age Bracket | Public Insurance | Private Insurance |
| Under 6 | 0 (0.0%) | 0 (0.0%) |
| 6 to 18 Years | 18 (46.2%) | 24 (61.5%) |
| 19 to 25 Years | 0 (0.0%) | 0 (0.0%) |
| 25 to 34 Years | 0 (0.0%) | 58 (100.0%) |
| 35 to 44 Years | 0 (0.0%) | 7 (38.9%) |
| 45 to 54 Years | 7 (8.3%) | 9 (10.7%) |
| 55 to 64 Years | 29 (13.0%) | 129 (57.9%) |
| 65 to 74 Years | 144 (100.0%) | 66 (45.8%) |
| 75 Years and over | 50 (92.6%) | 19 (35.2%) |
| Total | 248 (40.0%) | 312 (50.3%) |
Disability Status by Sex by Age in Nocona Hills
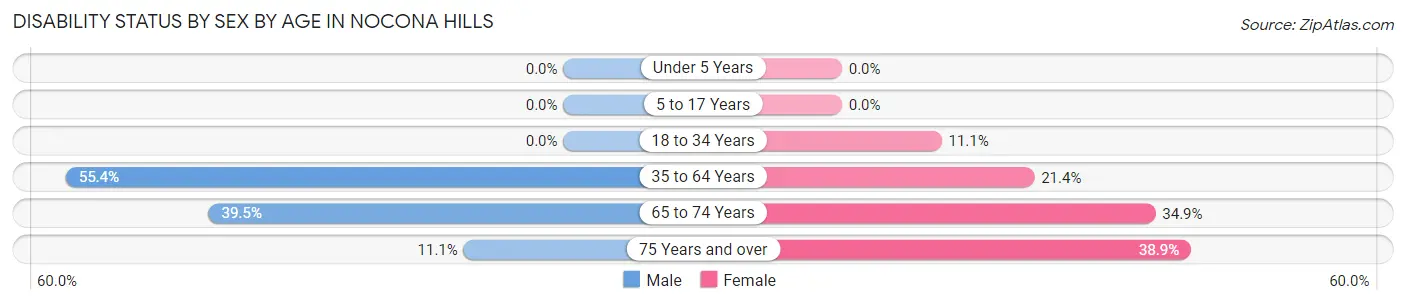
| Age Bracket | Male | Female |
| Under 5 Years | 0 (0.0%) | 0 (0.0%) |
| 5 to 17 Years | 0 (0.0%) | 0 (0.0%) |
| 18 to 34 Years | 0 (0.0%) | 3 (11.1%) |
| 35 to 64 Years | 87 (55.4%) | 36 (21.4%) |
| 65 to 74 Years | 32 (39.5%) | 22 (34.9%) |
| 75 Years and over | 2 (11.1%) | 14 (38.9%) |
Disability Class by Sex by Age in Nocona Hills
Disability Class: Hearing Difficulty
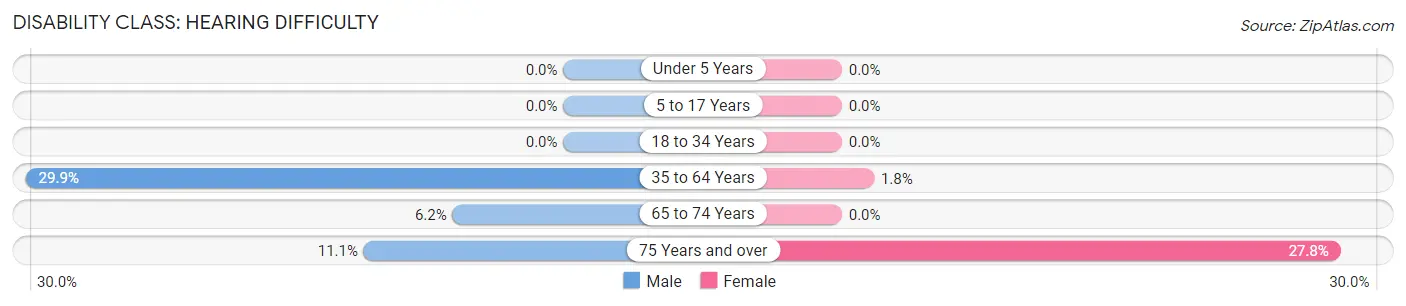
| Age Bracket | Male | Female |
| Under 5 Years | 0 (0.0%) | 0 (0.0%) |
| 5 to 17 Years | 0 (0.0%) | 0 (0.0%) |
| 18 to 34 Years | 0 (0.0%) | 0 (0.0%) |
| 35 to 64 Years | 47 (29.9%) | 3 (1.8%) |
| 65 to 74 Years | 5 (6.2%) | 0 (0.0%) |
| 75 Years and over | 2 (11.1%) | 10 (27.8%) |
Disability Class: Vision Difficulty
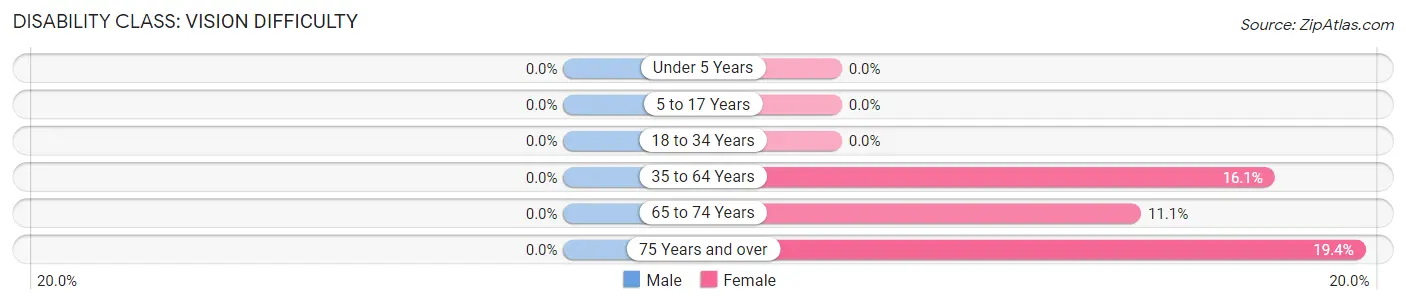
| Age Bracket | Male | Female |
| Under 5 Years | 0 (0.0%) | 0 (0.0%) |
| 5 to 17 Years | 0 (0.0%) | 0 (0.0%) |
| 18 to 34 Years | 0 (0.0%) | 0 (0.0%) |
| 35 to 64 Years | 0 (0.0%) | 27 (16.1%) |
| 65 to 74 Years | 0 (0.0%) | 7 (11.1%) |
| 75 Years and over | 0 (0.0%) | 7 (19.4%) |
Disability Class: Cognitive Difficulty
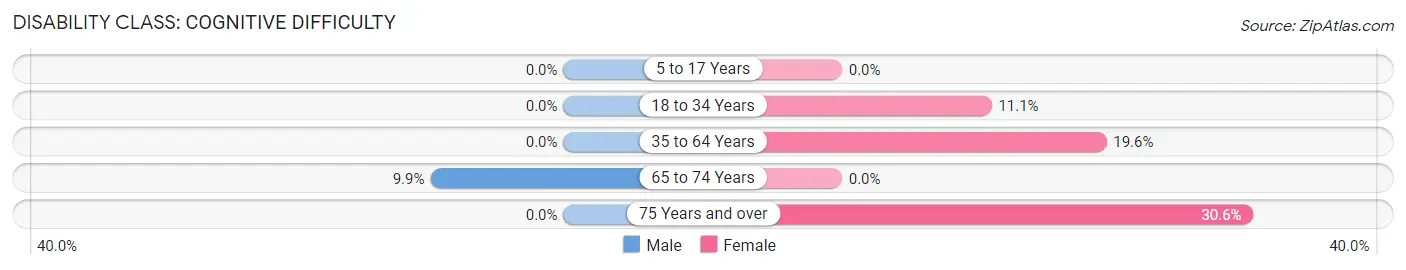
| Age Bracket | Male | Female |
| 5 to 17 Years | 0 (0.0%) | 0 (0.0%) |
| 18 to 34 Years | 0 (0.0%) | 3 (11.1%) |
| 35 to 64 Years | 0 (0.0%) | 33 (19.6%) |
| 65 to 74 Years | 8 (9.9%) | 0 (0.0%) |
| 75 Years and over | 0 (0.0%) | 11 (30.6%) |
Disability Class: Ambulatory Difficulty
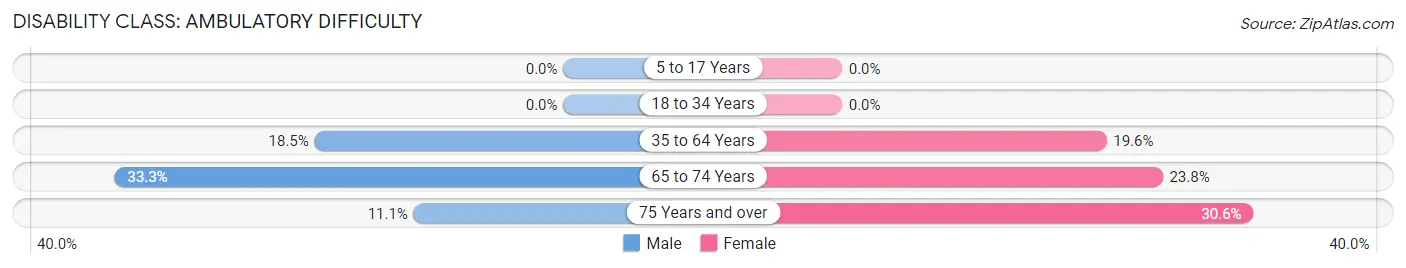
| Age Bracket | Male | Female |
| 5 to 17 Years | 0 (0.0%) | 0 (0.0%) |
| 18 to 34 Years | 0 (0.0%) | 0 (0.0%) |
| 35 to 64 Years | 29 (18.5%) | 33 (19.6%) |
| 65 to 74 Years | 27 (33.3%) | 15 (23.8%) |
| 75 Years and over | 2 (11.1%) | 11 (30.6%) |
Disability Class: Self-Care Difficulty
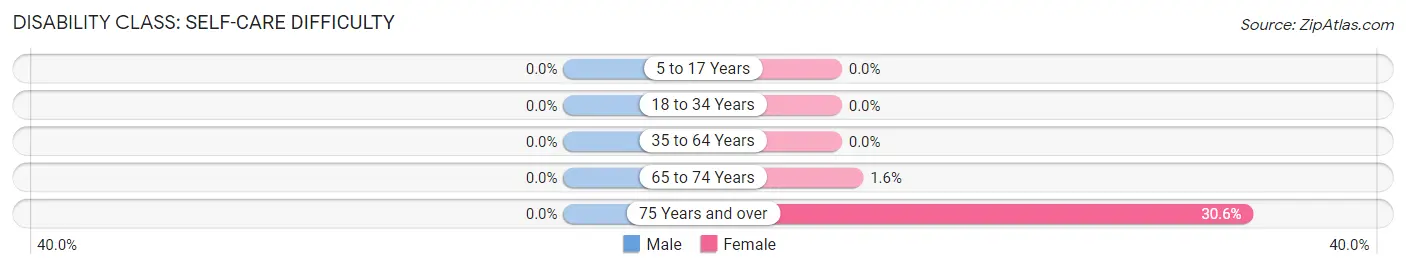
| Age Bracket | Male | Female |
| 5 to 17 Years | 0 (0.0%) | 0 (0.0%) |
| 18 to 34 Years | 0 (0.0%) | 0 (0.0%) |
| 35 to 64 Years | 0 (0.0%) | 0 (0.0%) |
| 65 to 74 Years | 0 (0.0%) | 1 (1.6%) |
| 75 Years and over | 0 (0.0%) | 11 (30.6%) |
Technology Access in Nocona Hills
Computing Device Access in Nocona Hills
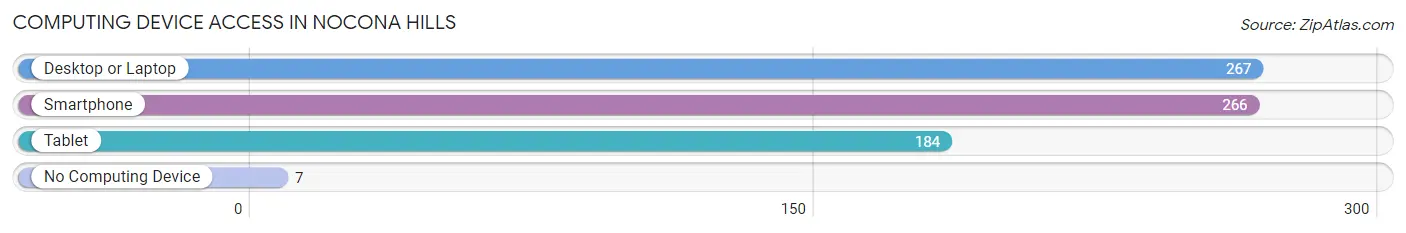
| Device Type | # Households | % Households |
| Desktop or Laptop | 267 | 90.8% |
| Smartphone | 266 | 90.5% |
| Tablet | 184 | 62.6% |
| No Computing Device | 7 | 2.4% |
| Total | 294 | 100.0% |
Internet Access in Nocona Hills
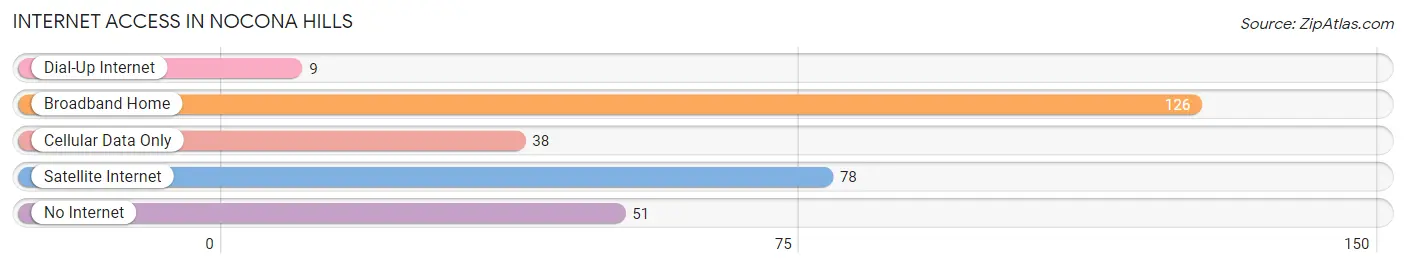
| Internet Type | # Households | % Households |
| Dial-Up Internet | 9 | 3.1% |
| Broadband Home | 126 | 42.9% |
| Cellular Data Only | 38 | 12.9% |
| Satellite Internet | 78 | 26.5% |
| No Internet | 51 | 17.3% |
| Total | 294 | 100.0% |
Nocona Hills Summary
Nocona Hills is a small unincorporated community located in Montague County, Texas. It is situated in the northwest corner of the county, approximately 20 miles northwest of Bowie, the county seat. The community is located on the edge of the Red River Valley, and is surrounded by rolling hills and prairies.
History
Nocona Hills was first settled in the late 1800s by ranchers and farmers. The community was named after the Comanche chief, Peta Nocona, who was the father of the famous Comanche warrior, Quanah Parker. The first post office was established in 1891, and the town was officially incorporated in 1895.
In the early 1900s, Nocona Hills was a thriving agricultural community. The town was home to several cotton gins, a flour mill, and a cottonseed oil mill. The town also had a bank, a hotel, a general store, and several churches.
Geography
Nocona Hills is located in the northwest corner of Montague County, Texas. It is situated on the edge of the Red River Valley, and is surrounded by rolling hills and prairies. The town is located approximately 20 miles northwest of Bowie, the county seat.
The climate in Nocona Hills is semi-arid, with hot summers and mild winters. The average annual temperature is around 68 degrees Fahrenheit, and the average annual precipitation is around 28 inches.
Economy
Nocona Hills is a small, rural community with a population of just over 500 people. The town is primarily supported by agriculture and ranching. The local economy is also supported by tourism, as the town is located near several popular recreational areas, including Lake Nocona and the Red River.
Demographics
As of the 2010 census, the population of Nocona Hills was 517 people. The racial makeup of the town was 97.3% White, 0.6% African American, 0.2% Native American, 0.2% Asian, 0.4% from other races, and 1.3% from two or more races. Hispanic or Latino of any race were 2.3% of the population.
The median household income in Nocona Hills was $37,500, and the median family income was $41,250. The per capita income was $17,845. About 11.3% of families and 14.2% of the population were below the poverty line, including 18.2% of those under age 18 and 8.3% of those age 65 or over.
Common Questions
What is Per Capita Income in Nocona Hills?
Per Capita income in Nocona Hills is $36,284.
What is the Median Family Income in Nocona Hills?
Median Family Income in Nocona Hills is $97,841.
What is the Median Household income in Nocona Hills?
Median Household Income in Nocona Hills is $76,667.
What is Inequality or Gini Index in Nocona Hills?
Inequality or Gini Index in Nocona Hills is 0.39.
What is the Total Population of Nocona Hills?
Total Population of Nocona Hills is 620.
What is the Total Male Population of Nocona Hills?
Total Male Population of Nocona Hills is 318.
What is the Total Female Population of Nocona Hills?
Total Female Population of Nocona Hills is 302.
What is the Ratio of Males per 100 Females in Nocona Hills?
There are 105.30 Males per 100 Females in Nocona Hills.
What is the Ratio of Females per 100 Males in Nocona Hills?
There are 94.97 Females per 100 Males in Nocona Hills.
What is the Median Population Age in Nocona Hills?
Median Population Age in Nocona Hills is 60.1 Years.
What is the Average Family Size in Nocona Hills
Average Family Size in Nocona Hills is 2.4 People.
What is the Average Household Size in Nocona Hills
Average Household Size in Nocona Hills is 2.1 People.
How Large is the Labor Force in Nocona Hills?
There are 282 People in the Labor Forcein in Nocona Hills.
What is the Percentage of People in the Labor Force in Nocona Hills?
47.8% of People are in the Labor Force in Nocona Hills.
What is the Unemployment Rate in Nocona Hills?
Unemployment Rate in Nocona Hills is 14.5%.