Zip Codes with the Highest Percentage of Population Employed in Installation, Maintenance & Repair in Duncanville, TX
RELATED REPORTS & OPTIONS
Installation, Maintenance & Repair
Duncanville
Compare Zip Codes
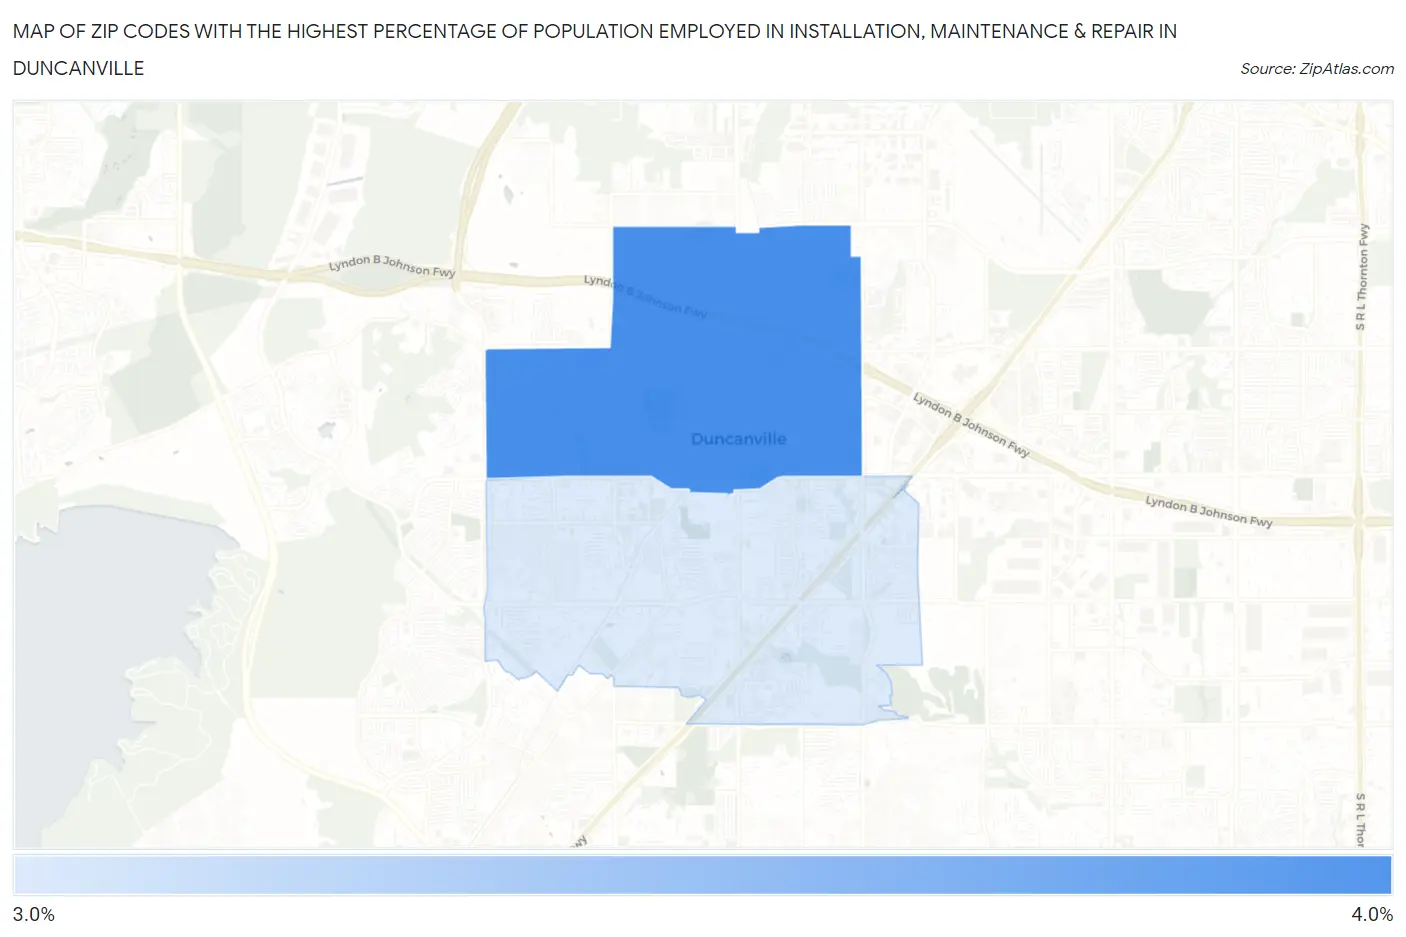
Map of Zip Codes with the Highest Percentage of Population Employed in Installation, Maintenance & Repair in Duncanville
3.5%
4.0%
Zip Codes with the Highest Percentage of Population Employed in Installation, Maintenance & Repair in Duncanville, TX
| Zip Code | % Employed | vs State | vs National | |
| 1. | 75116 | 4.0% | 3.4%(+0.561)#775 | 3.1%(+0.896)#12,528 |
| 2. | 75137 | 3.5% | 3.4%(+0.066)#903 | 3.1%(+0.402)#14,759 |
1
Common Questions
What are the Top Zip Codes with the Highest Percentage of Population Employed in Installation, Maintenance & Repair in Duncanville, TX?
Top Zip Codes with the Highest Percentage of Population Employed in Installation, Maintenance & Repair in Duncanville, TX are:
What zip code has the Highest Percentage of Population Employed in Installation, Maintenance & Repair in Duncanville, TX?
75116 has the Highest Percentage of Population Employed in Installation, Maintenance & Repair in Duncanville, TX with 4.0%.
What is the Percentage of Population Employed in Installation, Maintenance & Repair in Duncanville, TX?
Percentage of Population Employed in Installation, Maintenance & Repair in Duncanville is 3.7%.
What is the Percentage of Population Employed in Installation, Maintenance & Repair in Texas?
Percentage of Population Employed in Installation, Maintenance & Repair in Texas is 3.4%.
What is the Percentage of Population Employed in Installation, Maintenance & Repair in the United States?
Percentage of Population Employed in Installation, Maintenance & Repair in the United States is 3.1%.