Zip Codes with the Highest Percentage of Population Employed in Installation, Maintenance & Repair in San Antonio, TX
RELATED REPORTS & OPTIONS
Installation, Maintenance & Repair
San Antonio
Compare Zip Codes
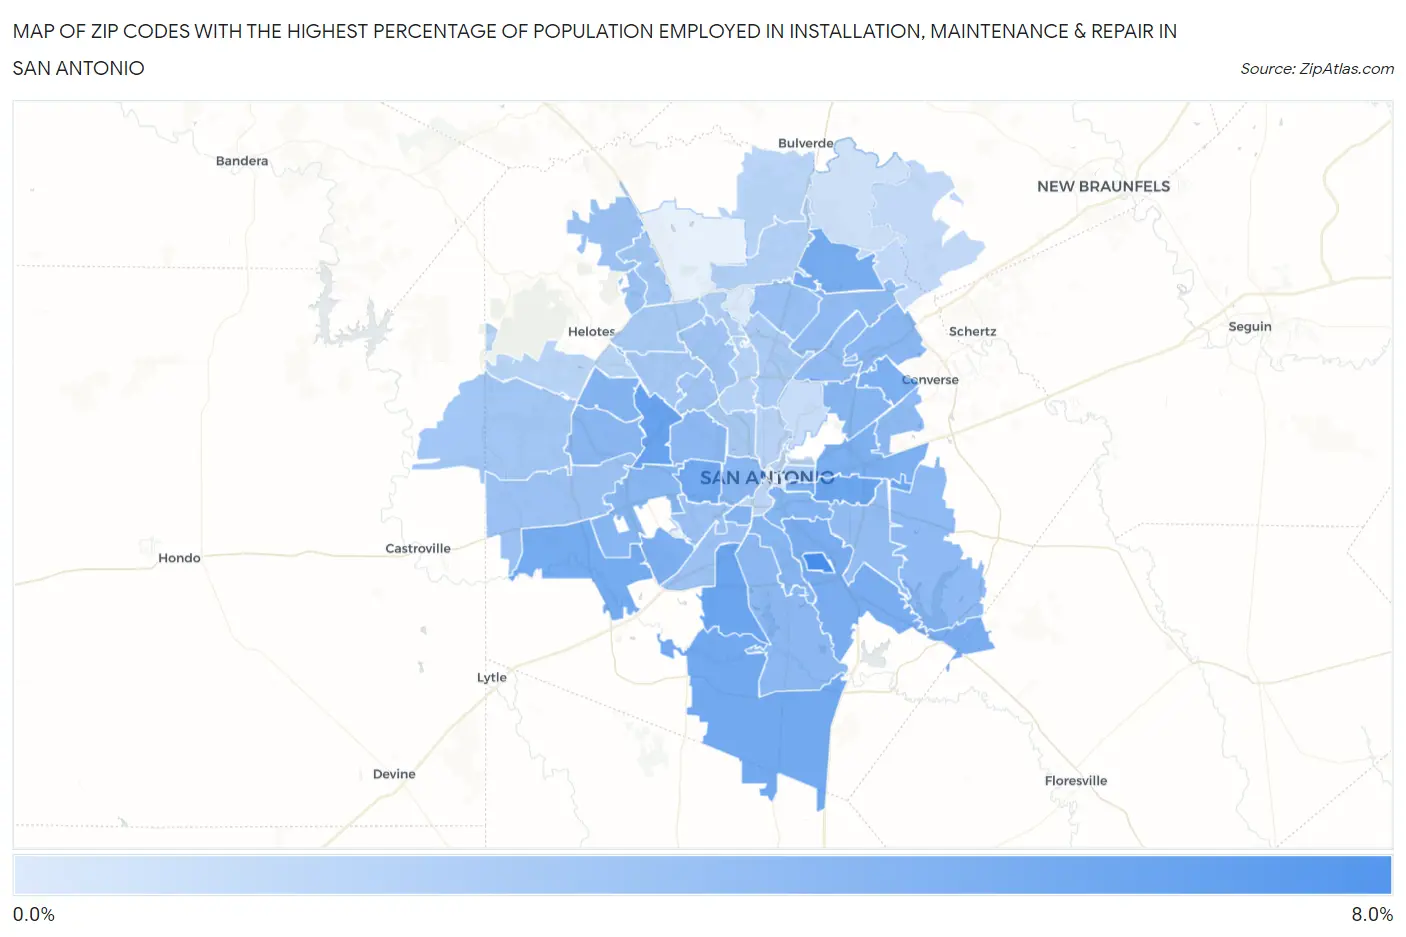
Map of Zip Codes with the Highest Percentage of Population Employed in Installation, Maintenance & Repair in San Antonio
0.11%
7.0%
Zip Codes with the Highest Percentage of Population Employed in Installation, Maintenance & Repair in San Antonio, TX
| Zip Code | % Employed | vs State | vs National | |
| 1. | 78235 | 7.0% | 3.4%(+3.59)#259 | 3.1%(+3.93)#4,439 |
| 2. | 78238 | 5.5% | 3.4%(+2.10)#431 | 3.1%(+2.43)#7,269 |
| 3. | 78224 | 5.2% | 3.4%(+1.82)#479 | 3.1%(+2.15)#8,037 |
| 4. | 78220 | 5.2% | 3.4%(+1.81)#480 | 3.1%(+2.15)#8,046 |
| 5. | 78264 | 5.0% | 3.4%(+1.56)#539 | 3.1%(+1.90)#8,840 |
| 6. | 78237 | 4.9% | 3.4%(+1.51)#551 | 3.1%(+1.85)#8,983 |
| 7. | 78252 | 4.8% | 3.4%(+1.44)#567 | 3.1%(+1.77)#9,231 |
| 8. | 78259 | 4.7% | 3.4%(+1.28)#600 | 3.1%(+1.62)#9,740 |
| 9. | 78223 | 4.6% | 3.4%(+1.24)#610 | 3.1%(+1.57)#9,890 |
| 10. | 78203 | 4.6% | 3.4%(+1.15)#630 | 3.1%(+1.49)#10,220 |
| 11. | 78219 | 4.6% | 3.4%(+1.15)#631 | 3.1%(+1.49)#10,226 |
| 12. | 78239 | 4.4% | 3.4%(+1.03)#654 | 3.1%(+1.37)#10,653 |
| 13. | 78242 | 4.4% | 3.4%(+0.980)#665 | 3.1%(+1.32)#10,836 |
| 14. | 78210 | 4.1% | 3.4%(+0.681)#737 | 3.1%(+1.02)#11,990 |
| 15. | 78225 | 4.1% | 3.4%(+0.677)#741 | 3.1%(+1.01)#12,019 |
| 16. | 78250 | 4.1% | 3.4%(+0.661)#745 | 3.1%(+0.997)#12,080 |
| 17. | 78227 | 4.0% | 3.4%(+0.568)#770 | 3.1%(+0.904)#12,487 |
| 18. | 78218 | 4.0% | 3.4%(+0.568)#771 | 3.1%(+0.903)#12,494 |
| 19. | 78214 | 4.0% | 3.4%(+0.566)#772 | 3.1%(+0.902)#12,501 |
| 20. | 78207 | 3.9% | 3.4%(+0.517)#782 | 3.1%(+0.852)#12,714 |
| 21. | 78251 | 3.9% | 3.4%(+0.516)#783 | 3.1%(+0.851)#12,716 |
| 22. | 78233 | 3.9% | 3.4%(+0.501)#787 | 3.1%(+0.836)#12,789 |
| 23. | 78221 | 3.8% | 3.4%(+0.395)#814 | 3.1%(+0.731)#13,229 |
| 24. | 78228 | 3.8% | 3.4%(+0.379)#820 | 3.1%(+0.715)#13,315 |
| 25. | 78244 | 3.7% | 3.4%(+0.281)#848 | 3.1%(+0.616)#13,761 |
| 26. | 78263 | 3.6% | 3.4%(+0.204)#876 | 3.1%(+0.539)#14,127 |
| 27. | 78247 | 3.6% | 3.4%(+0.196)#877 | 3.1%(+0.531)#14,159 |
| 28. | 78217 | 3.6% | 3.4%(+0.148)#887 | 3.1%(+0.483)#14,380 |
| 29. | 78222 | 3.5% | 3.4%(+0.065)#906 | 3.1%(+0.400)#14,769 |
| 30. | 78232 | 3.3% | 3.4%(-0.124)#977 | 3.1%(+0.211)#15,655 |
| 31. | 78226 | 3.1% | 3.4%(-0.267)#1,015 | 3.1%(+0.068)#16,348 |
| 32. | 78245 | 3.1% | 3.4%(-0.288)#1,021 | 3.1%(+0.047)#16,452 |
| 33. | 78211 | 3.1% | 3.4%(-0.329)#1,032 | 3.1%(+0.007)#16,647 |
| 34. | 78255 | 3.1% | 3.4%(-0.347)#1,041 | 3.1%(-0.011)#16,735 |
| 35. | 78229 | 2.8% | 3.4%(-0.617)#1,118 | 3.1%(-0.282)#18,080 |
| 36. | 78230 | 2.8% | 3.4%(-0.635)#1,127 | 3.1%(-0.300)#18,173 |
| 37. | 78253 | 2.8% | 3.4%(-0.653)#1,132 | 3.1%(-0.317)#18,267 |
| 38. | 78256 | 2.7% | 3.4%(-0.728)#1,146 | 3.1%(-0.392)#18,689 |
| 39. | 78240 | 2.6% | 3.4%(-0.757)#1,153 | 3.1%(-0.422)#18,834 |
| 40. | 78201 | 2.5% | 3.4%(-0.899)#1,194 | 3.1%(-0.563)#19,530 |
| 41. | 78202 | 2.5% | 3.4%(-0.901)#1,197 | 3.1%(-0.565)#19,541 |
| 42. | 78249 | 2.5% | 3.4%(-0.939)#1,210 | 3.1%(-0.604)#19,721 |
| 43. | 78216 | 2.4% | 3.4%(-0.993)#1,226 | 3.1%(-0.658)#20,018 |
| 44. | 78258 | 1.9% | 3.4%(-1.47)#1,365 | 3.1%(-1.13)#22,321 |
| 45. | 78231 | 1.9% | 3.4%(-1.47)#1,366 | 3.1%(-1.14)#22,328 |
| 46. | 78213 | 1.9% | 3.4%(-1.49)#1,370 | 3.1%(-1.15)#22,415 |
| 47. | 78208 | 1.7% | 3.4%(-1.67)#1,405 | 3.1%(-1.33)#23,186 |
| 48. | 78212 | 1.7% | 3.4%(-1.68)#1,406 | 3.1%(-1.34)#23,229 |
| 49. | 78254 | 1.7% | 3.4%(-1.72)#1,416 | 3.1%(-1.39)#23,440 |
| 50. | 78260 | 1.6% | 3.4%(-1.78)#1,428 | 3.1%(-1.45)#23,679 |
| 51. | 78215 | 1.6% | 3.4%(-1.83)#1,441 | 3.1%(-1.50)#23,886 |
| 52. | 78204 | 1.5% | 3.4%(-1.86)#1,449 | 3.1%(-1.52)#23,991 |
| 53. | 78266 | 1.3% | 3.4%(-2.07)#1,482 | 3.1%(-1.73)#24,784 |
| 54. | 78209 | 1.0% | 3.4%(-2.36)#1,526 | 3.1%(-2.03)#25,805 |
| 55. | 78261 | 0.72% | 3.4%(-2.68)#1,574 | 3.1%(-2.35)#26,725 |
| 56. | 78248 | 0.11% | 3.4%(-3.29)#1,625 | 3.1%(-2.96)#27,762 |
1
Common Questions
What are the Top 10 Zip Codes with the Highest Percentage of Population Employed in Installation, Maintenance & Repair in San Antonio, TX?
Top 10 Zip Codes with the Highest Percentage of Population Employed in Installation, Maintenance & Repair in San Antonio, TX are:
What zip code has the Highest Percentage of Population Employed in Installation, Maintenance & Repair in San Antonio, TX?
78235 has the Highest Percentage of Population Employed in Installation, Maintenance & Repair in San Antonio, TX with 7.0%.
What is the Percentage of Population Employed in Installation, Maintenance & Repair in San Antonio, TX?
Percentage of Population Employed in Installation, Maintenance & Repair in San Antonio is 3.2%.
What is the Percentage of Population Employed in Installation, Maintenance & Repair in Texas?
Percentage of Population Employed in Installation, Maintenance & Repair in Texas is 3.4%.
What is the Percentage of Population Employed in Installation, Maintenance & Repair in the United States?
Percentage of Population Employed in Installation, Maintenance & Repair in the United States is 3.1%.