Zip Codes with the Highest Percentage of Population Employed in Installation, Maintenance & Repair in Terrell, TX
RELATED REPORTS & OPTIONS
Installation, Maintenance & Repair
Terrell
Compare Zip Codes
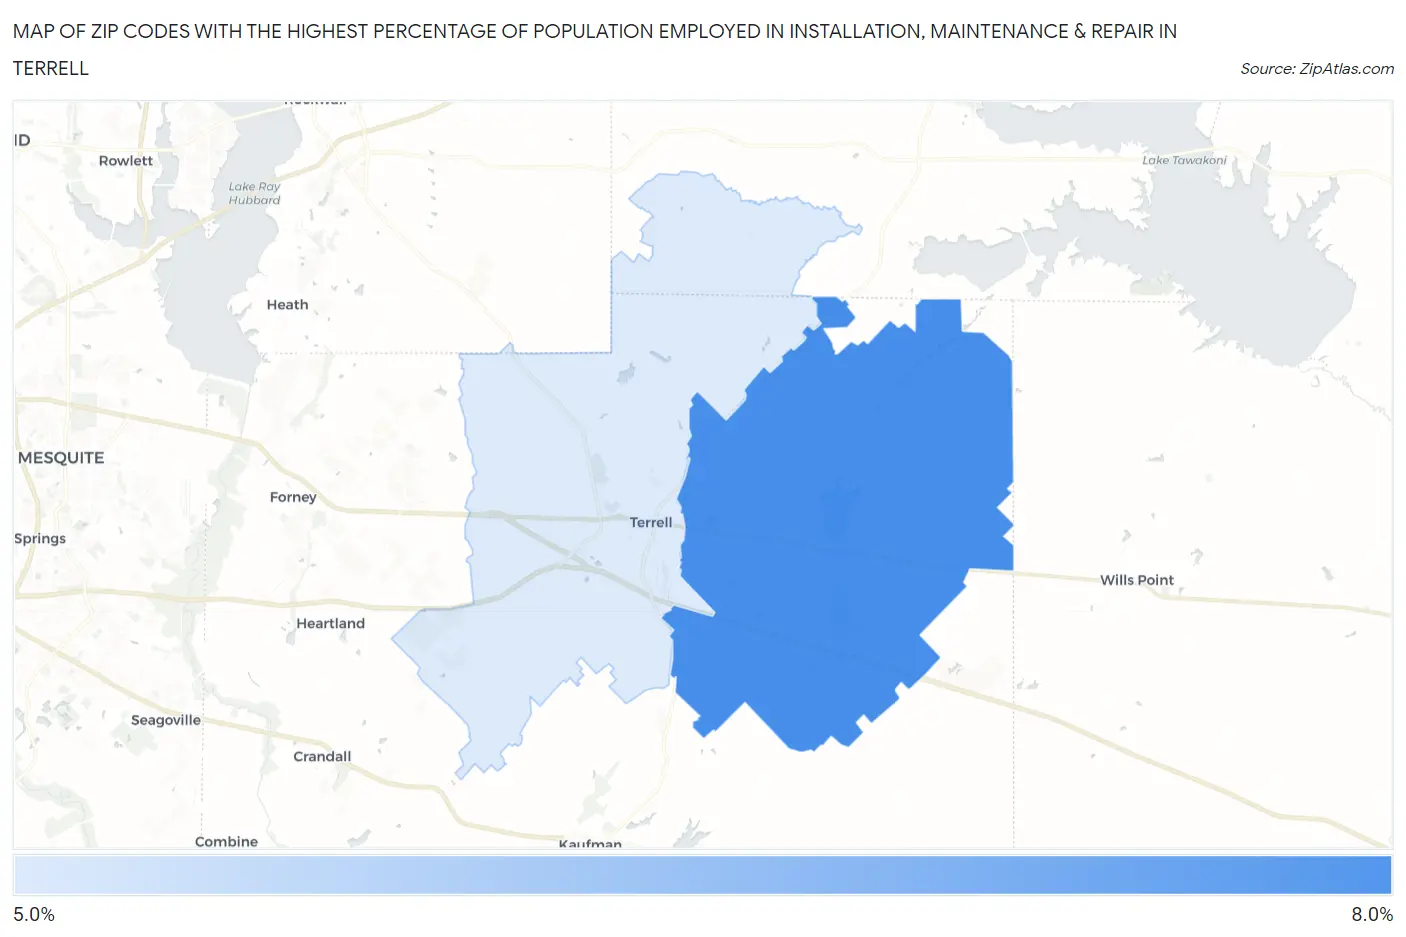
Map of Zip Codes with the Highest Percentage of Population Employed in Installation, Maintenance & Repair in Terrell
5.5%
7.4%
Zip Codes with the Highest Percentage of Population Employed in Installation, Maintenance & Repair in Terrell, TX
| Zip Code | % Employed | vs State | vs National | |
| 1. | 75161 | 7.4% | 3.4%(+4.01)#232 | 3.1%(+4.34)#3,924 |
| 2. | 75160 | 5.5% | 3.4%(+2.09)#435 | 3.1%(+2.42)#7,297 |
1
Common Questions
What are the Top Zip Codes with the Highest Percentage of Population Employed in Installation, Maintenance & Repair in Terrell, TX?
Top Zip Codes with the Highest Percentage of Population Employed in Installation, Maintenance & Repair in Terrell, TX are:
What zip code has the Highest Percentage of Population Employed in Installation, Maintenance & Repair in Terrell, TX?
75161 has the Highest Percentage of Population Employed in Installation, Maintenance & Repair in Terrell, TX with 7.4%.
What is the Percentage of Population Employed in Installation, Maintenance & Repair in Terrell, TX?
Percentage of Population Employed in Installation, Maintenance & Repair in Terrell is 6.2%.
What is the Percentage of Population Employed in Installation, Maintenance & Repair in Texas?
Percentage of Population Employed in Installation, Maintenance & Repair in Texas is 3.4%.
What is the Percentage of Population Employed in Installation, Maintenance & Repair in the United States?
Percentage of Population Employed in Installation, Maintenance & Repair in the United States is 3.1%.