Palacios, TX Map & Demographics
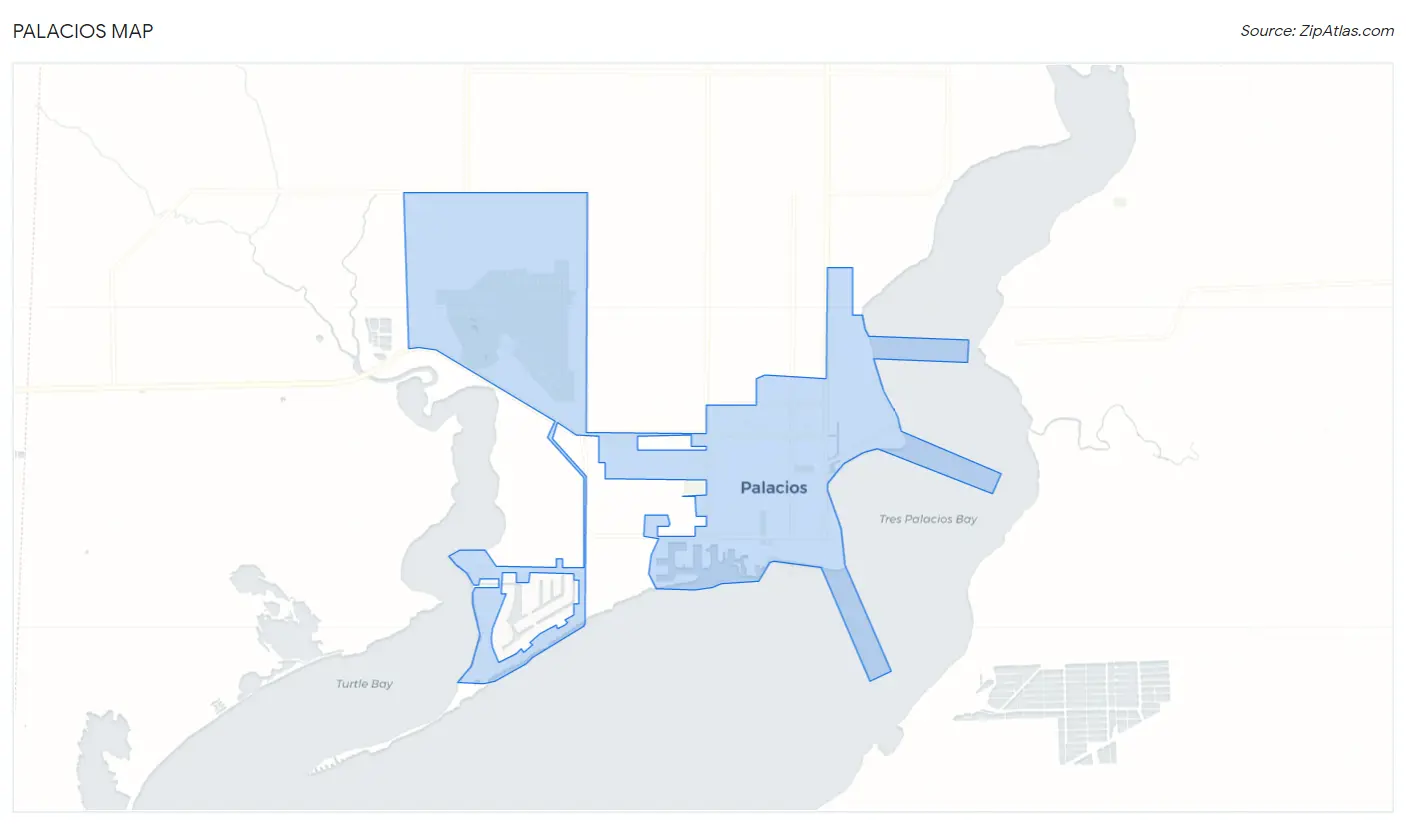
Palacios Map
Palacios Overview
$26,731
PER CAPITA INCOME
$67,093
AVG FAMILY INCOME
$59,469
AVG HOUSEHOLD INCOME
42.6%
WAGE / INCOME GAP [ % ]
57.4¢/ $1
WAGE / INCOME GAP [ $ ]
0.37
INEQUALITY / GINI INDEX
4,411
TOTAL POPULATION
2,770
MALE POPULATION
1,641
FEMALE POPULATION
168.80
MALES / 100 FEMALES
59.24
FEMALES / 100 MALES
40.5
MEDIAN AGE
3.6
AVG FAMILY SIZE
2.9
AVG HOUSEHOLD SIZE
2,116
LABOR FORCE [ PEOPLE ]
61.1%
PERCENT IN LABOR FORCE
Palacios Zip Codes
Palacios Area Codes
Income in Palacios
Income Overview in Palacios
Per Capita Income in Palacios is $26,731, while median incomes of families and households are $67,093 and $59,469 respectively.
| Characteristic | Number | Measure |
| Per Capita Income | 4,411 | $26,731 |
| Median Family Income | 1,032 | $67,093 |
| Mean Family Income | 1,032 | $75,084 |
| Median Household Income | 1,537 | $59,469 |
| Mean Household Income | 1,537 | $69,041 |
| Income Deficit | 1,032 | $0 |
| Wage / Income Gap (%) | 4,411 | 42.55% |
| Wage / Income Gap ($) | 4,411 | 57.45¢ per $1 |
| Gini / Inequality Index | 4,411 | 0.37 |
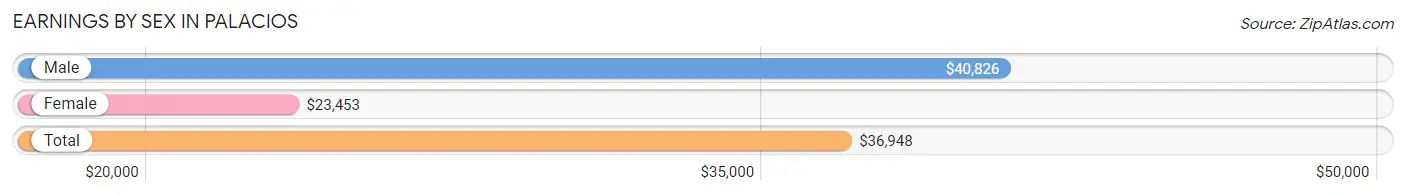
Earnings by Sex in Palacios
Average Earnings in Palacios are $36,948, $40,826 for men and $23,453 for women, a difference of 42.5%.
| Sex | Number | Average Earnings |
| Male | 1,482 (68.1%) | $40,826 |
| Female | 693 (31.9%) | $23,453 |
| Total | 2,175 (100.0%) | $36,948 |
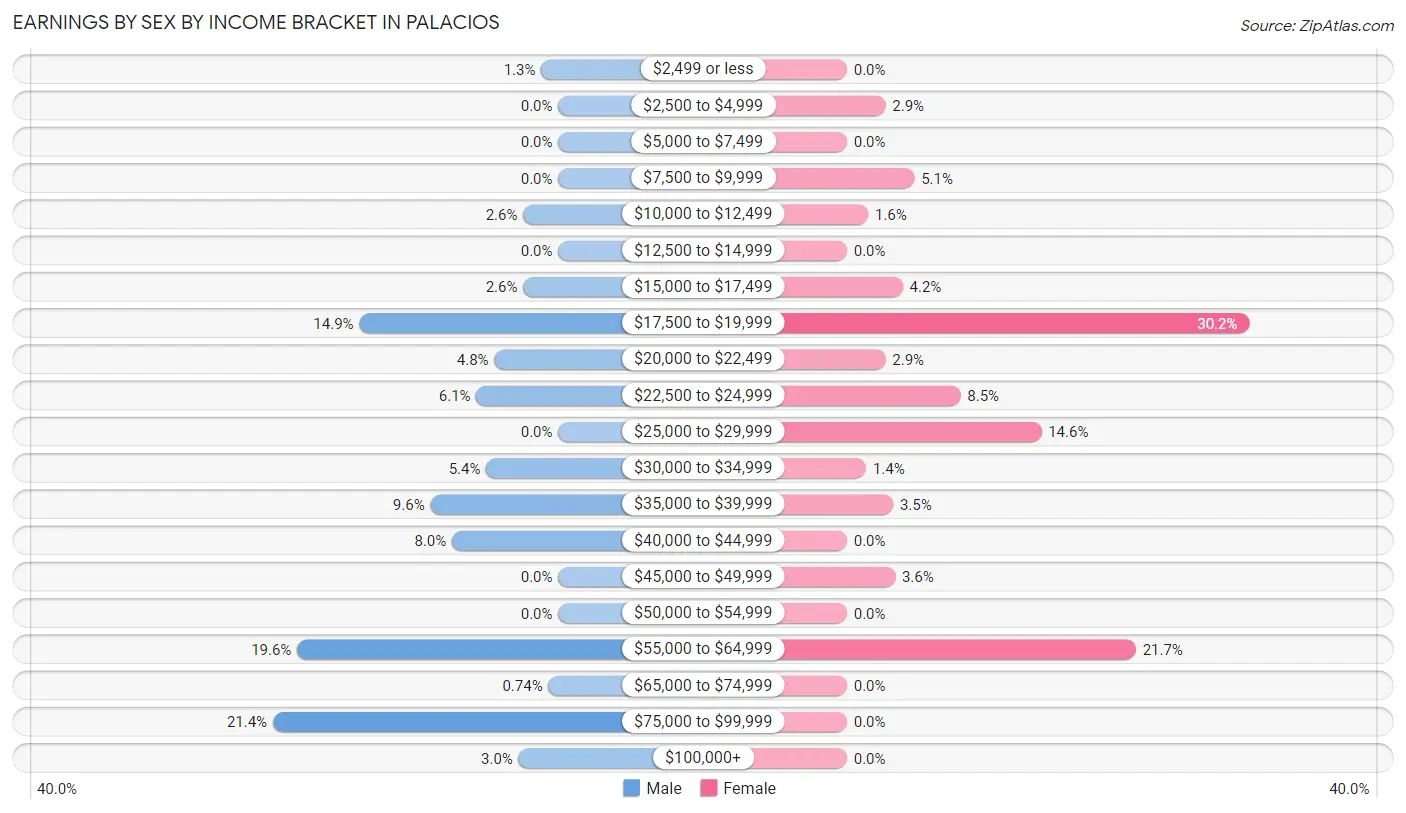
Earnings by Sex by Income Bracket in Palacios
The most common earnings brackets in Palacios are $75,000 to $99,999 for men (317 | 21.4%) and $17,500 to $19,999 for women (209 | 30.2%).
| Income | Male | Female |
| $2,499 or less | 19 (1.3%) | 0 (0.0%) |
| $2,500 to $4,999 | 0 (0.0%) | 20 (2.9%) |
| $5,000 to $7,499 | 0 (0.0%) | 0 (0.0%) |
| $7,500 to $9,999 | 0 (0.0%) | 35 (5.1%) |
| $10,000 to $12,499 | 39 (2.6%) | 11 (1.6%) |
| $12,500 to $14,999 | 0 (0.0%) | 0 (0.0%) |
| $15,000 to $17,499 | 39 (2.6%) | 29 (4.2%) |
| $17,500 to $19,999 | 221 (14.9%) | 209 (30.2%) |
| $20,000 to $22,499 | 71 (4.8%) | 20 (2.9%) |
| $22,500 to $24,999 | 91 (6.1%) | 59 (8.5%) |
| $25,000 to $29,999 | 0 (0.0%) | 101 (14.6%) |
| $30,000 to $34,999 | 80 (5.4%) | 10 (1.4%) |
| $35,000 to $39,999 | 142 (9.6%) | 24 (3.5%) |
| $40,000 to $44,999 | 118 (8.0%) | 0 (0.0%) |
| $45,000 to $49,999 | 0 (0.0%) | 25 (3.6%) |
| $50,000 to $54,999 | 0 (0.0%) | 0 (0.0%) |
| $55,000 to $64,999 | 290 (19.6%) | 150 (21.6%) |
| $65,000 to $74,999 | 11 (0.7%) | 0 (0.0%) |
| $75,000 to $99,999 | 317 (21.4%) | 0 (0.0%) |
| $100,000+ | 44 (3.0%) | 0 (0.0%) |
| Total | 1,482 (100.0%) | 693 (100.0%) |
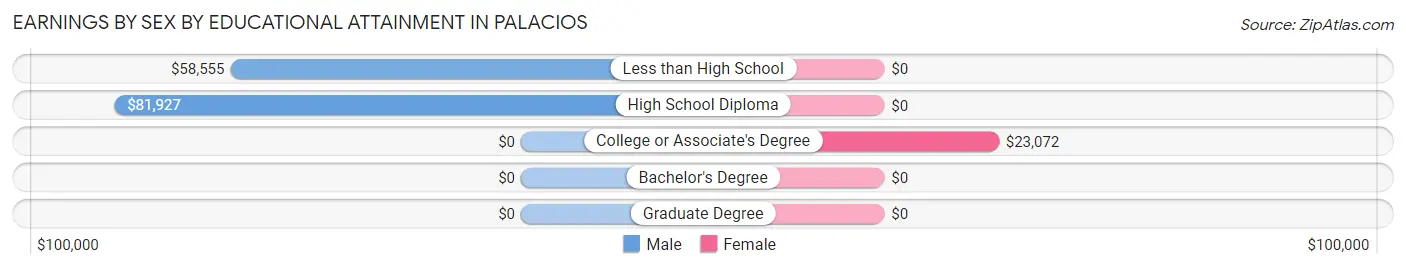
Earnings by Sex by Educational Attainment in Palacios
Average earnings in Palacios are $39,508 for men and $23,877 for women, a difference of 39.6%. Men with an educational attainment of high school diploma enjoy the highest average annual earnings of $81,927, while those with less than high school education earn the least with $58,555. Women with an educational attainment of college or associate's degree earn the most with the average annual earnings of $23,072, while those with college or associate's degree education have the smallest earnings of $23,072.
| Educational Attainment | Male Income | Female Income |
| Less than High School | $58,555 | $0 |
| High School Diploma | $81,927 | $0 |
| College or Associate's Degree | - | - |
| Bachelor's Degree | - | - |
| Graduate Degree | - | - |
| Total | $39,508 | $23,877 |
Family Income in Palacios
Family Income Brackets in Palacios
According to the Palacios family income data, there are 264 families falling into the $100,000 to $149,999 income range, which is the most common income bracket and makes up 25.6% of all families.
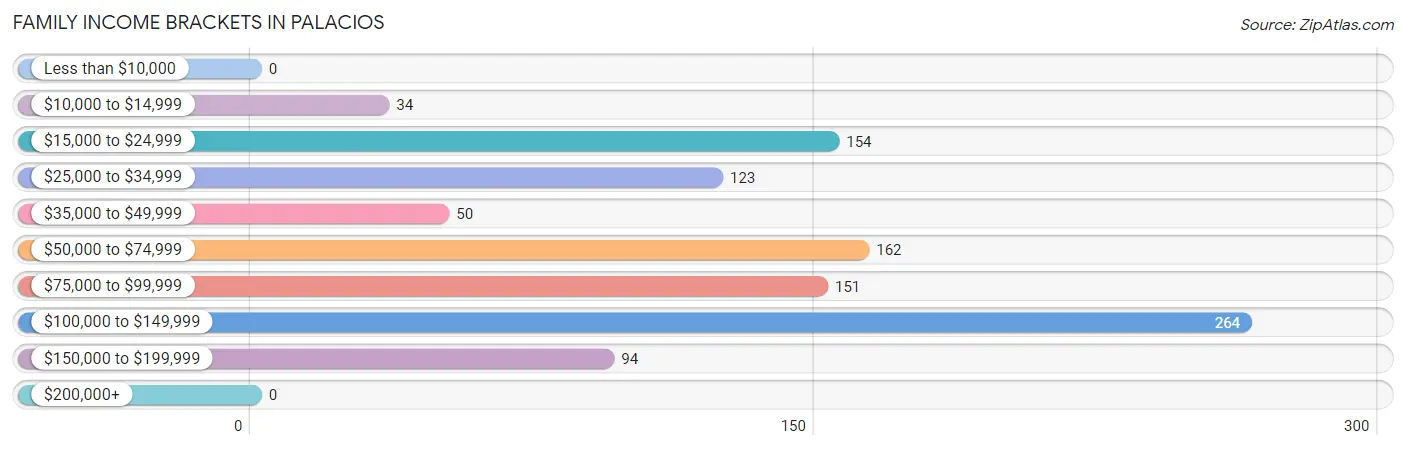
| Income Bracket | # Families | % Families |
| Less than $10,000 | 0 | 0.0% |
| $10,000 to $14,999 | 34 | 3.3% |
| $15,000 to $24,999 | 154 | 14.9% |
| $25,000 to $34,999 | 123 | 11.9% |
| $35,000 to $49,999 | 50 | 4.8% |
| $50,000 to $74,999 | 162 | 15.7% |
| $75,000 to $99,999 | 151 | 14.6% |
| $100,000 to $149,999 | 264 | 25.6% |
| $150,000 to $199,999 | 94 | 9.1% |
| $200,000+ | 0 | 0.0% |
Family Income by Famaliy Size in Palacios
2-person families (580 | 56.2%) account for the highest median family income in Palacios with $66,860 per family, while 2-person families (580 | 56.2%) have the highest median income of $33,430 per family member.
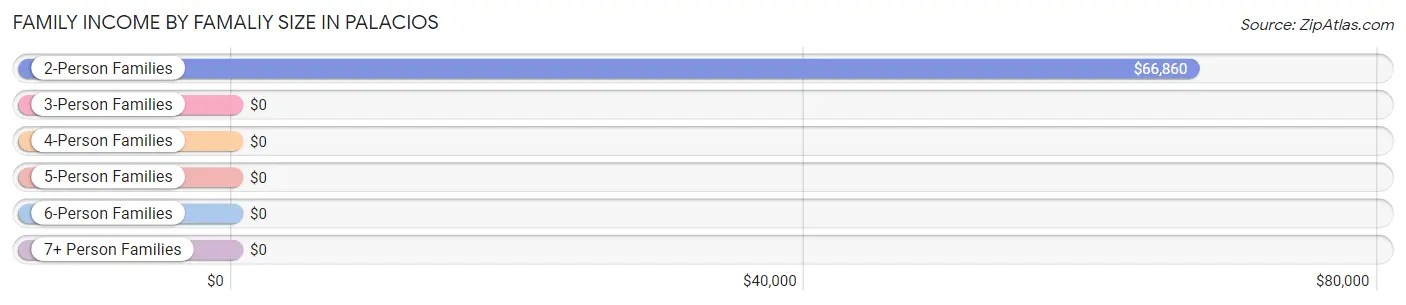
| Income Bracket | # Families | Median Income |
| 2-Person Families | 580 (56.2%) | $66,860 |
| 3-Person Families | 135 (13.1%) | $0 |
| 4-Person Families | 45 (4.4%) | $0 |
| 5-Person Families | 272 (26.4%) | $0 |
| 6-Person Families | 0 (0.0%) | $0 |
| 7+ Person Families | 0 (0.0%) | $0 |
| Total | 1,032 (100.0%) | $67,093 |
Family Income by Number of Earners in Palacios
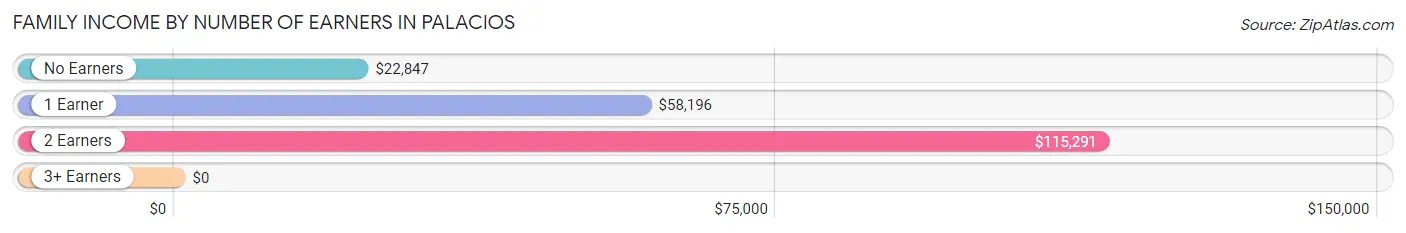
| Number of Earners | # Families | Median Income |
| No Earners | 73 (7.1%) | $22,847 |
| 1 Earner | 568 (55.0%) | $58,196 |
| 2 Earners | 332 (32.2%) | $115,291 |
| 3+ Earners | 59 (5.7%) | $0 |
| Total | 1,032 (100.0%) | $67,093 |
Household Income in Palacios
Household Income Brackets in Palacios
With 286 households falling in the category, the $50,000 to $74,999 income range is the most frequent in Palacios, accounting for 18.6% of all households. In contrast, only 28 households (1.8%) fall into the $200,000+ income bracket, making it the least populous group.
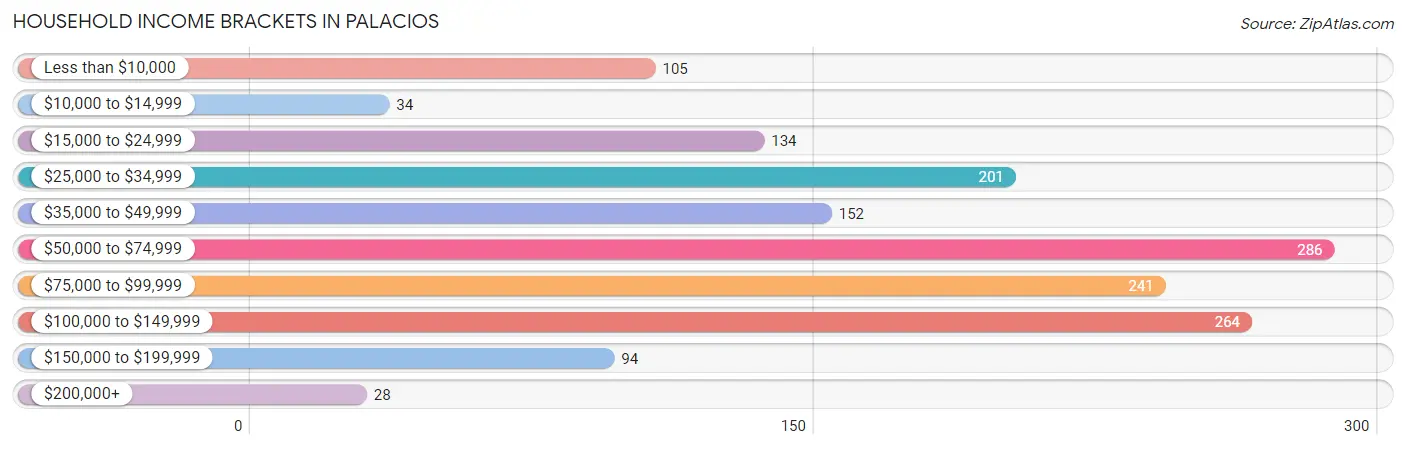
| Income Bracket | # Households | % Households |
| Less than $10,000 | 105 | 6.8% |
| $10,000 to $14,999 | 34 | 2.2% |
| $15,000 to $24,999 | 134 | 8.7% |
| $25,000 to $34,999 | 201 | 13.1% |
| $35,000 to $49,999 | 152 | 9.9% |
| $50,000 to $74,999 | 286 | 18.6% |
| $75,000 to $99,999 | 241 | 15.7% |
| $100,000 to $149,999 | 264 | 17.2% |
| $150,000 to $199,999 | 94 | 6.1% |
| $200,000+ | 28 | 1.8% |
Household Income by Householder Age in Palacios
The median household income in Palacios is $59,469, with the highest median household income of $90,211 found in the 45 to 64 years age bracket for the primary householder. A total of 333 households (21.7%) fall into this category.
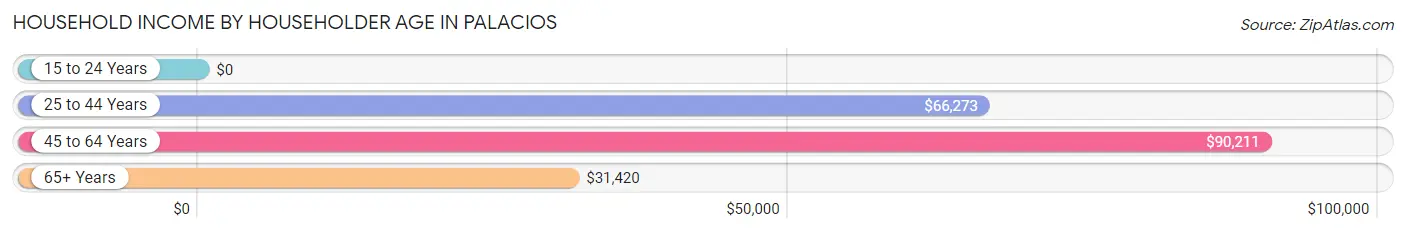
| Income Bracket | # Households | Median Income |
| 15 to 24 Years | 0 (0.0%) | $0 |
| 25 to 44 Years | 655 (42.6%) | $66,273 |
| 45 to 64 Years | 333 (21.7%) | $90,211 |
| 65+ Years | 549 (35.7%) | $31,420 |
| Total | 1,537 (100.0%) | $59,469 |
Poverty in Palacios
Income Below Poverty by Sex and Age in Palacios
With 14.3% poverty level for males and 16.8% for females among the residents of Palacios, 6 to 11 year old males and 6 to 11 year old females are the most vulnerable to poverty, with 148 males (46.0%) and 76 females (100.0%) in their respective age groups living below the poverty level.
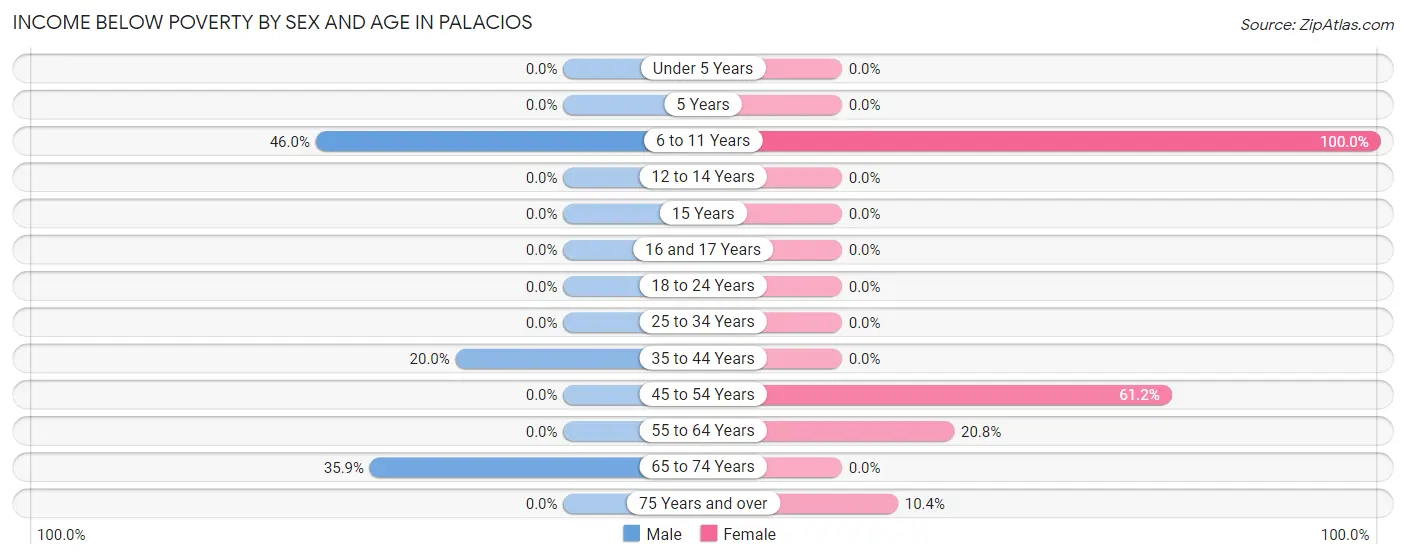
| Age Bracket | Male | Female |
| Under 5 Years | 0 (0.0%) | 0 (0.0%) |
| 5 Years | 0 (0.0%) | 0 (0.0%) |
| 6 to 11 Years | 148 (46.0%) | 76 (100.0%) |
| 12 to 14 Years | 0 (0.0%) | 0 (0.0%) |
| 15 Years | 0 (0.0%) | 0 (0.0%) |
| 16 and 17 Years | 0 (0.0%) | 0 (0.0%) |
| 18 to 24 Years | 0 (0.0%) | 0 (0.0%) |
| 25 to 34 Years | 0 (0.0%) | 0 (0.0%) |
| 35 to 44 Years | 126 (20.0%) | 0 (0.0%) |
| 45 to 54 Years | 0 (0.0%) | 82 (61.2%) |
| 55 to 64 Years | 0 (0.0%) | 100 (20.8%) |
| 65 to 74 Years | 121 (35.9%) | 0 (0.0%) |
| 75 Years and over | 0 (0.0%) | 18 (10.4%) |
| Total | 395 (14.3%) | 276 (16.8%) |
Income Above Poverty by Sex and Age in Palacios
According to the poverty statistics in Palacios, males aged under 5 years and females aged 12 to 14 years are the age groups that are most secure financially, with 100.0% of males and 100.0% of females in these age groups living above the poverty line.
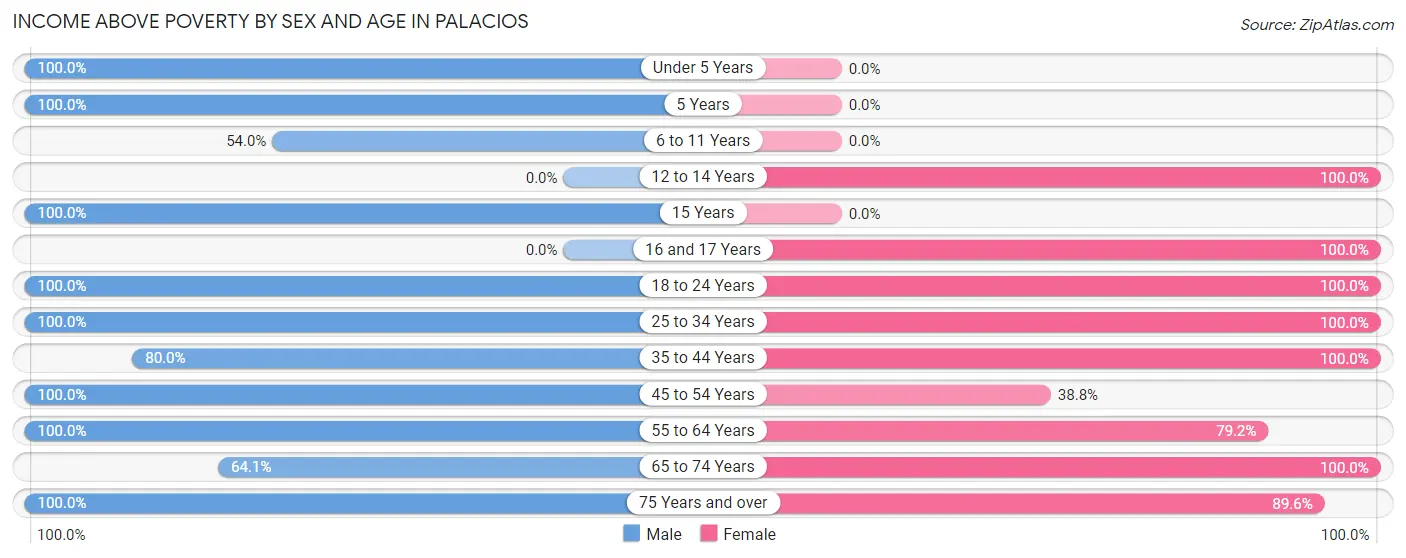
| Age Bracket | Male | Female |
| Under 5 Years | 262 (100.0%) | 0 (0.0%) |
| 5 Years | 113 (100.0%) | 0 (0.0%) |
| 6 to 11 Years | 174 (54.0%) | 0 (0.0%) |
| 12 to 14 Years | 0 (0.0%) | 86 (100.0%) |
| 15 Years | 89 (100.0%) | 0 (0.0%) |
| 16 and 17 Years | 0 (0.0%) | 59 (100.0%) |
| 18 to 24 Years | 226 (100.0%) | 52 (100.0%) |
| 25 to 34 Years | 281 (100.0%) | 263 (100.0%) |
| 35 to 44 Years | 504 (80.0%) | 152 (100.0%) |
| 45 to 54 Years | 269 (100.0%) | 52 (38.8%) |
| 55 to 64 Years | 186 (100.0%) | 380 (79.2%) |
| 65 to 74 Years | 216 (64.1%) | 166 (100.0%) |
| 75 Years and over | 47 (100.0%) | 155 (89.6%) |
| Total | 2,367 (85.7%) | 1,365 (83.2%) |
Income Below Poverty Among Married-Couple Families in Palacios
The poverty statistics for married-couple families in Palacios show that 5.4% or 34 of the total 632 families live below the poverty line. Families with no children have the highest poverty rate of 8.9%, comprising of 34 families. On the other hand, families with 1 or 2 children have the lowest poverty rate of 0.0%, which includes 0 families.
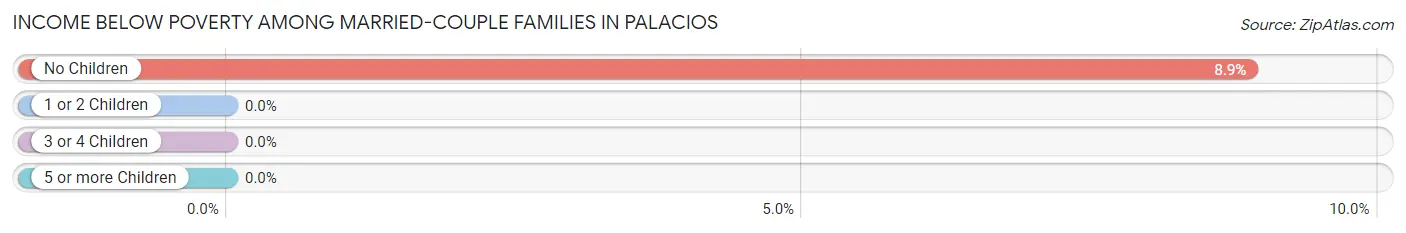
| Children | Above Poverty | Below Poverty |
| No Children | 349 (91.1%) | 34 (8.9%) |
| 1 or 2 Children | 167 (100.0%) | 0 (0.0%) |
| 3 or 4 Children | 82 (100.0%) | 0 (0.0%) |
| 5 or more Children | 0 (0.0%) | 0 (0.0%) |
| Total | 598 (94.6%) | 34 (5.4%) |
Income Below Poverty Among Single-Parent Households in Palacios
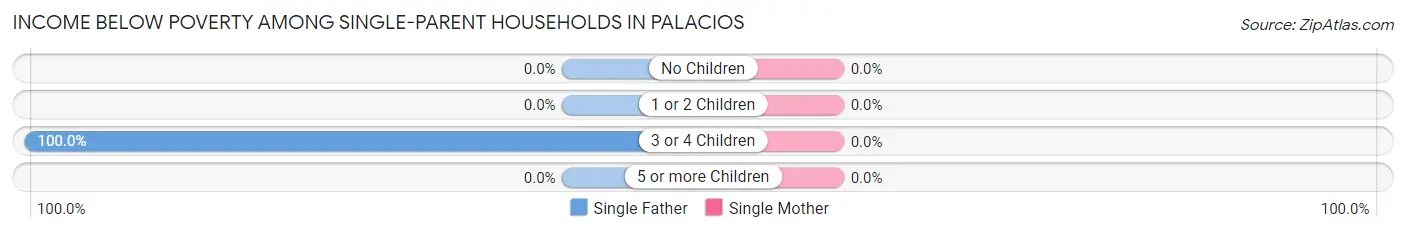
| Children | Single Father | Single Mother |
| No Children | 0 (0.0%) | 0 (0.0%) |
| 1 or 2 Children | 0 (0.0%) | 0 (0.0%) |
| 3 or 4 Children | 79 (100.0%) | 0 (0.0%) |
| 5 or more Children | 0 (0.0%) | 0 (0.0%) |
| Total | 79 (33.6%) | 0 (0.0%) |
Income Below Poverty Among Married-Couple vs Single-Parent Households in Palacios
The poverty data for Palacios shows that 34 of the married-couple family households (5.4%) and 79 of the single-parent households (19.8%) are living below the poverty level. Within the married-couple family households, those with no children have the highest poverty rate, with 34 households (8.9%) falling below the poverty line. Among the single-parent households, those with 3 or 4 children have the highest poverty rate, with 79 household (100.0%) living below poverty.
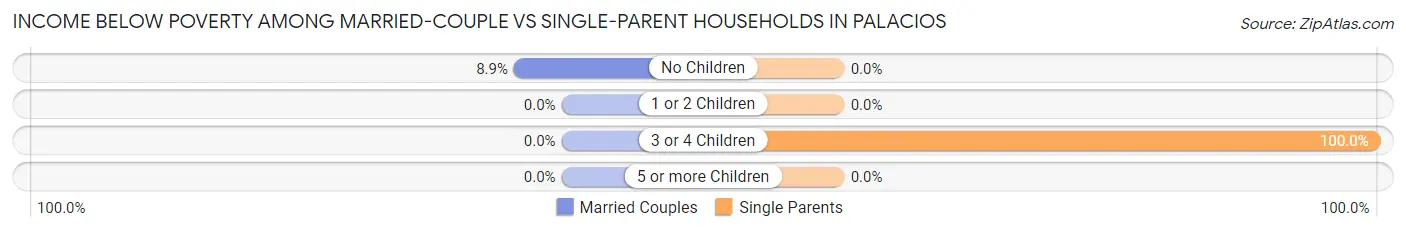
| Children | Married-Couple Families | Single-Parent Households |
| No Children | 34 (8.9%) | 0 (0.0%) |
| 1 or 2 Children | 0 (0.0%) | 0 (0.0%) |
| 3 or 4 Children | 0 (0.0%) | 79 (100.0%) |
| 5 or more Children | 0 (0.0%) | 0 (0.0%) |
| Total | 34 (5.4%) | 79 (19.8%) |
Race in Palacios
The most populous races in Palacios are Hispanic or Latino (3,094 | 70.1%), White / Caucasian (2,601 | 59.0%), and Two or more Races (1,267 | 28.7%).
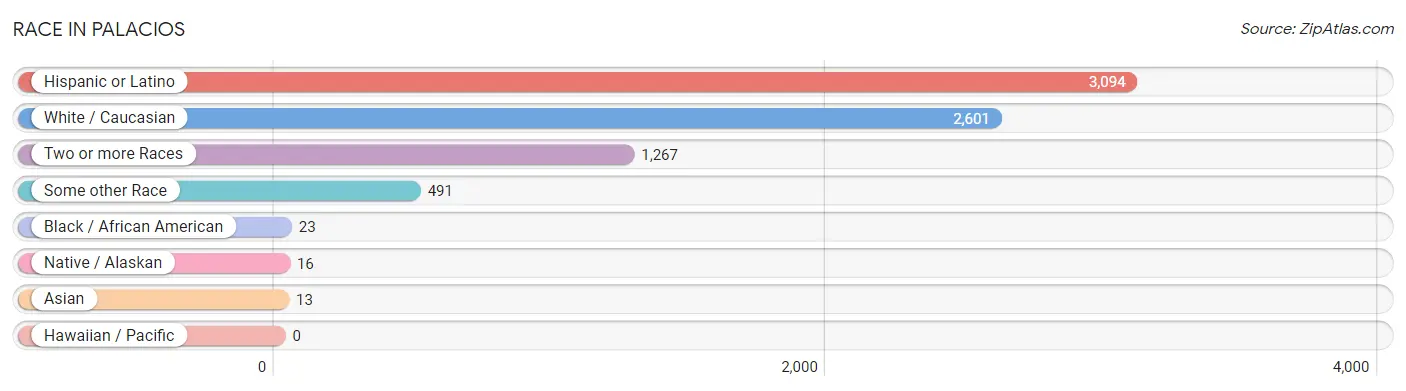
| Race | # Population | % Population |
| Asian | 13 | 0.3% |
| Black / African American | 23 | 0.5% |
| Hawaiian / Pacific | 0 | 0.0% |
| Hispanic or Latino | 3,094 | 70.1% |
| Native / Alaskan | 16 | 0.4% |
| White / Caucasian | 2,601 | 59.0% |
| Two or more Races | 1,267 | 28.7% |
| Some other Race | 491 | 11.1% |
| Total | 4,411 | 100.0% |
Ancestry in Palacios
The most populous ancestries reported in Palacios are Mexican (3,022 | 68.5%), American (232 | 5.3%), English (91 | 2.1%), Spaniard (71 | 1.6%), and European (70 | 1.6%), together accounting for 79.0% of all Palacios residents.
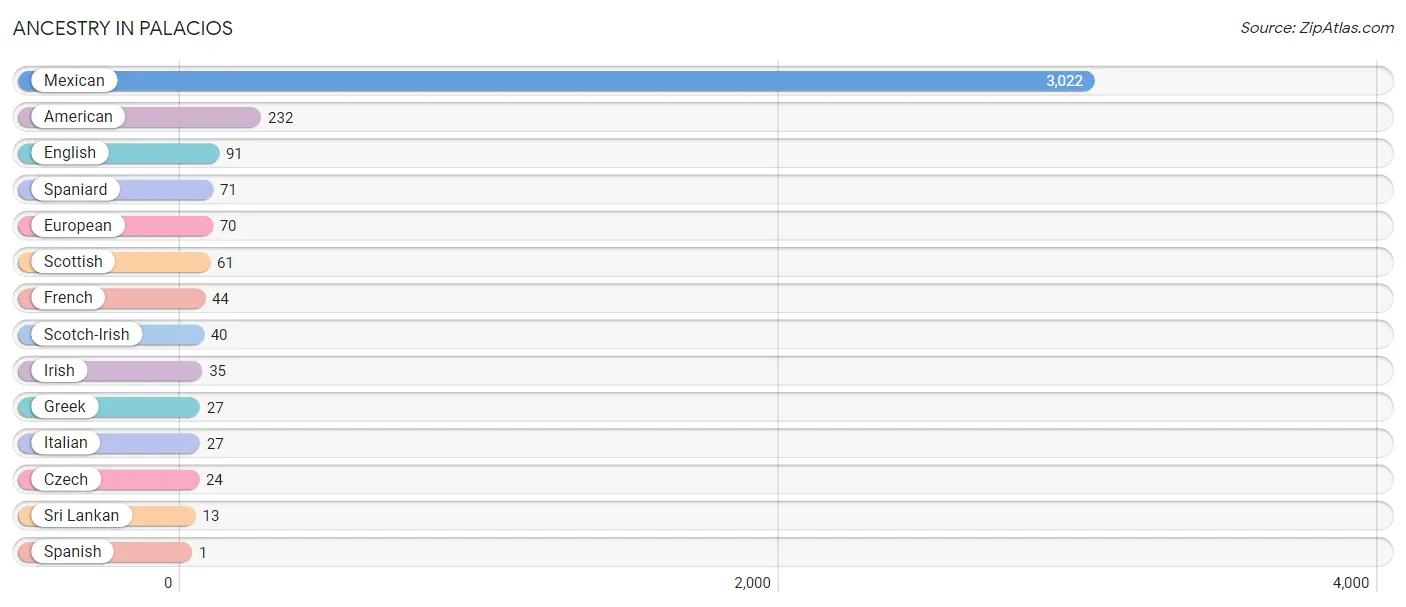
| Ancestry | # Population | % Population |
| American | 232 | 5.3% |
| Czech | 24 | 0.5% |
| English | 91 | 2.1% |
| European | 70 | 1.6% |
| French | 44 | 1.0% |
| Greek | 27 | 0.6% |
| Irish | 35 | 0.8% |
| Italian | 27 | 0.6% |
| Mexican | 3,022 | 68.5% |
| Scotch-Irish | 40 | 0.9% |
| Scottish | 61 | 1.4% |
| Spaniard | 71 | 1.6% |
| Spanish | 1 | 0.0% |
| Sri Lankan | 13 | 0.3% | View All 14 Rows |
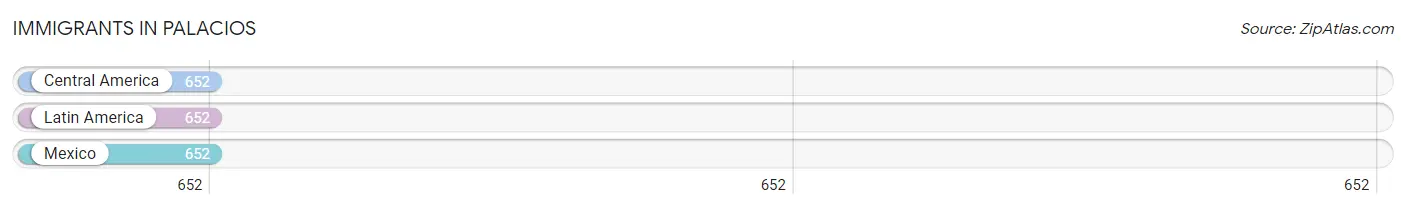
Immigrants in Palacios
The most numerous immigrant groups reported in Palacios came from Central America (652 | 14.8%), Latin America (652 | 14.8%), and Mexico (652 | 14.8%), together accounting for 44.3% of all Palacios residents.
| Immigration Origin | # Population | % Population |
| Central America | 652 | 14.8% |
| Latin America | 652 | 14.8% |
| Mexico | 652 | 14.8% | View All 3 Rows |
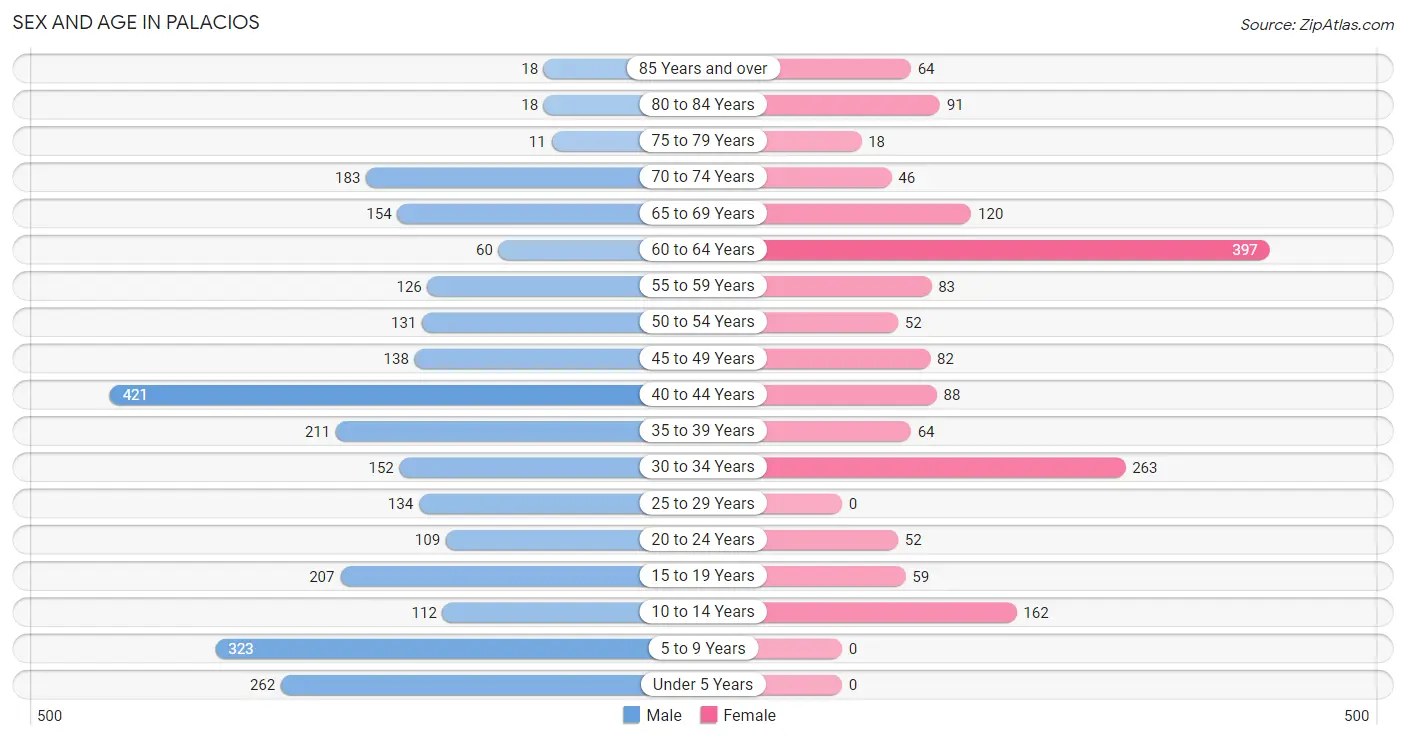
Sex and Age in Palacios
Sex and Age in Palacios
The most populous age groups in Palacios are 40 to 44 Years (421 | 15.2%) for men and 60 to 64 Years (397 | 24.2%) for women.
| Age Bracket | Male | Female |
| Under 5 Years | 262 (9.5%) | 0 (0.0%) |
| 5 to 9 Years | 323 (11.7%) | 0 (0.0%) |
| 10 to 14 Years | 112 (4.0%) | 162 (9.9%) |
| 15 to 19 Years | 207 (7.5%) | 59 (3.6%) |
| 20 to 24 Years | 109 (3.9%) | 52 (3.2%) |
| 25 to 29 Years | 134 (4.8%) | 0 (0.0%) |
| 30 to 34 Years | 152 (5.5%) | 263 (16.0%) |
| 35 to 39 Years | 211 (7.6%) | 64 (3.9%) |
| 40 to 44 Years | 421 (15.2%) | 88 (5.4%) |
| 45 to 49 Years | 138 (5.0%) | 82 (5.0%) |
| 50 to 54 Years | 131 (4.7%) | 52 (3.2%) |
| 55 to 59 Years | 126 (4.5%) | 83 (5.1%) |
| 60 to 64 Years | 60 (2.2%) | 397 (24.2%) |
| 65 to 69 Years | 154 (5.6%) | 120 (7.3%) |
| 70 to 74 Years | 183 (6.6%) | 46 (2.8%) |
| 75 to 79 Years | 11 (0.4%) | 18 (1.1%) |
| 80 to 84 Years | 18 (0.6%) | 91 (5.6%) |
| 85 Years and over | 18 (0.6%) | 64 (3.9%) |
| Total | 2,770 (100.0%) | 1,641 (100.0%) |
Families and Households in Palacios
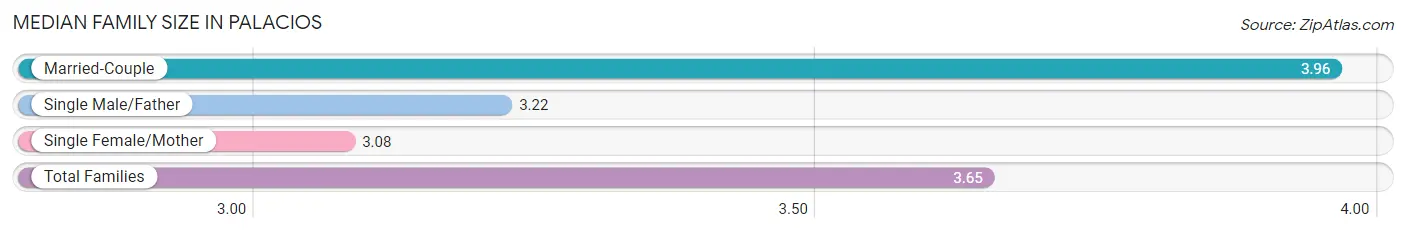
Median Family Size in Palacios
The median family size in Palacios is 3.65 persons per family, with married-couple families (632 | 61.2%) accounting for the largest median family size of 3.96 persons per family. On the other hand, single female/mother families (165 | 16.0%) represent the smallest median family size with 3.08 persons per family.
| Family Type | # Families | Family Size |
| Married-Couple | 632 (61.2%) | 3.96 |
| Single Male/Father | 235 (22.8%) | 3.22 |
| Single Female/Mother | 165 (16.0%) | 3.08 |
| Total Families | 1,032 (100.0%) | 3.65 |
Median Household Size in Palacios
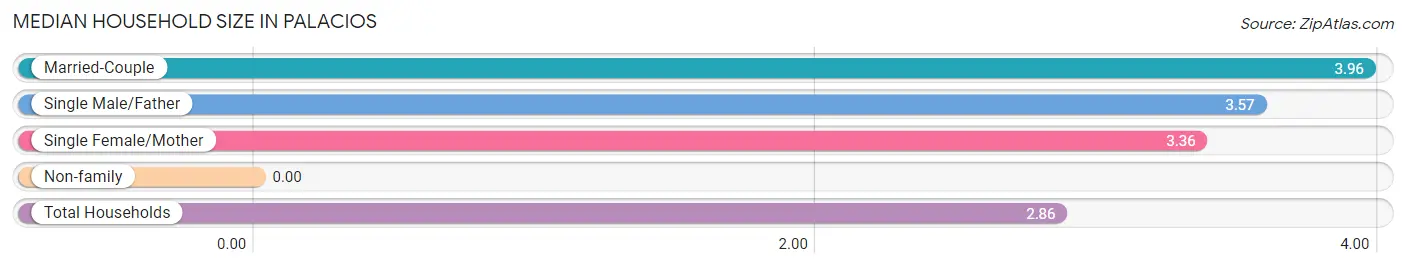
| Household Type | # Households | Household Size |
| Married-Couple | 632 (41.1%) | 3.96 |
| Single Male/Father | 235 (15.3%) | 3.57 |
| Single Female/Mother | 165 (10.7%) | 3.36 |
| Non-family | 505 (32.9%) | - |
| Total Households | 1,537 (100.0%) | 2.86 |
Household Size by Marriage Status in Palacios
Out of a total of 1,537 households in Palacios, 1,032 (67.1%) are family households, while 505 (32.9%) are nonfamily households. The most numerous type of family households are 2-person households, comprising 406, and the most common type of nonfamily households are 1-person households, comprising 505.
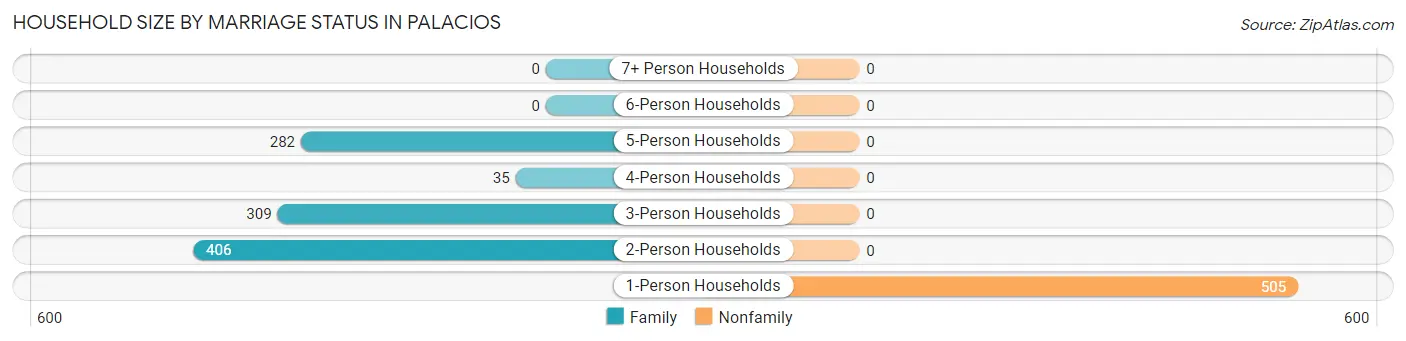
| Household Size | Family Households | Nonfamily Households |
| 1-Person Households | - | 505 (32.9%) |
| 2-Person Households | 406 (26.4%) | 0 (0.0%) |
| 3-Person Households | 309 (20.1%) | 0 (0.0%) |
| 4-Person Households | 35 (2.3%) | 0 (0.0%) |
| 5-Person Households | 282 (18.3%) | 0 (0.0%) |
| 6-Person Households | 0 (0.0%) | 0 (0.0%) |
| 7+ Person Households | 0 (0.0%) | 0 (0.0%) |
| Total | 1,032 (67.1%) | 505 (32.9%) |
Female Fertility in Palacios
Fertility by Age in Palacios
Average fertility rate in Palacios is 39.0 births per 1,000 women. Women in the age bracket of 20 to 34 years have the highest fertility rate with 76.0 births per 1,000 women. Women in the age bracket of 20 to 34 years acount for 100.0% of all women with births.
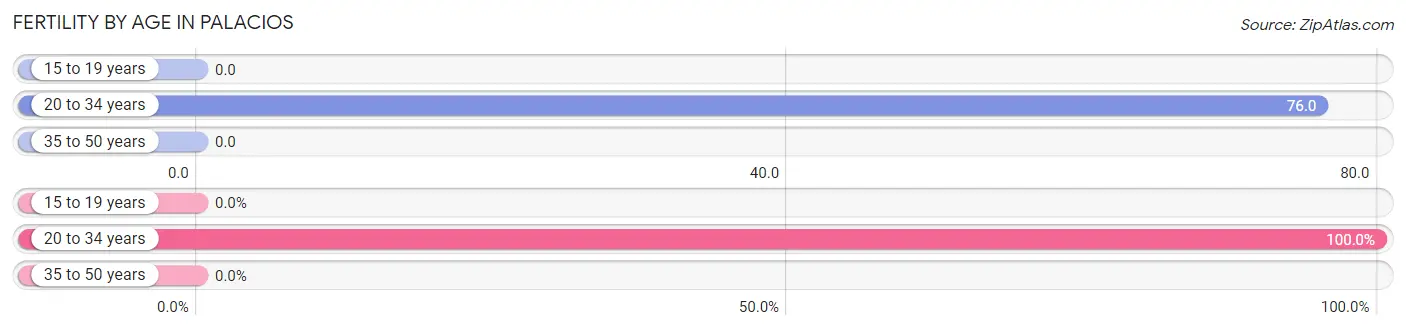
| Age Bracket | Women with Births | Births / 1,000 Women |
| 15 to 19 years | 0 (0.0%) | 0.0 |
| 20 to 34 years | 24 (100.0%) | 76.0 |
| 35 to 50 years | 0 (0.0%) | 0.0 |
| Total | 24 (100.0%) | 39.0 |
Fertility by Age by Marriage Status in Palacios
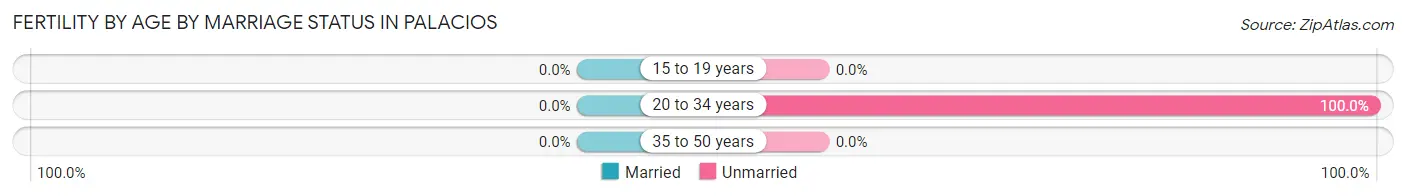
| Age Bracket | Married | Unmarried |
| 15 to 19 years | 0 (0.0%) | 0 (0.0%) |
| 20 to 34 years | 0 (0.0%) | 24 (100.0%) |
| 35 to 50 years | 0 (0.0%) | 0 (0.0%) |
| Total | 0 (0.0%) | 24 (100.0%) |
Fertility by Education in Palacios
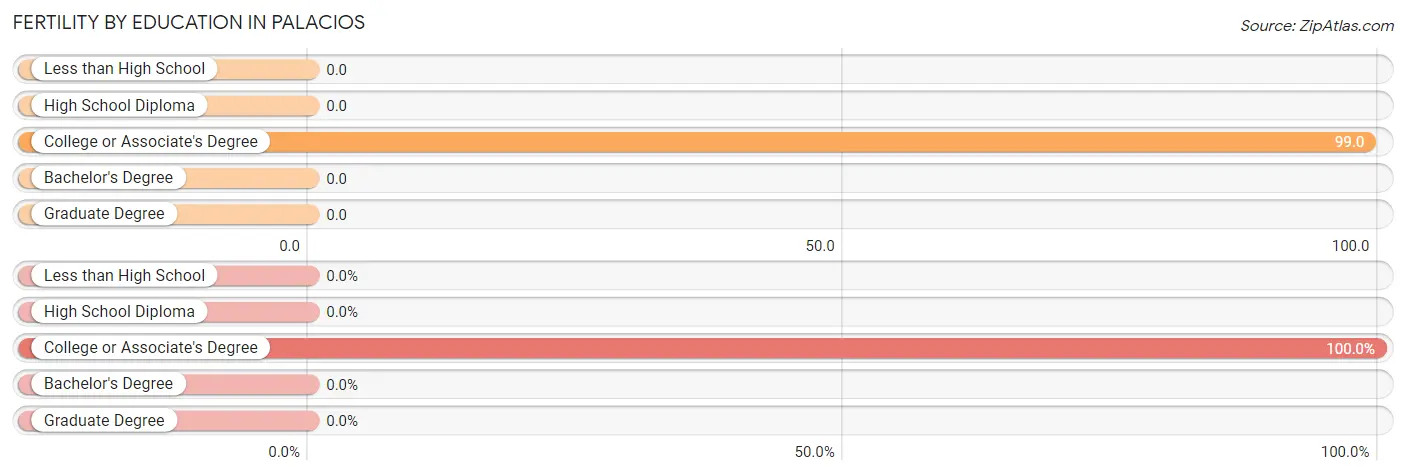
| Educational Attainment | Women with Births | Births / 1,000 Women |
| Less than High School | 0 (0.0%) | 0.0 |
| High School Diploma | 0 (0.0%) | 0.0 |
| College or Associate's Degree | 24 (100.0%) | 99.0 |
| Bachelor's Degree | 0 (0.0%) | 0.0 |
| Graduate Degree | 0 (0.0%) | 0.0 |
| Total | 24 (100.0%) | 39.0 |
Fertility by Education by Marriage Status in Palacios
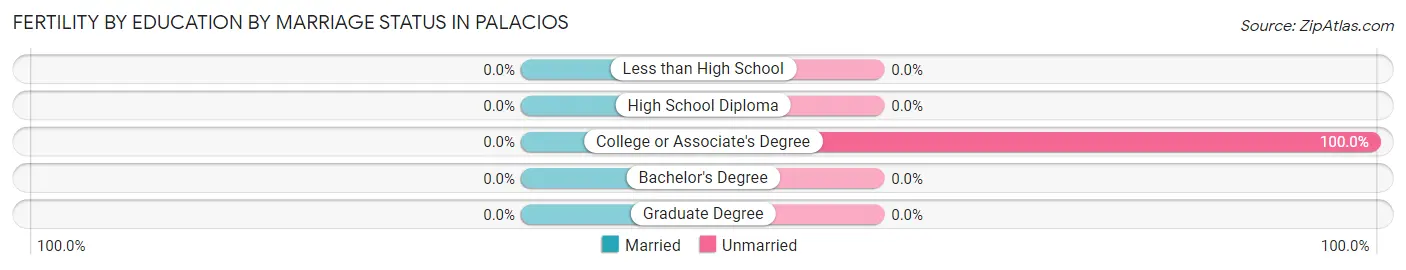
| Educational Attainment | Married | Unmarried |
| Less than High School | 0 (0.0%) | 0 (0.0%) |
| High School Diploma | 0 (0.0%) | 0 (0.0%) |
| College or Associate's Degree | 0 (0.0%) | 24 (100.0%) |
| Bachelor's Degree | 0 (0.0%) | 0 (0.0%) |
| Graduate Degree | 0 (0.0%) | 0 (0.0%) |
| Total | 0 (0.0%) | 24 (100.0%) |
Employment Characteristics in Palacios
Employment by Class of Employer in Palacios
Among the 2,039 employed individuals in Palacios, private company employees (1,386 | 68.0%), not-for-profit organizations (378 | 18.5%), and self-employed (not incorporated) (143 | 7.0%) make up the most common classes of employment.
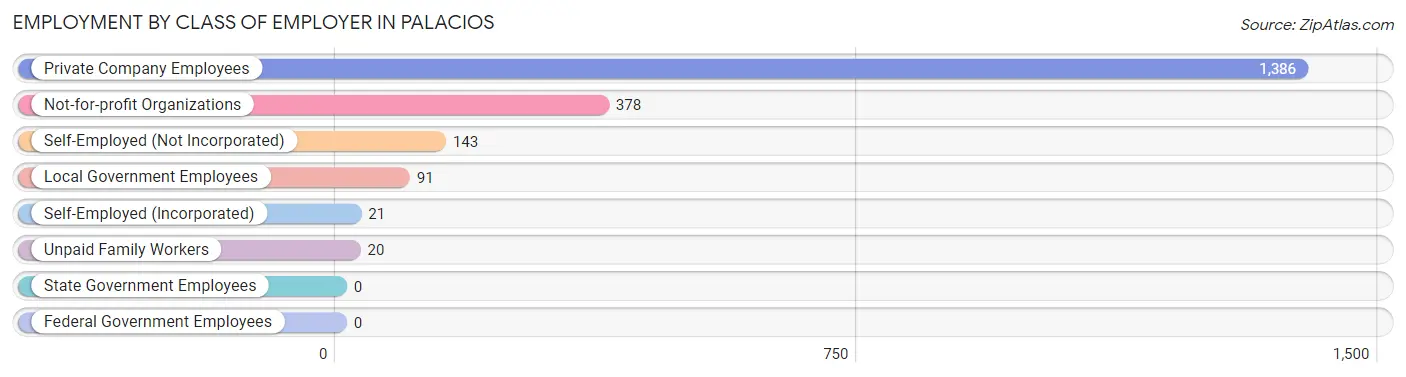
| Employer Class | # Employees | % Employees |
| Private Company Employees | 1,386 | 68.0% |
| Self-Employed (Incorporated) | 21 | 1.0% |
| Self-Employed (Not Incorporated) | 143 | 7.0% |
| Not-for-profit Organizations | 378 | 18.5% |
| Local Government Employees | 91 | 4.5% |
| State Government Employees | 0 | 0.0% |
| Federal Government Employees | 0 | 0.0% |
| Unpaid Family Workers | 20 | 1.0% |
| Total | 2,039 | 100.0% |
Employment Status by Age in Palacios
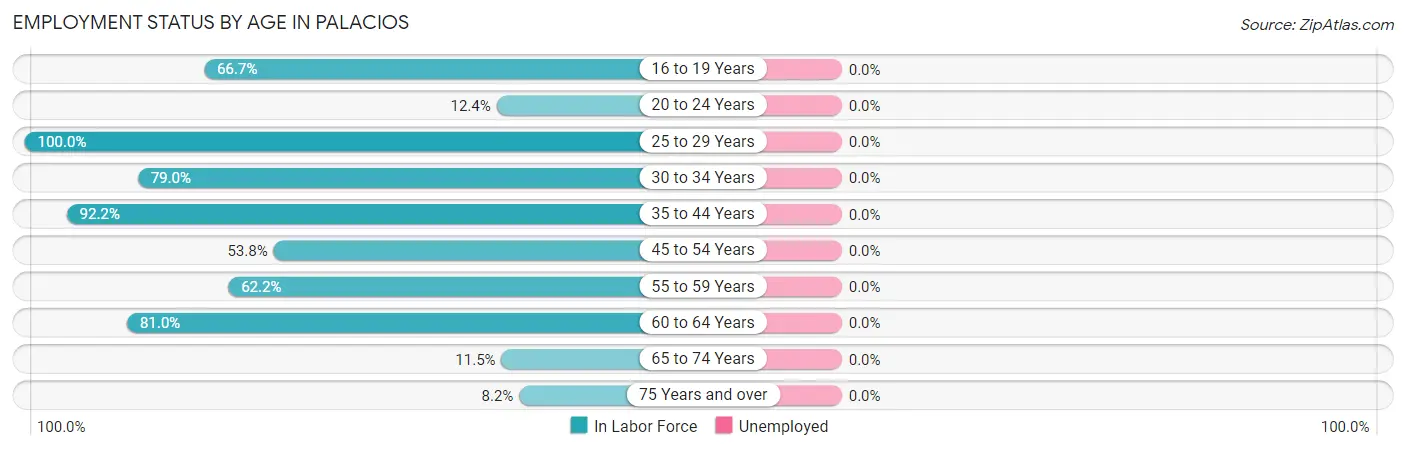
| Age Bracket | In Labor Force | Unemployed |
| 16 to 19 Years | 118 (66.7%) | 0 (0.0%) |
| 20 to 24 Years | 20 (12.4%) | 0 (0.0%) |
| 25 to 29 Years | 134 (100.0%) | 0 (0.0%) |
| 30 to 34 Years | 328 (79.0%) | 0 (0.0%) |
| 35 to 44 Years | 723 (92.2%) | 0 (0.0%) |
| 45 to 54 Years | 217 (53.8%) | 0 (0.0%) |
| 55 to 59 Years | 130 (62.2%) | 0 (0.0%) |
| 60 to 64 Years | 370 (81.0%) | 0 (0.0%) |
| 65 to 74 Years | 58 (11.5%) | 0 (0.0%) |
| 75 Years and over | 18 (8.2%) | 0 (0.0%) |
| Total | 2,116 (61.1%) | 0 (0.0%) |
Employment Status by Educational Attainment in Palacios
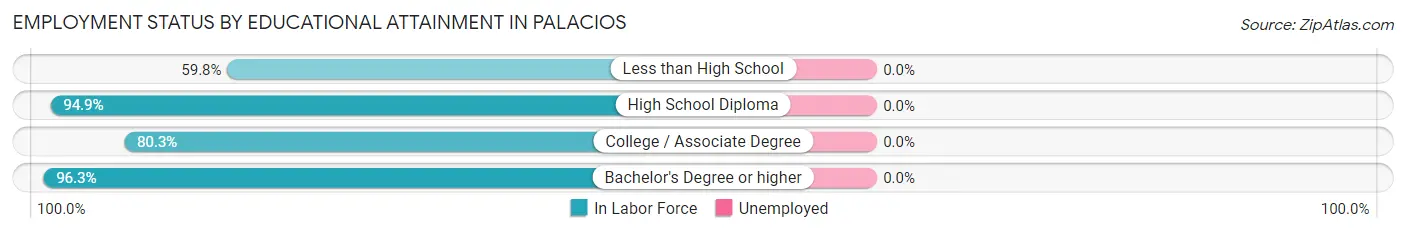
| Educational Attainment | In Labor Force | Unemployed |
| Less than High School | 514 (59.8%) | 0 (0.0%) |
| High School Diploma | 315 (94.9%) | 0 (0.0%) |
| College / Associate Degree | 468 (80.3%) | 0 (0.0%) |
| Bachelor's Degree or higher | 605 (96.3%) | 0 (0.0%) |
| Total | 1,902 (79.2%) | 0 (0.0%) |
Employment Occupations by Sex in Palacios
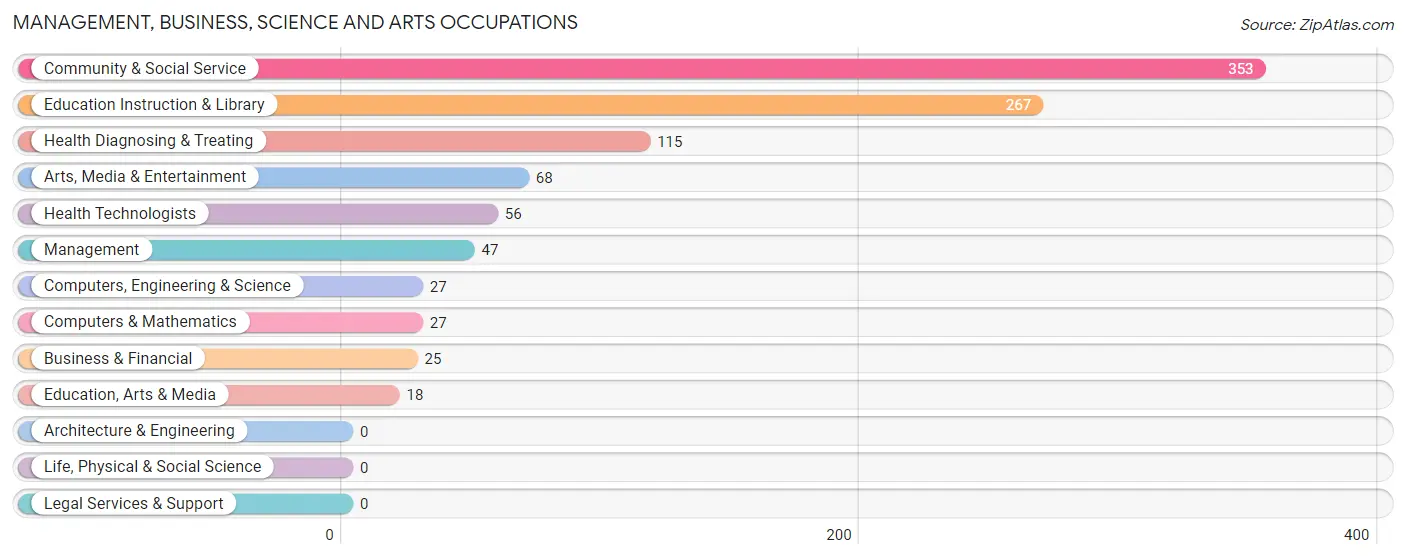
Management, Business, Science and Arts Occupations
The most common Management, Business, Science and Arts occupations in Palacios are Community & Social Service (353 | 16.7%), Education Instruction & Library (267 | 12.6%), Health Diagnosing & Treating (115 | 5.4%), Arts, Media & Entertainment (68 | 3.2%), and Health Technologists (56 | 2.6%).
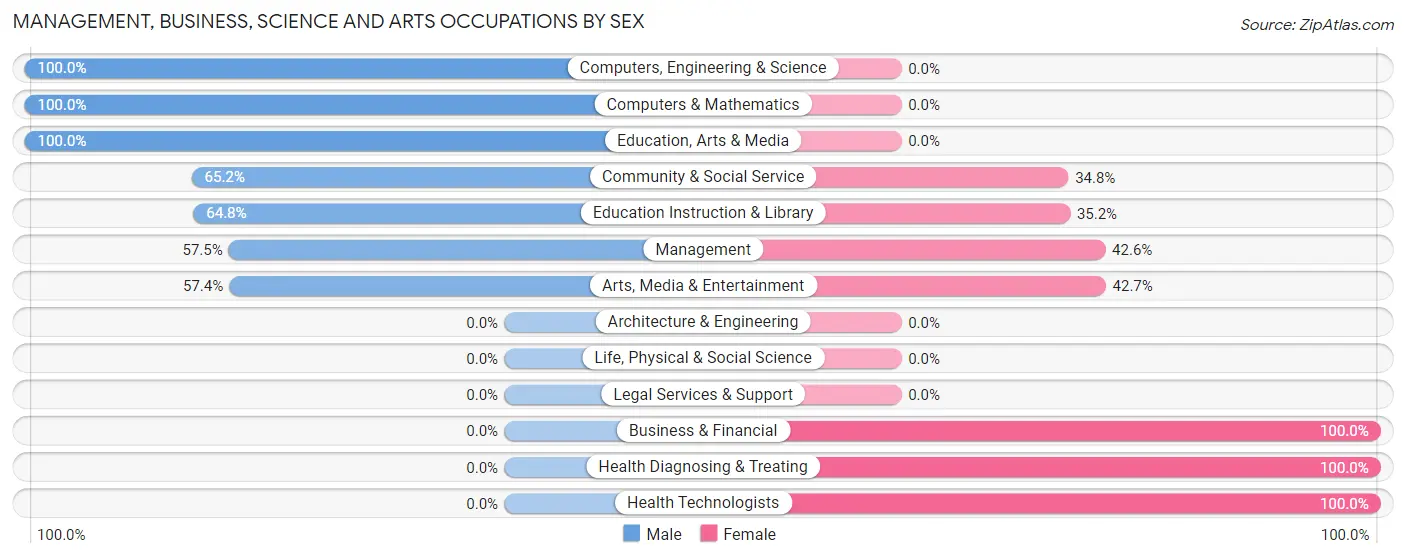
Management, Business, Science and Arts Occupations by Sex
Within the Management, Business, Science and Arts occupations in Palacios, the most male-oriented occupations are Computers, Engineering & Science (100.0%), Computers & Mathematics (100.0%), and Education, Arts & Media (100.0%), while the most female-oriented occupations are Business & Financial (100.0%), Health Diagnosing & Treating (100.0%), and Health Technologists (100.0%).
| Occupation | Male | Female |
| Management | 27 (57.5%) | 20 (42.5%) |
| Business & Financial | 0 (0.0%) | 25 (100.0%) |
| Computers, Engineering & Science | 27 (100.0%) | 0 (0.0%) |
| Computers & Mathematics | 27 (100.0%) | 0 (0.0%) |
| Architecture & Engineering | 0 (0.0%) | 0 (0.0%) |
| Life, Physical & Social Science | 0 (0.0%) | 0 (0.0%) |
| Community & Social Service | 230 (65.2%) | 123 (34.8%) |
| Education, Arts & Media | 18 (100.0%) | 0 (0.0%) |
| Legal Services & Support | 0 (0.0%) | 0 (0.0%) |
| Education Instruction & Library | 173 (64.8%) | 94 (35.2%) |
| Arts, Media & Entertainment | 39 (57.4%) | 29 (42.6%) |
| Health Diagnosing & Treating | 0 (0.0%) | 115 (100.0%) |
| Health Technologists | 0 (0.0%) | 56 (100.0%) |
| Total (Category) | 284 (50.1%) | 283 (49.9%) |
| Total (Overall) | 1,423 (67.2%) | 693 (32.8%) |
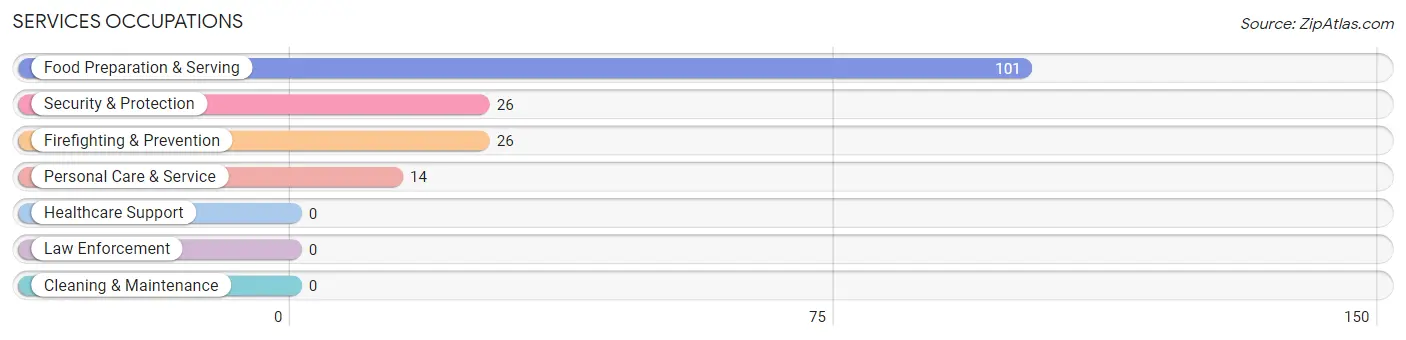
Services Occupations
The most common Services occupations in Palacios are Food Preparation & Serving (101 | 4.8%), Security & Protection (26 | 1.2%), Firefighting & Prevention (26 | 1.2%), and Personal Care & Service (14 | 0.7%).
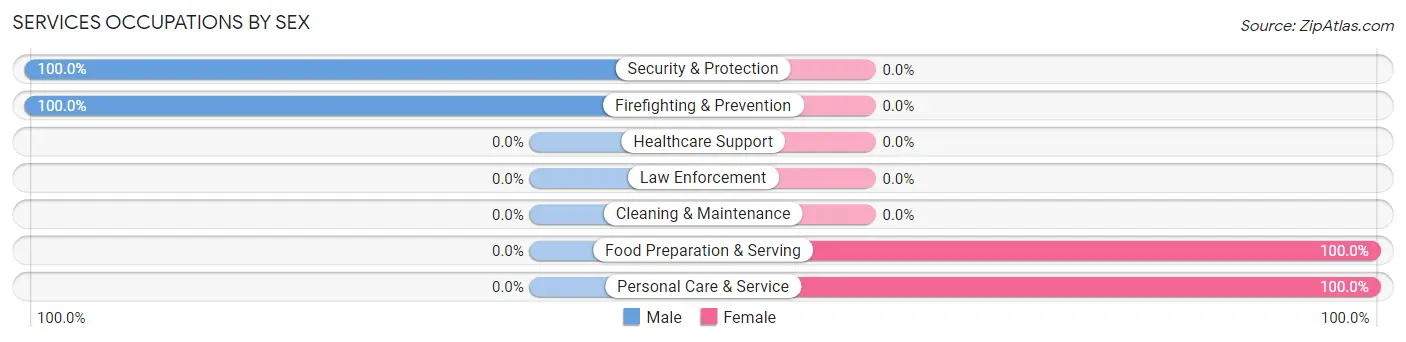
Services Occupations by Sex
Within the Services occupations in Palacios, the most male-oriented occupations are Security & Protection (100.0%), and Firefighting & Prevention (100.0%), while the most female-oriented occupations are Food Preparation & Serving (100.0%), and Personal Care & Service (100.0%).
| Occupation | Male | Female |
| Healthcare Support | 0 (0.0%) | 0 (0.0%) |
| Security & Protection | 26 (100.0%) | 0 (0.0%) |
| Firefighting & Prevention | 26 (100.0%) | 0 (0.0%) |
| Law Enforcement | 0 (0.0%) | 0 (0.0%) |
| Food Preparation & Serving | 0 (0.0%) | 101 (100.0%) |
| Cleaning & Maintenance | 0 (0.0%) | 0 (0.0%) |
| Personal Care & Service | 0 (0.0%) | 14 (100.0%) |
| Total (Category) | 26 (18.4%) | 115 (81.6%) |
| Total (Overall) | 1,423 (67.2%) | 693 (32.8%) |
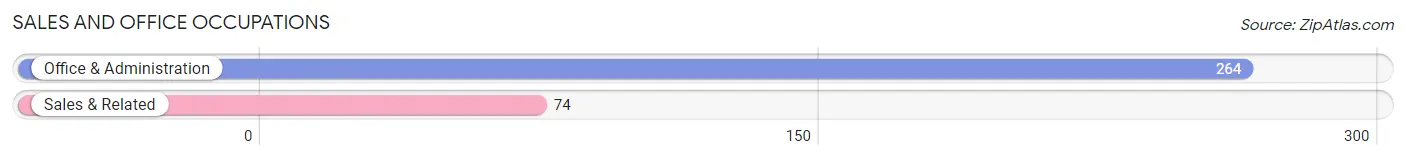
Sales and Office Occupations
The most common Sales and Office occupations in Palacios are Office & Administration (264 | 12.5%), and Sales & Related (74 | 3.5%).
Sales and Office Occupations by Sex
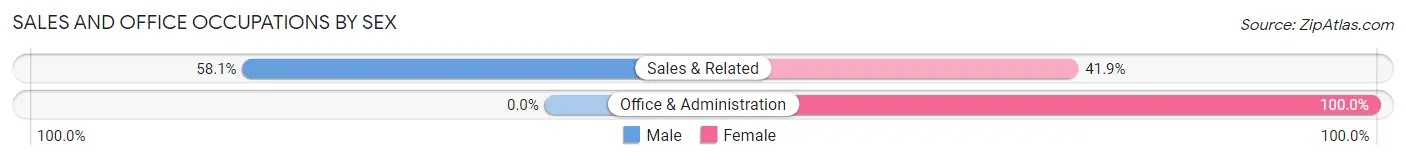
| Occupation | Male | Female |
| Sales & Related | 43 (58.1%) | 31 (41.9%) |
| Office & Administration | 0 (0.0%) | 264 (100.0%) |
| Total (Category) | 43 (12.7%) | 295 (87.3%) |
| Total (Overall) | 1,423 (67.2%) | 693 (32.8%) |
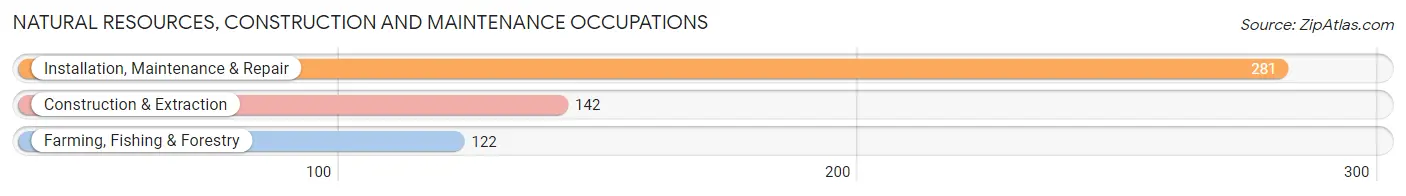
Natural Resources, Construction and Maintenance Occupations
The most common Natural Resources, Construction and Maintenance occupations in Palacios are Installation, Maintenance & Repair (281 | 13.3%), Construction & Extraction (142 | 6.7%), and Farming, Fishing & Forestry (122 | 5.8%).
Natural Resources, Construction and Maintenance Occupations by Sex
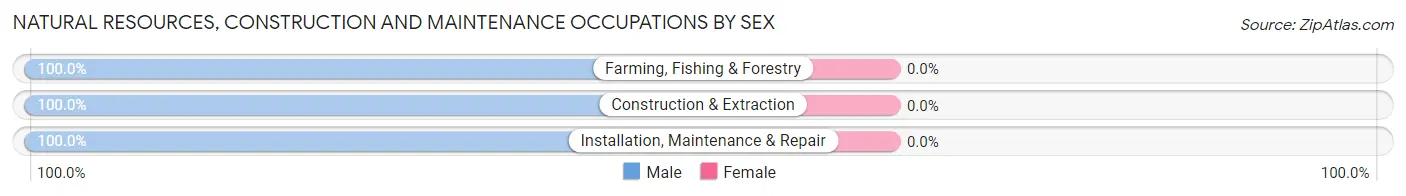
| Occupation | Male | Female |
| Farming, Fishing & Forestry | 122 (100.0%) | 0 (0.0%) |
| Construction & Extraction | 142 (100.0%) | 0 (0.0%) |
| Installation, Maintenance & Repair | 281 (100.0%) | 0 (0.0%) |
| Total (Category) | 545 (100.0%) | 0 (0.0%) |
| Total (Overall) | 1,423 (67.2%) | 693 (32.8%) |
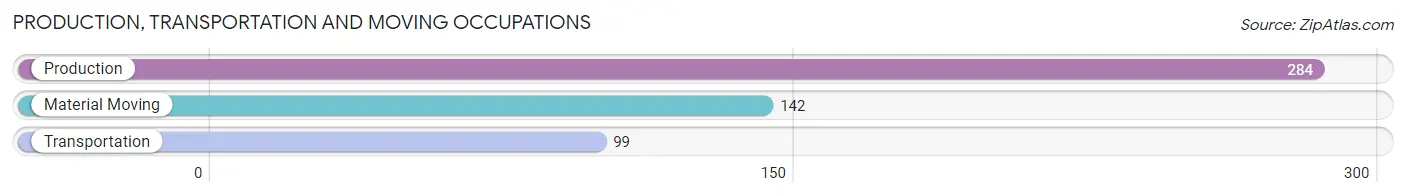
Production, Transportation and Moving Occupations
The most common Production, Transportation and Moving occupations in Palacios are Production (284 | 13.4%), Material Moving (142 | 6.7%), and Transportation (99 | 4.7%).
Production, Transportation and Moving Occupations by Sex
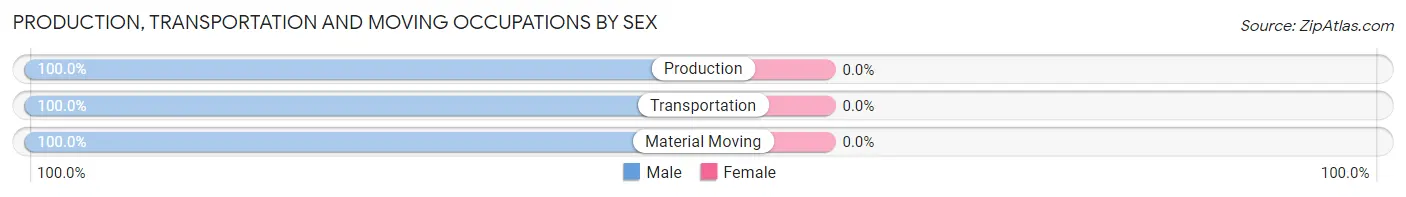
| Occupation | Male | Female |
| Production | 284 (100.0%) | 0 (0.0%) |
| Transportation | 99 (100.0%) | 0 (0.0%) |
| Material Moving | 142 (100.0%) | 0 (0.0%) |
| Total (Category) | 525 (100.0%) | 0 (0.0%) |
| Total (Overall) | 1,423 (67.2%) | 693 (32.8%) |
Employment Industries by Sex in Palacios
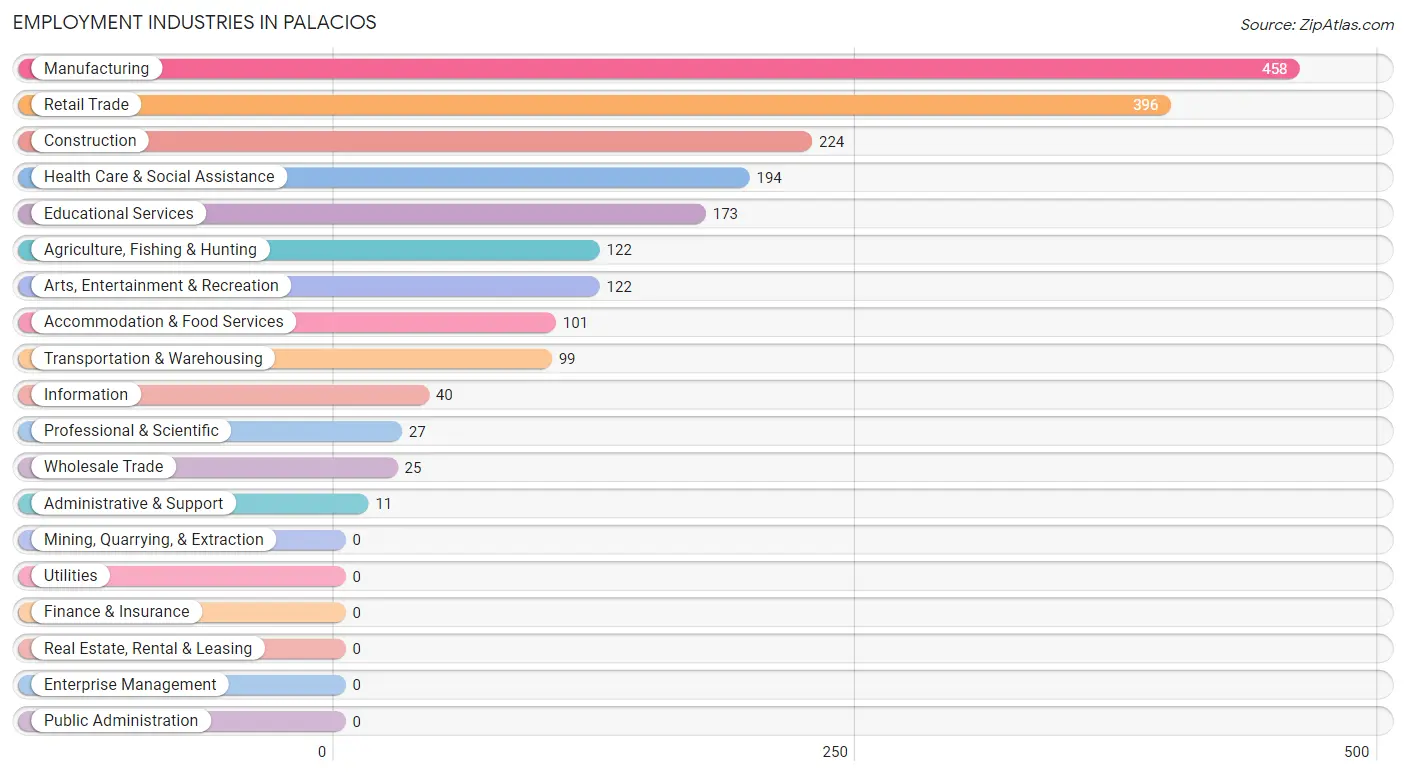
Employment Industries in Palacios
The major employment industries in Palacios include Manufacturing (458 | 21.6%), Retail Trade (396 | 18.7%), Construction (224 | 10.6%), Health Care & Social Assistance (194 | 9.2%), and Educational Services (173 | 8.2%).
Employment Industries by Sex in Palacios
The Palacios industries that see more men than women are Agriculture, Fishing & Hunting (100.0%), Transportation & Warehousing (100.0%), and Professional & Scientific (100.0%), whereas the industries that tend to have a higher number of women are Wholesale Trade (100.0%), Information (100.0%), and Accommodation & Food Services (100.0%).
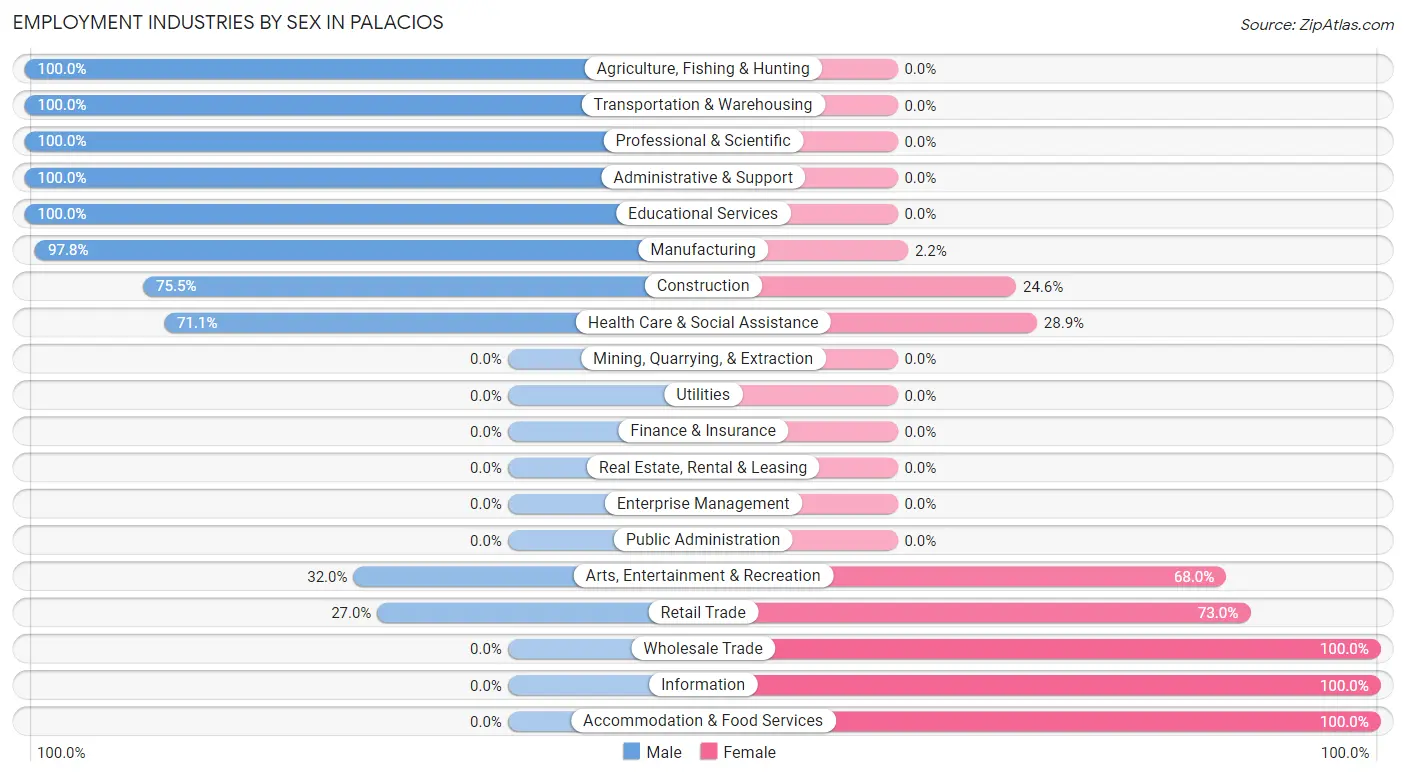
| Industry | Male | Female |
| Agriculture, Fishing & Hunting | 122 (100.0%) | 0 (0.0%) |
| Mining, Quarrying, & Extraction | 0 (0.0%) | 0 (0.0%) |
| Construction | 169 (75.4%) | 55 (24.5%) |
| Manufacturing | 448 (97.8%) | 10 (2.2%) |
| Wholesale Trade | 0 (0.0%) | 25 (100.0%) |
| Retail Trade | 107 (27.0%) | 289 (73.0%) |
| Transportation & Warehousing | 99 (100.0%) | 0 (0.0%) |
| Utilities | 0 (0.0%) | 0 (0.0%) |
| Information | 0 (0.0%) | 40 (100.0%) |
| Finance & Insurance | 0 (0.0%) | 0 (0.0%) |
| Real Estate, Rental & Leasing | 0 (0.0%) | 0 (0.0%) |
| Professional & Scientific | 27 (100.0%) | 0 (0.0%) |
| Enterprise Management | 0 (0.0%) | 0 (0.0%) |
| Administrative & Support | 11 (100.0%) | 0 (0.0%) |
| Educational Services | 173 (100.0%) | 0 (0.0%) |
| Health Care & Social Assistance | 138 (71.1%) | 56 (28.9%) |
| Arts, Entertainment & Recreation | 39 (32.0%) | 83 (68.0%) |
| Accommodation & Food Services | 0 (0.0%) | 101 (100.0%) |
| Public Administration | 0 (0.0%) | 0 (0.0%) |
| Total | 1,423 (67.2%) | 693 (32.8%) |
Education in Palacios
School Enrollment in Palacios
The most common levels of schooling among the 883 students in Palacios are elementary school (286 | 32.4%), middle school (198 | 22.4%), and high school (148 | 16.8%).
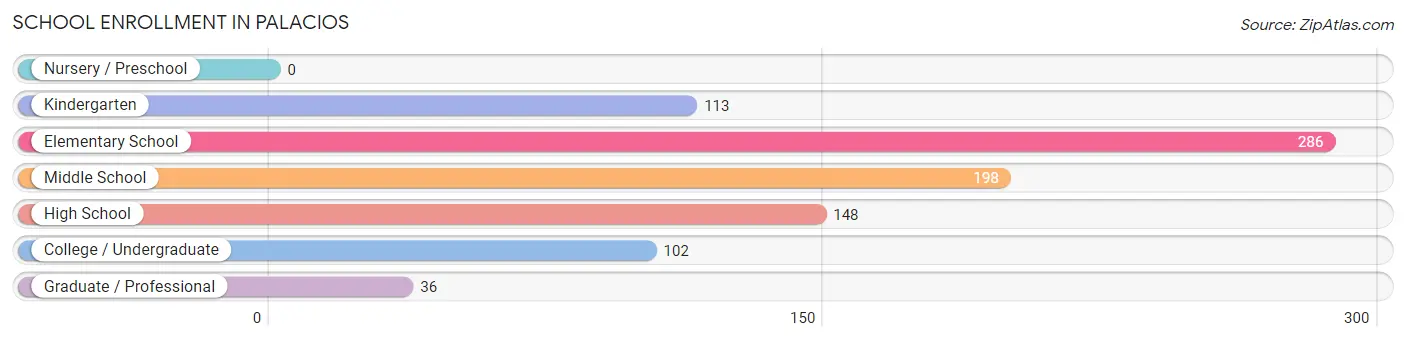
| School Level | # Students | % Students |
| Nursery / Preschool | 0 | 0.0% |
| Kindergarten | 113 | 12.8% |
| Elementary School | 286 | 32.4% |
| Middle School | 198 | 22.4% |
| High School | 148 | 16.8% |
| College / Undergraduate | 102 | 11.6% |
| Graduate / Professional | 36 | 4.1% |
| Total | 883 | 100.0% |
School Enrollment by Age by Funding Source in Palacios
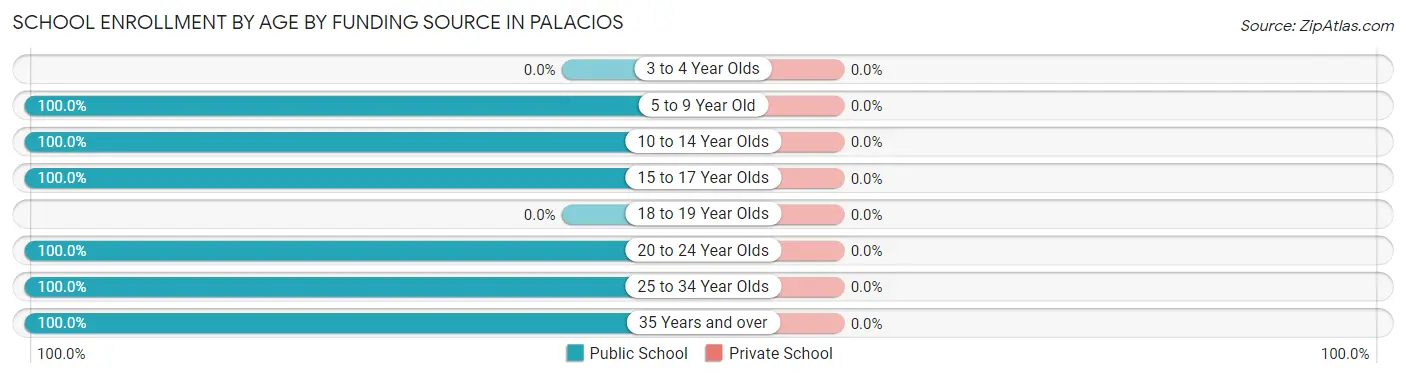
| Age Bracket | Public School | Private School |
| 3 to 4 Year Olds | 0 (0.0%) | 0 (0.0%) |
| 5 to 9 Year Old | 323 (100.0%) | 0 (0.0%) |
| 10 to 14 Year Olds | 274 (100.0%) | 0 (0.0%) |
| 15 to 17 Year Olds | 148 (100.0%) | 0 (0.0%) |
| 18 to 19 Year Olds | 0 (0.0%) | 0 (0.0%) |
| 20 to 24 Year Olds | 20 (100.0%) | 0 (0.0%) |
| 25 to 34 Year Olds | 82 (100.0%) | 0 (0.0%) |
| 35 Years and over | 36 (100.0%) | 0 (0.0%) |
| Total | 883 (100.0%) | 0 (0.0%) |
Educational Attainment by Field of Study in Palacios
Education (267 | 38.9%), literature & languages (139 | 20.3%), business (100 | 14.6%), engineering (58 | 8.5%), and bio, nature & agricultural (56 | 8.2%) are the most common fields of study among 686 individuals in Palacios who have obtained a bachelor's degree or higher.
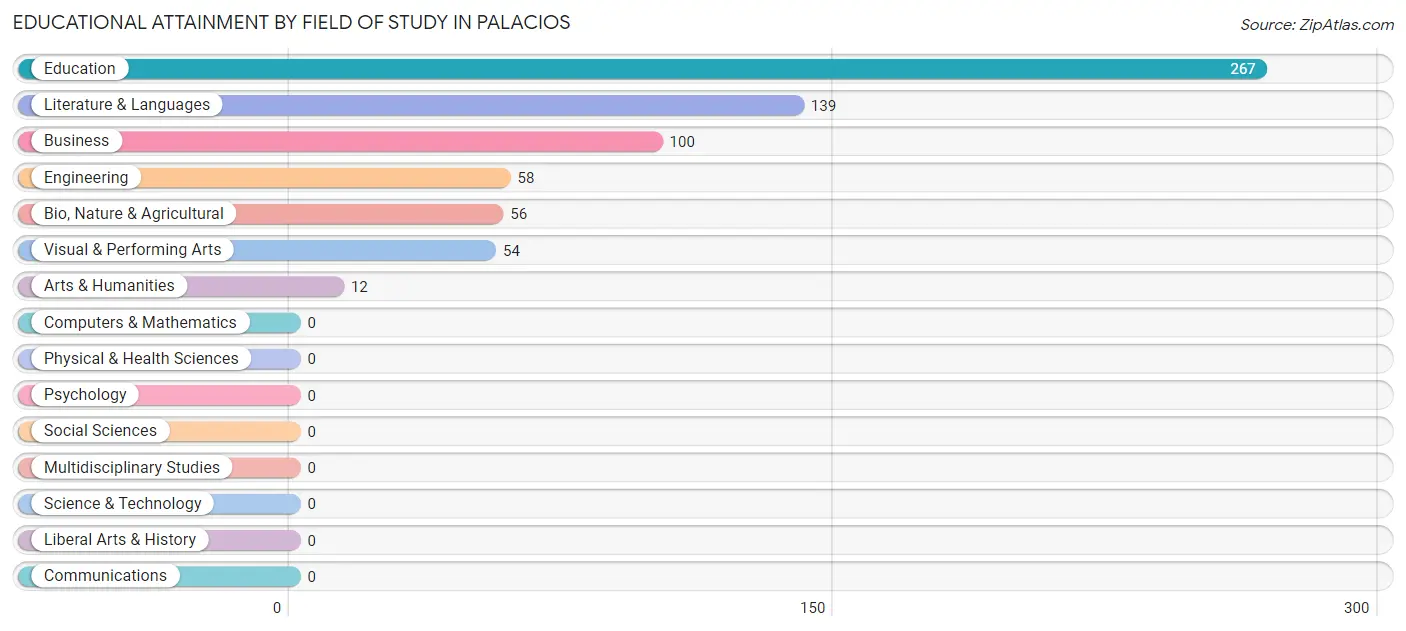
| Field of Study | # Graduates | % Graduates |
| Computers & Mathematics | 0 | 0.0% |
| Bio, Nature & Agricultural | 56 | 8.2% |
| Physical & Health Sciences | 0 | 0.0% |
| Psychology | 0 | 0.0% |
| Social Sciences | 0 | 0.0% |
| Engineering | 58 | 8.5% |
| Multidisciplinary Studies | 0 | 0.0% |
| Science & Technology | 0 | 0.0% |
| Business | 100 | 14.6% |
| Education | 267 | 38.9% |
| Literature & Languages | 139 | 20.3% |
| Liberal Arts & History | 0 | 0.0% |
| Visual & Performing Arts | 54 | 7.9% |
| Communications | 0 | 0.0% |
| Arts & Humanities | 12 | 1.8% |
| Total | 686 | 100.0% |
Transportation & Commute in Palacios
Vehicle Availability by Sex in Palacios
The most prevalent vehicle ownership categories in Palacios are males with 2 vehicles (503, accounting for 37.4%) and females with 2 vehicles (163, making up 72.6%).
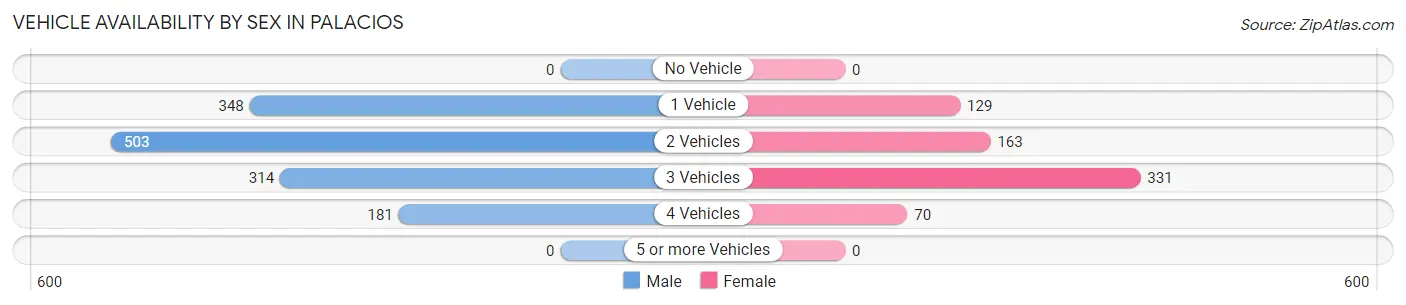
| Vehicles Available | Male | Female |
| No Vehicle | 0 (0.0%) | 0 (0.0%) |
| 1 Vehicle | 348 (25.9%) | 129 (18.6%) |
| 2 Vehicles | 503 (37.4%) | 163 (23.5%) |
| 3 Vehicles | 314 (23.3%) | 331 (47.8%) |
| 4 Vehicles | 181 (13.5%) | 70 (10.1%) |
| 5 or more Vehicles | 0 (0.0%) | 0 (0.0%) |
| Total | 1,346 (100.0%) | 693 (100.0%) |
Commute Time in Palacios
The most frequently occuring commute durations in Palacios are 5 to 9 minutes (477 commuters, 24.7%), 10 to 14 minutes (300 commuters, 15.6%), and 20 to 24 minutes (288 commuters, 14.9%).
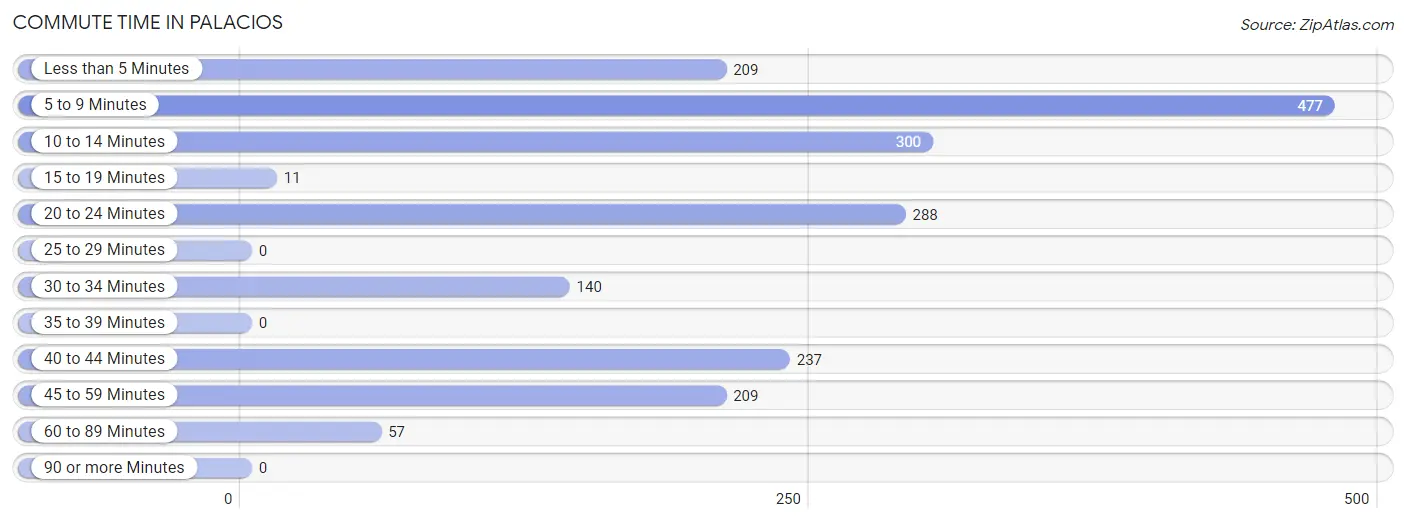
| Commute Time | # Commuters | % Commuters |
| Less than 5 Minutes | 209 | 10.8% |
| 5 to 9 Minutes | 477 | 24.7% |
| 10 to 14 Minutes | 300 | 15.6% |
| 15 to 19 Minutes | 11 | 0.6% |
| 20 to 24 Minutes | 288 | 14.9% |
| 25 to 29 Minutes | 0 | 0.0% |
| 30 to 34 Minutes | 140 | 7.3% |
| 35 to 39 Minutes | 0 | 0.0% |
| 40 to 44 Minutes | 237 | 12.3% |
| 45 to 59 Minutes | 209 | 10.8% |
| 60 to 89 Minutes | 57 | 3.0% |
| 90 or more Minutes | 0 | 0.0% |
Commute Time by Sex in Palacios
The most common commute times in Palacios are 5 to 9 minutes (250 commuters, 19.8%) for males and 5 to 9 minutes (227 commuters, 34.2%) for females.
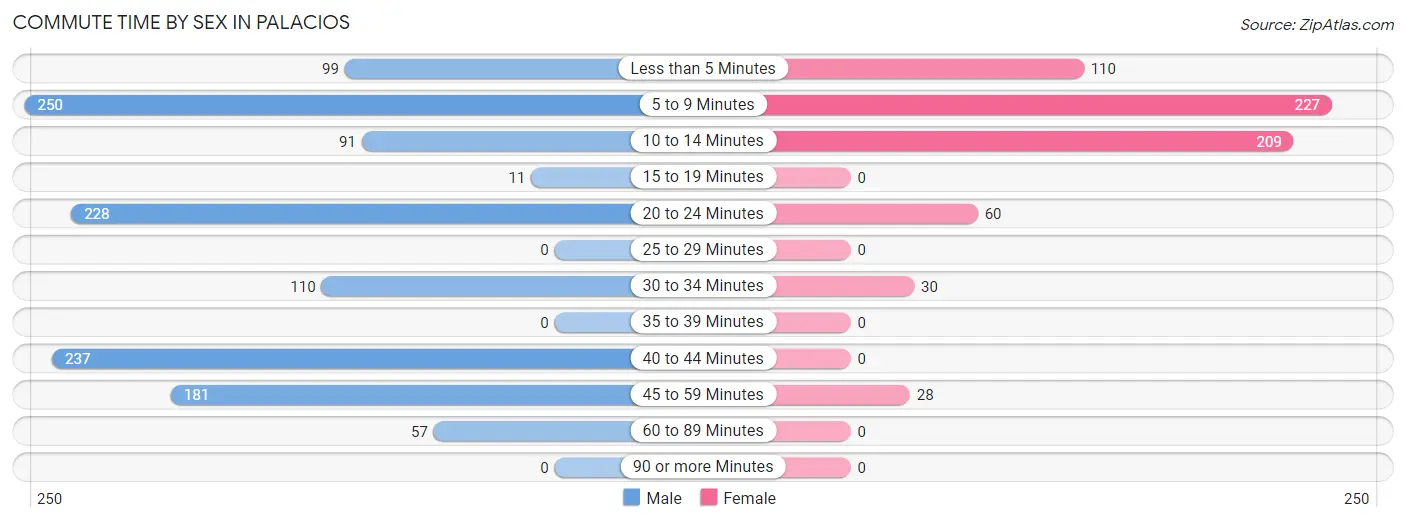
| Commute Time | Male | Female |
| Less than 5 Minutes | 99 (7.8%) | 110 (16.6%) |
| 5 to 9 Minutes | 250 (19.8%) | 227 (34.2%) |
| 10 to 14 Minutes | 91 (7.2%) | 209 (31.5%) |
| 15 to 19 Minutes | 11 (0.9%) | 0 (0.0%) |
| 20 to 24 Minutes | 228 (18.0%) | 60 (9.0%) |
| 25 to 29 Minutes | 0 (0.0%) | 0 (0.0%) |
| 30 to 34 Minutes | 110 (8.7%) | 30 (4.5%) |
| 35 to 39 Minutes | 0 (0.0%) | 0 (0.0%) |
| 40 to 44 Minutes | 237 (18.8%) | 0 (0.0%) |
| 45 to 59 Minutes | 181 (14.3%) | 28 (4.2%) |
| 60 to 89 Minutes | 57 (4.5%) | 0 (0.0%) |
| 90 or more Minutes | 0 (0.0%) | 0 (0.0%) |
Time of Departure to Work by Sex in Palacios
The most frequent times of departure to work in Palacios are 12:00 AM to 4:59 AM (486, 38.5%) for males and 7:00 AM to 7:29 AM (229, 34.5%) for females.
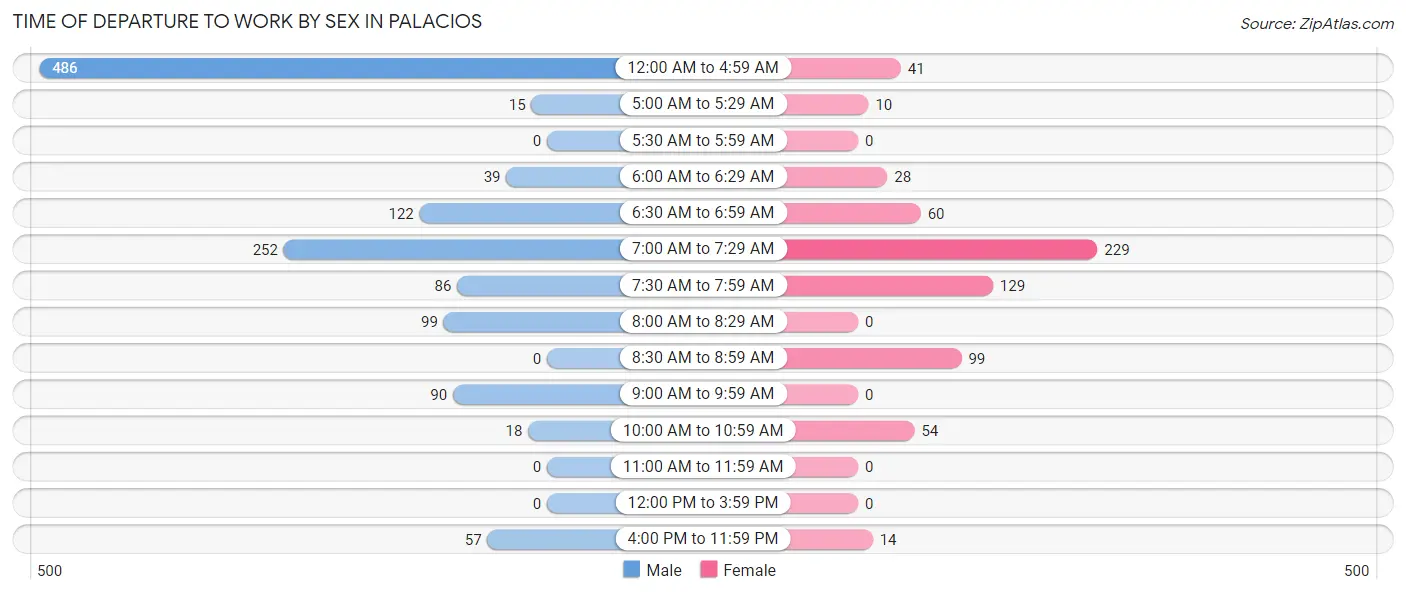
| Time of Departure | Male | Female |
| 12:00 AM to 4:59 AM | 486 (38.5%) | 41 (6.2%) |
| 5:00 AM to 5:29 AM | 15 (1.2%) | 10 (1.5%) |
| 5:30 AM to 5:59 AM | 0 (0.0%) | 0 (0.0%) |
| 6:00 AM to 6:29 AM | 39 (3.1%) | 28 (4.2%) |
| 6:30 AM to 6:59 AM | 122 (9.7%) | 60 (9.0%) |
| 7:00 AM to 7:29 AM | 252 (19.9%) | 229 (34.5%) |
| 7:30 AM to 7:59 AM | 86 (6.8%) | 129 (19.4%) |
| 8:00 AM to 8:29 AM | 99 (7.8%) | 0 (0.0%) |
| 8:30 AM to 8:59 AM | 0 (0.0%) | 99 (14.9%) |
| 9:00 AM to 9:59 AM | 90 (7.1%) | 0 (0.0%) |
| 10:00 AM to 10:59 AM | 18 (1.4%) | 54 (8.1%) |
| 11:00 AM to 11:59 AM | 0 (0.0%) | 0 (0.0%) |
| 12:00 PM to 3:59 PM | 0 (0.0%) | 0 (0.0%) |
| 4:00 PM to 11:59 PM | 57 (4.5%) | 14 (2.1%) |
| Total | 1,264 (100.0%) | 664 (100.0%) |
Housing Occupancy in Palacios
Occupancy by Ownership in Palacios
Of the total 1,537 dwellings in Palacios, owner-occupied units account for 1,110 (72.2%), while renter-occupied units make up 427 (27.8%).
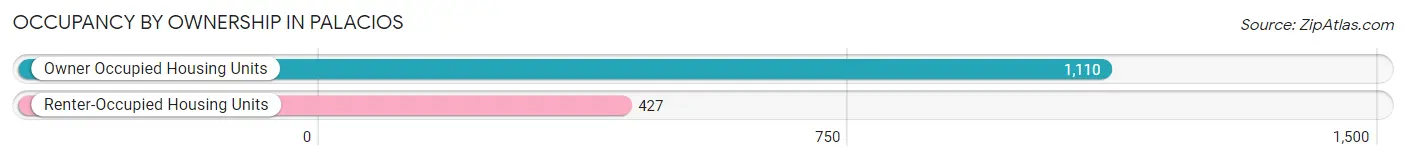
| Occupancy | # Housing Units | % Housing Units |
| Owner Occupied Housing Units | 1,110 | 72.2% |
| Renter-Occupied Housing Units | 427 | 27.8% |
| Total Occupied Housing Units | 1,537 | 100.0% |
Occupancy by Household Size in Palacios
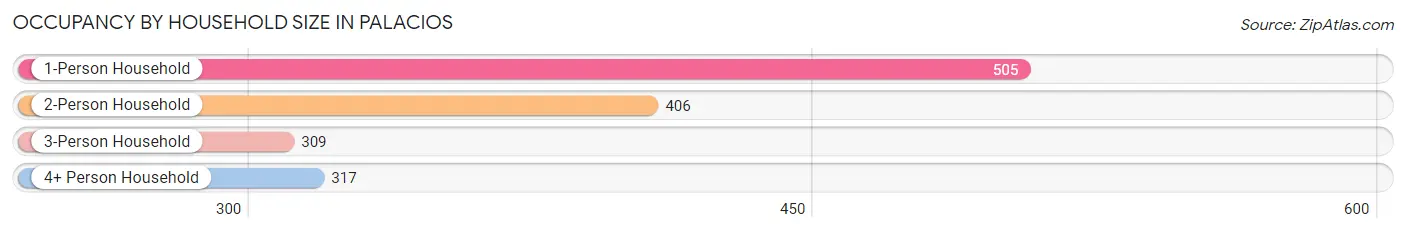
| Household Size | # Housing Units | % Housing Units |
| 1-Person Household | 505 | 32.9% |
| 2-Person Household | 406 | 26.4% |
| 3-Person Household | 309 | 20.1% |
| 4+ Person Household | 317 | 20.6% |
| Total Housing Units | 1,537 | 100.0% |
Occupancy by Ownership by Household Size in Palacios
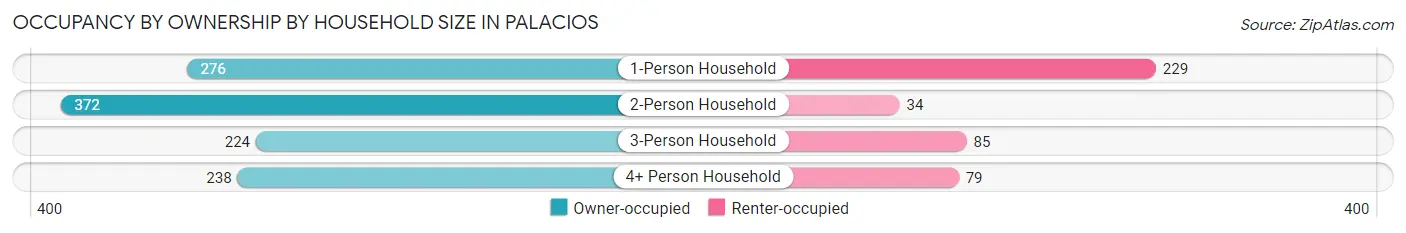
| Household Size | Owner-occupied | Renter-occupied |
| 1-Person Household | 276 (54.6%) | 229 (45.4%) |
| 2-Person Household | 372 (91.6%) | 34 (8.4%) |
| 3-Person Household | 224 (72.5%) | 85 (27.5%) |
| 4+ Person Household | 238 (75.1%) | 79 (24.9%) |
| Total Housing Units | 1,110 (72.2%) | 427 (27.8%) |
Occupancy by Educational Attainment in Palacios
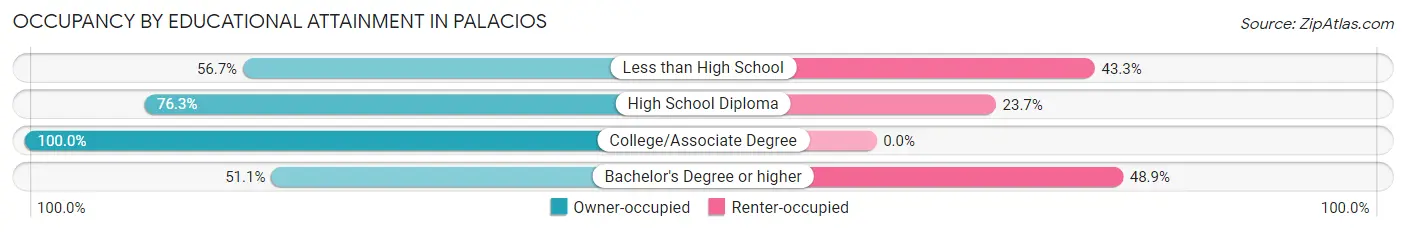
| Household Size | Owner-occupied | Renter-occupied |
| Less than High School | 262 (56.7%) | 200 (43.3%) |
| High School Diploma | 232 (76.3%) | 72 (23.7%) |
| College/Associate Degree | 454 (100.0%) | 0 (0.0%) |
| Bachelor's Degree or higher | 162 (51.1%) | 155 (48.9%) |
Occupancy by Age of Householder in Palacios
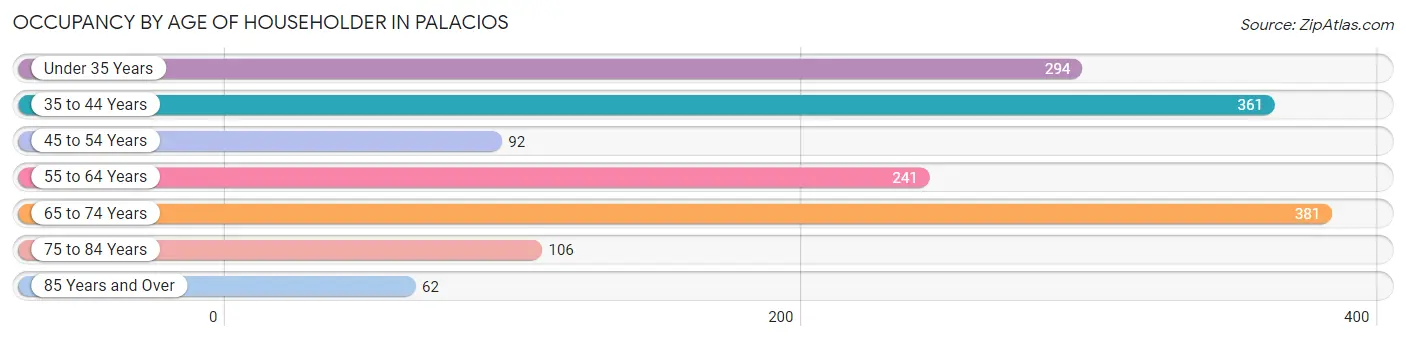
| Age Bracket | # Households | % Households |
| Under 35 Years | 294 | 19.1% |
| 35 to 44 Years | 361 | 23.5% |
| 45 to 54 Years | 92 | 6.0% |
| 55 to 64 Years | 241 | 15.7% |
| 65 to 74 Years | 381 | 24.8% |
| 75 to 84 Years | 106 | 6.9% |
| 85 Years and Over | 62 | 4.0% |
| Total | 1,537 | 100.0% |
Housing Finances in Palacios
Median Income by Occupancy in Palacios
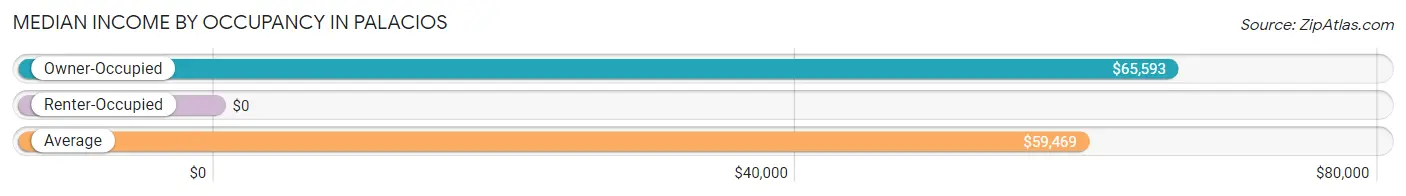
| Occupancy Type | # Households | Median Income |
| Owner-Occupied | 1,110 (72.2%) | $65,593 |
| Renter-Occupied | 427 (27.8%) | $0 |
| Average | 1,537 (100.0%) | $59,469 |
Occupancy by Householder Income Bracket in Palacios
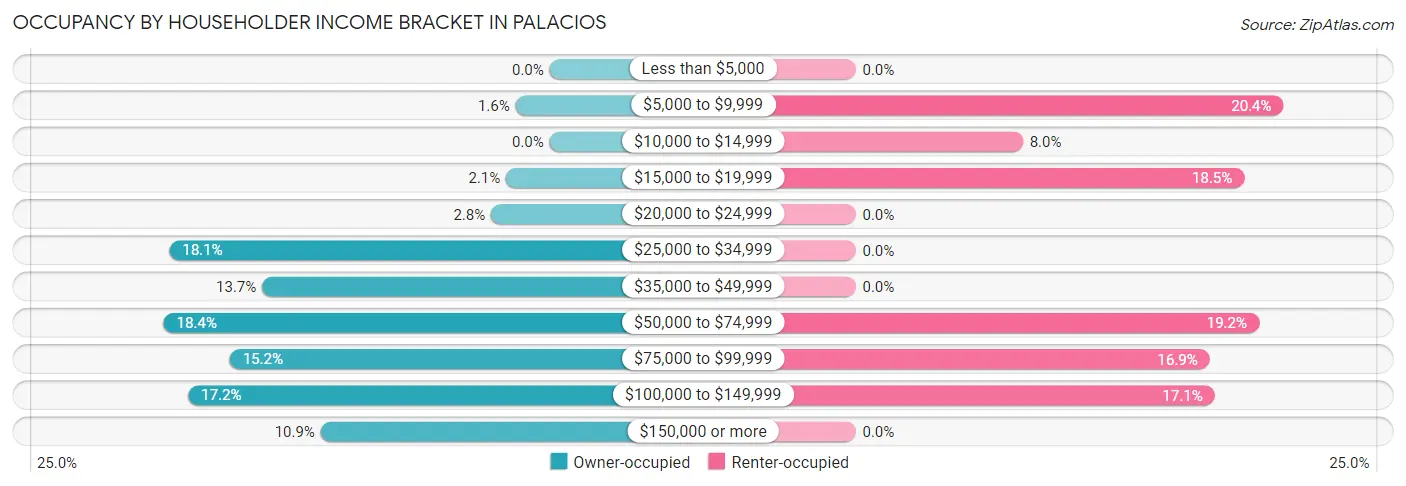
| Income Bracket | Owner-occupied | Renter-occupied |
| Less than $5,000 | 0 (0.0%) | 0 (0.0%) |
| $5,000 to $9,999 | 18 (1.6%) | 87 (20.4%) |
| $10,000 to $14,999 | 0 (0.0%) | 34 (8.0%) |
| $15,000 to $19,999 | 23 (2.1%) | 79 (18.5%) |
| $20,000 to $24,999 | 31 (2.8%) | 0 (0.0%) |
| $25,000 to $34,999 | 201 (18.1%) | 0 (0.0%) |
| $35,000 to $49,999 | 152 (13.7%) | 0 (0.0%) |
| $50,000 to $74,999 | 204 (18.4%) | 82 (19.2%) |
| $75,000 to $99,999 | 169 (15.2%) | 72 (16.9%) |
| $100,000 to $149,999 | 191 (17.2%) | 73 (17.1%) |
| $150,000 or more | 121 (10.9%) | 0 (0.0%) |
| Total | 1,110 (100.0%) | 427 (100.0%) |
Monthly Housing Cost Tiers in Palacios
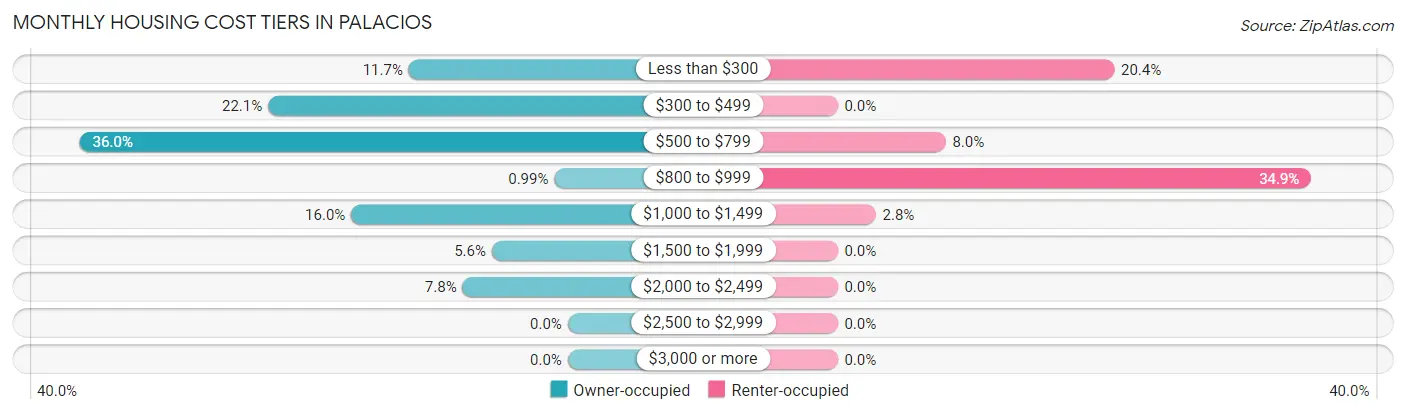
| Monthly Cost | Owner-occupied | Renter-occupied |
| Less than $300 | 130 (11.7%) | 87 (20.4%) |
| $300 to $499 | 245 (22.1%) | 0 (0.0%) |
| $500 to $799 | 399 (35.9%) | 34 (8.0%) |
| $800 to $999 | 11 (1.0%) | 149 (34.9%) |
| $1,000 to $1,499 | 177 (16.0%) | 12 (2.8%) |
| $1,500 to $1,999 | 62 (5.6%) | 0 (0.0%) |
| $2,000 to $2,499 | 86 (7.7%) | 0 (0.0%) |
| $2,500 to $2,999 | 0 (0.0%) | 0 (0.0%) |
| $3,000 or more | 0 (0.0%) | 0 (0.0%) |
| Total | 1,110 (100.0%) | 427 (100.0%) |
Physical Housing Characteristics in Palacios
Housing Structures in Palacios
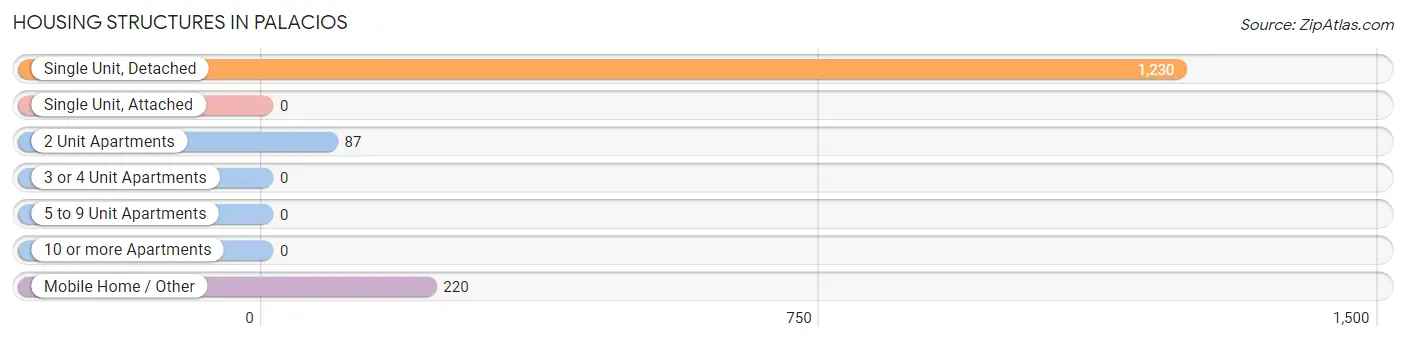
| Structure Type | # Housing Units | % Housing Units |
| Single Unit, Detached | 1,230 | 80.0% |
| Single Unit, Attached | 0 | 0.0% |
| 2 Unit Apartments | 87 | 5.7% |
| 3 or 4 Unit Apartments | 0 | 0.0% |
| 5 to 9 Unit Apartments | 0 | 0.0% |
| 10 or more Apartments | 0 | 0.0% |
| Mobile Home / Other | 220 | 14.3% |
| Total | 1,537 | 100.0% |
Housing Structures by Occupancy in Palacios
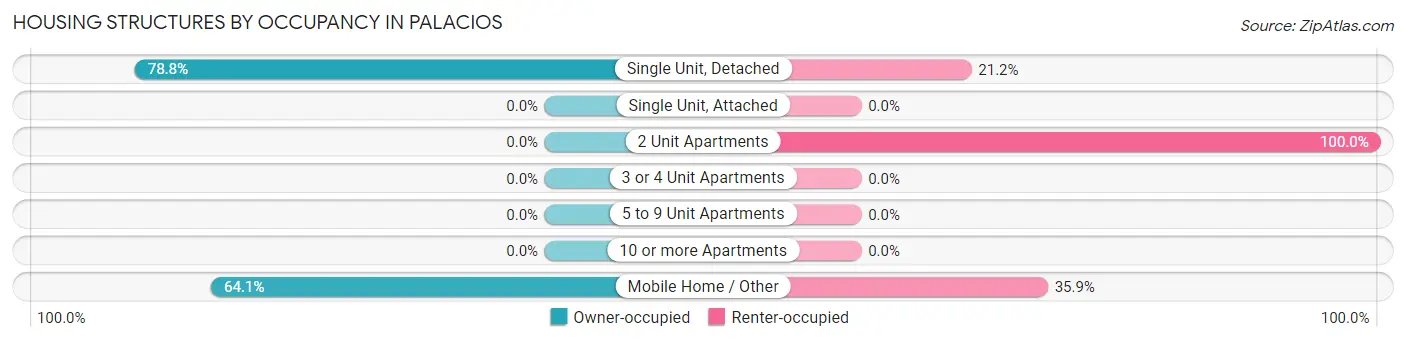
| Structure Type | Owner-occupied | Renter-occupied |
| Single Unit, Detached | 969 (78.8%) | 261 (21.2%) |
| Single Unit, Attached | 0 (0.0%) | 0 (0.0%) |
| 2 Unit Apartments | 0 (0.0%) | 87 (100.0%) |
| 3 or 4 Unit Apartments | 0 (0.0%) | 0 (0.0%) |
| 5 to 9 Unit Apartments | 0 (0.0%) | 0 (0.0%) |
| 10 or more Apartments | 0 (0.0%) | 0 (0.0%) |
| Mobile Home / Other | 141 (64.1%) | 79 (35.9%) |
| Total | 1,110 (72.2%) | 427 (27.8%) |
Housing Structures by Number of Rooms in Palacios
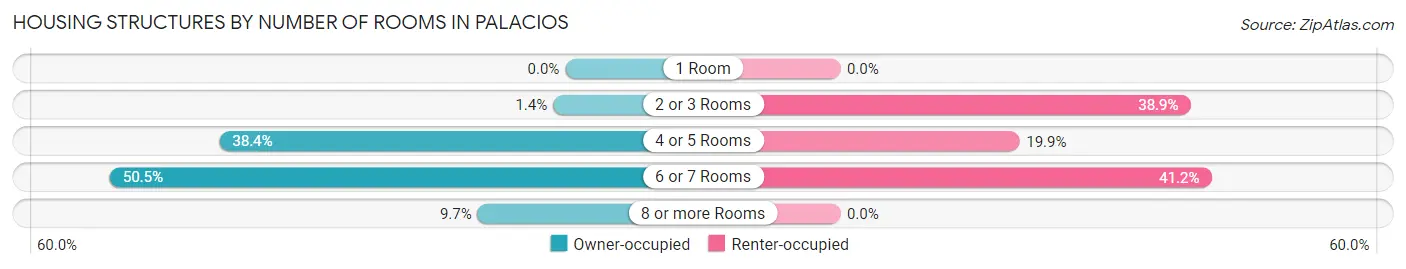
| Number of Rooms | Owner-occupied | Renter-occupied |
| 1 Room | 0 (0.0%) | 0 (0.0%) |
| 2 or 3 Rooms | 15 (1.3%) | 166 (38.9%) |
| 4 or 5 Rooms | 426 (38.4%) | 85 (19.9%) |
| 6 or 7 Rooms | 561 (50.5%) | 176 (41.2%) |
| 8 or more Rooms | 108 (9.7%) | 0 (0.0%) |
| Total | 1,110 (100.0%) | 427 (100.0%) |
Housing Structure by Heating Type in Palacios
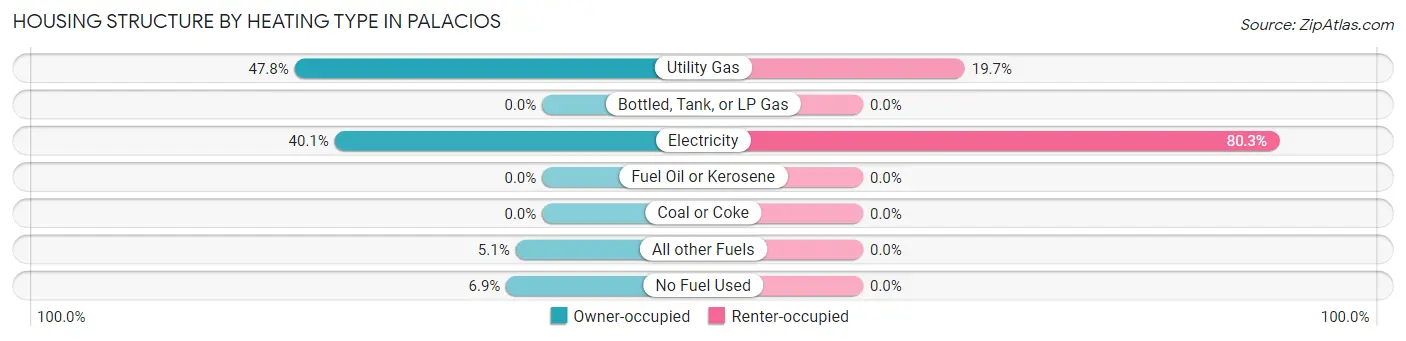
| Heating Type | Owner-occupied | Renter-occupied |
| Utility Gas | 531 (47.8%) | 84 (19.7%) |
| Bottled, Tank, or LP Gas | 0 (0.0%) | 0 (0.0%) |
| Electricity | 445 (40.1%) | 343 (80.3%) |
| Fuel Oil or Kerosene | 0 (0.0%) | 0 (0.0%) |
| Coal or Coke | 0 (0.0%) | 0 (0.0%) |
| All other Fuels | 57 (5.1%) | 0 (0.0%) |
| No Fuel Used | 77 (6.9%) | 0 (0.0%) |
| Total | 1,110 (100.0%) | 427 (100.0%) |
Household Vehicle Usage in Palacios
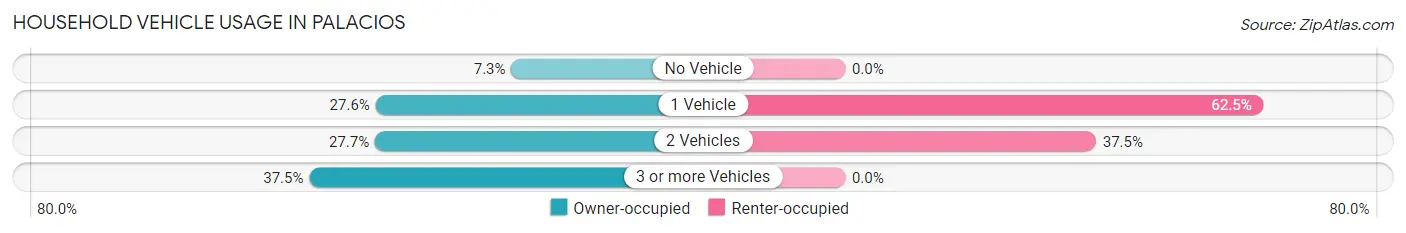
| Vehicles per Household | Owner-occupied | Renter-occupied |
| No Vehicle | 81 (7.3%) | 0 (0.0%) |
| 1 Vehicle | 306 (27.6%) | 267 (62.5%) |
| 2 Vehicles | 307 (27.7%) | 160 (37.5%) |
| 3 or more Vehicles | 416 (37.5%) | 0 (0.0%) |
| Total | 1,110 (100.0%) | 427 (100.0%) |
Real Estate & Mortgages in Palacios
Real Estate and Mortgage Overview in Palacios
| Characteristic | Without Mortgage | With Mortgage |
| Housing Units | 867 | 243 |
| Median Property Value | $178,000 | $0 |
| Median Household Income | $58,647 | $121 |
| Monthly Housing Costs | $530 | $0 |
| Real Estate Taxes | $1,778 | $0 |
Property Value by Mortgage Status in Palacios
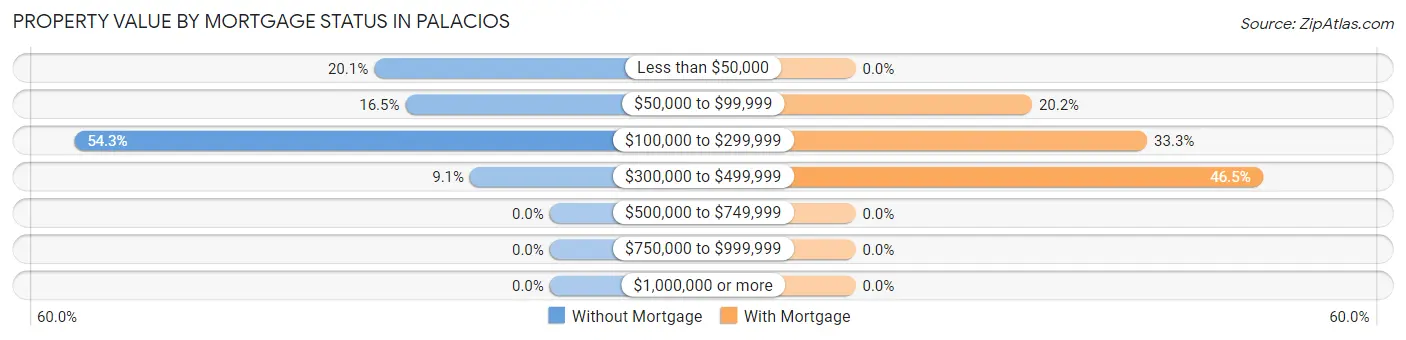
| Property Value | Without Mortgage | With Mortgage |
| Less than $50,000 | 174 (20.1%) | 0 (0.0%) |
| $50,000 to $99,999 | 143 (16.5%) | 49 (20.2%) |
| $100,000 to $299,999 | 471 (54.3%) | 81 (33.3%) |
| $300,000 to $499,999 | 79 (9.1%) | 113 (46.5%) |
| $500,000 to $749,999 | 0 (0.0%) | 0 (0.0%) |
| $750,000 to $999,999 | 0 (0.0%) | 0 (0.0%) |
| $1,000,000 or more | 0 (0.0%) | 0 (0.0%) |
| Total | 867 (100.0%) | 243 (100.0%) |
Household Income by Mortgage Status in Palacios
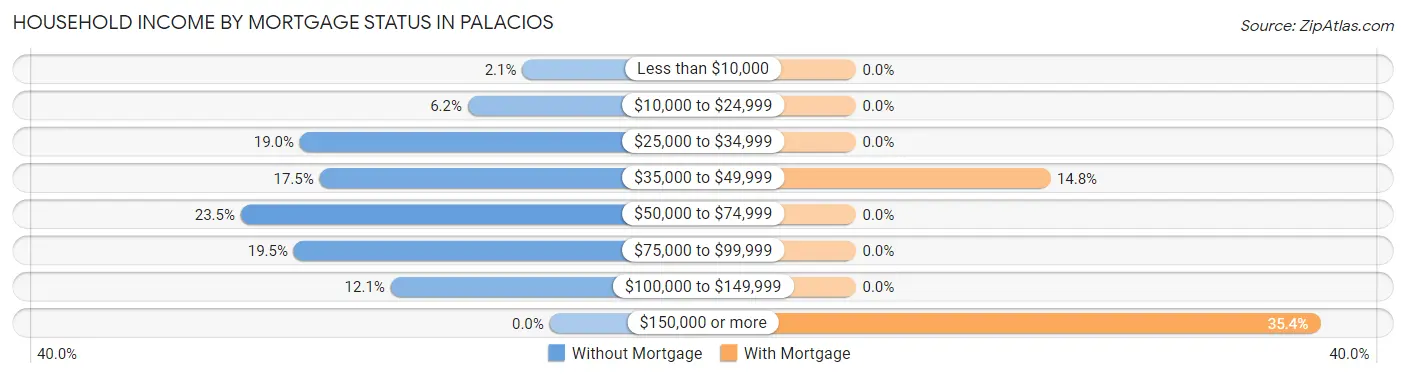
| Household Income | Without Mortgage | With Mortgage |
| Less than $10,000 | 18 (2.1%) | 0 (0.0%) |
| $10,000 to $24,999 | 54 (6.2%) | 0 (0.0%) |
| $25,000 to $34,999 | 165 (19.0%) | 0 (0.0%) |
| $35,000 to $49,999 | 152 (17.5%) | 36 (14.8%) |
| $50,000 to $74,999 | 204 (23.5%) | 0 (0.0%) |
| $75,000 to $99,999 | 169 (19.5%) | 0 (0.0%) |
| $100,000 to $149,999 | 105 (12.1%) | 0 (0.0%) |
| $150,000 or more | 0 (0.0%) | 86 (35.4%) |
| Total | 867 (100.0%) | 243 (100.0%) |
Property Value to Household Income Ratio in Palacios
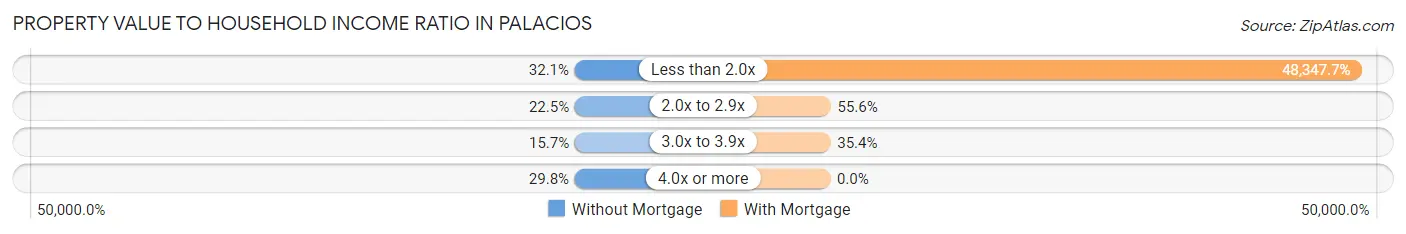
| Value-to-Income Ratio | Without Mortgage | With Mortgage |
| Less than 2.0x | 278 (32.1%) | 117,485 (48,347.7%) |
| 2.0x to 2.9x | 195 (22.5%) | 135 (55.6%) |
| 3.0x to 3.9x | 136 (15.7%) | 86 (35.4%) |
| 4.0x or more | 258 (29.8%) | 0 (0.0%) |
| Total | 867 (100.0%) | 243 (100.0%) |
Real Estate Taxes by Mortgage Status in Palacios
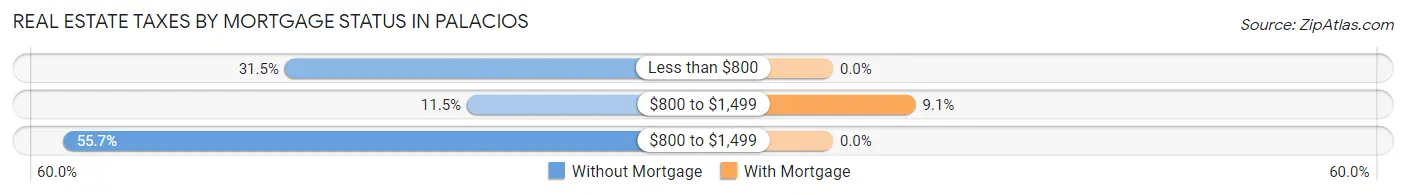
| Property Taxes | Without Mortgage | With Mortgage |
| Less than $800 | 273 (31.5%) | 0 (0.0%) |
| $800 to $1,499 | 100 (11.5%) | 22 (9.0%) |
| $800 to $1,499 | 483 (55.7%) | 0 (0.0%) |
| Total | 867 (100.0%) | 243 (100.0%) |
Health & Disability in Palacios
Health Insurance Coverage by Age in Palacios
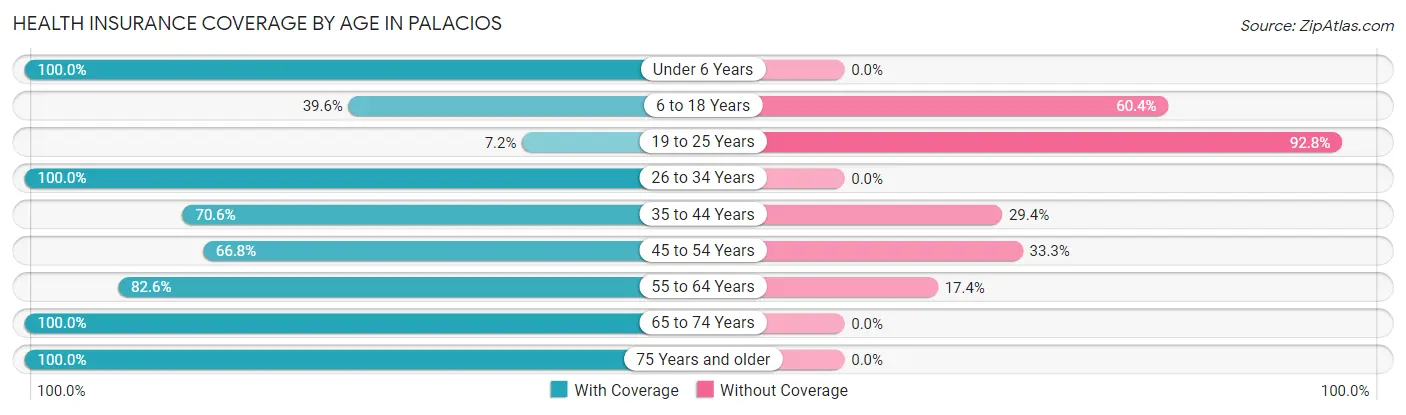
| Age Bracket | With Coverage | Without Coverage |
| Under 6 Years | 375 (100.0%) | 0 (0.0%) |
| 6 to 18 Years | 250 (39.6%) | 382 (60.4%) |
| 19 to 25 Years | 20 (7.2%) | 258 (92.8%) |
| 26 to 34 Years | 544 (100.0%) | 0 (0.0%) |
| 35 to 44 Years | 552 (70.6%) | 230 (29.4%) |
| 45 to 54 Years | 269 (66.7%) | 134 (33.3%) |
| 55 to 64 Years | 550 (82.6%) | 116 (17.4%) |
| 65 to 74 Years | 503 (100.0%) | 0 (0.0%) |
| 75 Years and older | 220 (100.0%) | 0 (0.0%) |
| Total | 3,283 (74.6%) | 1,120 (25.4%) |
Health Insurance Coverage by Citizenship Status in Palacios
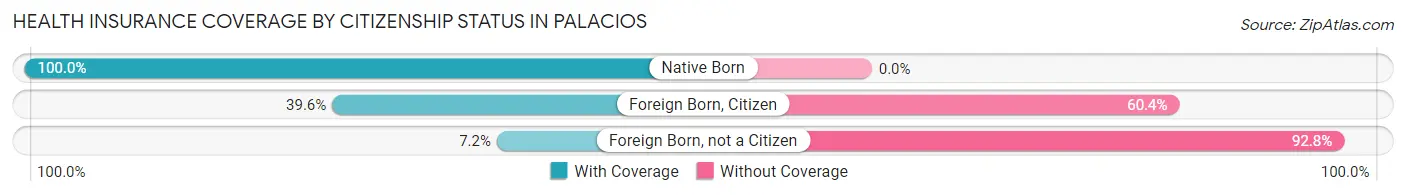
| Citizenship Status | With Coverage | Without Coverage |
| Native Born | 375 (100.0%) | 0 (0.0%) |
| Foreign Born, Citizen | 250 (39.6%) | 382 (60.4%) |
| Foreign Born, not a Citizen | 20 (7.2%) | 258 (92.8%) |
Health Insurance Coverage by Household Income in Palacios
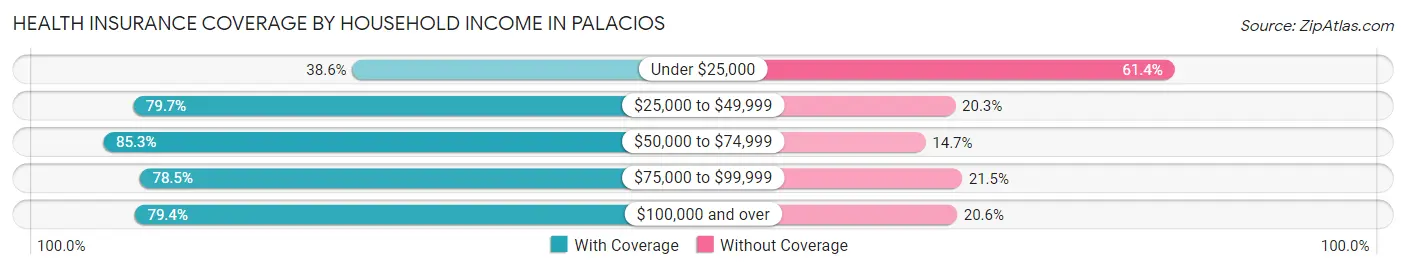
| Household Income | With Coverage | Without Coverage |
| Under $25,000 | 250 (38.6%) | 398 (61.4%) |
| $25,000 to $49,999 | 609 (79.7%) | 155 (20.3%) |
| $50,000 to $74,999 | 811 (85.3%) | 140 (14.7%) |
| $75,000 to $99,999 | 550 (78.5%) | 151 (21.5%) |
| $100,000 and over | 1,063 (79.4%) | 276 (20.6%) |
Public vs Private Health Insurance Coverage by Age in Palacios
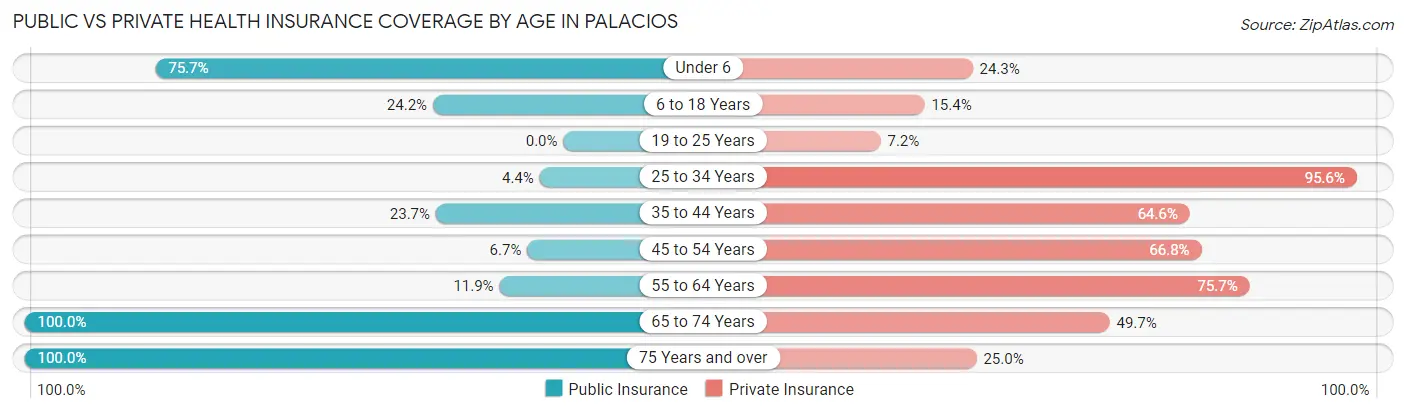
| Age Bracket | Public Insurance | Private Insurance |
| Under 6 | 284 (75.7%) | 91 (24.3%) |
| 6 to 18 Years | 153 (24.2%) | 97 (15.3%) |
| 19 to 25 Years | 0 (0.0%) | 20 (7.2%) |
| 25 to 34 Years | 24 (4.4%) | 520 (95.6%) |
| 35 to 44 Years | 185 (23.7%) | 505 (64.6%) |
| 45 to 54 Years | 27 (6.7%) | 269 (66.7%) |
| 55 to 64 Years | 79 (11.9%) | 504 (75.7%) |
| 65 to 74 Years | 503 (100.0%) | 250 (49.7%) |
| 75 Years and over | 220 (100.0%) | 55 (25.0%) |
| Total | 1,475 (33.5%) | 2,311 (52.5%) |
Disability Status by Sex by Age in Palacios
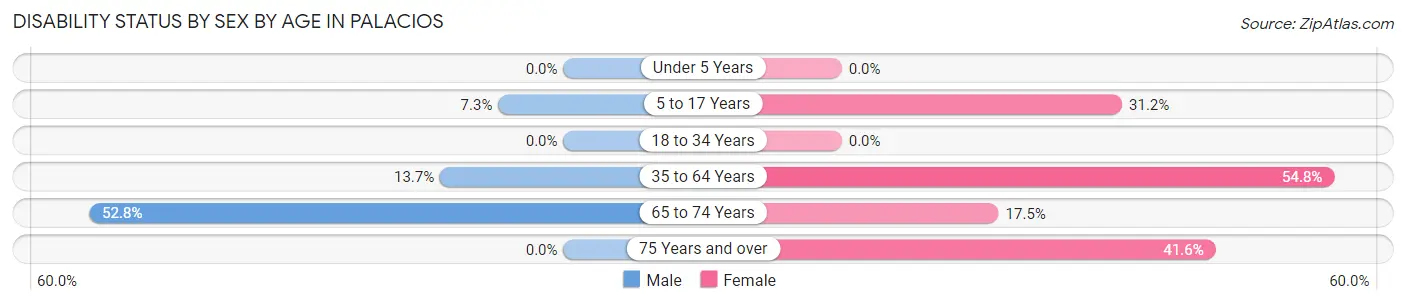
| Age Bracket | Male | Female |
| Under 5 Years | 0 (0.0%) | 0 (0.0%) |
| 5 to 17 Years | 38 (7.2%) | 69 (31.2%) |
| 18 to 34 Years | 0 (0.0%) | 0 (0.0%) |
| 35 to 64 Years | 149 (13.7%) | 420 (54.8%) |
| 65 to 74 Years | 178 (52.8%) | 29 (17.5%) |
| 75 Years and over | 0 (0.0%) | 72 (41.6%) |
Disability Class by Sex by Age in Palacios
Disability Class: Hearing Difficulty
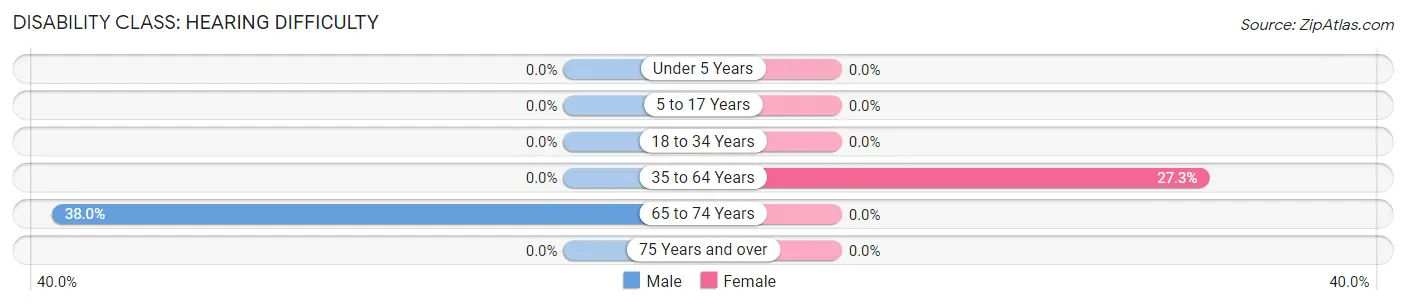
| Age Bracket | Male | Female |
| Under 5 Years | 0 (0.0%) | 0 (0.0%) |
| 5 to 17 Years | 0 (0.0%) | 0 (0.0%) |
| 18 to 34 Years | 0 (0.0%) | 0 (0.0%) |
| 35 to 64 Years | 0 (0.0%) | 209 (27.3%) |
| 65 to 74 Years | 128 (38.0%) | 0 (0.0%) |
| 75 Years and over | 0 (0.0%) | 0 (0.0%) |
Disability Class: Vision Difficulty
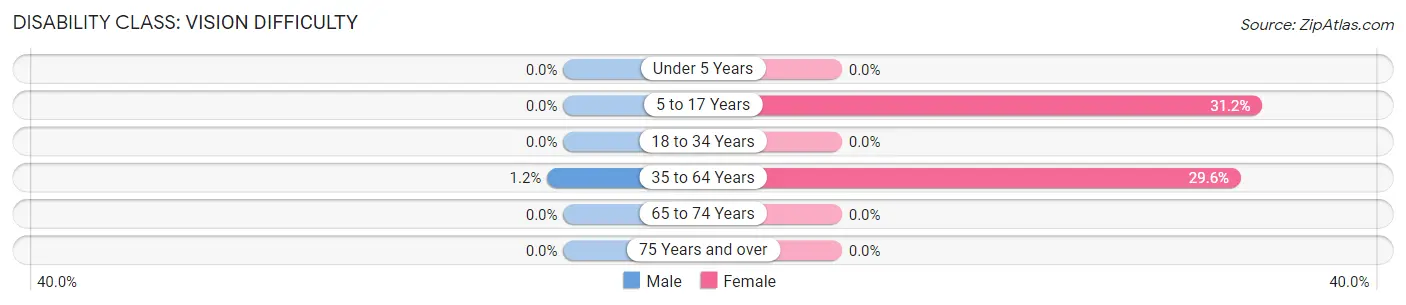
| Age Bracket | Male | Female |
| Under 5 Years | 0 (0.0%) | 0 (0.0%) |
| 5 to 17 Years | 0 (0.0%) | 69 (31.2%) |
| 18 to 34 Years | 0 (0.0%) | 0 (0.0%) |
| 35 to 64 Years | 13 (1.2%) | 227 (29.6%) |
| 65 to 74 Years | 0 (0.0%) | 0 (0.0%) |
| 75 Years and over | 0 (0.0%) | 0 (0.0%) |
Disability Class: Cognitive Difficulty
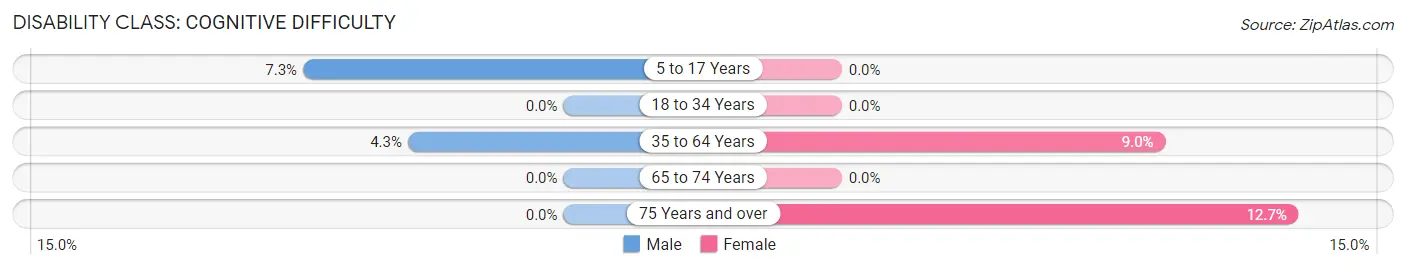
| Age Bracket | Male | Female |
| 5 to 17 Years | 38 (7.2%) | 0 (0.0%) |
| 18 to 34 Years | 0 (0.0%) | 0 (0.0%) |
| 35 to 64 Years | 47 (4.3%) | 69 (9.0%) |
| 65 to 74 Years | 0 (0.0%) | 0 (0.0%) |
| 75 Years and over | 0 (0.0%) | 22 (12.7%) |
Disability Class: Ambulatory Difficulty
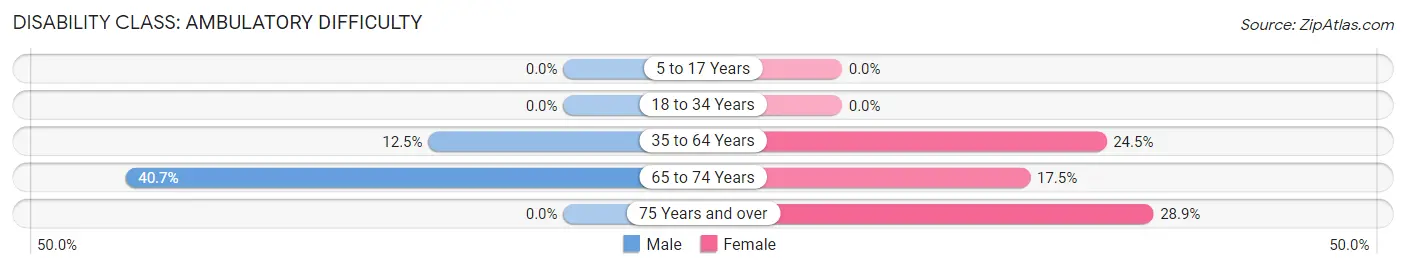
| Age Bracket | Male | Female |
| 5 to 17 Years | 0 (0.0%) | 0 (0.0%) |
| 18 to 34 Years | 0 (0.0%) | 0 (0.0%) |
| 35 to 64 Years | 136 (12.5%) | 188 (24.5%) |
| 65 to 74 Years | 137 (40.6%) | 29 (17.5%) |
| 75 Years and over | 0 (0.0%) | 50 (28.9%) |
Disability Class: Self-Care Difficulty
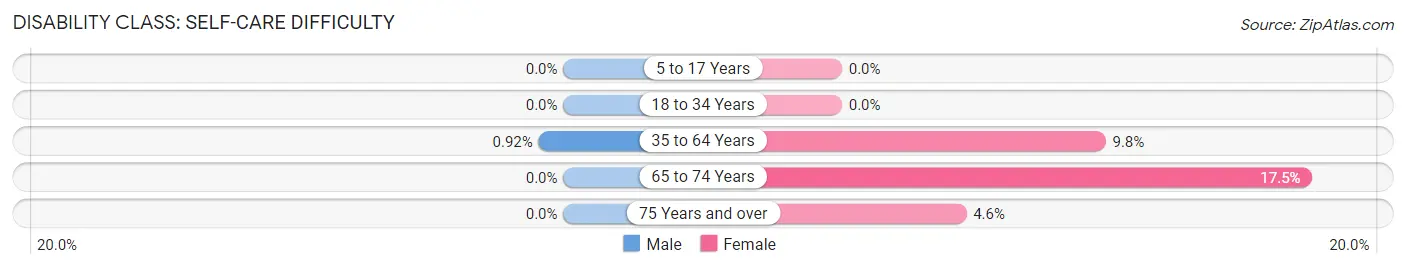
| Age Bracket | Male | Female |
| 5 to 17 Years | 0 (0.0%) | 0 (0.0%) |
| 18 to 34 Years | 0 (0.0%) | 0 (0.0%) |
| 35 to 64 Years | 10 (0.9%) | 75 (9.8%) |
| 65 to 74 Years | 0 (0.0%) | 29 (17.5%) |
| 75 Years and over | 0 (0.0%) | 8 (4.6%) |
Technology Access in Palacios
Computing Device Access in Palacios
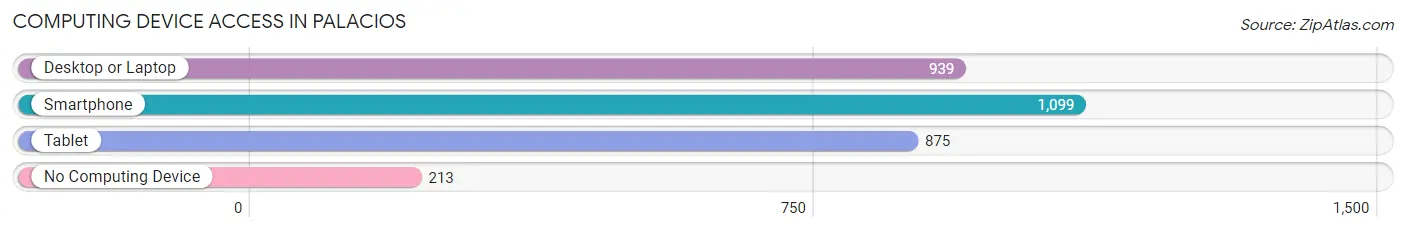
| Device Type | # Households | % Households |
| Desktop or Laptop | 939 | 61.1% |
| Smartphone | 1,099 | 71.5% |
| Tablet | 875 | 56.9% |
| No Computing Device | 213 | 13.9% |
| Total | 1,537 | 100.0% |
Internet Access in Palacios
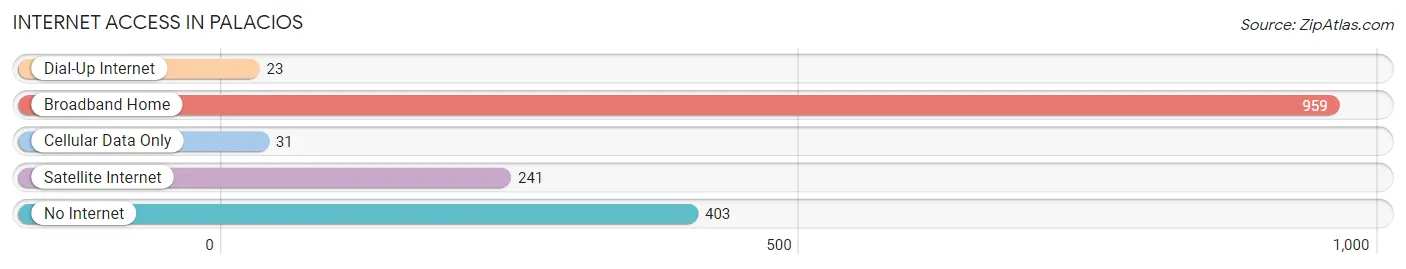
| Internet Type | # Households | % Households |
| Dial-Up Internet | 23 | 1.5% |
| Broadband Home | 959 | 62.4% |
| Cellular Data Only | 31 | 2.0% |
| Satellite Internet | 241 | 15.7% |
| No Internet | 403 | 26.2% |
| Total | 1,537 | 100.0% |
Palacios Summary
Palacios, Texas is a small city located in Matagorda County, Texas. It is situated on the Gulf Coast, approximately 90 miles southeast of Houston. The city has a population of approximately 4,500 people and is known for its fishing, shrimping, and oyster industries.
History
The area that is now Palacios was originally inhabited by the Karankawa Indians. The first European settlers arrived in the area in the late 1800s. The city was founded in 1894 by a group of investors led by Captain William A. Palacios. The city was named after the captain, who was a prominent businessman in the area.
The city was incorporated in 1909 and quickly became a thriving port town. The port was used to transport goods from the nearby oil fields and to ship out seafood from the local fishing industry. The city also became a popular tourist destination, with many people coming to enjoy the beaches and the fishing.
In the early 1900s, the city was hit hard by a series of hurricanes. The city was rebuilt and continued to grow, but the population never reached the levels it had before the storms.
Geography
Palacios is located on the Gulf Coast of Texas, approximately 90 miles southeast of Houston. The city is situated on the Matagorda Peninsula, which is bordered by Matagorda Bay to the east and Tres Palacios Bay to the west. The city is surrounded by wetlands and is home to several wildlife refuges.
The climate in Palacios is subtropical, with hot summers and mild winters. The average temperature in the summer is around 90 degrees Fahrenheit, while the average temperature in the winter is around 60 degrees Fahrenheit.
Economy
The economy of Palacios is largely based on the fishing and shrimping industries. The city is home to several seafood processing plants, which employ many of the local residents. The city is also home to several boatyards, which build and repair boats for the fishing industry.
The city is also home to several tourist attractions, including the Palacios Maritime Museum and the Palacios Beach Park. The city also hosts several festivals throughout the year, including the annual Shrimporee Festival.
Demographics
As of the 2010 census, the population of Palacios was 4,479. The racial makeup of the city was 73.3% White, 0.7% African American, 0.3% Native American, 0.2% Asian, 0.1% Pacific Islander, 22.7% from other races, and 2.7% from two or more races. Hispanic or Latino of any race were 44.2% of the population.
The median household income in Palacios was $35,938, and the median family income was $41,944. The per capita income for the city was $17,845. About 18.2% of the population was below the poverty line.
Palacios is a small city with a rich history and a vibrant economy. The city is home to a diverse population and is known for its fishing and shrimping industries. The city is also a popular tourist destination, with many people coming to enjoy the beaches and the fishing.
Common Questions
What is Per Capita Income in Palacios?
Per Capita income in Palacios is $26,731.
What is the Median Family Income in Palacios?
Median Family Income in Palacios is $67,093.
What is the Median Household income in Palacios?
Median Household Income in Palacios is $59,469.
What is Income or Wage Gap in Palacios?
Income or Wage Gap in Palacios is 42.6%.
Women in Palacios earn 57.4 cents for every dollar earned by a man.
What is Inequality or Gini Index in Palacios?
Inequality or Gini Index in Palacios is 0.37.
What is the Total Population of Palacios?
Total Population of Palacios is 4,411.
What is the Total Male Population of Palacios?
Total Male Population of Palacios is 2,770.
What is the Total Female Population of Palacios?
Total Female Population of Palacios is 1,641.
What is the Ratio of Males per 100 Females in Palacios?
There are 168.80 Males per 100 Females in Palacios.
What is the Ratio of Females per 100 Males in Palacios?
There are 59.24 Females per 100 Males in Palacios.
What is the Median Population Age in Palacios?
Median Population Age in Palacios is 40.5 Years.
What is the Average Family Size in Palacios
Average Family Size in Palacios is 3.6 People.
What is the Average Household Size in Palacios
Average Household Size in Palacios is 2.9 People.
How Large is the Labor Force in Palacios?
There are 2,116 People in the Labor Forcein in Palacios.
What is the Percentage of People in the Labor Force in Palacios?
61.1% of People are in the Labor Force in Palacios.