Zip Codes with the Highest Percentage of Population Employed in Installation, Maintenance & Repair in Missouri City, TX
RELATED REPORTS & OPTIONS
Installation, Maintenance & Repair
Missouri City
Compare Zip Codes
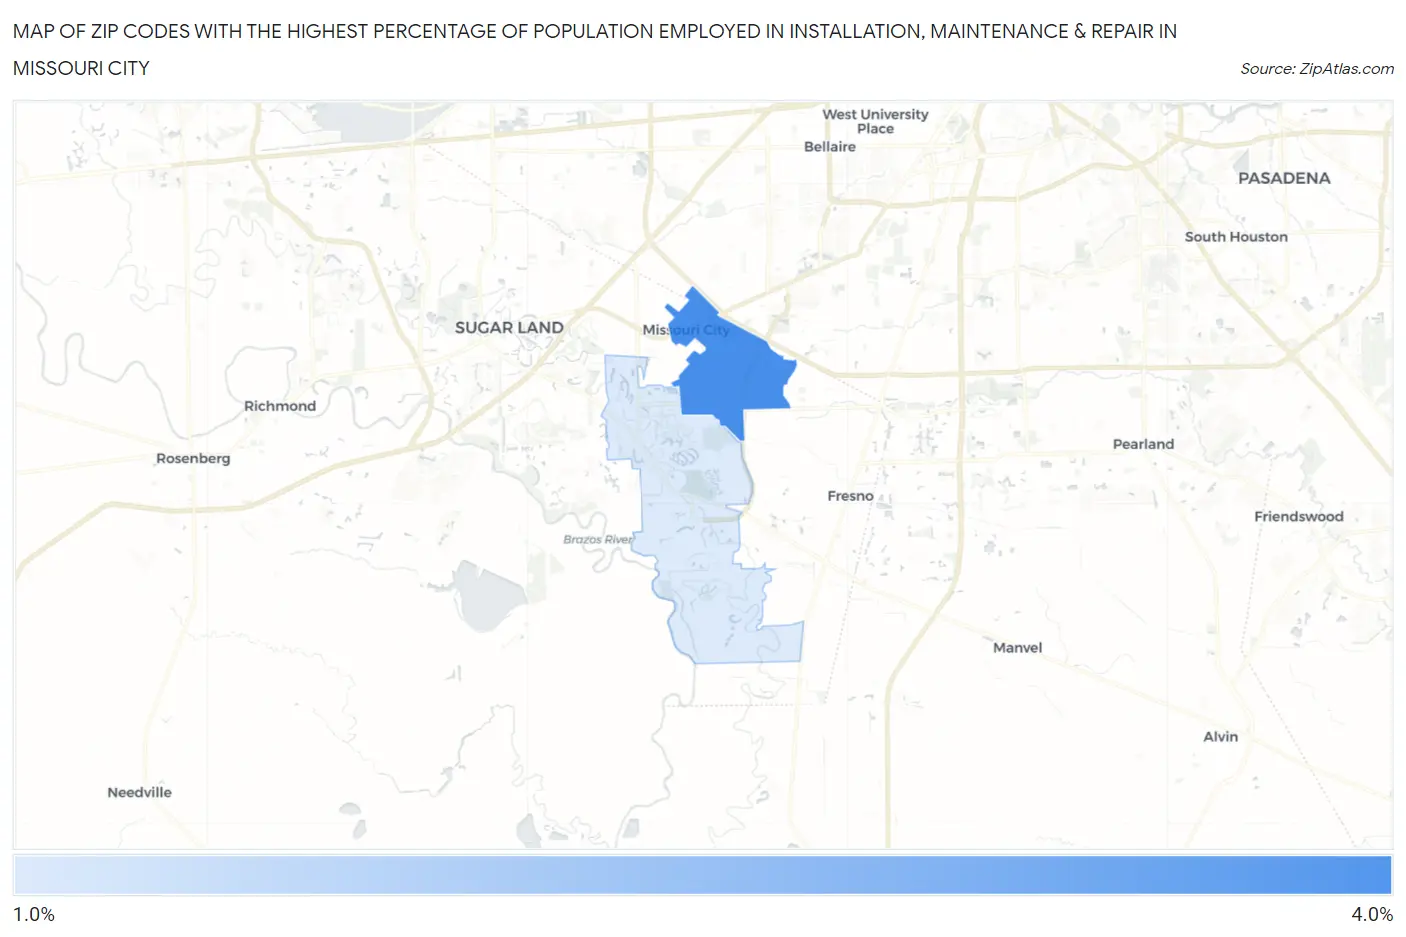
Map of Zip Codes with the Highest Percentage of Population Employed in Installation, Maintenance & Repair in Missouri City
1.3%
3.4%
Zip Codes with the Highest Percentage of Population Employed in Installation, Maintenance & Repair in Missouri City, TX
| Zip Code | % Employed | vs State | vs National | |
| 1. | 77489 | 3.4% | 3.4%(+0.019)#926 | 3.1%(+0.355)#14,985 |
| 2. | 77459 | 1.3% | 3.4%(-2.15)#1,496 | 3.1%(-1.81)#25,048 |
1
Common Questions
What are the Top Zip Codes with the Highest Percentage of Population Employed in Installation, Maintenance & Repair in Missouri City, TX?
Top Zip Codes with the Highest Percentage of Population Employed in Installation, Maintenance & Repair in Missouri City, TX are:
What zip code has the Highest Percentage of Population Employed in Installation, Maintenance & Repair in Missouri City, TX?
77489 has the Highest Percentage of Population Employed in Installation, Maintenance & Repair in Missouri City, TX with 3.4%.
What is the Percentage of Population Employed in Installation, Maintenance & Repair in Missouri City, TX?
Percentage of Population Employed in Installation, Maintenance & Repair in Missouri City is 2.2%.
What is the Percentage of Population Employed in Installation, Maintenance & Repair in Texas?
Percentage of Population Employed in Installation, Maintenance & Repair in Texas is 3.4%.
What is the Percentage of Population Employed in Installation, Maintenance & Repair in the United States?
Percentage of Population Employed in Installation, Maintenance & Repair in the United States is 3.1%.