Lake Brownwood, TX Map & Demographics
Lake Brownwood Map
Lake Brownwood Overview
$34,890
PER CAPITA INCOME
$77,118
AVG FAMILY INCOME
$74,737
AVG HOUSEHOLD INCOME
29.5%
WAGE / INCOME GAP [ % ]
70.5¢/ $1
WAGE / INCOME GAP [ $ ]
0.40
INEQUALITY / GINI INDEX
1,699
TOTAL POPULATION
923
MALE POPULATION
776
FEMALE POPULATION
118.94
MALES / 100 FEMALES
84.07
FEMALES / 100 MALES
50.3
MEDIAN AGE
3.1
AVG FAMILY SIZE
2.3
AVG HOUSEHOLD SIZE
857
LABOR FORCE [ PEOPLE ]
62.4%
PERCENT IN LABOR FORCE
6.1%
UNEMPLOYMENT RATE
Income in Lake Brownwood
Income Overview in Lake Brownwood
Per Capita Income in Lake Brownwood is $34,890, while median incomes of families and households are $77,118 and $74,737 respectively.
| Characteristic | Number | Measure |
| Per Capita Income | 1,699 | $34,890 |
| Median Family Income | 427 | $77,118 |
| Mean Family Income | 427 | $87,066 |
| Median Household Income | 736 | $74,737 |
| Mean Household Income | 736 | $78,364 |
| Income Deficit | 427 | $0 |
| Wage / Income Gap (%) | 1,699 | 29.53% |
| Wage / Income Gap ($) | 1,699 | 70.47¢ per $1 |
| Gini / Inequality Index | 1,699 | 0.40 |
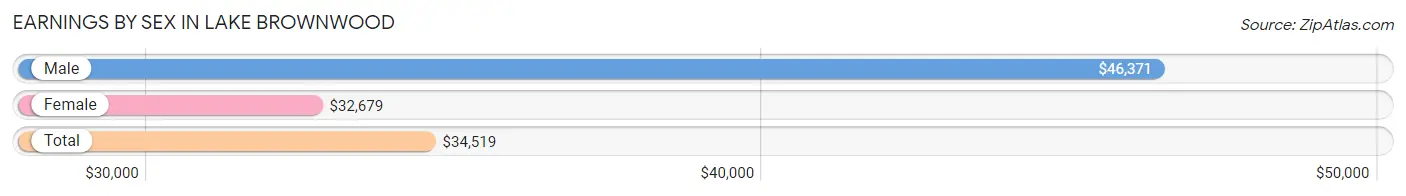
Earnings by Sex in Lake Brownwood
Average Earnings in Lake Brownwood are $34,519, $46,371 for men and $32,679 for women, a difference of 29.5%.
| Sex | Number | Average Earnings |
| Male | 542 (60.2%) | $46,371 |
| Female | 359 (39.8%) | $32,679 |
| Total | 901 (100.0%) | $34,519 |
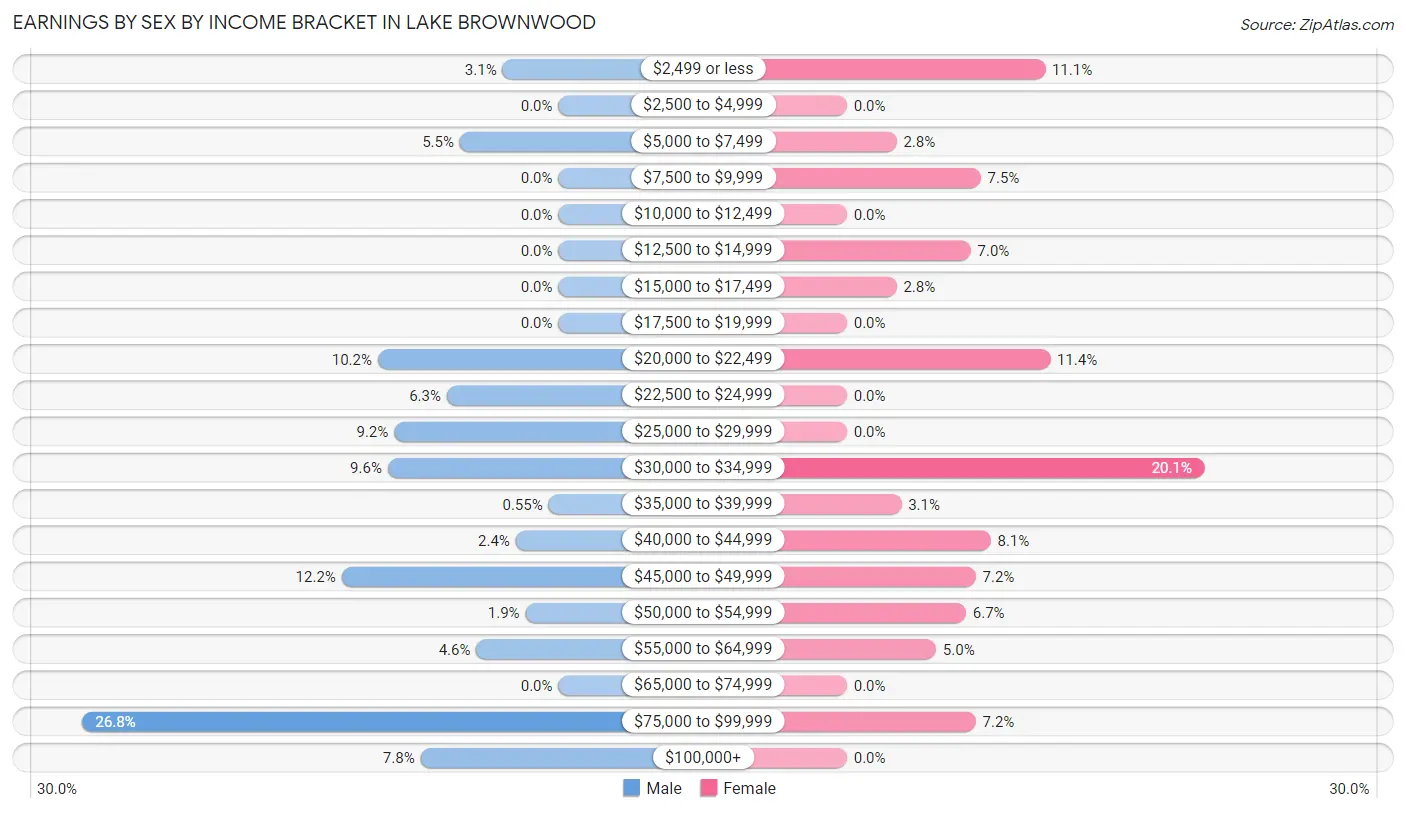
Earnings by Sex by Income Bracket in Lake Brownwood
The most common earnings brackets in Lake Brownwood are $75,000 to $99,999 for men (145 | 26.8%) and $30,000 to $34,999 for women (72 | 20.1%).
| Income | Male | Female |
| $2,499 or less | 17 (3.1%) | 40 (11.1%) |
| $2,500 to $4,999 | 0 (0.0%) | 0 (0.0%) |
| $5,000 to $7,499 | 30 (5.5%) | 10 (2.8%) |
| $7,500 to $9,999 | 0 (0.0%) | 27 (7.5%) |
| $10,000 to $12,499 | 0 (0.0%) | 0 (0.0%) |
| $12,500 to $14,999 | 0 (0.0%) | 25 (7.0%) |
| $15,000 to $17,499 | 0 (0.0%) | 10 (2.8%) |
| $17,500 to $19,999 | 0 (0.0%) | 0 (0.0%) |
| $20,000 to $22,499 | 55 (10.2%) | 41 (11.4%) |
| $22,500 to $24,999 | 34 (6.3%) | 0 (0.0%) |
| $25,000 to $29,999 | 50 (9.2%) | 0 (0.0%) |
| $30,000 to $34,999 | 52 (9.6%) | 72 (20.1%) |
| $35,000 to $39,999 | 3 (0.5%) | 11 (3.1%) |
| $40,000 to $44,999 | 13 (2.4%) | 29 (8.1%) |
| $45,000 to $49,999 | 66 (12.2%) | 26 (7.2%) |
| $50,000 to $54,999 | 10 (1.8%) | 24 (6.7%) |
| $55,000 to $64,999 | 25 (4.6%) | 18 (5.0%) |
| $65,000 to $74,999 | 0 (0.0%) | 0 (0.0%) |
| $75,000 to $99,999 | 145 (26.8%) | 26 (7.2%) |
| $100,000+ | 42 (7.7%) | 0 (0.0%) |
| Total | 542 (100.0%) | 359 (100.0%) |
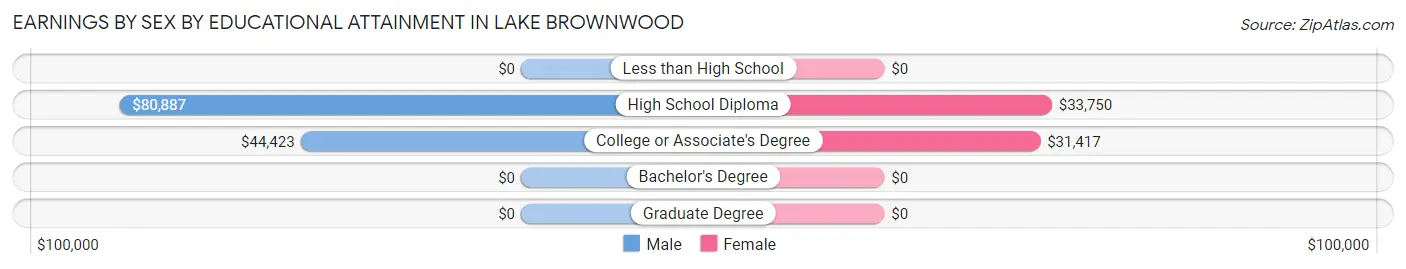
Earnings by Sex by Educational Attainment in Lake Brownwood
Average earnings in Lake Brownwood are $49,536 for men and $33,980 for women, a difference of 31.4%. Men with an educational attainment of high school diploma enjoy the highest average annual earnings of $80,887, while those with college or associate's degree education earn the least with $44,423. Women with an educational attainment of high school diploma earn the most with the average annual earnings of $33,750, while those with college or associate's degree education have the smallest earnings of $31,417.
| Educational Attainment | Male Income | Female Income |
| Less than High School | - | - |
| High School Diploma | $80,887 | $33,750 |
| College or Associate's Degree | $44,423 | $31,417 |
| Bachelor's Degree | - | - |
| Graduate Degree | - | - |
| Total | $49,536 | $33,980 |
Family Income in Lake Brownwood
Family Income Brackets in Lake Brownwood
According to the Lake Brownwood family income data, there are 100 families falling into the $100,000 to $149,999 income range, which is the most common income bracket and makes up 23.4% of all families. Conversely, the less than $10,000 income bracket is the least frequent group with only 14 families (3.3%) belonging to this category.
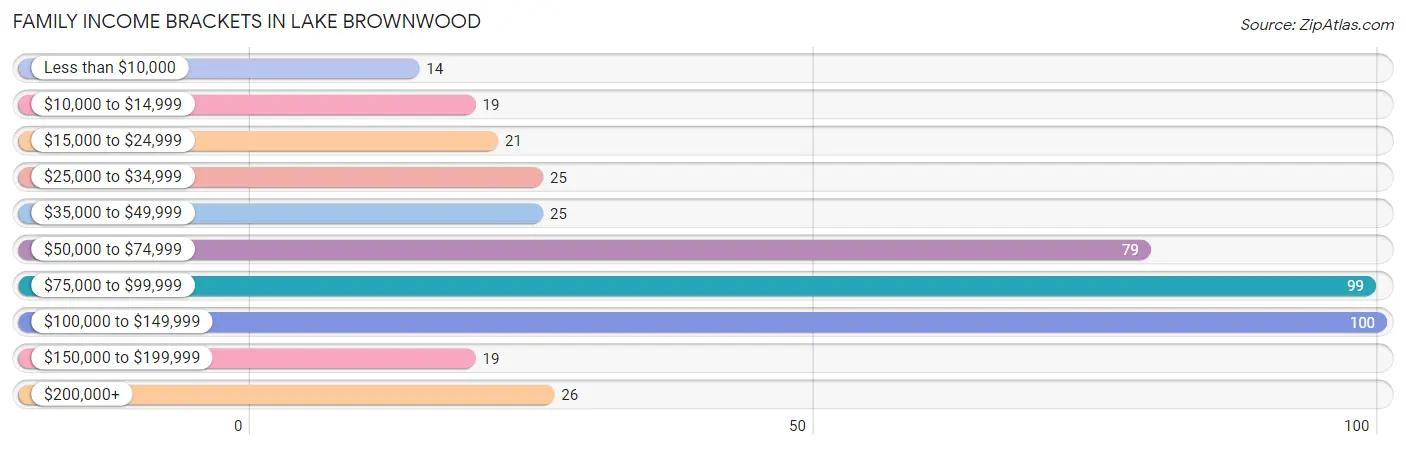
| Income Bracket | # Families | % Families |
| Less than $10,000 | 14 | 3.3% |
| $10,000 to $14,999 | 19 | 4.4% |
| $15,000 to $24,999 | 21 | 4.9% |
| $25,000 to $34,999 | 25 | 5.9% |
| $35,000 to $49,999 | 25 | 5.9% |
| $50,000 to $74,999 | 79 | 18.5% |
| $75,000 to $99,999 | 99 | 23.2% |
| $100,000 to $149,999 | 100 | 23.4% |
| $150,000 to $199,999 | 19 | 4.4% |
| $200,000+ | 26 | 6.1% |
Family Income by Famaliy Size in Lake Brownwood
2-person families (224 | 52.5%) account for the highest median family income in Lake Brownwood with $76,181 per family, while 2-person families (224 | 52.5%) have the highest median income of $38,090 per family member.
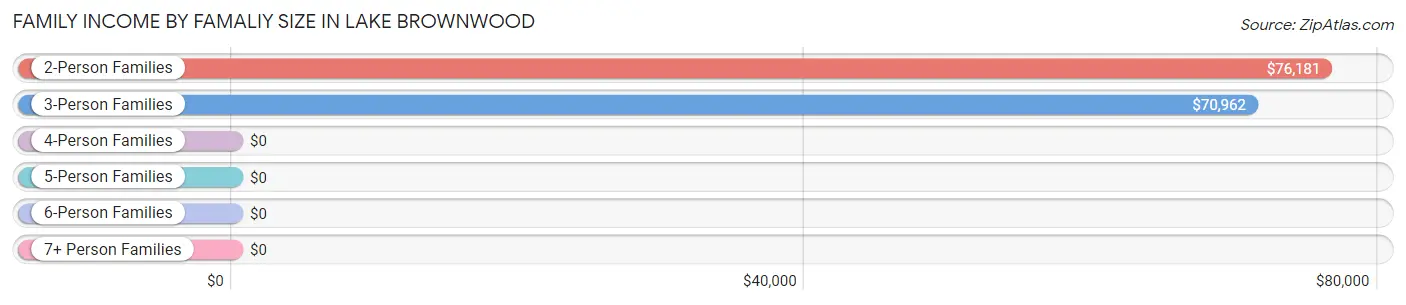
| Income Bracket | # Families | Median Income |
| 2-Person Families | 224 (52.5%) | $76,181 |
| 3-Person Families | 130 (30.4%) | $70,962 |
| 4-Person Families | 18 (4.2%) | $0 |
| 5-Person Families | 29 (6.8%) | $0 |
| 6-Person Families | 0 (0.0%) | $0 |
| 7+ Person Families | 26 (6.1%) | $0 |
| Total | 427 (100.0%) | $77,118 |
Family Income by Number of Earners in Lake Brownwood
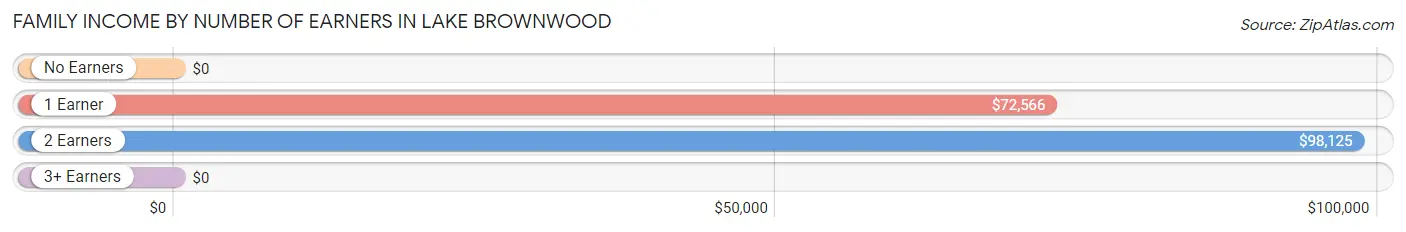
| Number of Earners | # Families | Median Income |
| No Earners | 39 (9.1%) | $0 |
| 1 Earner | 125 (29.3%) | $72,566 |
| 2 Earners | 234 (54.8%) | $98,125 |
| 3+ Earners | 29 (6.8%) | $0 |
| Total | 427 (100.0%) | $77,118 |
Household Income in Lake Brownwood
Household Income Brackets in Lake Brownwood
With 190 households falling in the category, the $75,000 to $99,999 income range is the most frequent in Lake Brownwood, accounting for 25.8% of all households. In contrast, only 14 households (1.9%) fall into the less than $10,000 income bracket, making it the least populous group.
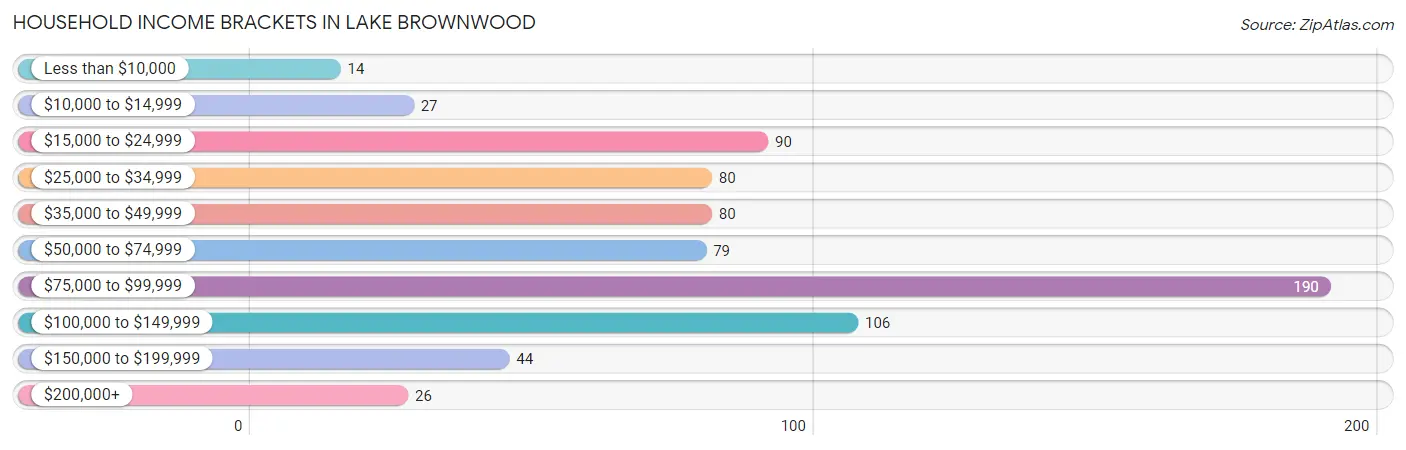
| Income Bracket | # Households | % Households |
| Less than $10,000 | 14 | 1.9% |
| $10,000 to $14,999 | 27 | 3.7% |
| $15,000 to $24,999 | 90 | 12.2% |
| $25,000 to $34,999 | 80 | 10.9% |
| $35,000 to $49,999 | 80 | 10.9% |
| $50,000 to $74,999 | 79 | 10.7% |
| $75,000 to $99,999 | 190 | 25.8% |
| $100,000 to $149,999 | 106 | 14.4% |
| $150,000 to $199,999 | 44 | 6.0% |
| $200,000+ | 26 | 3.5% |
Household Income by Householder Age in Lake Brownwood
The median household income in Lake Brownwood is $74,737, with the highest median household income of $98,854 found in the 25 to 44 years age bracket for the primary householder. A total of 117 households (15.9%) fall into this category.
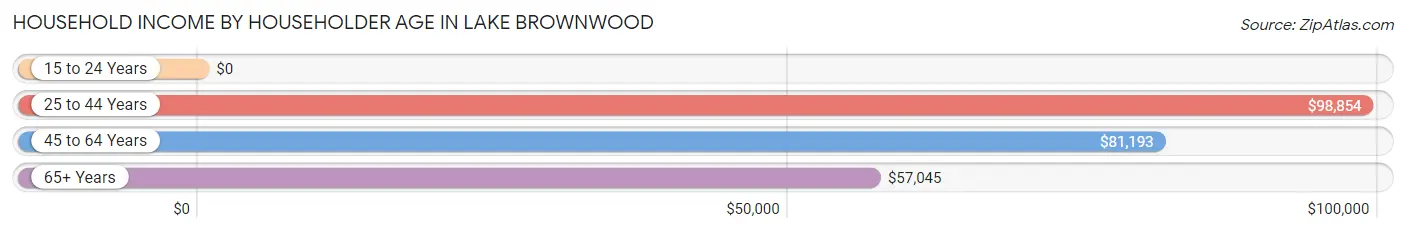
| Income Bracket | # Households | Median Income |
| 15 to 24 Years | 0 (0.0%) | $0 |
| 25 to 44 Years | 117 (15.9%) | $98,854 |
| 45 to 64 Years | 355 (48.2%) | $81,193 |
| 65+ Years | 264 (35.9%) | $57,045 |
| Total | 736 (100.0%) | $74,737 |
Poverty in Lake Brownwood
Income Below Poverty by Sex and Age in Lake Brownwood
With 12.0% poverty level for males and 13.5% for females among the residents of Lake Brownwood, 35 to 44 year old males and 12 to 14 year old females are the most vulnerable to poverty, with 45 males (65.2%) and 20 females (100.0%) in their respective age groups living below the poverty level.
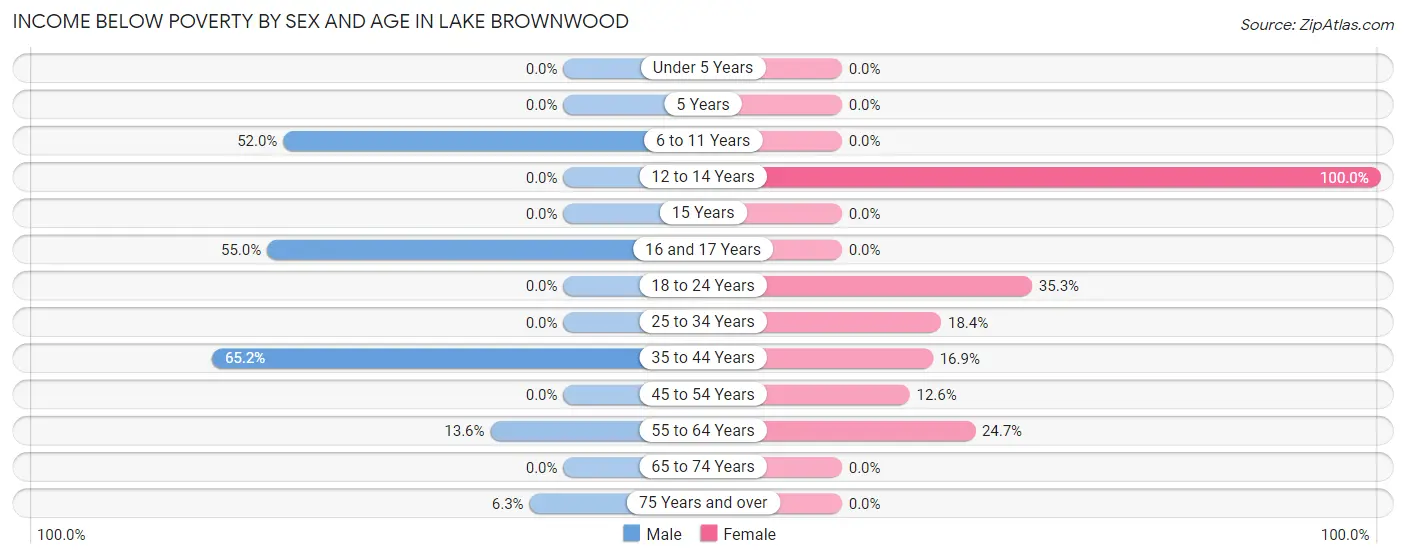
| Age Bracket | Male | Female |
| Under 5 Years | 0 (0.0%) | 0 (0.0%) |
| 5 Years | 0 (0.0%) | 0 (0.0%) |
| 6 to 11 Years | 26 (52.0%) | 0 (0.0%) |
| 12 to 14 Years | 0 (0.0%) | 20 (100.0%) |
| 15 Years | 0 (0.0%) | 0 (0.0%) |
| 16 and 17 Years | 11 (55.0%) | 0 (0.0%) |
| 18 to 24 Years | 0 (0.0%) | 18 (35.3%) |
| 25 to 34 Years | 0 (0.0%) | 14 (18.4%) |
| 35 to 44 Years | 45 (65.2%) | 13 (16.9%) |
| 45 to 54 Years | 0 (0.0%) | 19 (12.6%) |
| 55 to 64 Years | 21 (13.6%) | 21 (24.7%) |
| 65 to 74 Years | 0 (0.0%) | 0 (0.0%) |
| 75 Years and over | 8 (6.3%) | 0 (0.0%) |
| Total | 111 (12.0%) | 105 (13.5%) |
Income Above Poverty by Sex and Age in Lake Brownwood
According to the poverty statistics in Lake Brownwood, males aged under 5 years and females aged under 5 years are the age groups that are most secure financially, with 100.0% of males and 100.0% of females in these age groups living above the poverty line.
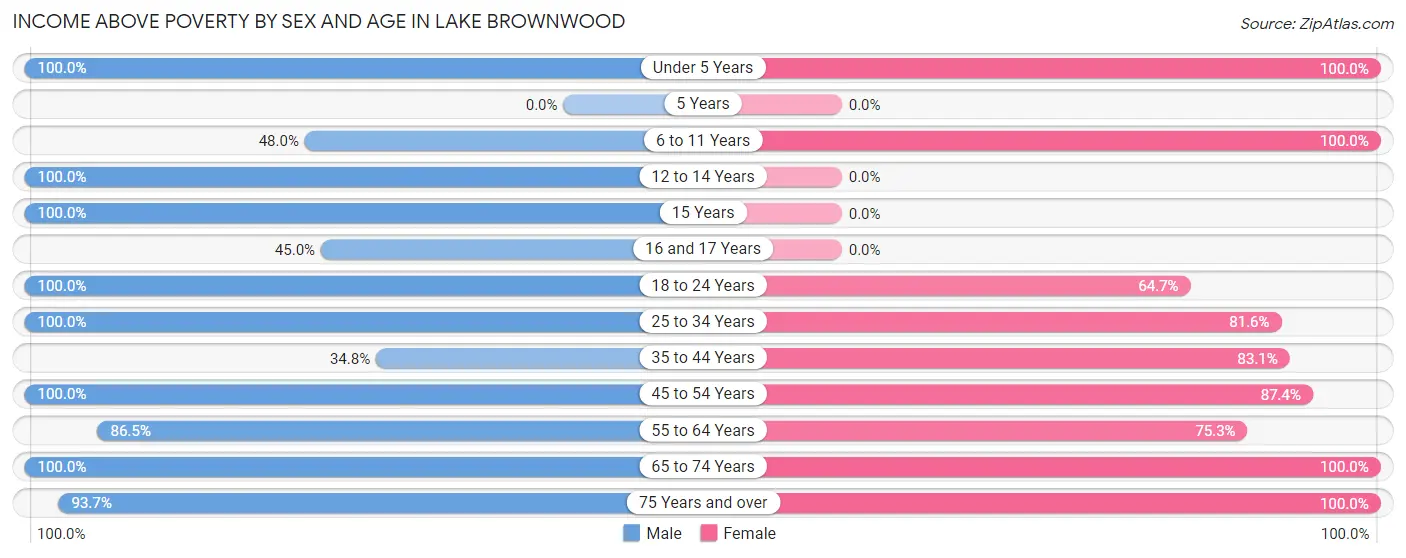
| Age Bracket | Male | Female |
| Under 5 Years | 54 (100.0%) | 129 (100.0%) |
| 5 Years | 0 (0.0%) | 0 (0.0%) |
| 6 to 11 Years | 24 (48.0%) | 39 (100.0%) |
| 12 to 14 Years | 24 (100.0%) | 0 (0.0%) |
| 15 Years | 9 (100.0%) | 0 (0.0%) |
| 16 and 17 Years | 9 (45.0%) | 0 (0.0%) |
| 18 to 24 Years | 76 (100.0%) | 33 (64.7%) |
| 25 to 34 Years | 60 (100.0%) | 62 (81.6%) |
| 35 to 44 Years | 24 (34.8%) | 64 (83.1%) |
| 45 to 54 Years | 163 (100.0%) | 132 (87.4%) |
| 55 to 64 Years | 134 (86.5%) | 64 (75.3%) |
| 65 to 74 Years | 116 (100.0%) | 124 (100.0%) |
| 75 Years and over | 119 (93.7%) | 24 (100.0%) |
| Total | 812 (88.0%) | 671 (86.5%) |
Income Below Poverty Among Married-Couple Families in Lake Brownwood
The poverty statistics for married-couple families in Lake Brownwood show that 10.3% or 36 of the total 351 families live below the poverty line. Families with 1 or 2 children have the highest poverty rate of 17.6%, comprising of 15 families. On the other hand, families with 3 or 4 children have the lowest poverty rate of 0.0%, which includes 0 families.
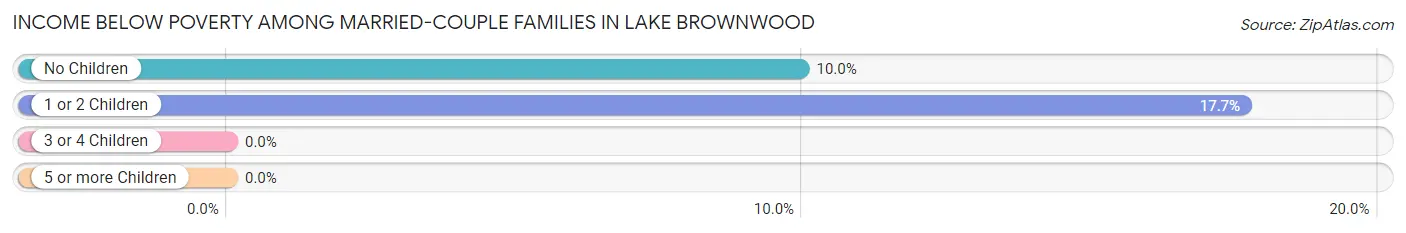
| Children | Above Poverty | Below Poverty |
| No Children | 190 (90.0%) | 21 (10.0%) |
| 1 or 2 Children | 70 (82.4%) | 15 (17.6%) |
| 3 or 4 Children | 55 (100.0%) | 0 (0.0%) |
| 5 or more Children | 0 (0.0%) | 0 (0.0%) |
| Total | 315 (89.7%) | 36 (10.3%) |
Income Below Poverty Among Single-Parent Households in Lake Brownwood
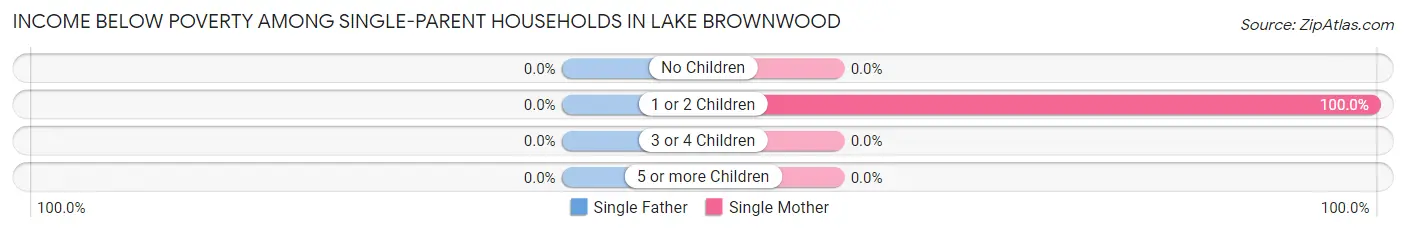
| Children | Single Father | Single Mother |
| No Children | 0 (0.0%) | 0 (0.0%) |
| 1 or 2 Children | 0 (0.0%) | 33 (100.0%) |
| 3 or 4 Children | 0 (0.0%) | 0 (0.0%) |
| 5 or more Children | 0 (0.0%) | 0 (0.0%) |
| Total | 0 (0.0%) | 33 (56.9%) |
Income Below Poverty Among Married-Couple vs Single-Parent Households in Lake Brownwood
The poverty data for Lake Brownwood shows that 36 of the married-couple family households (10.3%) and 33 of the single-parent households (43.4%) are living below the poverty level. Within the married-couple family households, those with 1 or 2 children have the highest poverty rate, with 15 households (17.6%) falling below the poverty line. Among the single-parent households, those with 1 or 2 children have the highest poverty rate, with 33 household (76.7%) living below poverty.
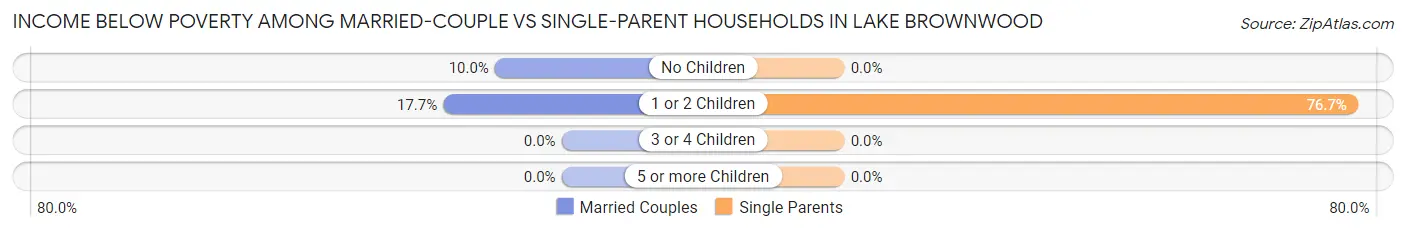
| Children | Married-Couple Families | Single-Parent Households |
| No Children | 21 (10.0%) | 0 (0.0%) |
| 1 or 2 Children | 15 (17.6%) | 33 (76.7%) |
| 3 or 4 Children | 0 (0.0%) | 0 (0.0%) |
| 5 or more Children | 0 (0.0%) | 0 (0.0%) |
| Total | 36 (10.3%) | 33 (43.4%) |
Race in Lake Brownwood
The most populous races in Lake Brownwood are White / Caucasian (1,619 | 95.3%), Hispanic or Latino (113 | 6.7%), and Two or more Races (80 | 4.7%).
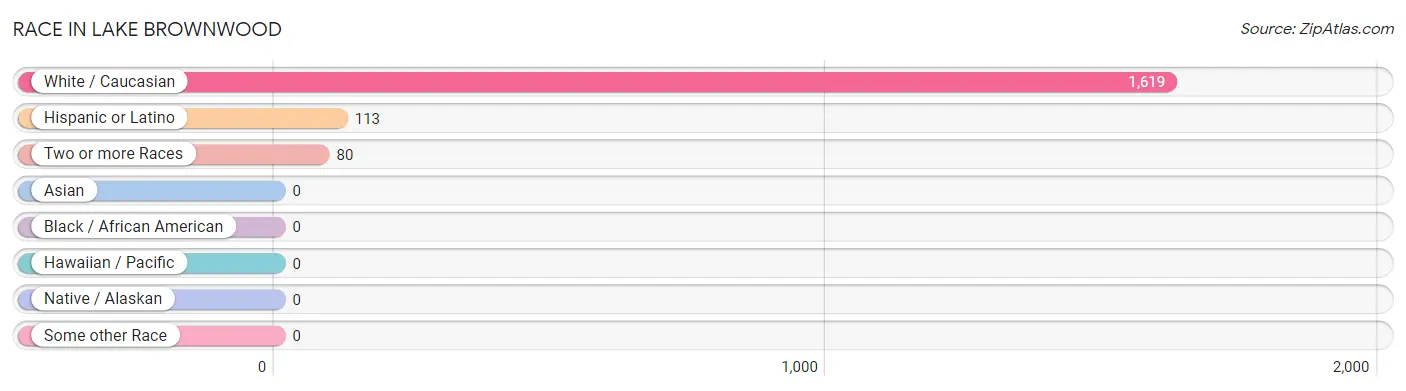
| Race | # Population | % Population |
| Asian | 0 | 0.0% |
| Black / African American | 0 | 0.0% |
| Hawaiian / Pacific | 0 | 0.0% |
| Hispanic or Latino | 113 | 6.7% |
| Native / Alaskan | 0 | 0.0% |
| White / Caucasian | 1,619 | 95.3% |
| Two or more Races | 80 | 4.7% |
| Some other Race | 0 | 0.0% |
| Total | 1,699 | 100.0% |
Ancestry in Lake Brownwood
The most populous ancestries reported in Lake Brownwood are European (414 | 24.4%), Irish (331 | 19.5%), German (306 | 18.0%), English (141 | 8.3%), and Mexican (113 | 6.7%), together accounting for 76.8% of all Lake Brownwood residents.
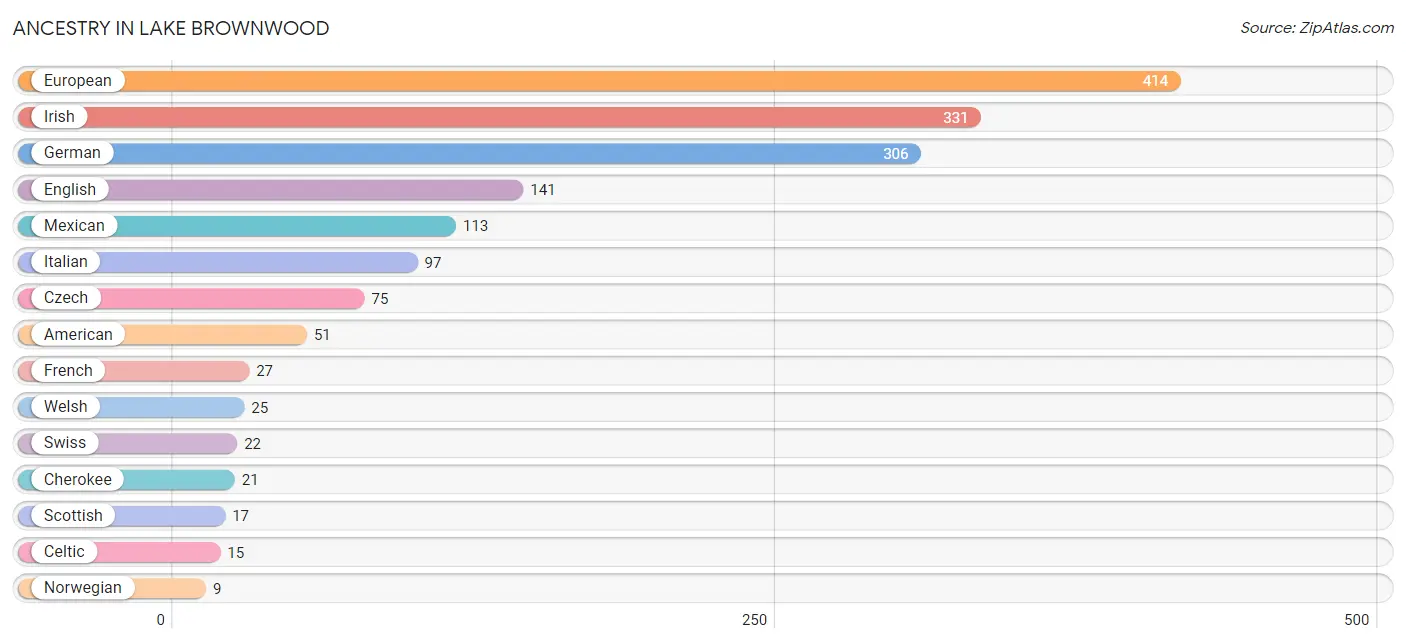
| Ancestry | # Population | % Population |
| American | 51 | 3.0% |
| Celtic | 15 | 0.9% |
| Cherokee | 21 | 1.2% |
| Czech | 75 | 4.4% |
| English | 141 | 8.3% |
| European | 414 | 24.4% |
| French | 27 | 1.6% |
| German | 306 | 18.0% |
| Irish | 331 | 19.5% |
| Italian | 97 | 5.7% |
| Mexican | 113 | 6.7% |
| Norwegian | 9 | 0.5% |
| Scottish | 17 | 1.0% |
| Swedish | 9 | 0.5% |
| Swiss | 22 | 1.3% |
| Welsh | 25 | 1.5% | View All 16 Rows |
Immigrants in Lake Brownwood

| Immigration Origin | # Population | % Population | View All 0 Rows |
Sex and Age in Lake Brownwood
Sex and Age in Lake Brownwood
The most populous age groups in Lake Brownwood are 50 to 54 Years (151 | 16.4%) for men and Under 5 Years (129 | 16.6%) for women.
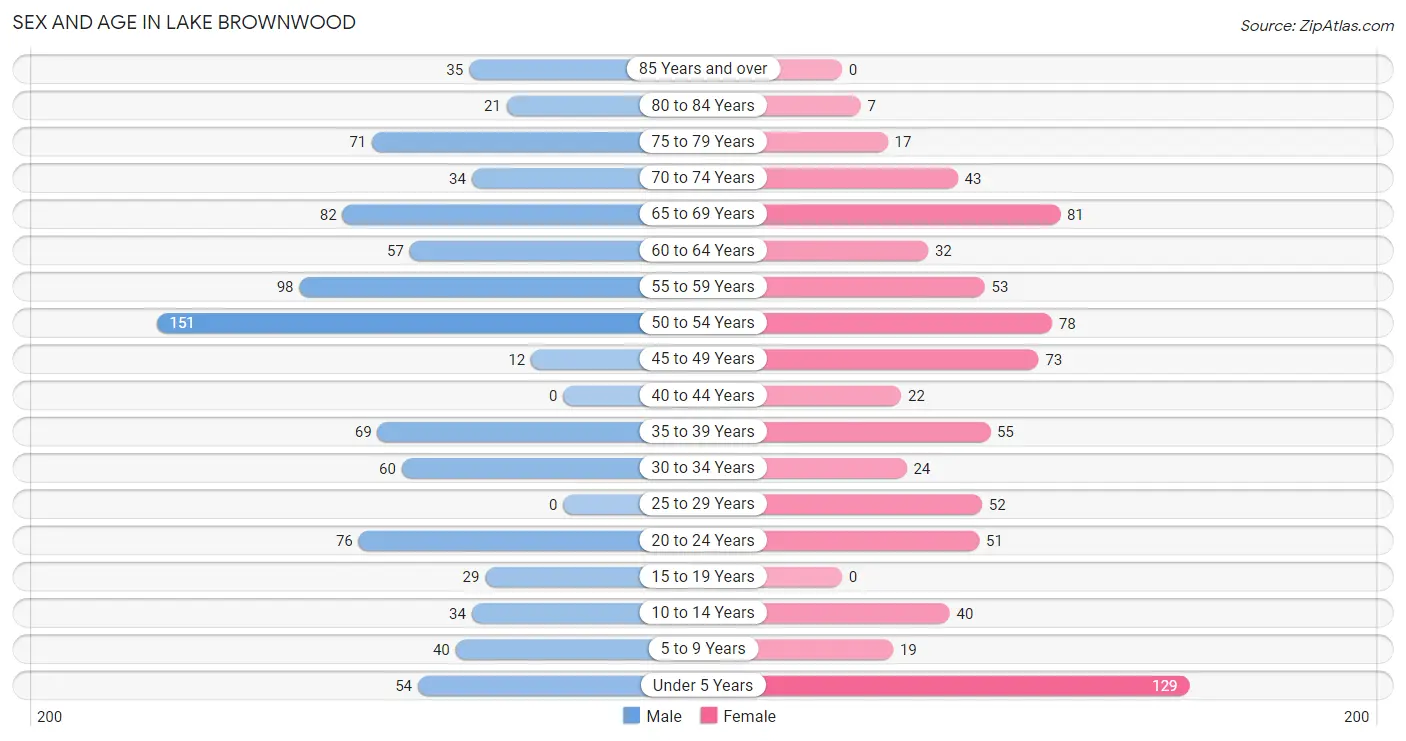
| Age Bracket | Male | Female |
| Under 5 Years | 54 (5.9%) | 129 (16.6%) |
| 5 to 9 Years | 40 (4.3%) | 19 (2.5%) |
| 10 to 14 Years | 34 (3.7%) | 40 (5.1%) |
| 15 to 19 Years | 29 (3.1%) | 0 (0.0%) |
| 20 to 24 Years | 76 (8.2%) | 51 (6.6%) |
| 25 to 29 Years | 0 (0.0%) | 52 (6.7%) |
| 30 to 34 Years | 60 (6.5%) | 24 (3.1%) |
| 35 to 39 Years | 69 (7.5%) | 55 (7.1%) |
| 40 to 44 Years | 0 (0.0%) | 22 (2.8%) |
| 45 to 49 Years | 12 (1.3%) | 73 (9.4%) |
| 50 to 54 Years | 151 (16.4%) | 78 (10.1%) |
| 55 to 59 Years | 98 (10.6%) | 53 (6.8%) |
| 60 to 64 Years | 57 (6.2%) | 32 (4.1%) |
| 65 to 69 Years | 82 (8.9%) | 81 (10.4%) |
| 70 to 74 Years | 34 (3.7%) | 43 (5.5%) |
| 75 to 79 Years | 71 (7.7%) | 17 (2.2%) |
| 80 to 84 Years | 21 (2.3%) | 7 (0.9%) |
| 85 Years and over | 35 (3.8%) | 0 (0.0%) |
| Total | 923 (100.0%) | 776 (100.0%) |
Families and Households in Lake Brownwood
Median Family Size in Lake Brownwood
The median family size in Lake Brownwood is 3.09 persons per family, with married-couple families (351 | 82.2%) accounting for the largest median family size of 3.28 persons per family. On the other hand, single male/father families (18 | 4.2%) represent the smallest median family size with 1.94 persons per family.
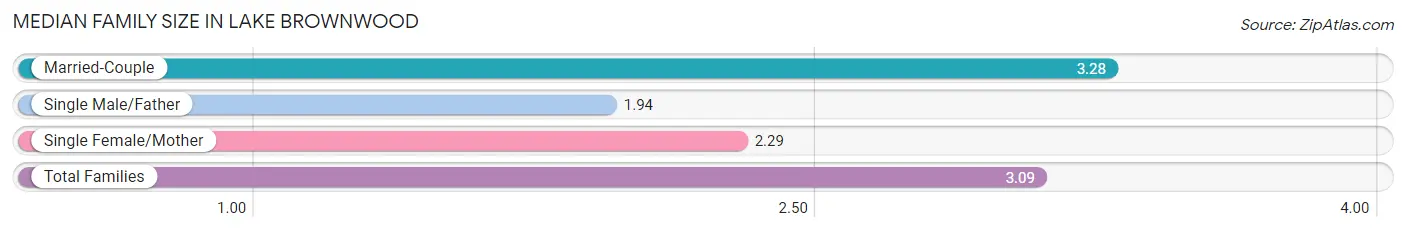
| Family Type | # Families | Family Size |
| Married-Couple | 351 (82.2%) | 3.28 |
| Single Male/Father | 18 (4.2%) | 1.94 |
| Single Female/Mother | 58 (13.6%) | 2.29 |
| Total Families | 427 (100.0%) | 3.09 |
Median Household Size in Lake Brownwood
The median household size in Lake Brownwood is 2.31 persons per household, with married-couple households (351 | 47.7%) accounting for the largest median household size of 3.4 persons per household. non-family households (309 | 42.0%) represent the smallest median household size with 1.09 persons per household.
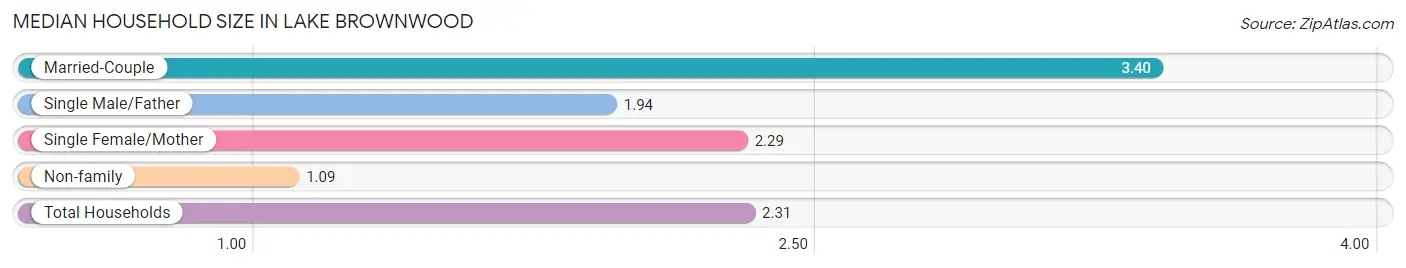
| Household Type | # Households | Household Size |
| Married-Couple | 351 (47.7%) | 3.40 |
| Single Male/Father | 18 (2.5%) | 1.94 |
| Single Female/Mother | 58 (7.9%) | 2.29 |
| Non-family | 309 (42.0%) | 1.09 |
| Total Households | 736 (100.0%) | 2.31 |
Household Size by Marriage Status in Lake Brownwood
Out of a total of 736 households in Lake Brownwood, 427 (58.0%) are family households, while 309 (42.0%) are nonfamily households. The most numerous type of family households are 2-person households, comprising 224, and the most common type of nonfamily households are 1-person households, comprising 281.
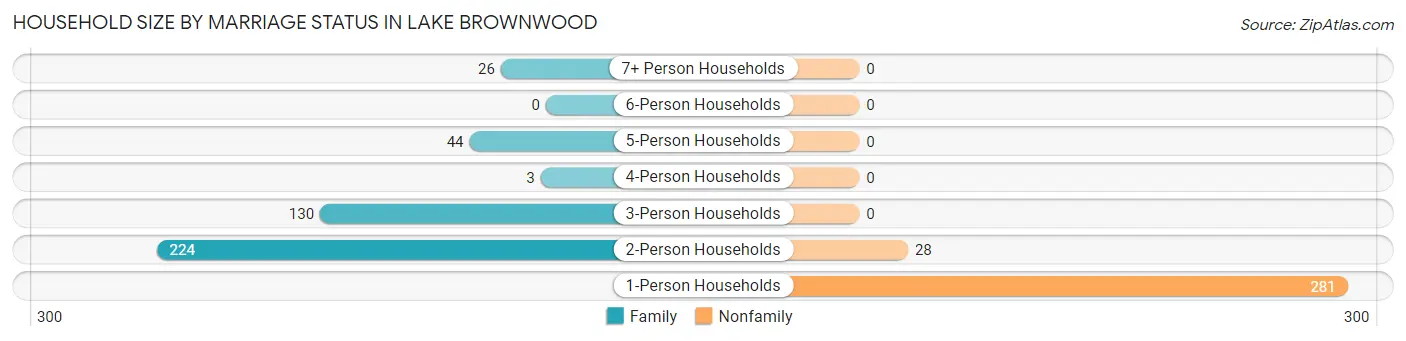
| Household Size | Family Households | Nonfamily Households |
| 1-Person Households | - | 281 (38.2%) |
| 2-Person Households | 224 (30.4%) | 28 (3.8%) |
| 3-Person Households | 130 (17.7%) | 0 (0.0%) |
| 4-Person Households | 3 (0.4%) | 0 (0.0%) |
| 5-Person Households | 44 (6.0%) | 0 (0.0%) |
| 6-Person Households | 0 (0.0%) | 0 (0.0%) |
| 7+ Person Households | 26 (3.5%) | 0 (0.0%) |
| Total | 427 (58.0%) | 309 (42.0%) |
Female Fertility in Lake Brownwood
Fertility by Age in Lake Brownwood
Average fertility rate in Lake Brownwood is 119.0 births per 1,000 women. Women in the age bracket of 20 to 34 years have the highest fertility rate with 260.0 births per 1,000 women. Women in the age bracket of 20 to 34 years acount for 100.0% of all women with births.
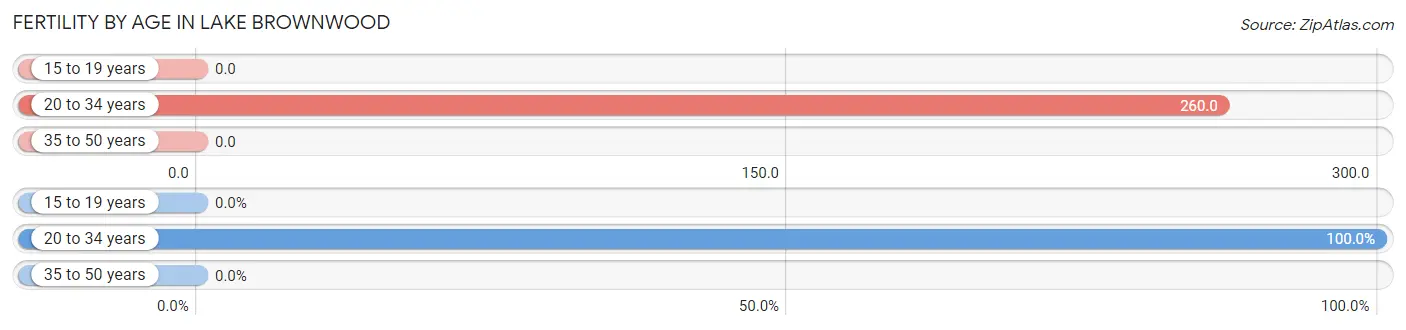
| Age Bracket | Women with Births | Births / 1,000 Women |
| 15 to 19 years | 0 (0.0%) | 0.0 |
| 20 to 34 years | 33 (100.0%) | 260.0 |
| 35 to 50 years | 0 (0.0%) | 0.0 |
| Total | 33 (100.0%) | 119.0 |
Fertility by Age by Marriage Status in Lake Brownwood
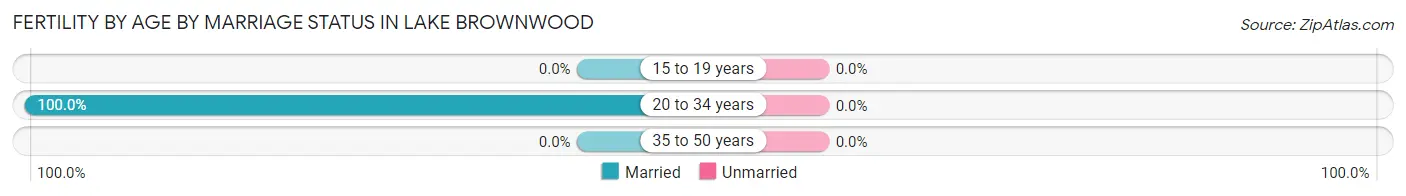
| Age Bracket | Married | Unmarried |
| 15 to 19 years | 0 (0.0%) | 0 (0.0%) |
| 20 to 34 years | 33 (100.0%) | 0 (0.0%) |
| 35 to 50 years | 0 (0.0%) | 0 (0.0%) |
| Total | 33 (100.0%) | 0 (0.0%) |
Fertility by Education in Lake Brownwood
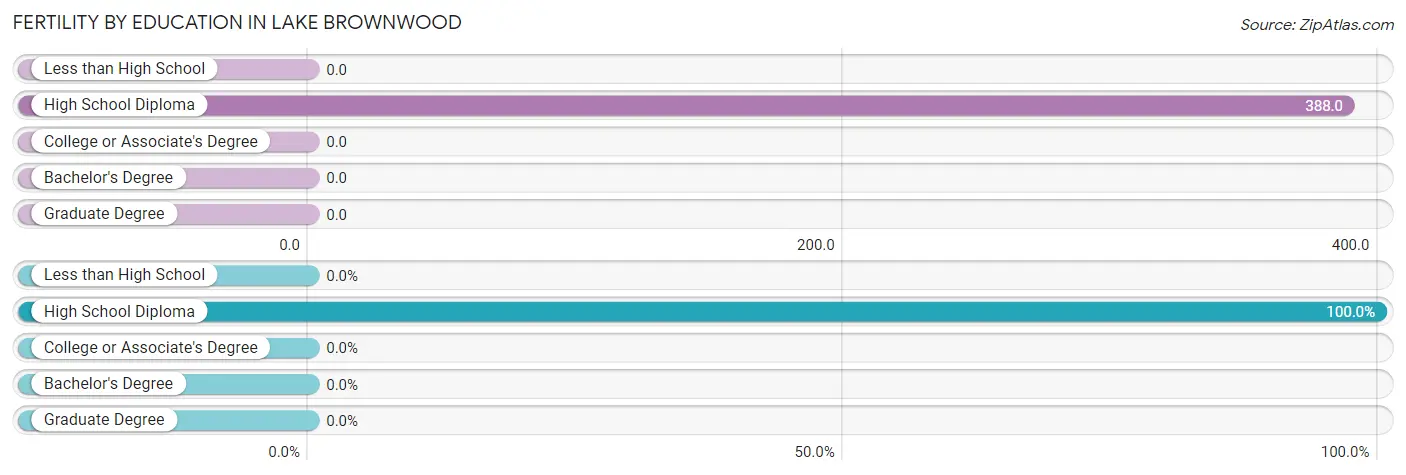
| Educational Attainment | Women with Births | Births / 1,000 Women |
| Less than High School | 0 (0.0%) | 0.0 |
| High School Diploma | 33 (100.0%) | 388.0 |
| College or Associate's Degree | 0 (0.0%) | 0.0 |
| Bachelor's Degree | 0 (0.0%) | 0.0 |
| Graduate Degree | 0 (0.0%) | 0.0 |
| Total | 33 (100.0%) | 119.0 |
Fertility by Education by Marriage Status in Lake Brownwood
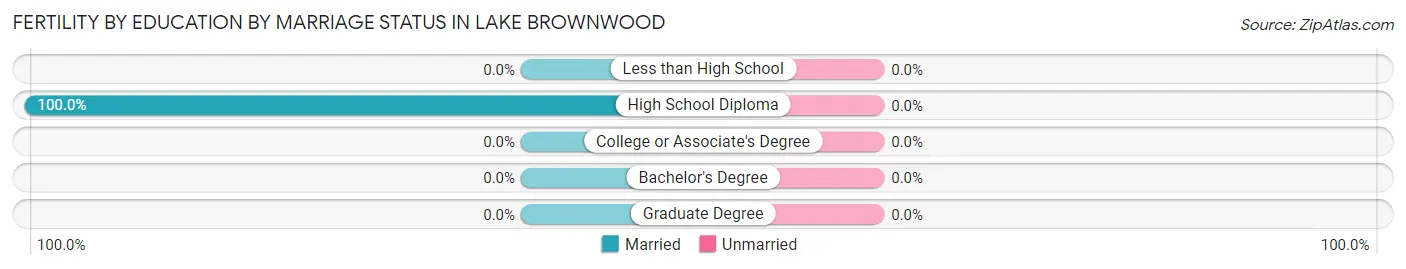
| Educational Attainment | Married | Unmarried |
| Less than High School | 0 (0.0%) | 0 (0.0%) |
| High School Diploma | 33 (100.0%) | 0 (0.0%) |
| College or Associate's Degree | 0 (0.0%) | 0 (0.0%) |
| Bachelor's Degree | 0 (0.0%) | 0 (0.0%) |
| Graduate Degree | 0 (0.0%) | 0 (0.0%) |
| Total | 33 (100.0%) | 0 (0.0%) |
Employment Characteristics in Lake Brownwood
Employment by Class of Employer in Lake Brownwood
Among the 734 employed individuals in Lake Brownwood, private company employees (530 | 72.2%), self-employed (not incorporated) (75 | 10.2%), and state government employees (69 | 9.4%) make up the most common classes of employment.
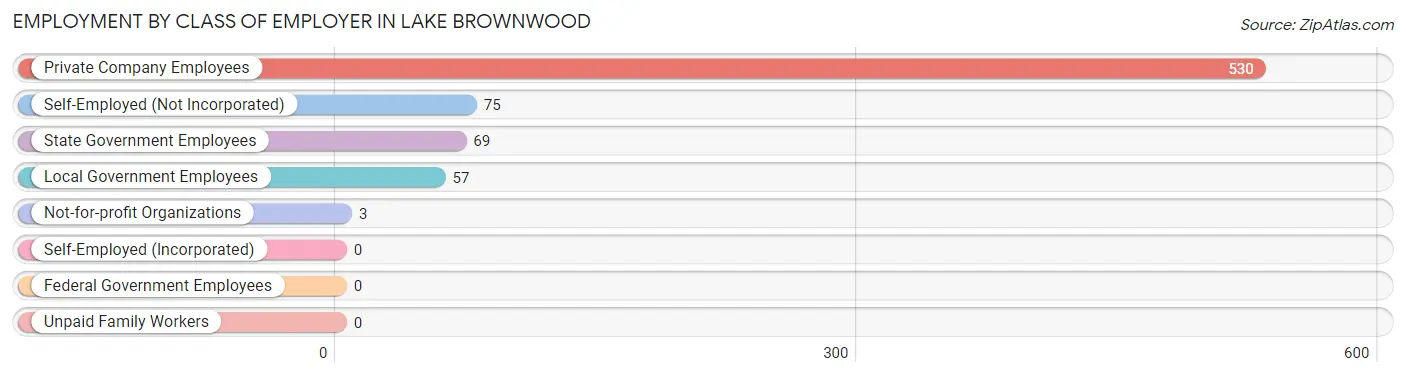
| Employer Class | # Employees | % Employees |
| Private Company Employees | 530 | 72.2% |
| Self-Employed (Incorporated) | 0 | 0.0% |
| Self-Employed (Not Incorporated) | 75 | 10.2% |
| Not-for-profit Organizations | 3 | 0.4% |
| Local Government Employees | 57 | 7.8% |
| State Government Employees | 69 | 9.4% |
| Federal Government Employees | 0 | 0.0% |
| Unpaid Family Workers | 0 | 0.0% |
| Total | 734 | 100.0% |
Employment Status by Age in Lake Brownwood
According to the labor force statistics for Lake Brownwood, out of the total population over 16 years of age (1,374), 62.4% or 857 individuals are in the labor force, with 6.1% or 52 of them unemployed. The age group with the highest labor force participation rate is 20 to 24 years, with 100.0% or 127 individuals in the labor force. Within the labor force, the 65 to 74 years age range has the highest percentage of unemployed individuals, with 40.9% or 27 of them being unemployed.
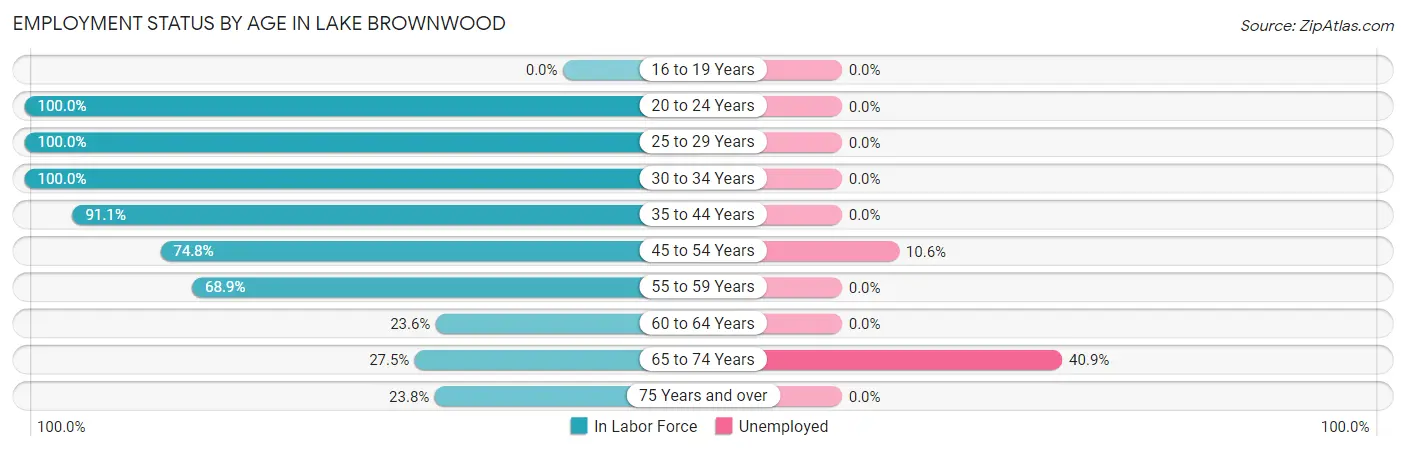
| Age Bracket | In Labor Force | Unemployed |
| 16 to 19 Years | 0 (0.0%) | 0 (0.0%) |
| 20 to 24 Years | 127 (100.0%) | 0 (0.0%) |
| 25 to 29 Years | 52 (100.0%) | 0 (0.0%) |
| 30 to 34 Years | 84 (100.0%) | 0 (0.0%) |
| 35 to 44 Years | 133 (91.1%) | 0 (0.0%) |
| 45 to 54 Years | 235 (74.8%) | 25 (10.6%) |
| 55 to 59 Years | 104 (68.9%) | 0 (0.0%) |
| 60 to 64 Years | 21 (23.6%) | 0 (0.0%) |
| 65 to 74 Years | 66 (27.5%) | 27 (40.9%) |
| 75 Years and over | 36 (23.8%) | 0 (0.0%) |
| Total | 857 (62.4%) | 52 (6.1%) |
Employment Status by Educational Attainment in Lake Brownwood
According to labor force statistics for Lake Brownwood, 75.2% of individuals (629) out of the total population between 25 and 64 years of age (836) are in the labor force, with 4.0% or 25 of them being unemployed. The group with the highest labor force participation rate are those with the educational attainment of bachelor's degree or higher, with 95.7% or 66 individuals in the labor force. Within the labor force, individuals with college / associate degree education have the highest percentage of unemployment, with 11.1% or 25 of them being unemployed.
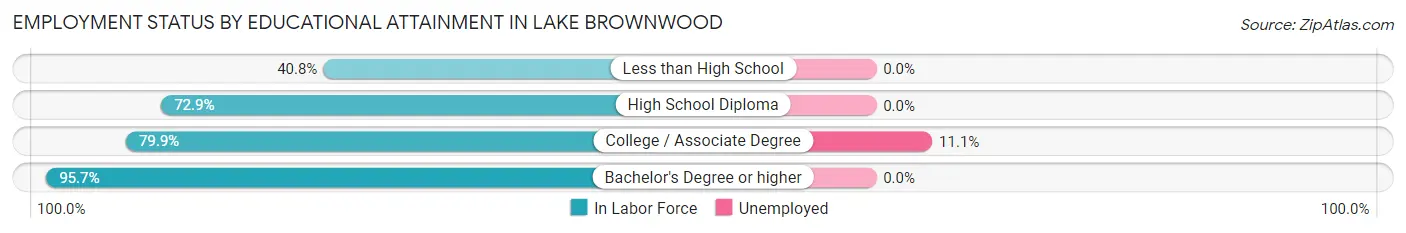
| Educational Attainment | In Labor Force | Unemployed |
| Less than High School | 20 (40.8%) | 0 (0.0%) |
| High School Diploma | 317 (72.9%) | 0 (0.0%) |
| College / Associate Degree | 226 (79.9%) | 31 (11.1%) |
| Bachelor's Degree or higher | 66 (95.7%) | 0 (0.0%) |
| Total | 629 (75.2%) | 33 (4.0%) |
Employment Occupations by Sex in Lake Brownwood
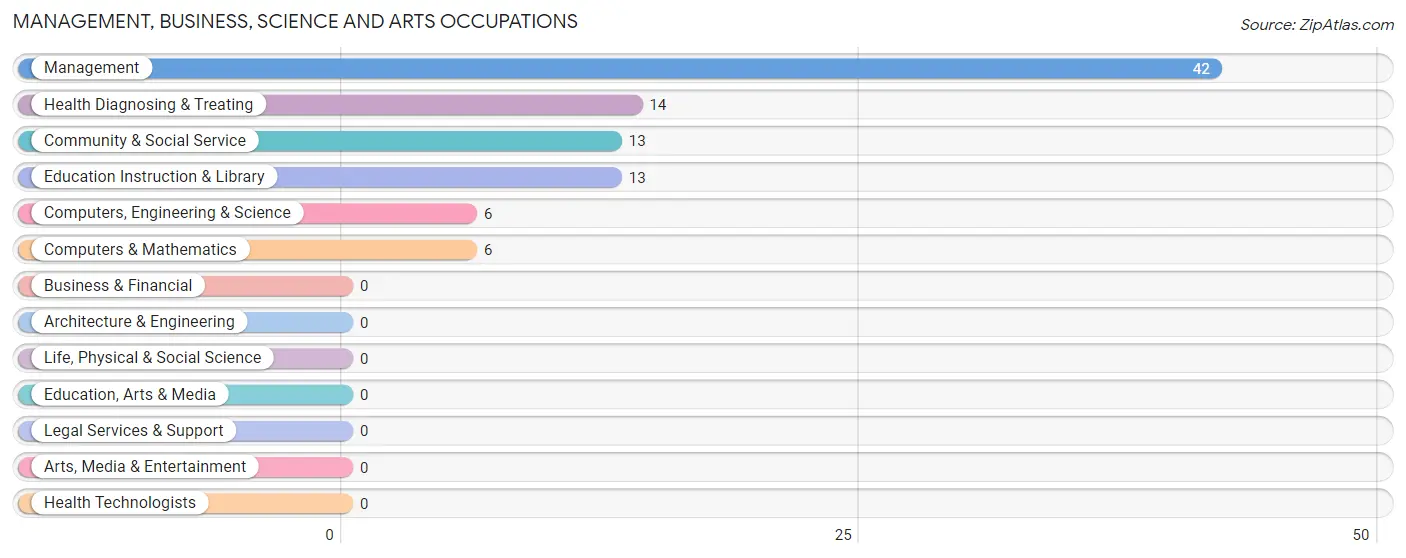
Management, Business, Science and Arts Occupations
The most common Management, Business, Science and Arts occupations in Lake Brownwood are Management (42 | 5.2%), Health Diagnosing & Treating (14 | 1.7%), Community & Social Service (13 | 1.6%), Education Instruction & Library (13 | 1.6%), and Computers, Engineering & Science (6 | 0.7%).
Management, Business, Science and Arts Occupations by Sex
Within the Management, Business, Science and Arts occupations in Lake Brownwood, the most male-oriented occupations are Computers, Engineering & Science (100.0%), Computers & Mathematics (100.0%), and Management (42.9%), while the most female-oriented occupations are Community & Social Service (100.0%), Education Instruction & Library (100.0%), and Health Diagnosing & Treating (100.0%).
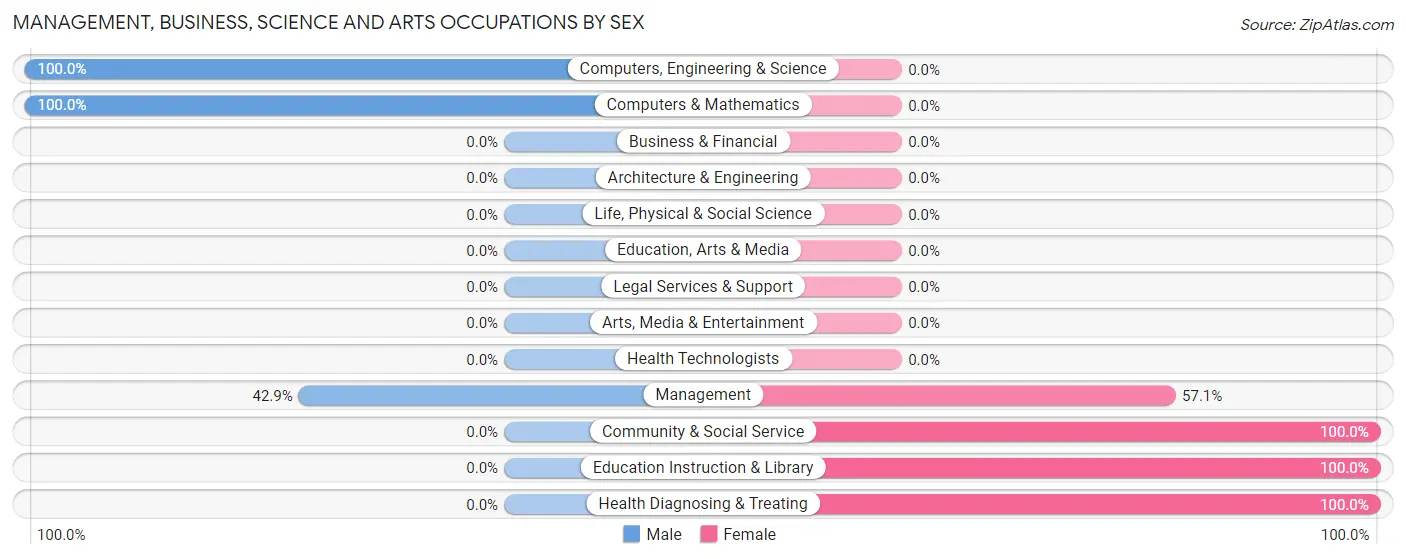
| Occupation | Male | Female |
| Management | 18 (42.9%) | 24 (57.1%) |
| Business & Financial | 0 (0.0%) | 0 (0.0%) |
| Computers, Engineering & Science | 6 (100.0%) | 0 (0.0%) |
| Computers & Mathematics | 6 (100.0%) | 0 (0.0%) |
| Architecture & Engineering | 0 (0.0%) | 0 (0.0%) |
| Life, Physical & Social Science | 0 (0.0%) | 0 (0.0%) |
| Community & Social Service | 0 (0.0%) | 13 (100.0%) |
| Education, Arts & Media | 0 (0.0%) | 0 (0.0%) |
| Legal Services & Support | 0 (0.0%) | 0 (0.0%) |
| Education Instruction & Library | 0 (0.0%) | 13 (100.0%) |
| Arts, Media & Entertainment | 0 (0.0%) | 0 (0.0%) |
| Health Diagnosing & Treating | 0 (0.0%) | 14 (100.0%) |
| Health Technologists | 0 (0.0%) | 0 (0.0%) |
| Total (Category) | 24 (32.0%) | 51 (68.0%) |
| Total (Overall) | 502 (62.3%) | 304 (37.7%) |
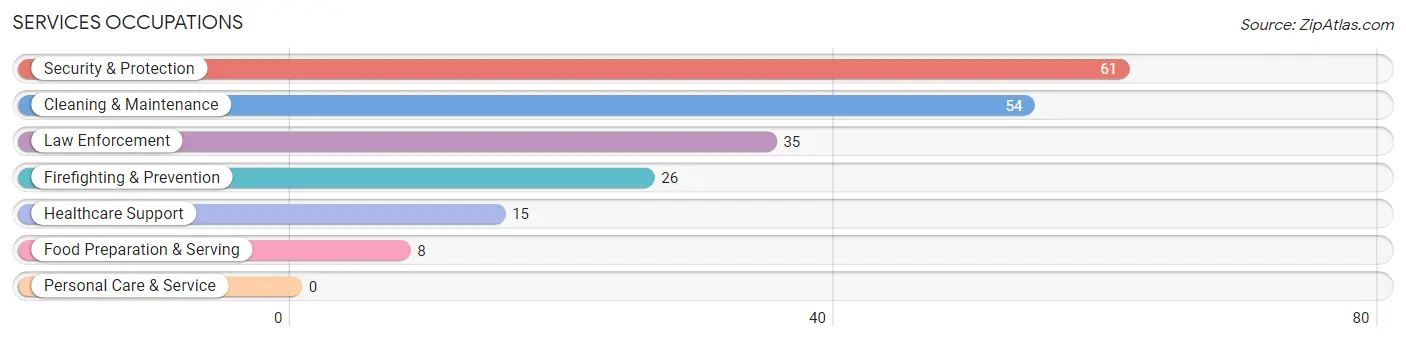
Services Occupations
The most common Services occupations in Lake Brownwood are Security & Protection (61 | 7.6%), Cleaning & Maintenance (54 | 6.7%), Law Enforcement (35 | 4.3%), Firefighting & Prevention (26 | 3.2%), and Healthcare Support (15 | 1.9%).
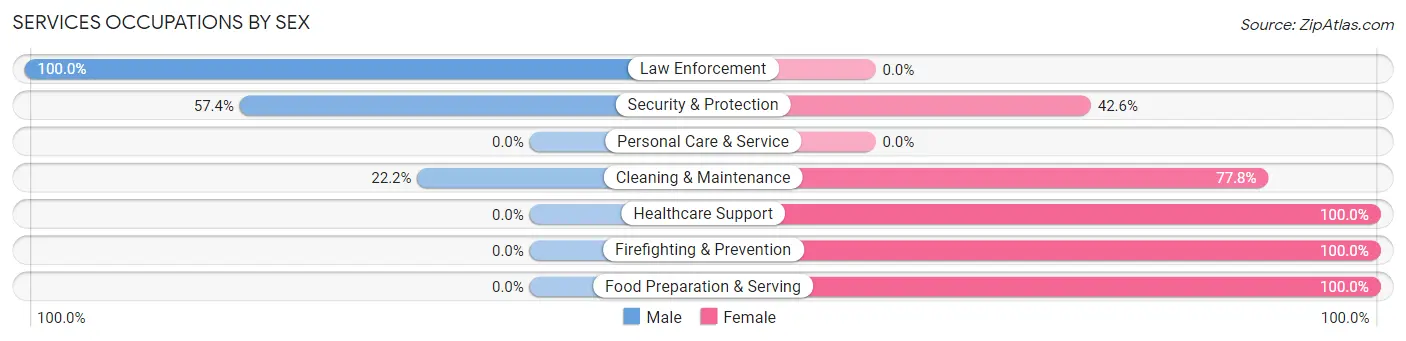
Services Occupations by Sex
Within the Services occupations in Lake Brownwood, the most male-oriented occupations are Law Enforcement (100.0%), Security & Protection (57.4%), and Cleaning & Maintenance (22.2%), while the most female-oriented occupations are Healthcare Support (100.0%), Firefighting & Prevention (100.0%), and Food Preparation & Serving (100.0%).
| Occupation | Male | Female |
| Healthcare Support | 0 (0.0%) | 15 (100.0%) |
| Security & Protection | 35 (57.4%) | 26 (42.6%) |
| Firefighting & Prevention | 0 (0.0%) | 26 (100.0%) |
| Law Enforcement | 35 (100.0%) | 0 (0.0%) |
| Food Preparation & Serving | 0 (0.0%) | 8 (100.0%) |
| Cleaning & Maintenance | 12 (22.2%) | 42 (77.8%) |
| Personal Care & Service | 0 (0.0%) | 0 (0.0%) |
| Total (Category) | 47 (34.1%) | 91 (65.9%) |
| Total (Overall) | 502 (62.3%) | 304 (37.7%) |
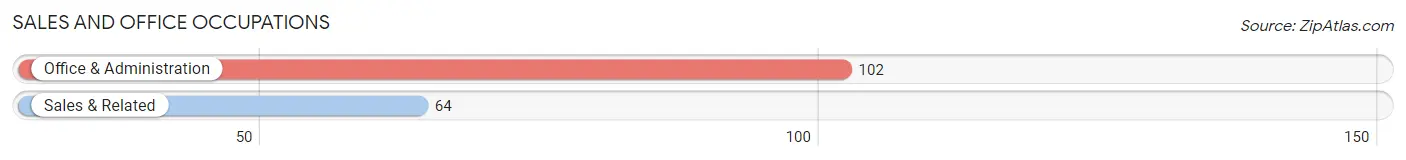
Sales and Office Occupations
The most common Sales and Office occupations in Lake Brownwood are Office & Administration (102 | 12.7%), and Sales & Related (64 | 7.9%).
Sales and Office Occupations by Sex
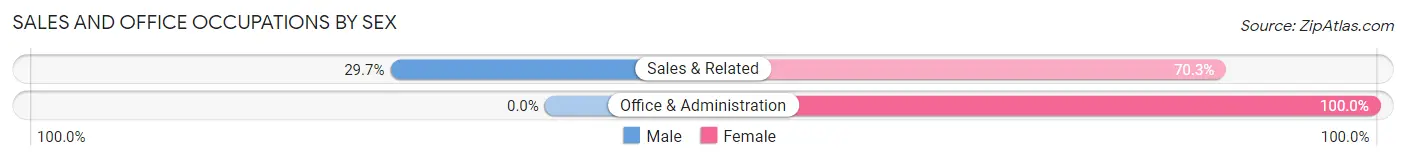
| Occupation | Male | Female |
| Sales & Related | 19 (29.7%) | 45 (70.3%) |
| Office & Administration | 0 (0.0%) | 102 (100.0%) |
| Total (Category) | 19 (11.5%) | 147 (88.5%) |
| Total (Overall) | 502 (62.3%) | 304 (37.7%) |
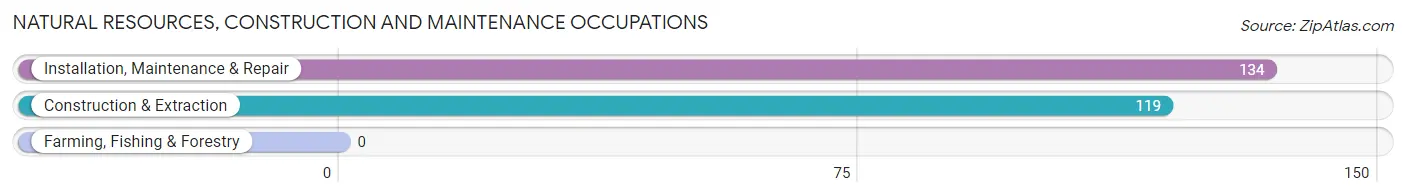
Natural Resources, Construction and Maintenance Occupations
The most common Natural Resources, Construction and Maintenance occupations in Lake Brownwood are Installation, Maintenance & Repair (134 | 16.6%), and Construction & Extraction (119 | 14.8%).
Natural Resources, Construction and Maintenance Occupations by Sex
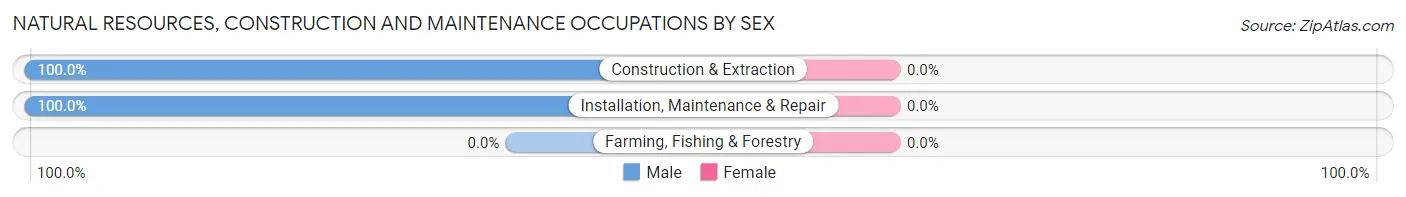
| Occupation | Male | Female |
| Farming, Fishing & Forestry | 0 (0.0%) | 0 (0.0%) |
| Construction & Extraction | 119 (100.0%) | 0 (0.0%) |
| Installation, Maintenance & Repair | 134 (100.0%) | 0 (0.0%) |
| Total (Category) | 253 (100.0%) | 0 (0.0%) |
| Total (Overall) | 502 (62.3%) | 304 (37.7%) |
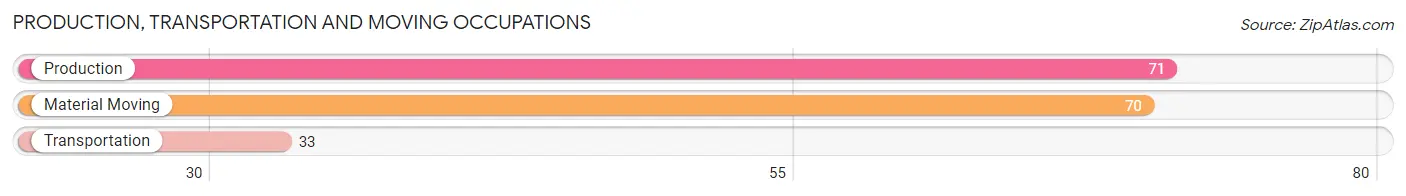
Production, Transportation and Moving Occupations
The most common Production, Transportation and Moving occupations in Lake Brownwood are Production (71 | 8.8%), Material Moving (70 | 8.7%), and Transportation (33 | 4.1%).
Production, Transportation and Moving Occupations by Sex
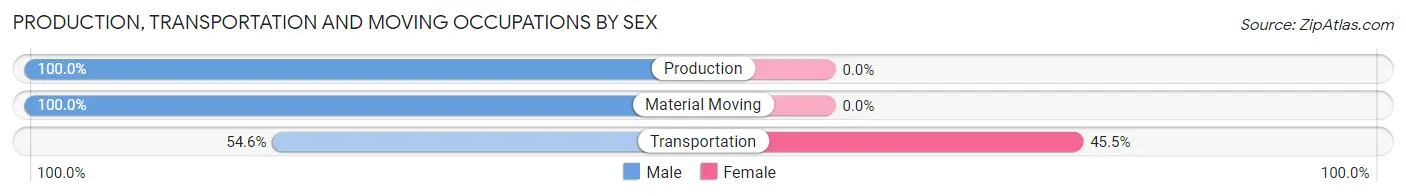
| Occupation | Male | Female |
| Production | 71 (100.0%) | 0 (0.0%) |
| Transportation | 18 (54.5%) | 15 (45.5%) |
| Material Moving | 70 (100.0%) | 0 (0.0%) |
| Total (Category) | 159 (91.4%) | 15 (8.6%) |
| Total (Overall) | 502 (62.3%) | 304 (37.7%) |
Employment Industries by Sex in Lake Brownwood
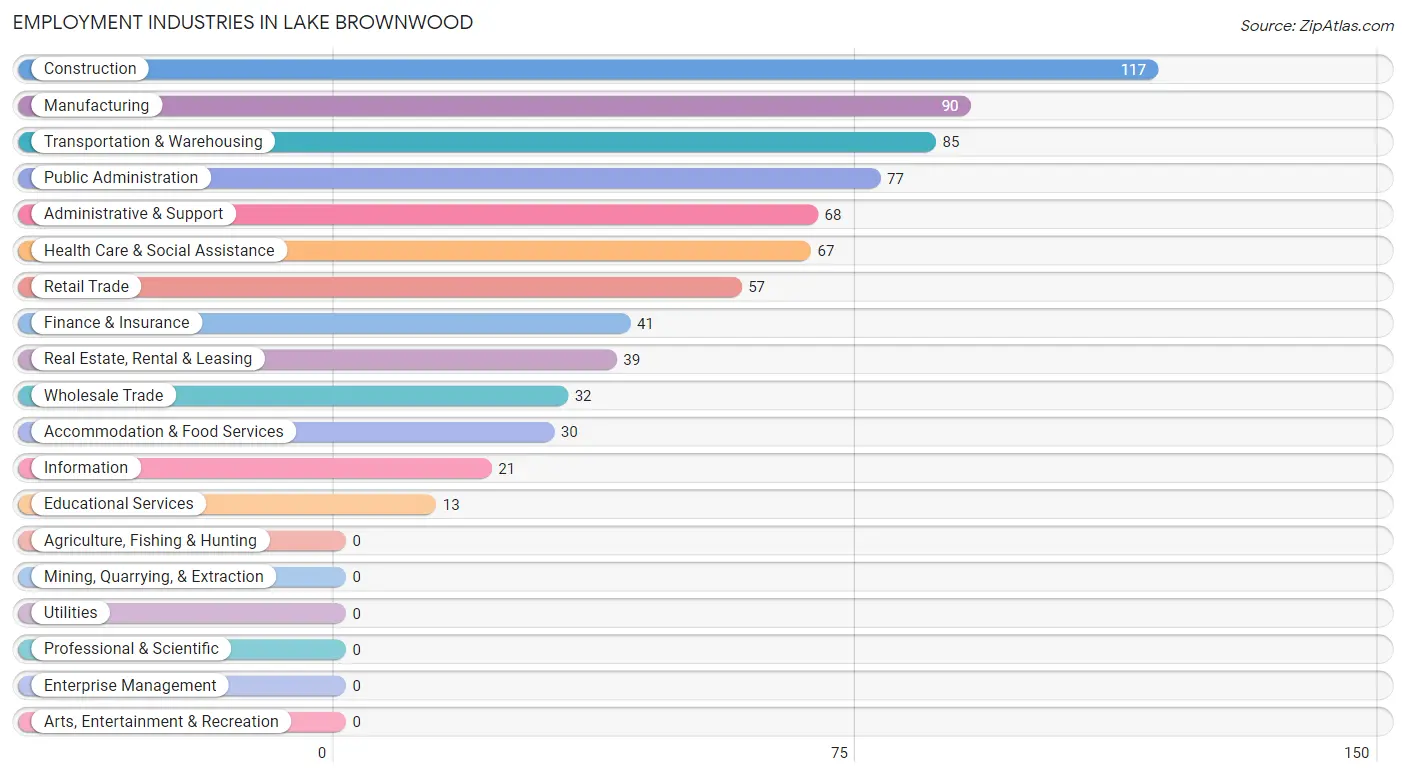
Employment Industries in Lake Brownwood
The major employment industries in Lake Brownwood include Construction (117 | 14.5%), Manufacturing (90 | 11.2%), Transportation & Warehousing (85 | 10.5%), Public Administration (77 | 9.6%), and Administrative & Support (68 | 8.4%).
Employment Industries by Sex in Lake Brownwood
The Lake Brownwood industries that see more men than women are Construction (100.0%), Manufacturing (100.0%), and Wholesale Trade (100.0%), whereas the industries that tend to have a higher number of women are Finance & Insurance (100.0%), Educational Services (100.0%), and Health Care & Social Assistance (100.0%).
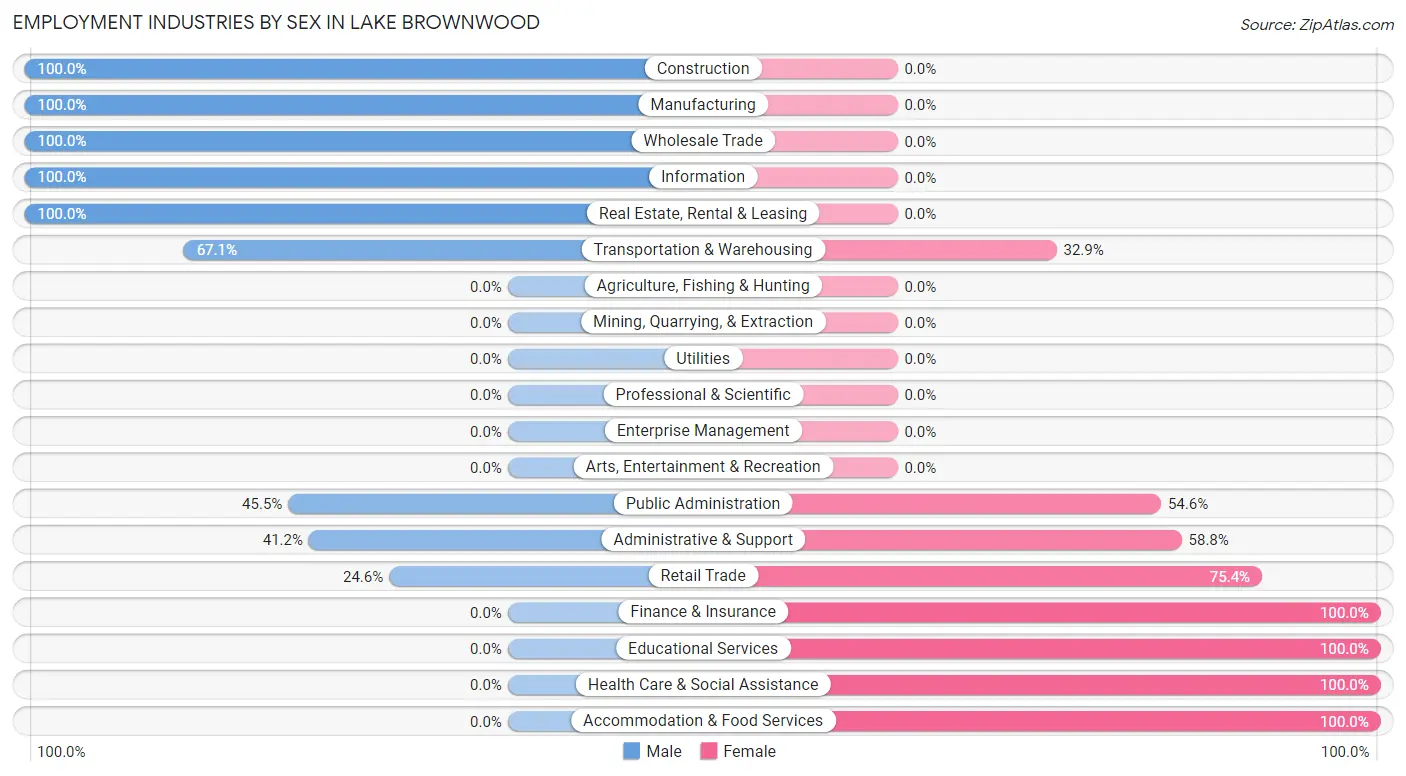
| Industry | Male | Female |
| Agriculture, Fishing & Hunting | 0 (0.0%) | 0 (0.0%) |
| Mining, Quarrying, & Extraction | 0 (0.0%) | 0 (0.0%) |
| Construction | 117 (100.0%) | 0 (0.0%) |
| Manufacturing | 90 (100.0%) | 0 (0.0%) |
| Wholesale Trade | 32 (100.0%) | 0 (0.0%) |
| Retail Trade | 14 (24.6%) | 43 (75.4%) |
| Transportation & Warehousing | 57 (67.1%) | 28 (32.9%) |
| Utilities | 0 (0.0%) | 0 (0.0%) |
| Information | 21 (100.0%) | 0 (0.0%) |
| Finance & Insurance | 0 (0.0%) | 41 (100.0%) |
| Real Estate, Rental & Leasing | 39 (100.0%) | 0 (0.0%) |
| Professional & Scientific | 0 (0.0%) | 0 (0.0%) |
| Enterprise Management | 0 (0.0%) | 0 (0.0%) |
| Administrative & Support | 28 (41.2%) | 40 (58.8%) |
| Educational Services | 0 (0.0%) | 13 (100.0%) |
| Health Care & Social Assistance | 0 (0.0%) | 67 (100.0%) |
| Arts, Entertainment & Recreation | 0 (0.0%) | 0 (0.0%) |
| Accommodation & Food Services | 0 (0.0%) | 30 (100.0%) |
| Public Administration | 35 (45.5%) | 42 (54.5%) |
| Total | 502 (62.3%) | 304 (37.7%) |
Education in Lake Brownwood
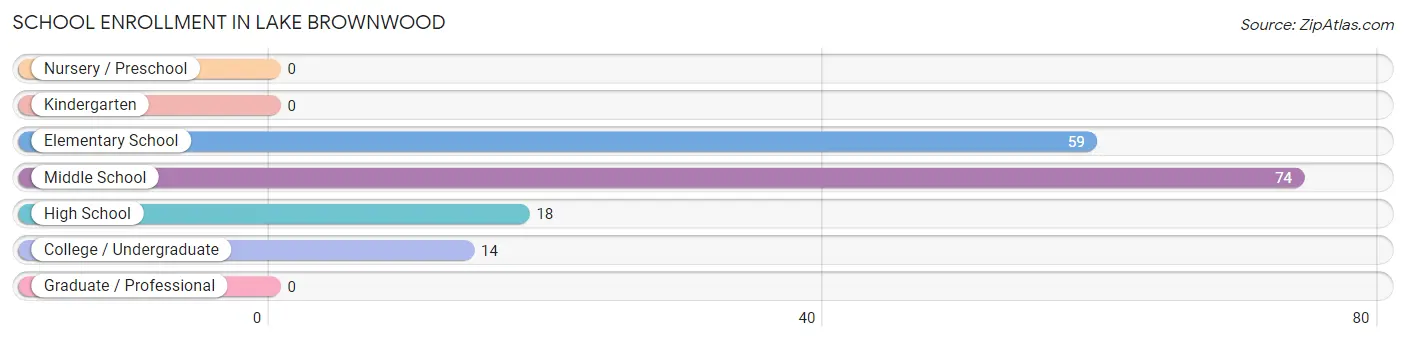
School Enrollment in Lake Brownwood
The most common levels of schooling among the 165 students in Lake Brownwood are middle school (74 | 44.9%), elementary school (59 | 35.8%), and high school (18 | 10.9%).
| School Level | # Students | % Students |
| Nursery / Preschool | 0 | 0.0% |
| Kindergarten | 0 | 0.0% |
| Elementary School | 59 | 35.8% |
| Middle School | 74 | 44.9% |
| High School | 18 | 10.9% |
| College / Undergraduate | 14 | 8.5% |
| Graduate / Professional | 0 | 0.0% |
| Total | 165 | 100.0% |
School Enrollment by Age by Funding Source in Lake Brownwood
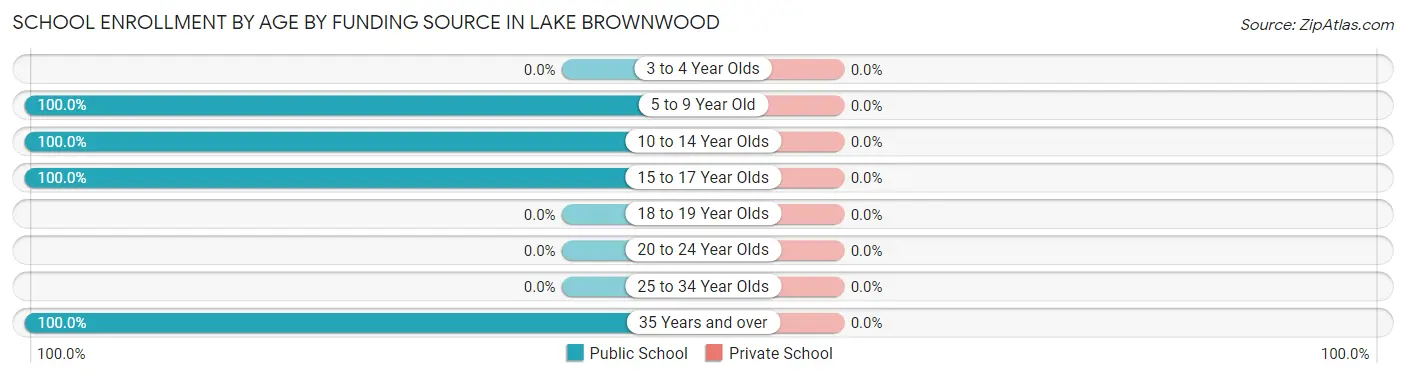
| Age Bracket | Public School | Private School |
| 3 to 4 Year Olds | 0 (0.0%) | 0 (0.0%) |
| 5 to 9 Year Old | 59 (100.0%) | 0 (0.0%) |
| 10 to 14 Year Olds | 74 (100.0%) | 0 (0.0%) |
| 15 to 17 Year Olds | 18 (100.0%) | 0 (0.0%) |
| 18 to 19 Year Olds | 0 (0.0%) | 0 (0.0%) |
| 20 to 24 Year Olds | 0 (0.0%) | 0 (0.0%) |
| 25 to 34 Year Olds | 0 (0.0%) | 0 (0.0%) |
| 35 Years and over | 14 (100.0%) | 0 (0.0%) |
| Total | 165 (100.0%) | 0 (0.0%) |
Educational Attainment by Field of Study in Lake Brownwood
Education (76 | 41.1%), business (52 | 28.1%), liberal arts & history (26 | 14.1%), arts & humanities (11 | 5.9%), and engineering (9 | 4.9%) are the most common fields of study among 185 individuals in Lake Brownwood who have obtained a bachelor's degree or higher.
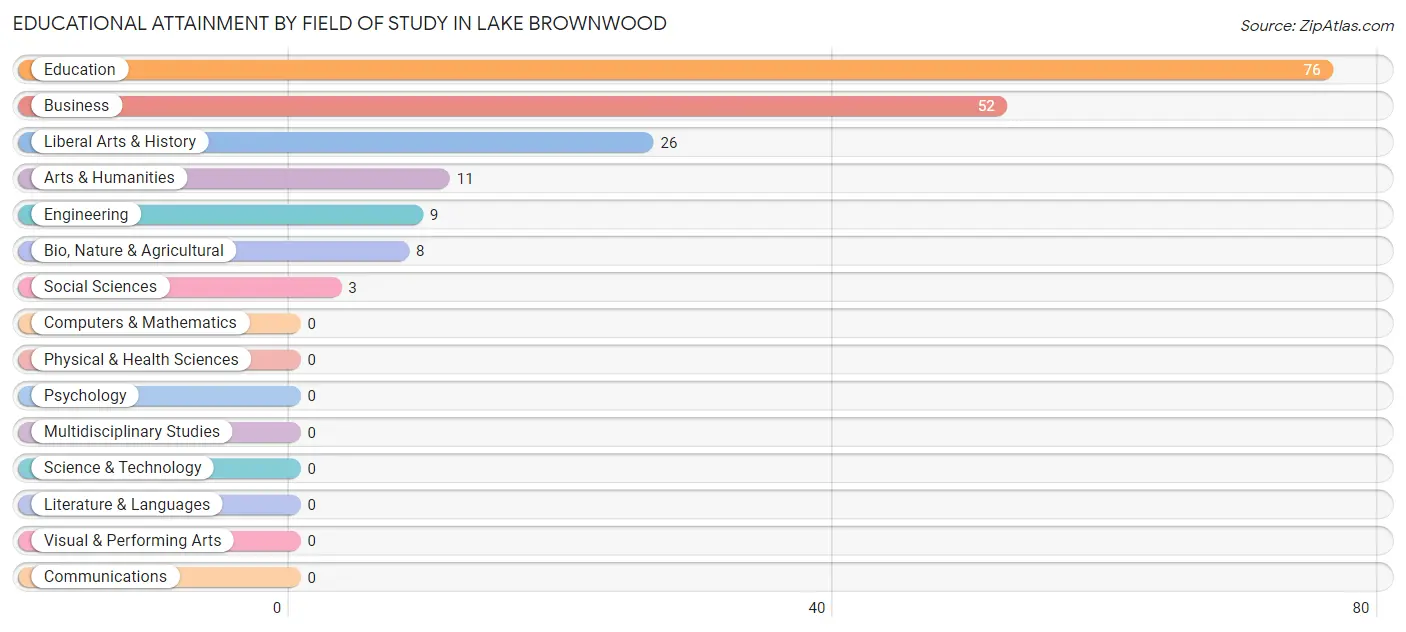
| Field of Study | # Graduates | % Graduates |
| Computers & Mathematics | 0 | 0.0% |
| Bio, Nature & Agricultural | 8 | 4.3% |
| Physical & Health Sciences | 0 | 0.0% |
| Psychology | 0 | 0.0% |
| Social Sciences | 3 | 1.6% |
| Engineering | 9 | 4.9% |
| Multidisciplinary Studies | 0 | 0.0% |
| Science & Technology | 0 | 0.0% |
| Business | 52 | 28.1% |
| Education | 76 | 41.1% |
| Literature & Languages | 0 | 0.0% |
| Liberal Arts & History | 26 | 14.1% |
| Visual & Performing Arts | 0 | 0.0% |
| Communications | 0 | 0.0% |
| Arts & Humanities | 11 | 5.9% |
| Total | 185 | 100.0% |
Transportation & Commute in Lake Brownwood
Vehicle Availability by Sex in Lake Brownwood
The most prevalent vehicle ownership categories in Lake Brownwood are males with 2 vehicles (169, accounting for 36.5%) and females with 2 vehicles (90, making up 62.4%).
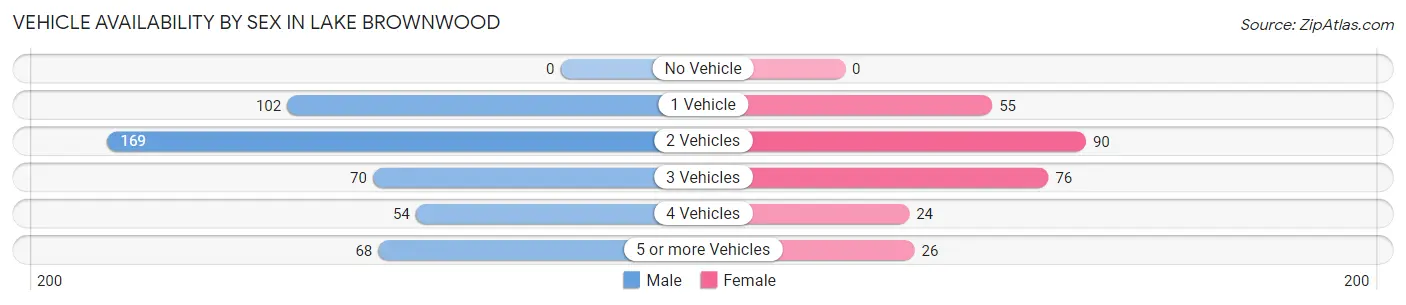
| Vehicles Available | Male | Female |
| No Vehicle | 0 (0.0%) | 0 (0.0%) |
| 1 Vehicle | 102 (22.0%) | 55 (20.3%) |
| 2 Vehicles | 169 (36.5%) | 90 (33.2%) |
| 3 Vehicles | 70 (15.1%) | 76 (28.0%) |
| 4 Vehicles | 54 (11.7%) | 24 (8.9%) |
| 5 or more Vehicles | 68 (14.7%) | 26 (9.6%) |
| Total | 463 (100.0%) | 271 (100.0%) |
Commute Time in Lake Brownwood
The most frequently occuring commute durations in Lake Brownwood are 20 to 24 minutes (363 commuters, 50.9%), 15 to 19 minutes (96 commuters, 13.5%), and 90 or more minutes (74 commuters, 10.4%).
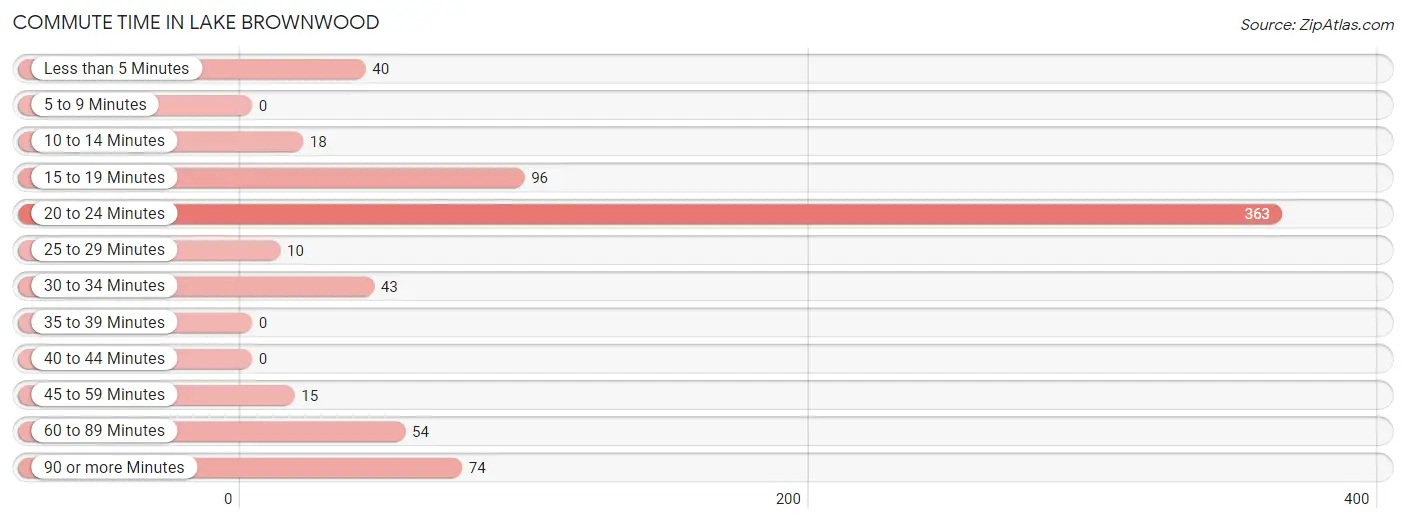
| Commute Time | # Commuters | % Commuters |
| Less than 5 Minutes | 40 | 5.6% |
| 5 to 9 Minutes | 0 | 0.0% |
| 10 to 14 Minutes | 18 | 2.5% |
| 15 to 19 Minutes | 96 | 13.5% |
| 20 to 24 Minutes | 363 | 50.9% |
| 25 to 29 Minutes | 10 | 1.4% |
| 30 to 34 Minutes | 43 | 6.0% |
| 35 to 39 Minutes | 0 | 0.0% |
| 40 to 44 Minutes | 0 | 0.0% |
| 45 to 59 Minutes | 15 | 2.1% |
| 60 to 89 Minutes | 54 | 7.6% |
| 90 or more Minutes | 74 | 10.4% |
Commute Time by Sex in Lake Brownwood
The most common commute times in Lake Brownwood are 20 to 24 minutes (279 commuters, 63.1%) for males and 20 to 24 minutes (84 commuters, 31.0%) for females.
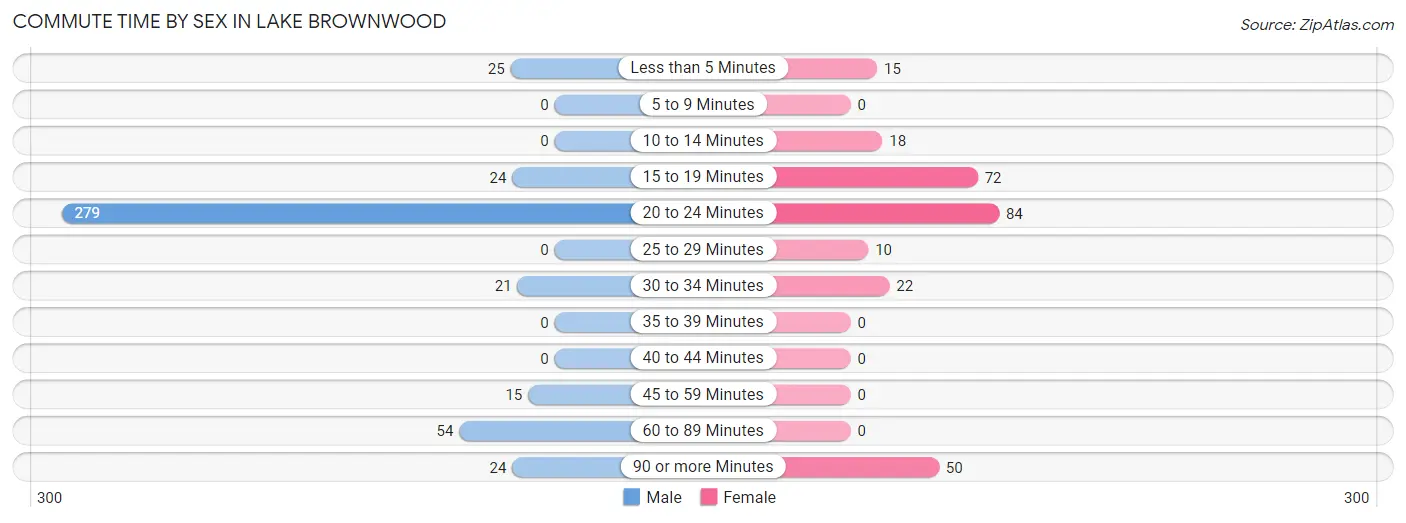
| Commute Time | Male | Female |
| Less than 5 Minutes | 25 (5.7%) | 15 (5.5%) |
| 5 to 9 Minutes | 0 (0.0%) | 0 (0.0%) |
| 10 to 14 Minutes | 0 (0.0%) | 18 (6.6%) |
| 15 to 19 Minutes | 24 (5.4%) | 72 (26.6%) |
| 20 to 24 Minutes | 279 (63.1%) | 84 (31.0%) |
| 25 to 29 Minutes | 0 (0.0%) | 10 (3.7%) |
| 30 to 34 Minutes | 21 (4.8%) | 22 (8.1%) |
| 35 to 39 Minutes | 0 (0.0%) | 0 (0.0%) |
| 40 to 44 Minutes | 0 (0.0%) | 0 (0.0%) |
| 45 to 59 Minutes | 15 (3.4%) | 0 (0.0%) |
| 60 to 89 Minutes | 54 (12.2%) | 0 (0.0%) |
| 90 or more Minutes | 24 (5.4%) | 50 (18.4%) |
Time of Departure to Work by Sex in Lake Brownwood
The most frequent times of departure to work in Lake Brownwood are 6:30 AM to 6:59 AM (120, 27.2%) for males and 7:30 AM to 7:59 AM (62, 22.9%) for females.
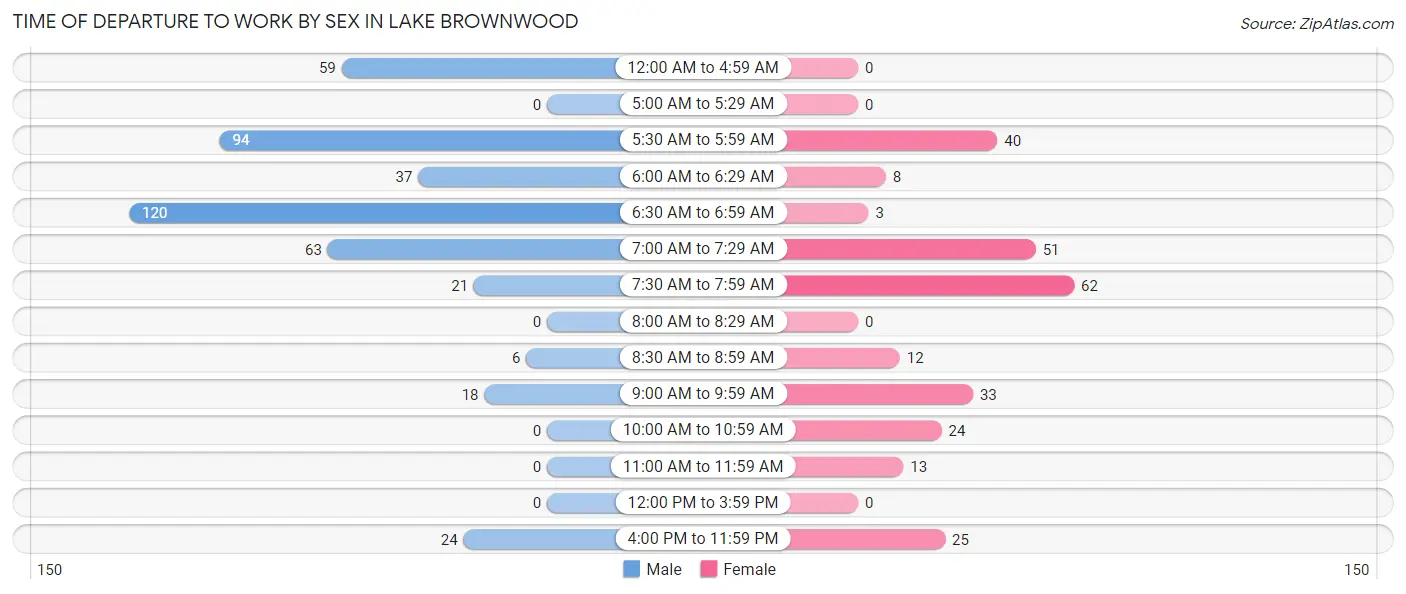
| Time of Departure | Male | Female |
| 12:00 AM to 4:59 AM | 59 (13.4%) | 0 (0.0%) |
| 5:00 AM to 5:29 AM | 0 (0.0%) | 0 (0.0%) |
| 5:30 AM to 5:59 AM | 94 (21.3%) | 40 (14.8%) |
| 6:00 AM to 6:29 AM | 37 (8.4%) | 8 (2.9%) |
| 6:30 AM to 6:59 AM | 120 (27.2%) | 3 (1.1%) |
| 7:00 AM to 7:29 AM | 63 (14.2%) | 51 (18.8%) |
| 7:30 AM to 7:59 AM | 21 (4.8%) | 62 (22.9%) |
| 8:00 AM to 8:29 AM | 0 (0.0%) | 0 (0.0%) |
| 8:30 AM to 8:59 AM | 6 (1.4%) | 12 (4.4%) |
| 9:00 AM to 9:59 AM | 18 (4.1%) | 33 (12.2%) |
| 10:00 AM to 10:59 AM | 0 (0.0%) | 24 (8.9%) |
| 11:00 AM to 11:59 AM | 0 (0.0%) | 13 (4.8%) |
| 12:00 PM to 3:59 PM | 0 (0.0%) | 0 (0.0%) |
| 4:00 PM to 11:59 PM | 24 (5.4%) | 25 (9.2%) |
| Total | 442 (100.0%) | 271 (100.0%) |
Housing Occupancy in Lake Brownwood
Occupancy by Ownership in Lake Brownwood
Of the total 736 dwellings in Lake Brownwood, owner-occupied units account for 587 (79.8%), while renter-occupied units make up 149 (20.2%).
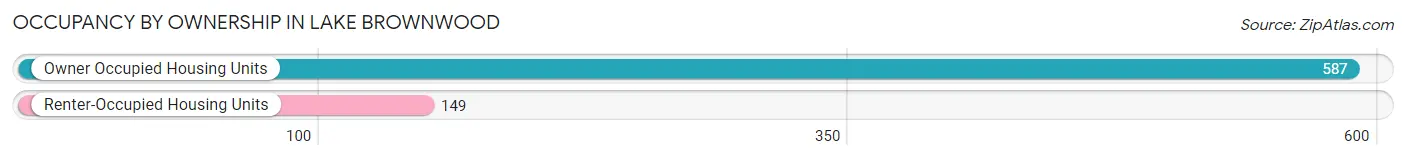
| Occupancy | # Housing Units | % Housing Units |
| Owner Occupied Housing Units | 587 | 79.8% |
| Renter-Occupied Housing Units | 149 | 20.2% |
| Total Occupied Housing Units | 736 | 100.0% |
Occupancy by Household Size in Lake Brownwood
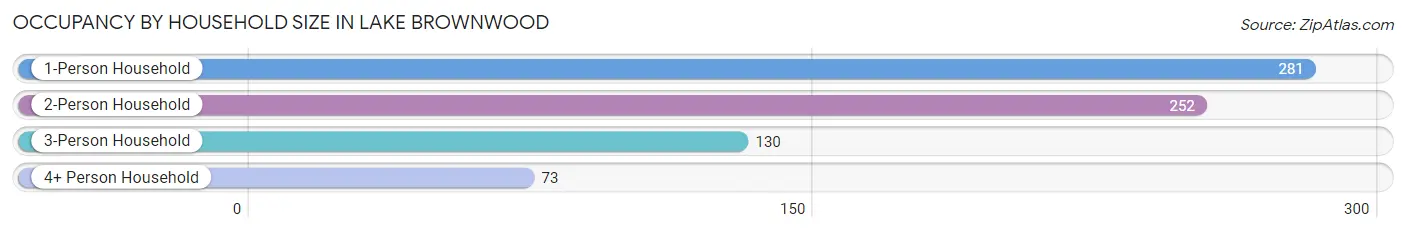
| Household Size | # Housing Units | % Housing Units |
| 1-Person Household | 281 | 38.2% |
| 2-Person Household | 252 | 34.2% |
| 3-Person Household | 130 | 17.7% |
| 4+ Person Household | 73 | 9.9% |
| Total Housing Units | 736 | 100.0% |
Occupancy by Ownership by Household Size in Lake Brownwood
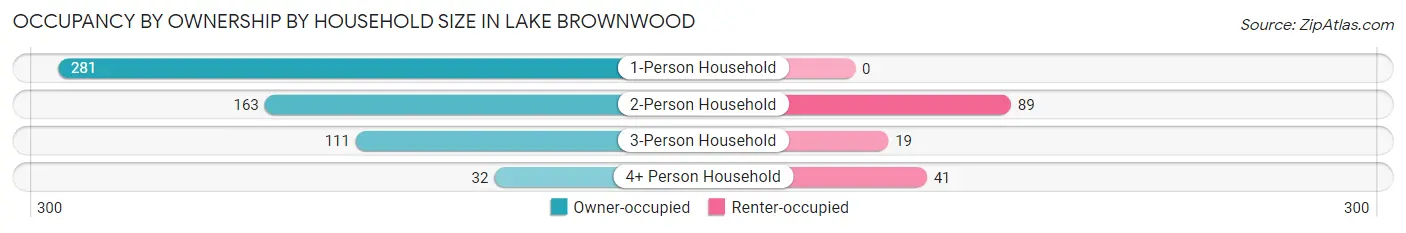
| Household Size | Owner-occupied | Renter-occupied |
| 1-Person Household | 281 (100.0%) | 0 (0.0%) |
| 2-Person Household | 163 (64.7%) | 89 (35.3%) |
| 3-Person Household | 111 (85.4%) | 19 (14.6%) |
| 4+ Person Household | 32 (43.8%) | 41 (56.2%) |
| Total Housing Units | 587 (79.8%) | 149 (20.2%) |
Occupancy by Educational Attainment in Lake Brownwood
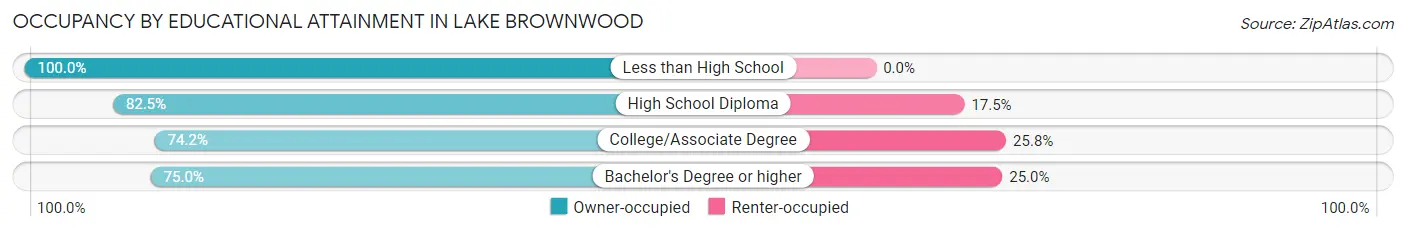
| Household Size | Owner-occupied | Renter-occupied |
| Less than High School | 52 (100.0%) | 0 (0.0%) |
| High School Diploma | 264 (82.5%) | 56 (17.5%) |
| College/Associate Degree | 193 (74.2%) | 67 (25.8%) |
| Bachelor's Degree or higher | 78 (75.0%) | 26 (25.0%) |
Occupancy by Age of Householder in Lake Brownwood
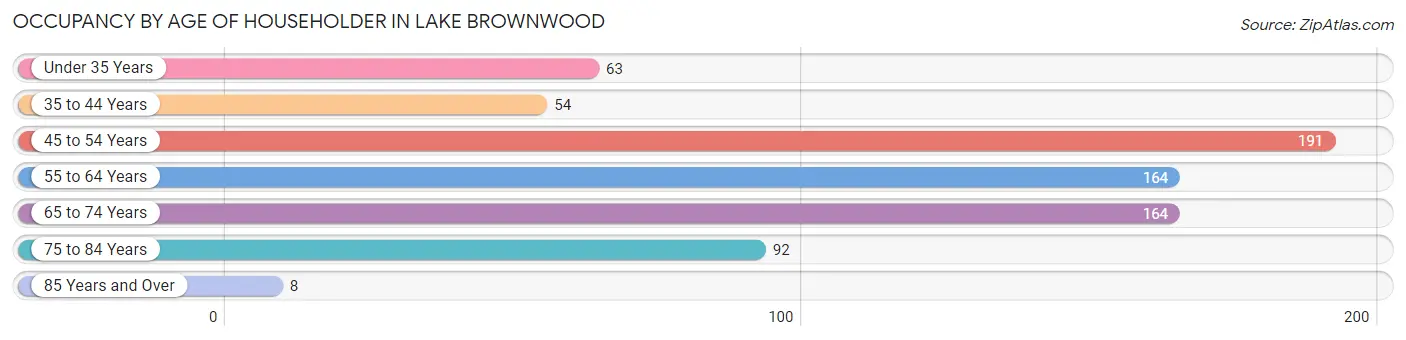
| Age Bracket | # Households | % Households |
| Under 35 Years | 63 | 8.6% |
| 35 to 44 Years | 54 | 7.3% |
| 45 to 54 Years | 191 | 26.0% |
| 55 to 64 Years | 164 | 22.3% |
| 65 to 74 Years | 164 | 22.3% |
| 75 to 84 Years | 92 | 12.5% |
| 85 Years and Over | 8 | 1.1% |
| Total | 736 | 100.0% |
Housing Finances in Lake Brownwood
Median Income by Occupancy in Lake Brownwood
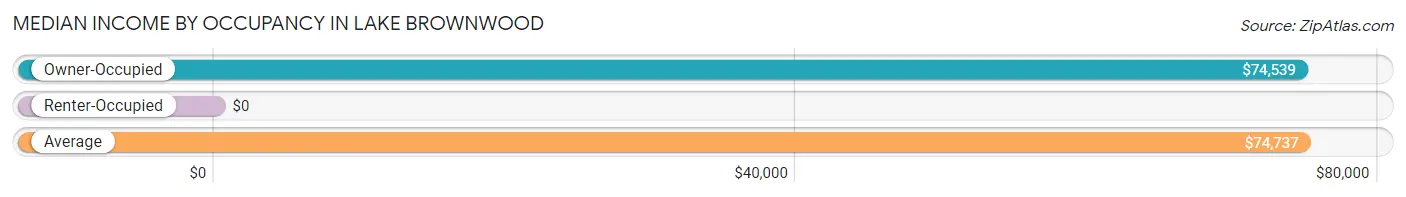
| Occupancy Type | # Households | Median Income |
| Owner-Occupied | 587 (79.8%) | $74,539 |
| Renter-Occupied | 149 (20.2%) | $0 |
| Average | 736 (100.0%) | $74,737 |
Occupancy by Householder Income Bracket in Lake Brownwood
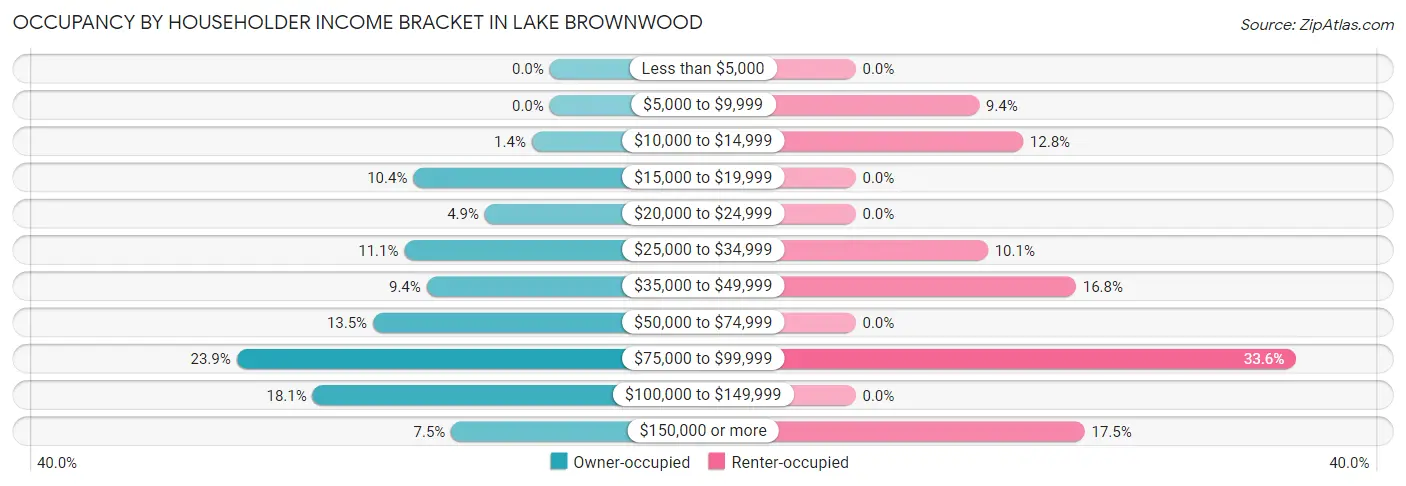
| Income Bracket | Owner-occupied | Renter-occupied |
| Less than $5,000 | 0 (0.0%) | 0 (0.0%) |
| $5,000 to $9,999 | 0 (0.0%) | 14 (9.4%) |
| $10,000 to $14,999 | 8 (1.4%) | 19 (12.8%) |
| $15,000 to $19,999 | 61 (10.4%) | 0 (0.0%) |
| $20,000 to $24,999 | 29 (4.9%) | 0 (0.0%) |
| $25,000 to $34,999 | 65 (11.1%) | 15 (10.1%) |
| $35,000 to $49,999 | 55 (9.4%) | 25 (16.8%) |
| $50,000 to $74,999 | 79 (13.5%) | 0 (0.0%) |
| $75,000 to $99,999 | 140 (23.8%) | 50 (33.6%) |
| $100,000 to $149,999 | 106 (18.1%) | 0 (0.0%) |
| $150,000 or more | 44 (7.5%) | 26 (17.4%) |
| Total | 587 (100.0%) | 149 (100.0%) |
Monthly Housing Cost Tiers in Lake Brownwood
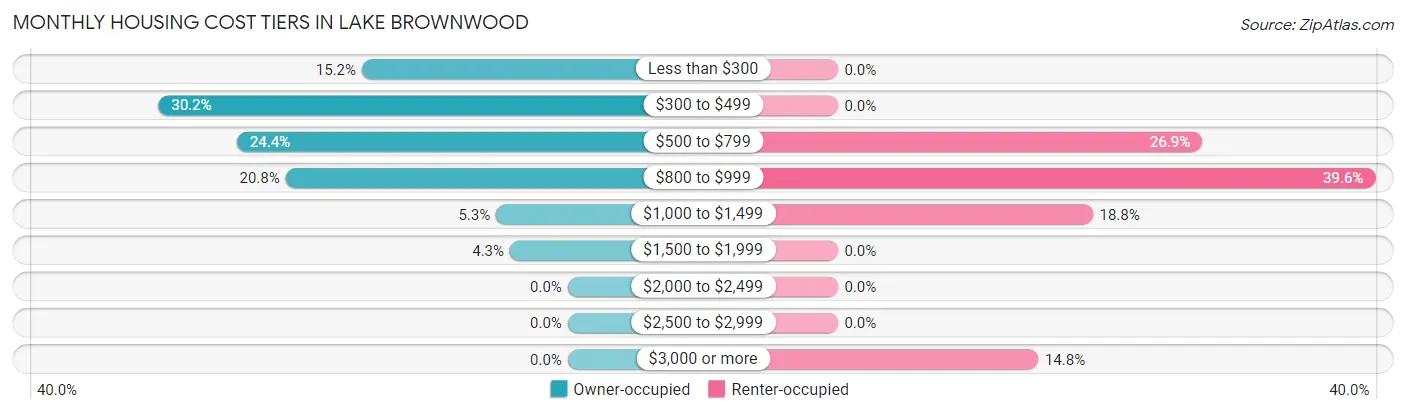
| Monthly Cost | Owner-occupied | Renter-occupied |
| Less than $300 | 89 (15.2%) | 0 (0.0%) |
| $300 to $499 | 177 (30.1%) | 0 (0.0%) |
| $500 to $799 | 143 (24.4%) | 40 (26.9%) |
| $800 to $999 | 122 (20.8%) | 59 (39.6%) |
| $1,000 to $1,499 | 31 (5.3%) | 28 (18.8%) |
| $1,500 to $1,999 | 25 (4.3%) | 0 (0.0%) |
| $2,000 to $2,499 | 0 (0.0%) | 0 (0.0%) |
| $2,500 to $2,999 | 0 (0.0%) | 0 (0.0%) |
| $3,000 or more | 0 (0.0%) | 22 (14.8%) |
| Total | 587 (100.0%) | 149 (100.0%) |
Physical Housing Characteristics in Lake Brownwood
Housing Structures in Lake Brownwood
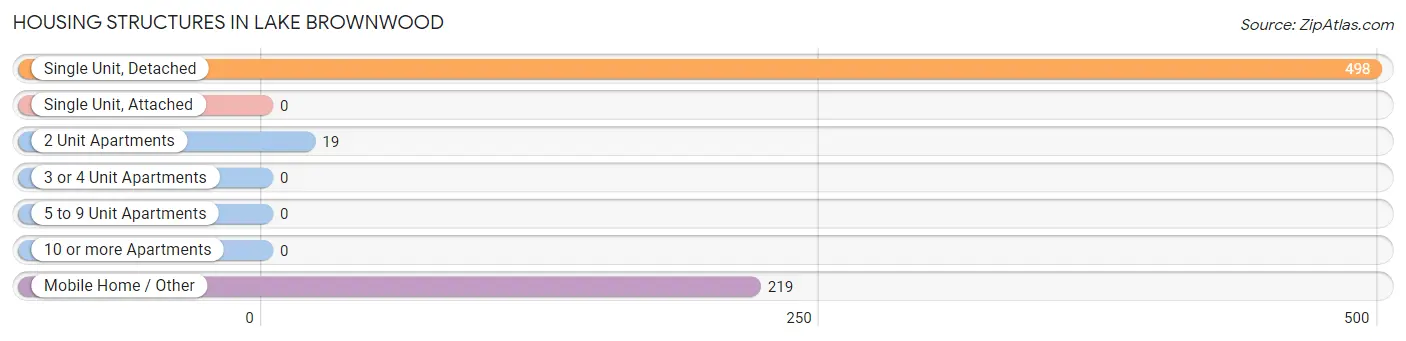
| Structure Type | # Housing Units | % Housing Units |
| Single Unit, Detached | 498 | 67.7% |
| Single Unit, Attached | 0 | 0.0% |
| 2 Unit Apartments | 19 | 2.6% |
| 3 or 4 Unit Apartments | 0 | 0.0% |
| 5 to 9 Unit Apartments | 0 | 0.0% |
| 10 or more Apartments | 0 | 0.0% |
| Mobile Home / Other | 219 | 29.8% |
| Total | 736 | 100.0% |
Housing Structures by Occupancy in Lake Brownwood
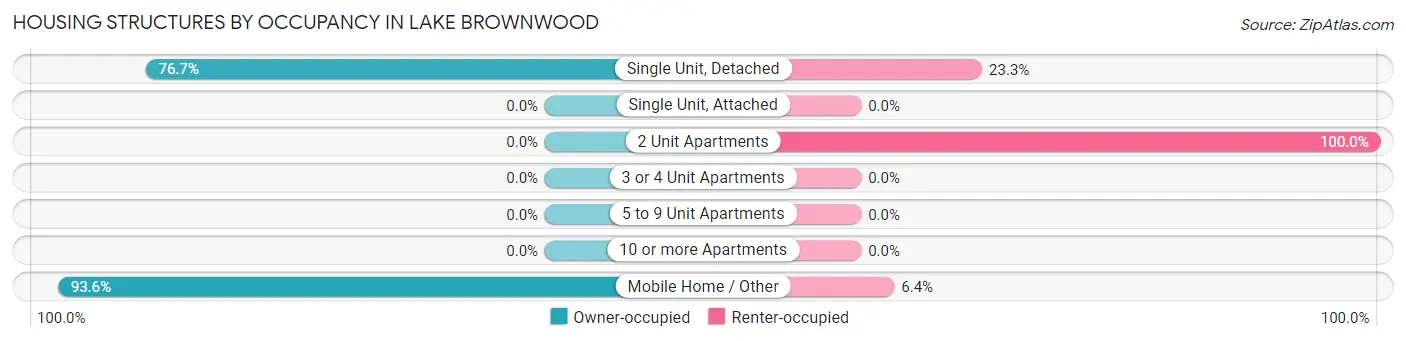
| Structure Type | Owner-occupied | Renter-occupied |
| Single Unit, Detached | 382 (76.7%) | 116 (23.3%) |
| Single Unit, Attached | 0 (0.0%) | 0 (0.0%) |
| 2 Unit Apartments | 0 (0.0%) | 19 (100.0%) |
| 3 or 4 Unit Apartments | 0 (0.0%) | 0 (0.0%) |
| 5 to 9 Unit Apartments | 0 (0.0%) | 0 (0.0%) |
| 10 or more Apartments | 0 (0.0%) | 0 (0.0%) |
| Mobile Home / Other | 205 (93.6%) | 14 (6.4%) |
| Total | 587 (79.8%) | 149 (20.2%) |
Housing Structures by Number of Rooms in Lake Brownwood
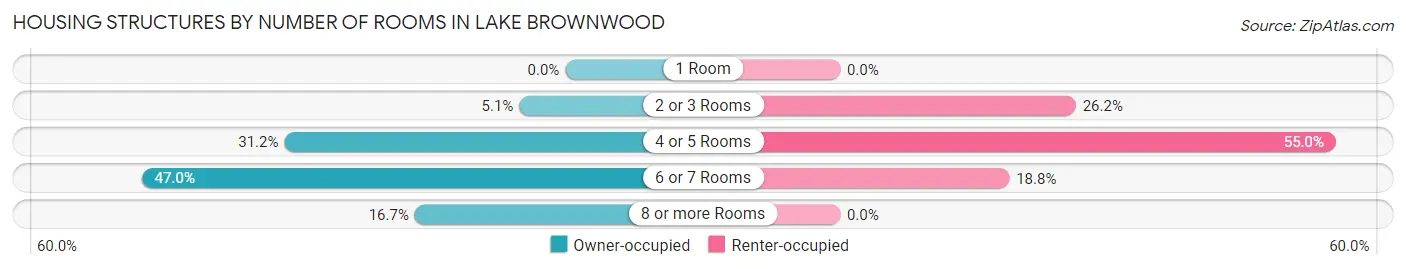
| Number of Rooms | Owner-occupied | Renter-occupied |
| 1 Room | 0 (0.0%) | 0 (0.0%) |
| 2 or 3 Rooms | 30 (5.1%) | 39 (26.2%) |
| 4 or 5 Rooms | 183 (31.2%) | 82 (55.0%) |
| 6 or 7 Rooms | 276 (47.0%) | 28 (18.8%) |
| 8 or more Rooms | 98 (16.7%) | 0 (0.0%) |
| Total | 587 (100.0%) | 149 (100.0%) |
Housing Structure by Heating Type in Lake Brownwood
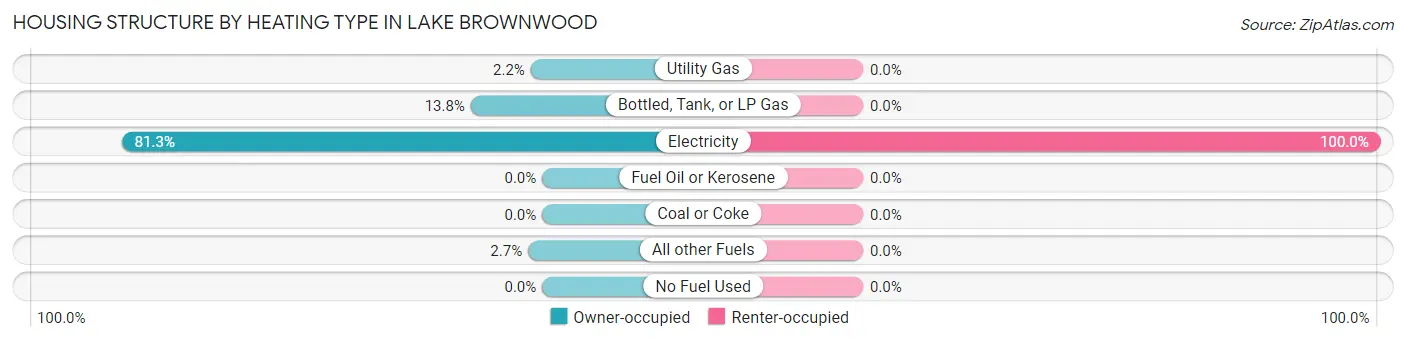
| Heating Type | Owner-occupied | Renter-occupied |
| Utility Gas | 13 (2.2%) | 0 (0.0%) |
| Bottled, Tank, or LP Gas | 81 (13.8%) | 0 (0.0%) |
| Electricity | 477 (81.3%) | 149 (100.0%) |
| Fuel Oil or Kerosene | 0 (0.0%) | 0 (0.0%) |
| Coal or Coke | 0 (0.0%) | 0 (0.0%) |
| All other Fuels | 16 (2.7%) | 0 (0.0%) |
| No Fuel Used | 0 (0.0%) | 0 (0.0%) |
| Total | 587 (100.0%) | 149 (100.0%) |
Household Vehicle Usage in Lake Brownwood
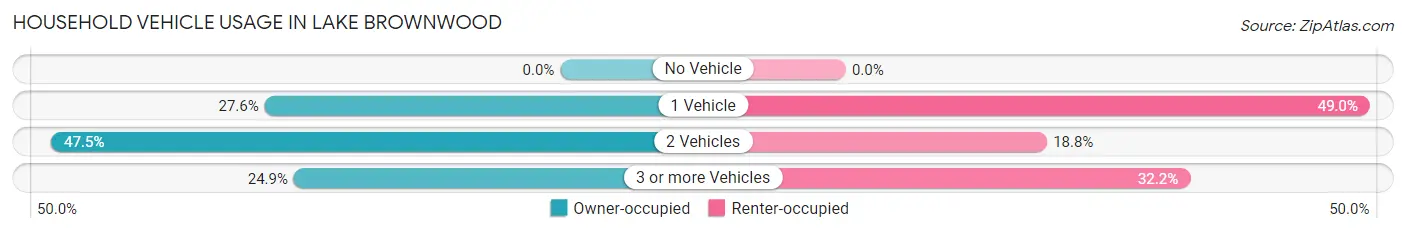
| Vehicles per Household | Owner-occupied | Renter-occupied |
| No Vehicle | 0 (0.0%) | 0 (0.0%) |
| 1 Vehicle | 162 (27.6%) | 73 (49.0%) |
| 2 Vehicles | 279 (47.5%) | 28 (18.8%) |
| 3 or more Vehicles | 146 (24.9%) | 48 (32.2%) |
| Total | 587 (100.0%) | 149 (100.0%) |
Real Estate & Mortgages in Lake Brownwood
Real Estate and Mortgage Overview in Lake Brownwood
| Characteristic | Without Mortgage | With Mortgage |
| Housing Units | 398 | 189 |
| Median Property Value | $102,700 | $129,500 |
| Median Household Income | $71,429 | $11 |
| Monthly Housing Costs | $392 | $0 |
| Real Estate Taxes | $923 | $9 |
Property Value by Mortgage Status in Lake Brownwood
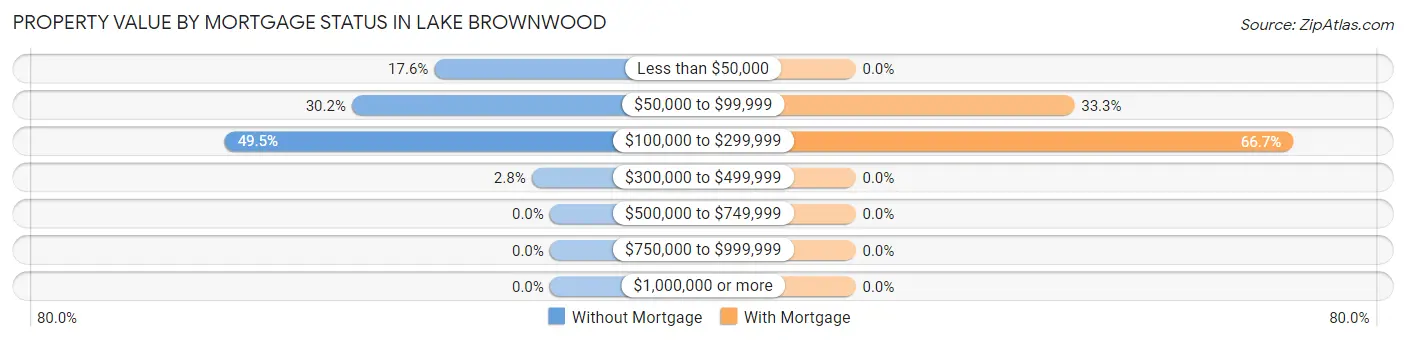
| Property Value | Without Mortgage | With Mortgage |
| Less than $50,000 | 70 (17.6%) | 0 (0.0%) |
| $50,000 to $99,999 | 120 (30.1%) | 63 (33.3%) |
| $100,000 to $299,999 | 197 (49.5%) | 126 (66.7%) |
| $300,000 to $499,999 | 11 (2.8%) | 0 (0.0%) |
| $500,000 to $749,999 | 0 (0.0%) | 0 (0.0%) |
| $750,000 to $999,999 | 0 (0.0%) | 0 (0.0%) |
| $1,000,000 or more | 0 (0.0%) | 0 (0.0%) |
| Total | 398 (100.0%) | 189 (100.0%) |
Household Income by Mortgage Status in Lake Brownwood
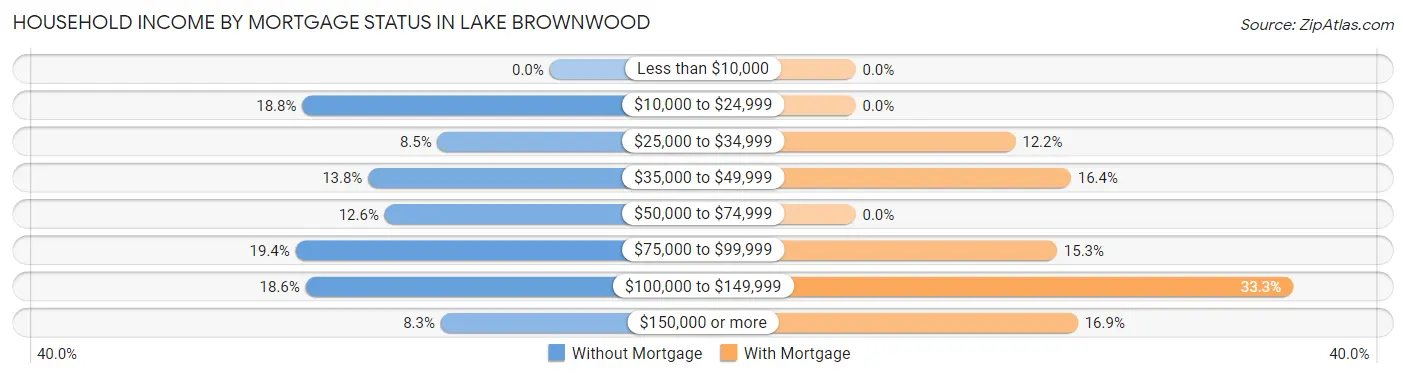
| Household Income | Without Mortgage | With Mortgage |
| Less than $10,000 | 0 (0.0%) | 0 (0.0%) |
| $10,000 to $24,999 | 75 (18.8%) | 0 (0.0%) |
| $25,000 to $34,999 | 34 (8.5%) | 23 (12.2%) |
| $35,000 to $49,999 | 55 (13.8%) | 31 (16.4%) |
| $50,000 to $74,999 | 50 (12.6%) | 0 (0.0%) |
| $75,000 to $99,999 | 77 (19.4%) | 29 (15.3%) |
| $100,000 to $149,999 | 74 (18.6%) | 63 (33.3%) |
| $150,000 or more | 33 (8.3%) | 32 (16.9%) |
| Total | 398 (100.0%) | 189 (100.0%) |
Property Value to Household Income Ratio in Lake Brownwood
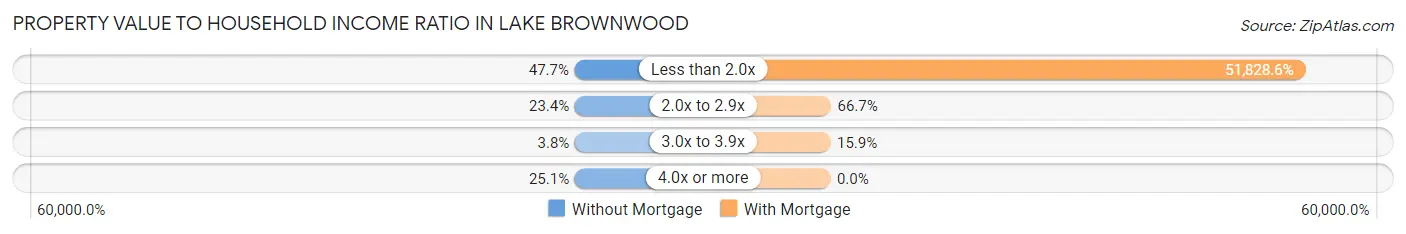
| Value-to-Income Ratio | Without Mortgage | With Mortgage |
| Less than 2.0x | 190 (47.7%) | 97,956 (51,828.6%) |
| 2.0x to 2.9x | 93 (23.4%) | 126 (66.7%) |
| 3.0x to 3.9x | 15 (3.8%) | 30 (15.9%) |
| 4.0x or more | 100 (25.1%) | 0 (0.0%) |
| Total | 398 (100.0%) | 189 (100.0%) |
Real Estate Taxes by Mortgage Status in Lake Brownwood
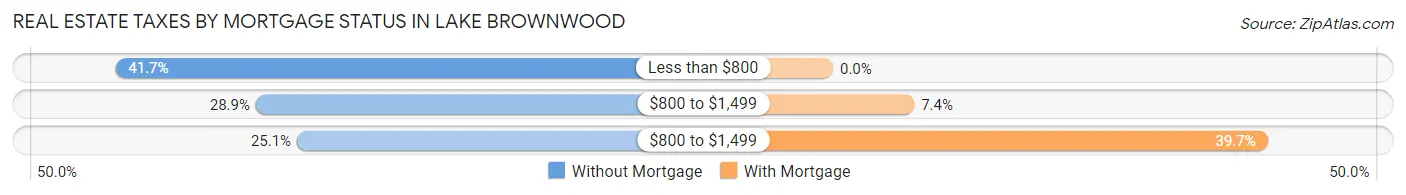
| Property Taxes | Without Mortgage | With Mortgage |
| Less than $800 | 166 (41.7%) | 0 (0.0%) |
| $800 to $1,499 | 115 (28.9%) | 14 (7.4%) |
| $800 to $1,499 | 100 (25.1%) | 75 (39.7%) |
| Total | 398 (100.0%) | 189 (100.0%) |
Health & Disability in Lake Brownwood
Health Insurance Coverage by Age in Lake Brownwood
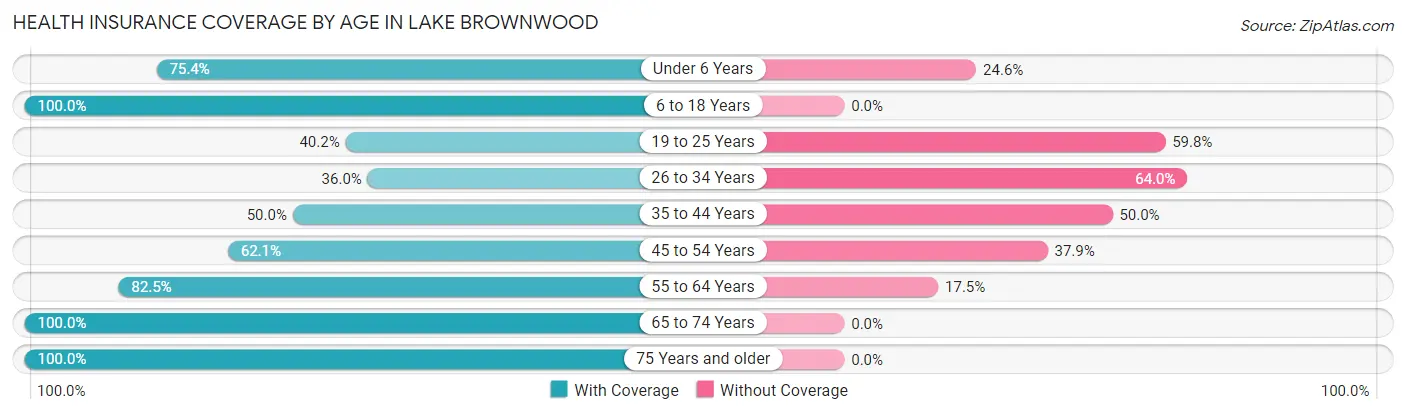
| Age Bracket | With Coverage | Without Coverage |
| Under 6 Years | 138 (75.4%) | 45 (24.6%) |
| 6 to 18 Years | 162 (100.0%) | 0 (0.0%) |
| 19 to 25 Years | 51 (40.2%) | 76 (59.8%) |
| 26 to 34 Years | 49 (36.0%) | 87 (64.0%) |
| 35 to 44 Years | 73 (50.0%) | 73 (50.0%) |
| 45 to 54 Years | 195 (62.1%) | 119 (37.9%) |
| 55 to 64 Years | 198 (82.5%) | 42 (17.5%) |
| 65 to 74 Years | 240 (100.0%) | 0 (0.0%) |
| 75 Years and older | 151 (100.0%) | 0 (0.0%) |
| Total | 1,257 (74.0%) | 442 (26.0%) |
Health Insurance Coverage by Citizenship Status in Lake Brownwood
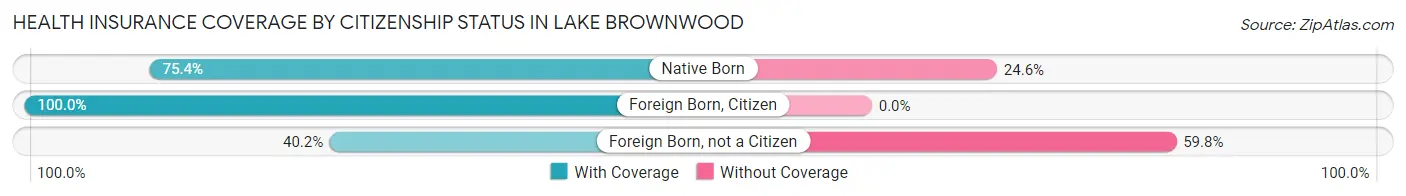
| Citizenship Status | With Coverage | Without Coverage |
| Native Born | 138 (75.4%) | 45 (24.6%) |
| Foreign Born, Citizen | 162 (100.0%) | 0 (0.0%) |
| Foreign Born, not a Citizen | 51 (40.2%) | 76 (59.8%) |
Health Insurance Coverage by Household Income in Lake Brownwood
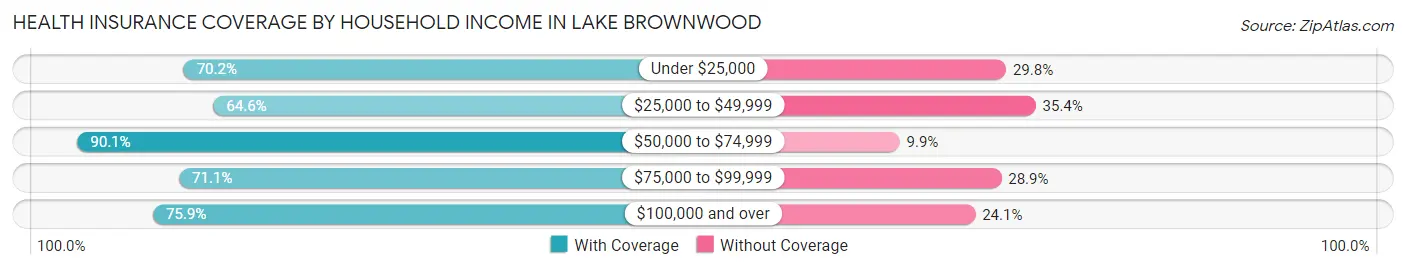
| Household Income | With Coverage | Without Coverage |
| Under $25,000 | 153 (70.2%) | 65 (29.8%) |
| $25,000 to $49,999 | 168 (64.6%) | 92 (35.4%) |
| $50,000 to $74,999 | 164 (90.1%) | 18 (9.9%) |
| $75,000 to $99,999 | 248 (71.1%) | 101 (28.9%) |
| $100,000 and over | 524 (75.9%) | 166 (24.1%) |
Public vs Private Health Insurance Coverage by Age in Lake Brownwood
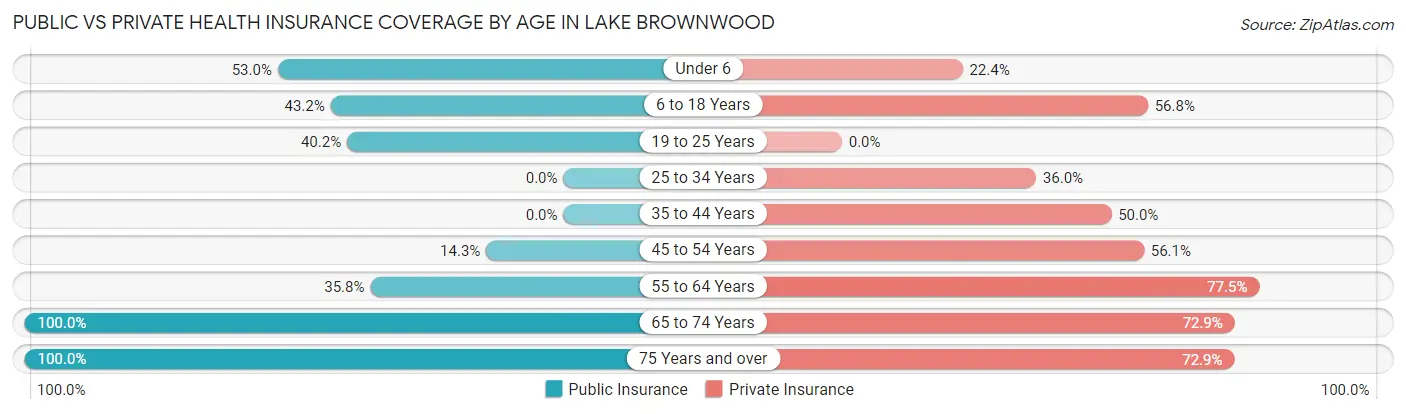
| Age Bracket | Public Insurance | Private Insurance |
| Under 6 | 97 (53.0%) | 41 (22.4%) |
| 6 to 18 Years | 70 (43.2%) | 92 (56.8%) |
| 19 to 25 Years | 51 (40.2%) | 0 (0.0%) |
| 25 to 34 Years | 0 (0.0%) | 49 (36.0%) |
| 35 to 44 Years | 0 (0.0%) | 73 (50.0%) |
| 45 to 54 Years | 45 (14.3%) | 176 (56.0%) |
| 55 to 64 Years | 86 (35.8%) | 186 (77.5%) |
| 65 to 74 Years | 240 (100.0%) | 175 (72.9%) |
| 75 Years and over | 151 (100.0%) | 110 (72.9%) |
| Total | 740 (43.6%) | 902 (53.1%) |
Disability Status by Sex by Age in Lake Brownwood
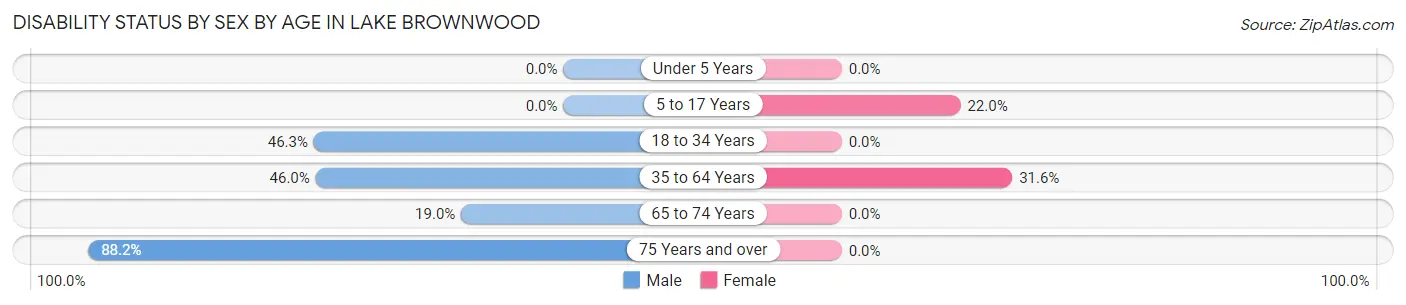
| Age Bracket | Male | Female |
| Under 5 Years | 0 (0.0%) | 0 (0.0%) |
| 5 to 17 Years | 0 (0.0%) | 13 (22.0%) |
| 18 to 34 Years | 63 (46.3%) | 0 (0.0%) |
| 35 to 64 Years | 178 (46.0%) | 99 (31.6%) |
| 65 to 74 Years | 22 (19.0%) | 0 (0.0%) |
| 75 Years and over | 112 (88.2%) | 0 (0.0%) |
Disability Class by Sex by Age in Lake Brownwood
Disability Class: Hearing Difficulty

| Age Bracket | Male | Female |
| Under 5 Years | 0 (0.0%) | 0 (0.0%) |
| 5 to 17 Years | 0 (0.0%) | 0 (0.0%) |
| 18 to 34 Years | 0 (0.0%) | 0 (0.0%) |
| 35 to 64 Years | 131 (33.9%) | 34 (10.9%) |
| 65 to 74 Years | 0 (0.0%) | 0 (0.0%) |
| 75 Years and over | 41 (32.3%) | 0 (0.0%) |
Disability Class: Vision Difficulty
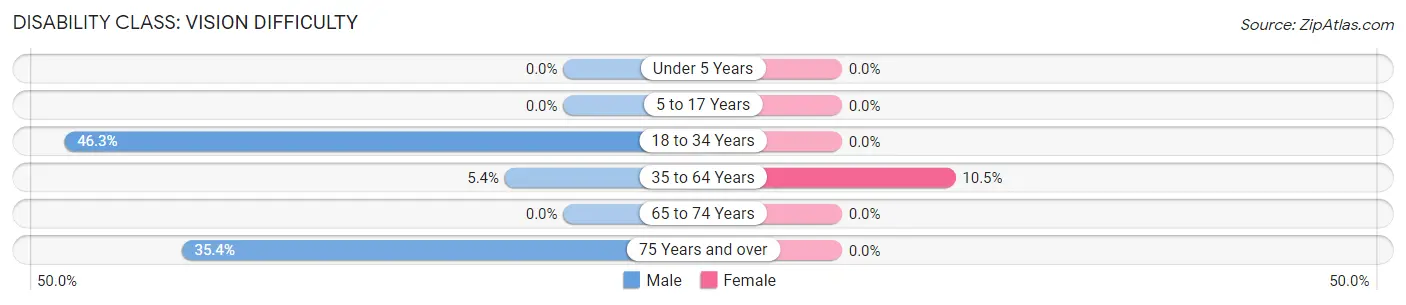
| Age Bracket | Male | Female |
| Under 5 Years | 0 (0.0%) | 0 (0.0%) |
| 5 to 17 Years | 0 (0.0%) | 0 (0.0%) |
| 18 to 34 Years | 63 (46.3%) | 0 (0.0%) |
| 35 to 64 Years | 21 (5.4%) | 33 (10.5%) |
| 65 to 74 Years | 0 (0.0%) | 0 (0.0%) |
| 75 Years and over | 45 (35.4%) | 0 (0.0%) |
Disability Class: Cognitive Difficulty
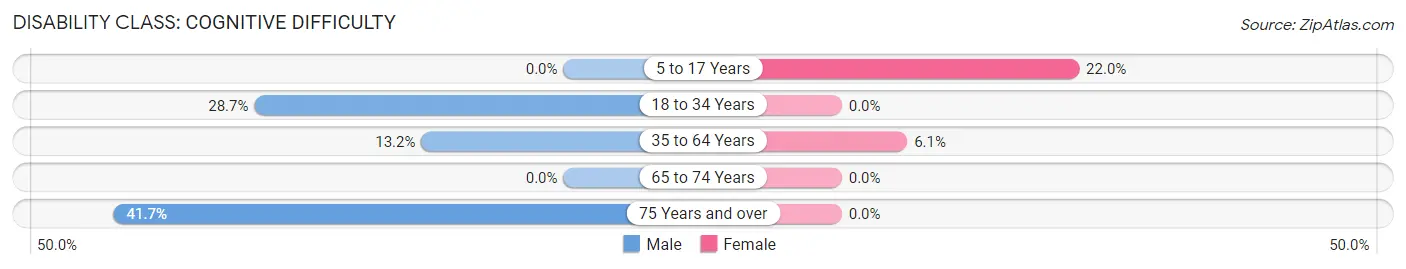
| Age Bracket | Male | Female |
| 5 to 17 Years | 0 (0.0%) | 13 (22.0%) |
| 18 to 34 Years | 39 (28.7%) | 0 (0.0%) |
| 35 to 64 Years | 51 (13.2%) | 19 (6.1%) |
| 65 to 74 Years | 0 (0.0%) | 0 (0.0%) |
| 75 Years and over | 53 (41.7%) | 0 (0.0%) |
Disability Class: Ambulatory Difficulty
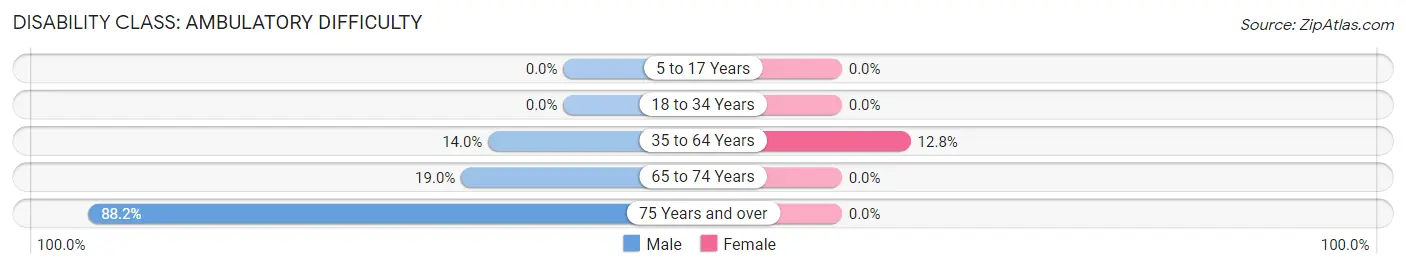
| Age Bracket | Male | Female |
| 5 to 17 Years | 0 (0.0%) | 0 (0.0%) |
| 18 to 34 Years | 0 (0.0%) | 0 (0.0%) |
| 35 to 64 Years | 54 (14.0%) | 40 (12.8%) |
| 65 to 74 Years | 22 (19.0%) | 0 (0.0%) |
| 75 Years and over | 112 (88.2%) | 0 (0.0%) |
Disability Class: Self-Care Difficulty
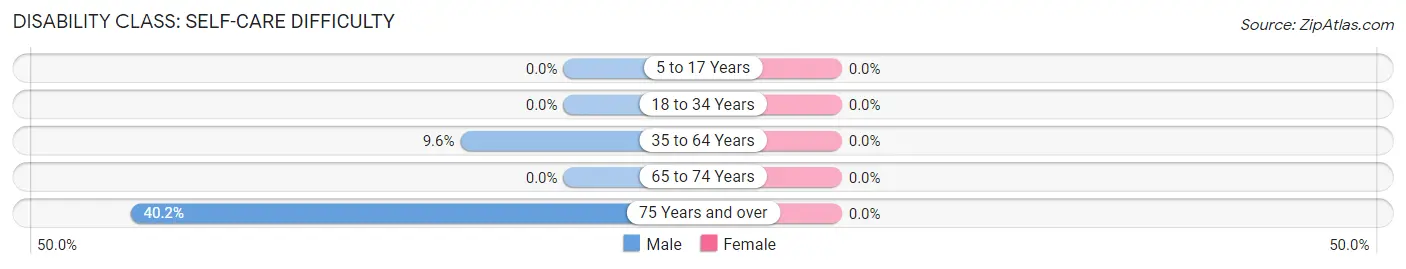
| Age Bracket | Male | Female |
| 5 to 17 Years | 0 (0.0%) | 0 (0.0%) |
| 18 to 34 Years | 0 (0.0%) | 0 (0.0%) |
| 35 to 64 Years | 37 (9.6%) | 0 (0.0%) |
| 65 to 74 Years | 0 (0.0%) | 0 (0.0%) |
| 75 Years and over | 51 (40.2%) | 0 (0.0%) |
Technology Access in Lake Brownwood
Computing Device Access in Lake Brownwood
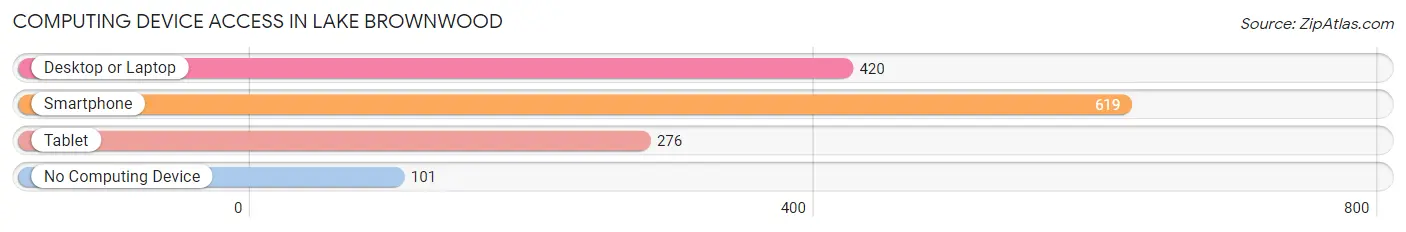
| Device Type | # Households | % Households |
| Desktop or Laptop | 420 | 57.1% |
| Smartphone | 619 | 84.1% |
| Tablet | 276 | 37.5% |
| No Computing Device | 101 | 13.7% |
| Total | 736 | 100.0% |
Internet Access in Lake Brownwood
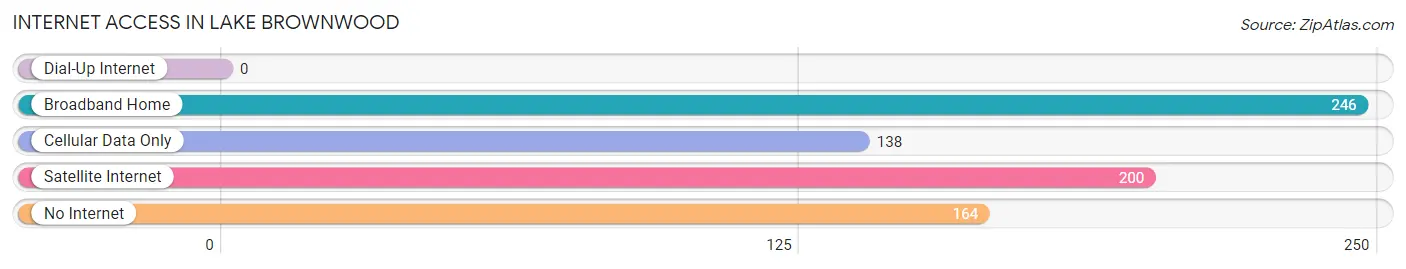
| Internet Type | # Households | % Households |
| Dial-Up Internet | 0 | 0.0% |
| Broadband Home | 246 | 33.4% |
| Cellular Data Only | 138 | 18.8% |
| Satellite Internet | 200 | 27.2% |
| No Internet | 164 | 22.3% |
| Total | 736 | 100.0% |
Lake Brownwood Summary
Brownwood, Texas is a city located in Brown County, Texas, United States. It is the county seat of Brown County and is located in the heart of Central Texas. The city is situated in the rolling hills of the Edwards Plateau, and is known for its beautiful lakes and rivers. The city is home to Howard Payne University, a private Baptist university, and is the birthplace of the legendary country singer, Willie Nelson.
History
The area that is now Brownwood was first settled in 1853 by a group of settlers from the nearby town of May. The settlers named the area Brownwood after the nearby Brownwood Creek. The town was officially incorporated in 1884 and was named the county seat of Brown County in 1889.
In the late 19th century, Brownwood was a bustling center of commerce and industry. The city was home to several sawmills, cotton gins, and other businesses. The city was also home to several railroads, which helped to fuel the city’s growth.
In the early 20th century, Brownwood was a major center of the oil and gas industry. The city was home to several oil refineries and other related businesses. The city was also home to several large manufacturing plants, including a cotton mill and a shoe factory.
Geography
Brownwood is located in Central Texas, in the rolling hills of the Edwards Plateau. The city is situated at the intersection of U.S. Highway 84 and State Highway 279. The city is located approximately 100 miles west of Austin and 150 miles south of Dallas.
The city is home to several lakes and rivers, including Lake Brownwood, Lake Coleman, and the Colorado River. The city is also home to several parks, including the Brownwood City Park, the Brownwood State Park, and the Lake Brownwood State Park.
Economy
The economy of Brownwood is largely based on the oil and gas industry, manufacturing, and tourism. The city is home to several oil refineries and other related businesses. The city is also home to several large manufacturing plants, including a cotton mill and a shoe factory.
The city is also home to several tourist attractions, including the Brownwood City Park, the Brownwood State Park, and the Lake Brownwood State Park. The city is also home to several museums, including the Brownwood Museum of History and the Brownwood Art Museum.
Demographics
As of the 2010 census, the population of Brownwood was 19,288. The racial makeup of the city was 79.2% White, 11.7% African American, 0.7% Native American, 0.7% Asian, 0.1% Pacific Islander, 5.7% from other races, and 2.1% from two or more races. Hispanic or Latino of any race were 13.2% of the population.
The median income for a household in the city was $31,945, and the median income for a family was $41,945. The per capita income for the city was $17,945. About 17.2% of families and 21.2% of the population were below the poverty line, including 28.2% of those under age 18 and 11.2% of those age 65 or over.
Brownwood is a vibrant city with a rich history and a bright future. The city is home to several businesses, attractions, and parks, and is a great place to live, work, and play.
Common Questions
What is Per Capita Income in Lake Brownwood?
Per Capita income in Lake Brownwood is $34,890.
What is the Median Family Income in Lake Brownwood?
Median Family Income in Lake Brownwood is $77,118.
What is the Median Household income in Lake Brownwood?
Median Household Income in Lake Brownwood is $74,737.
What is Income or Wage Gap in Lake Brownwood?
Income or Wage Gap in Lake Brownwood is 29.5%.
Women in Lake Brownwood earn 70.5 cents for every dollar earned by a man.
What is Inequality or Gini Index in Lake Brownwood?
Inequality or Gini Index in Lake Brownwood is 0.40.
What is the Total Population of Lake Brownwood?
Total Population of Lake Brownwood is 1,699.
What is the Total Male Population of Lake Brownwood?
Total Male Population of Lake Brownwood is 923.
What is the Total Female Population of Lake Brownwood?
Total Female Population of Lake Brownwood is 776.
What is the Ratio of Males per 100 Females in Lake Brownwood?
There are 118.94 Males per 100 Females in Lake Brownwood.
What is the Ratio of Females per 100 Males in Lake Brownwood?
There are 84.07 Females per 100 Males in Lake Brownwood.
What is the Median Population Age in Lake Brownwood?
Median Population Age in Lake Brownwood is 50.3 Years.
What is the Average Family Size in Lake Brownwood
Average Family Size in Lake Brownwood is 3.1 People.
What is the Average Household Size in Lake Brownwood
Average Household Size in Lake Brownwood is 2.3 People.
How Large is the Labor Force in Lake Brownwood?
There are 857 People in the Labor Forcein in Lake Brownwood.
What is the Percentage of People in the Labor Force in Lake Brownwood?
62.4% of People are in the Labor Force in Lake Brownwood.
What is the Unemployment Rate in Lake Brownwood?
Unemployment Rate in Lake Brownwood is 6.1%.