Zip Codes with the Highest Percentage of Population Employed in Installation, Maintenance & Repair in Brownsville, TX
RELATED REPORTS & OPTIONS
Installation, Maintenance & Repair
Brownsville
Compare Zip Codes
Map of Zip Codes with the Highest Percentage of Population Employed in Installation, Maintenance & Repair in Brownsville
2.3%
3.6%
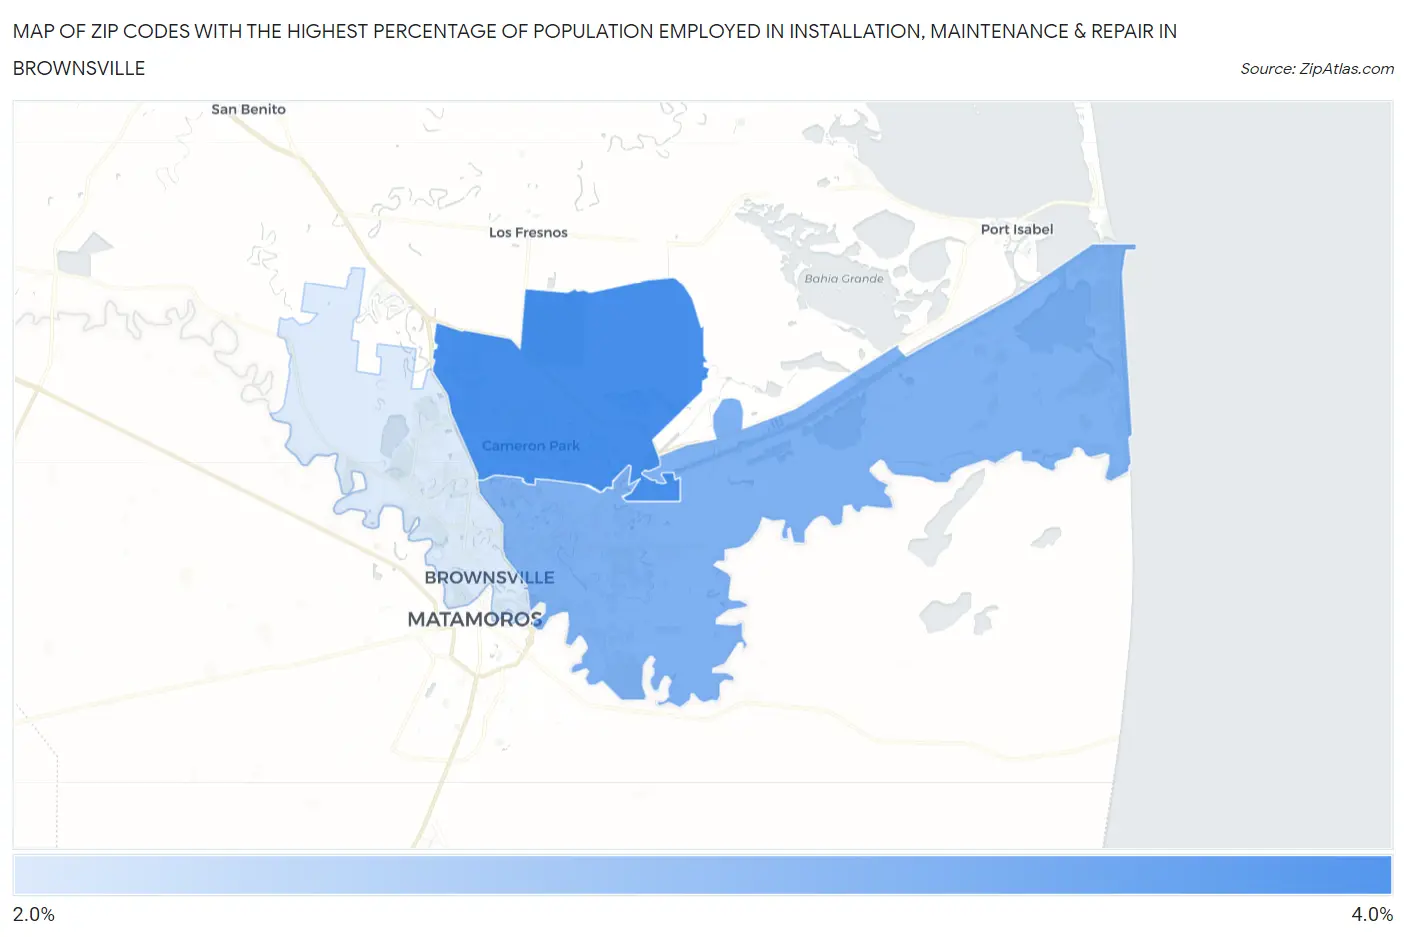
Zip Codes with the Highest Percentage of Population Employed in Installation, Maintenance & Repair in Brownsville, TX
| Zip Code | % Employed | vs State | vs National | |
| 1. | 78526 | 3.6% | 3.4%(+0.148)#886 | 3.1%(+0.483)#14,379 |
| 2. | 78521 | 3.1% | 3.4%(-0.325)#1,031 | 3.1%(+0.010)#16,622 |
| 3. | 78520 | 2.3% | 3.4%(-1.12)#1,263 | 3.1%(-0.788)#20,683 |
1
Common Questions
What are the Top Zip Codes with the Highest Percentage of Population Employed in Installation, Maintenance & Repair in Brownsville, TX?
Top Zip Codes with the Highest Percentage of Population Employed in Installation, Maintenance & Repair in Brownsville, TX are:
What zip code has the Highest Percentage of Population Employed in Installation, Maintenance & Repair in Brownsville, TX?
78526 has the Highest Percentage of Population Employed in Installation, Maintenance & Repair in Brownsville, TX with 3.6%.
What is the Percentage of Population Employed in Installation, Maintenance & Repair in Brownsville, TX?
Percentage of Population Employed in Installation, Maintenance & Repair in Brownsville is 2.9%.
What is the Percentage of Population Employed in Installation, Maintenance & Repair in Texas?
Percentage of Population Employed in Installation, Maintenance & Repair in Texas is 3.4%.
What is the Percentage of Population Employed in Installation, Maintenance & Repair in the United States?
Percentage of Population Employed in Installation, Maintenance & Repair in the United States is 3.1%.