Zip Codes with the Highest Percentage of Population Employed in Installation, Maintenance & Repair in Pearland, TX
RELATED REPORTS & OPTIONS
Installation, Maintenance & Repair
Pearland
Compare Zip Codes
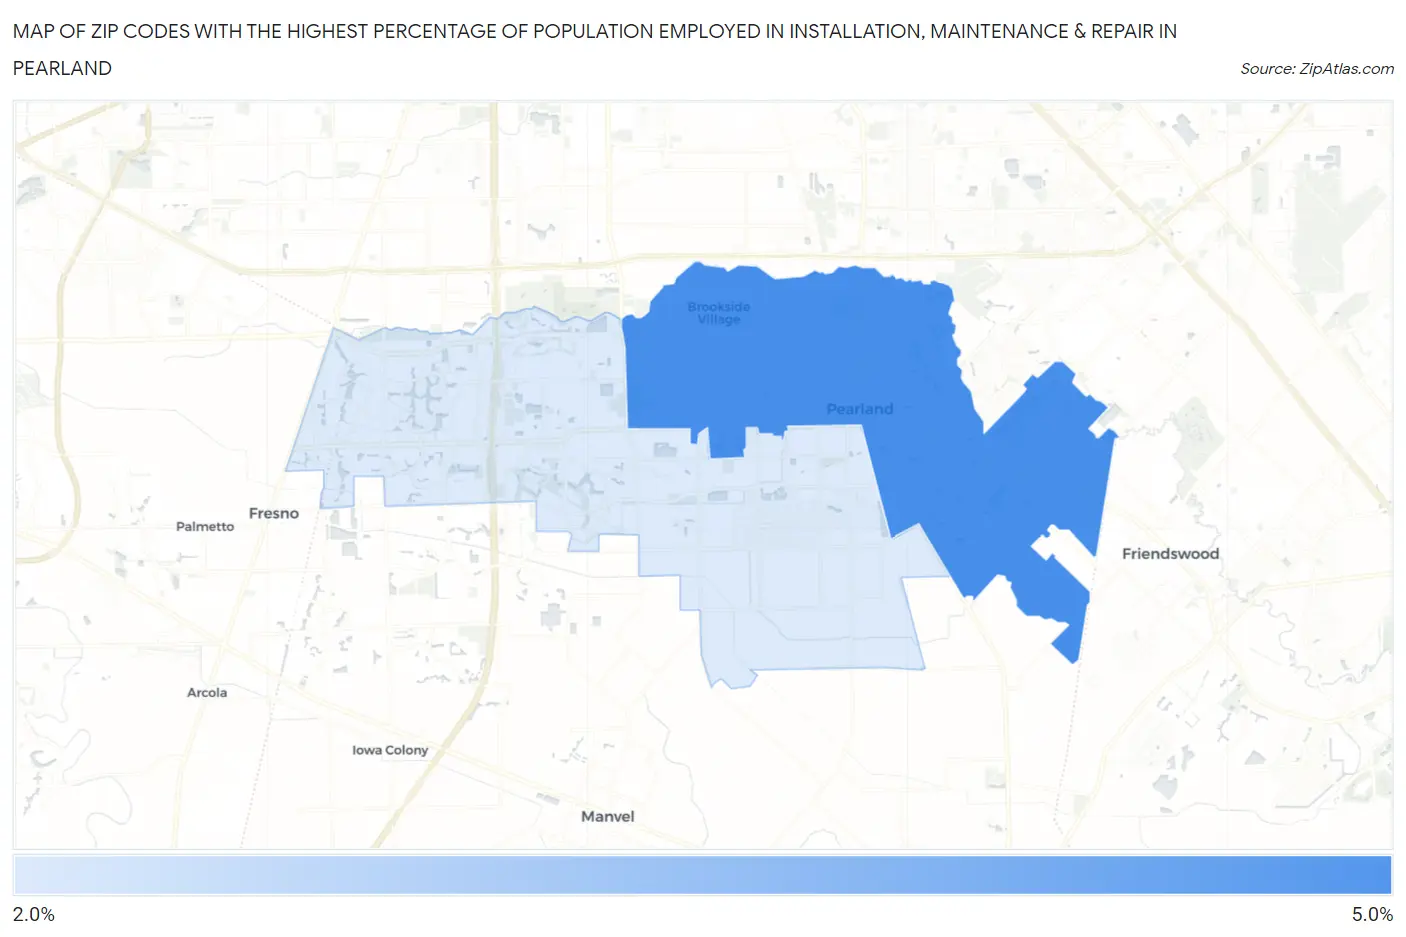
Map of Zip Codes with the Highest Percentage of Population Employed in Installation, Maintenance & Repair in Pearland
2.4%
4.5%
Zip Codes with the Highest Percentage of Population Employed in Installation, Maintenance & Repair in Pearland, TX
| Zip Code | % Employed | vs State | vs National | |
| 1. | 77581 | 4.5% | 3.4%(+1.07)#645 | 3.1%(+1.40)#10,535 |
| 2. | 77584 | 2.4% | 3.4%(-0.965)#1,220 | 3.1%(-0.629)#19,874 |
1
Common Questions
What are the Top Zip Codes with the Highest Percentage of Population Employed in Installation, Maintenance & Repair in Pearland, TX?
Top Zip Codes with the Highest Percentage of Population Employed in Installation, Maintenance & Repair in Pearland, TX are:
What zip code has the Highest Percentage of Population Employed in Installation, Maintenance & Repair in Pearland, TX?
77581 has the Highest Percentage of Population Employed in Installation, Maintenance & Repair in Pearland, TX with 4.5%.
What is the Percentage of Population Employed in Installation, Maintenance & Repair in Pearland, TX?
Percentage of Population Employed in Installation, Maintenance & Repair in Pearland is 3.5%.
What is the Percentage of Population Employed in Installation, Maintenance & Repair in Texas?
Percentage of Population Employed in Installation, Maintenance & Repair in Texas is 3.4%.
What is the Percentage of Population Employed in Installation, Maintenance & Repair in the United States?
Percentage of Population Employed in Installation, Maintenance & Repair in the United States is 3.1%.