Pelican Bay, TX Map & Demographics
Pelican Bay Map
Pelican Bay Overview
$22,043
PER CAPITA INCOME
$68,750
AVG FAMILY INCOME
$49,657
AVG HOUSEHOLD INCOME
51.5%
WAGE / INCOME GAP [ % ]
48.5¢/ $1
WAGE / INCOME GAP [ $ ]
$7,874
FAMILY INCOME DEFICIT
0.36
INEQUALITY / GINI INDEX
2,172
TOTAL POPULATION
1,121
MALE POPULATION
1,051
FEMALE POPULATION
106.66
MALES / 100 FEMALES
93.76
FEMALES / 100 MALES
29.5
MEDIAN AGE
3.4
AVG FAMILY SIZE
2.8
AVG HOUSEHOLD SIZE
946
LABOR FORCE [ PEOPLE ]
61.1%
PERCENT IN LABOR FORCE
10.2%
UNEMPLOYMENT RATE
Income in Pelican Bay
Income Overview in Pelican Bay
Per Capita Income in Pelican Bay is $22,043, while median incomes of families and households are $68,750 and $49,657 respectively.
| Characteristic | Number | Measure |
| Per Capita Income | 2,172 | $22,043 |
| Median Family Income | 531 | $68,750 |
| Mean Family Income | 531 | $68,338 |
| Median Household Income | 784 | $49,657 |
| Mean Household Income | 784 | $59,359 |
| Income Deficit | 531 | $7,874 |
| Wage / Income Gap (%) | 2,172 | 51.47% |
| Wage / Income Gap ($) | 2,172 | 48.53¢ per $1 |
| Gini / Inequality Index | 2,172 | 0.36 |
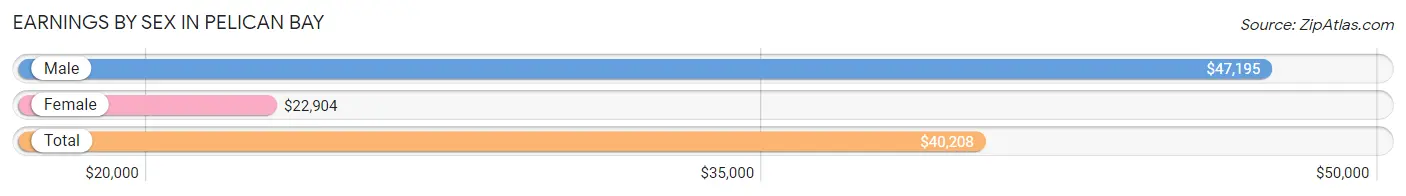
Earnings by Sex in Pelican Bay
Average Earnings in Pelican Bay are $40,208, $47,195 for men and $22,904 for women, a difference of 51.5%.
| Sex | Number | Average Earnings |
| Male | 580 (61.6%) | $47,195 |
| Female | 361 (38.4%) | $22,904 |
| Total | 941 (100.0%) | $40,208 |
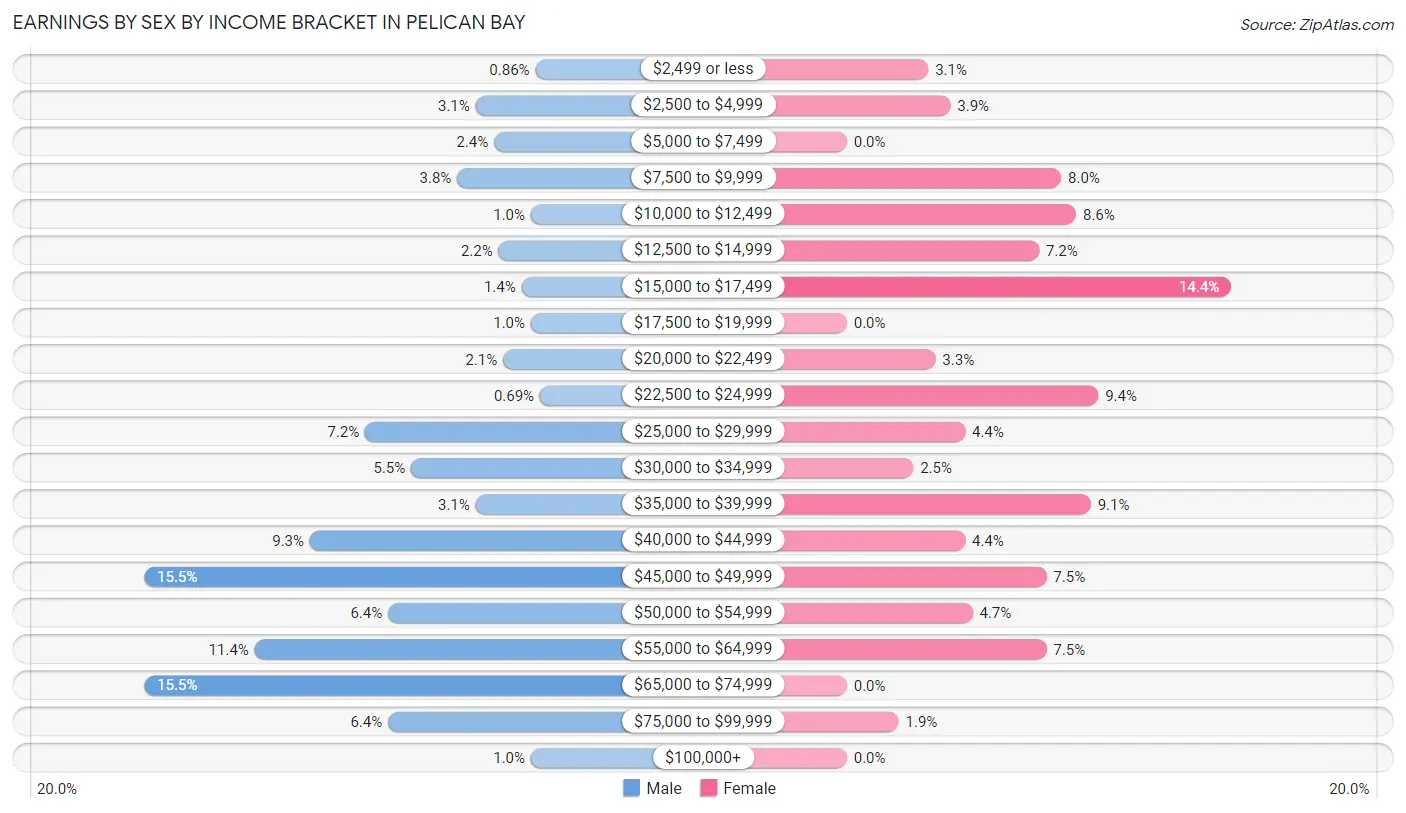
Earnings by Sex by Income Bracket in Pelican Bay
The most common earnings brackets in Pelican Bay are $45,000 to $49,999 for men (90 | 15.5%) and $15,000 to $17,499 for women (52 | 14.4%).
| Income | Male | Female |
| $2,499 or less | 5 (0.9%) | 11 (3.0%) |
| $2,500 to $4,999 | 18 (3.1%) | 14 (3.9%) |
| $5,000 to $7,499 | 14 (2.4%) | 0 (0.0%) |
| $7,500 to $9,999 | 22 (3.8%) | 29 (8.0%) |
| $10,000 to $12,499 | 6 (1.0%) | 31 (8.6%) |
| $12,500 to $14,999 | 13 (2.2%) | 26 (7.2%) |
| $15,000 to $17,499 | 8 (1.4%) | 52 (14.4%) |
| $17,500 to $19,999 | 6 (1.0%) | 0 (0.0%) |
| $20,000 to $22,499 | 12 (2.1%) | 12 (3.3%) |
| $22,500 to $24,999 | 4 (0.7%) | 34 (9.4%) |
| $25,000 to $29,999 | 42 (7.2%) | 16 (4.4%) |
| $30,000 to $34,999 | 32 (5.5%) | 9 (2.5%) |
| $35,000 to $39,999 | 18 (3.1%) | 33 (9.1%) |
| $40,000 to $44,999 | 54 (9.3%) | 16 (4.4%) |
| $45,000 to $49,999 | 90 (15.5%) | 27 (7.5%) |
| $50,000 to $54,999 | 37 (6.4%) | 17 (4.7%) |
| $55,000 to $64,999 | 66 (11.4%) | 27 (7.5%) |
| $65,000 to $74,999 | 90 (15.5%) | 0 (0.0%) |
| $75,000 to $99,999 | 37 (6.4%) | 7 (1.9%) |
| $100,000+ | 6 (1.0%) | 0 (0.0%) |
| Total | 580 (100.0%) | 361 (100.0%) |
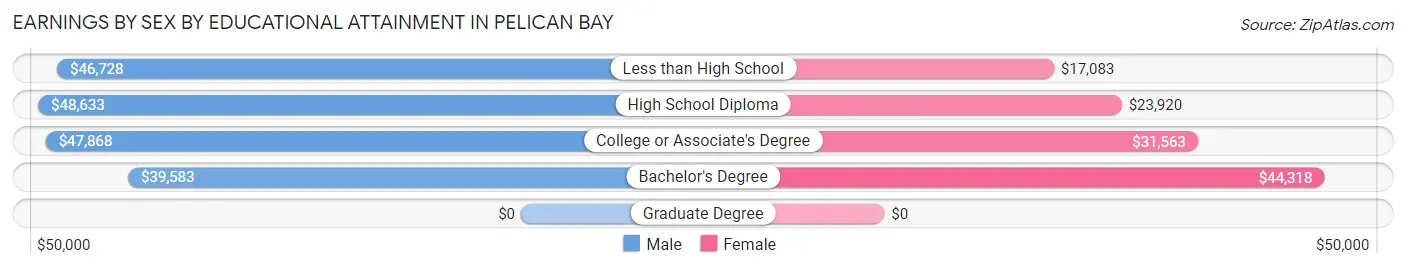
Earnings by Sex by Educational Attainment in Pelican Bay
Average earnings in Pelican Bay are $48,036 for men and $28,906 for women, a difference of 39.8%. Men with an educational attainment of high school diploma enjoy the highest average annual earnings of $48,633, while those with bachelor's degree education earn the least with $39,583. Women with an educational attainment of bachelor's degree earn the most with the average annual earnings of $44,318, while those with less than high school education have the smallest earnings of $17,083.
| Educational Attainment | Male Income | Female Income |
| Less than High School | $46,728 | $17,083 |
| High School Diploma | $48,633 | $23,920 |
| College or Associate's Degree | $47,868 | $31,563 |
| Bachelor's Degree | $39,583 | $44,318 |
| Graduate Degree | - | - |
| Total | $48,036 | $28,906 |
Family Income in Pelican Bay
Family Income Brackets in Pelican Bay
According to the Pelican Bay family income data, there are 147 families falling into the $50,000 to $74,999 income range, which is the most common income bracket and makes up 27.7% of all families. Conversely, the $200,000+ income bracket is the least frequent group with only 8 families (1.5%) belonging to this category.
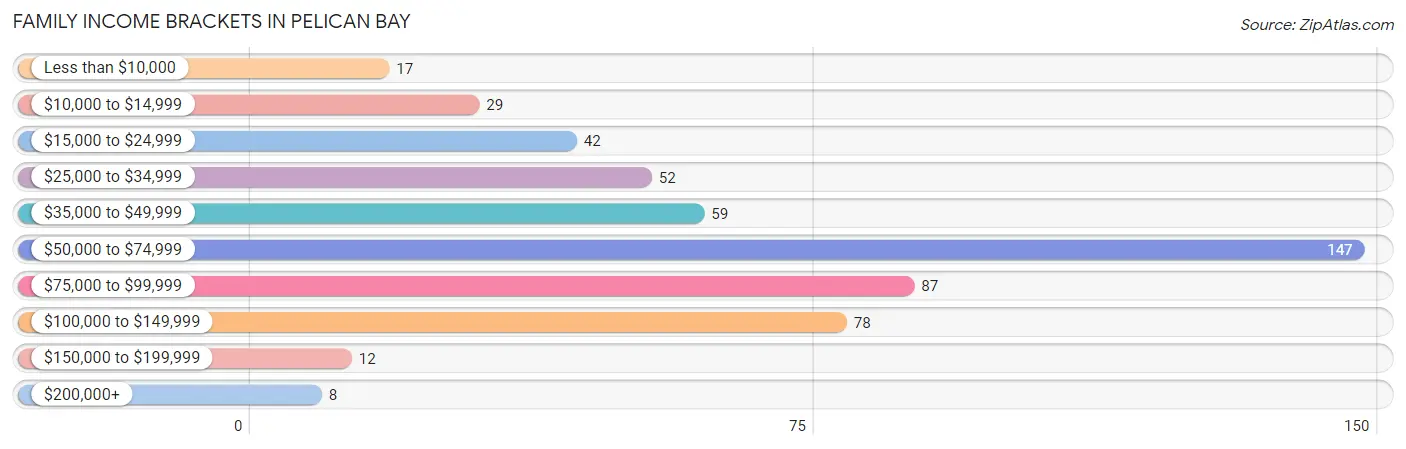
| Income Bracket | # Families | % Families |
| Less than $10,000 | 17 | 3.2% |
| $10,000 to $14,999 | 29 | 5.5% |
| $15,000 to $24,999 | 42 | 7.9% |
| $25,000 to $34,999 | 52 | 9.8% |
| $35,000 to $49,999 | 59 | 11.1% |
| $50,000 to $74,999 | 147 | 27.7% |
| $75,000 to $99,999 | 87 | 16.4% |
| $100,000 to $149,999 | 78 | 14.7% |
| $150,000 to $199,999 | 12 | 2.3% |
| $200,000+ | 8 | 1.5% |
Family Income by Famaliy Size in Pelican Bay
6-person families (30 | 5.7%) account for the highest median family income in Pelican Bay with $98,125 per family, while 3-person families (98 | 18.5%) have the highest median income of $23,333 per family member.
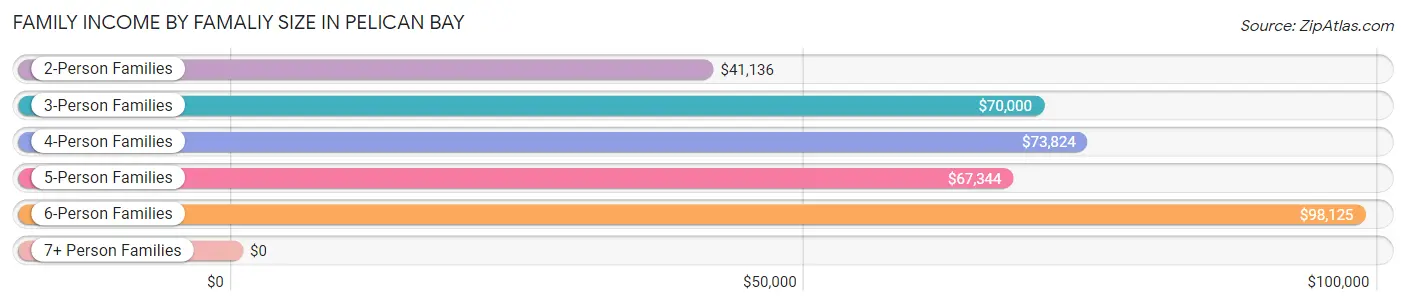
| Income Bracket | # Families | Median Income |
| 2-Person Families | 226 (42.6%) | $41,136 |
| 3-Person Families | 98 (18.5%) | $70,000 |
| 4-Person Families | 118 (22.2%) | $73,824 |
| 5-Person Families | 54 (10.2%) | $67,344 |
| 6-Person Families | 30 (5.7%) | $98,125 |
| 7+ Person Families | 5 (0.9%) | $0 |
| Total | 531 (100.0%) | $68,750 |
Family Income by Number of Earners in Pelican Bay
The median family income in Pelican Bay is $68,750, with families comprising 3+ earners (57) having the highest median family income of $99,938, while families with no earners (110) have the lowest median family income of $28,681, accounting for 10.7% and 20.7% of families, respectively.
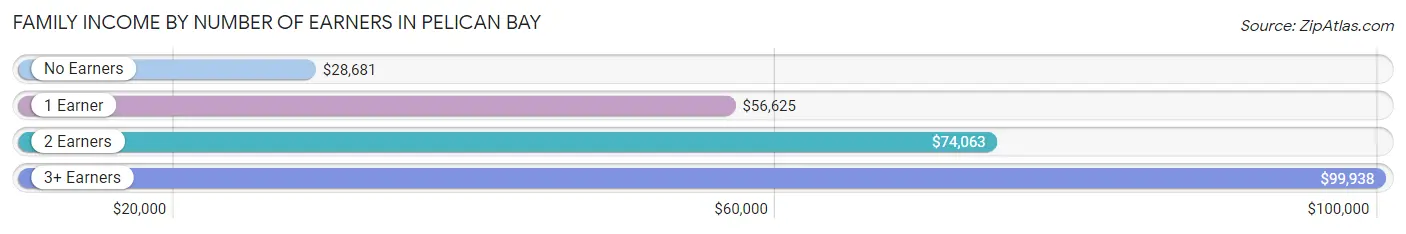
| Number of Earners | # Families | Median Income |
| No Earners | 110 (20.7%) | $28,681 |
| 1 Earner | 227 (42.7%) | $56,625 |
| 2 Earners | 137 (25.8%) | $74,063 |
| 3+ Earners | 57 (10.7%) | $99,938 |
| Total | 531 (100.0%) | $68,750 |
Household Income in Pelican Bay
Household Income Brackets in Pelican Bay
With 165 households falling in the category, the $75,000 to $99,999 income range is the most frequent in Pelican Bay, accounting for 21.0% of all households. In contrast, only 8 households (1.0%) fall into the $200,000+ income bracket, making it the least populous group.
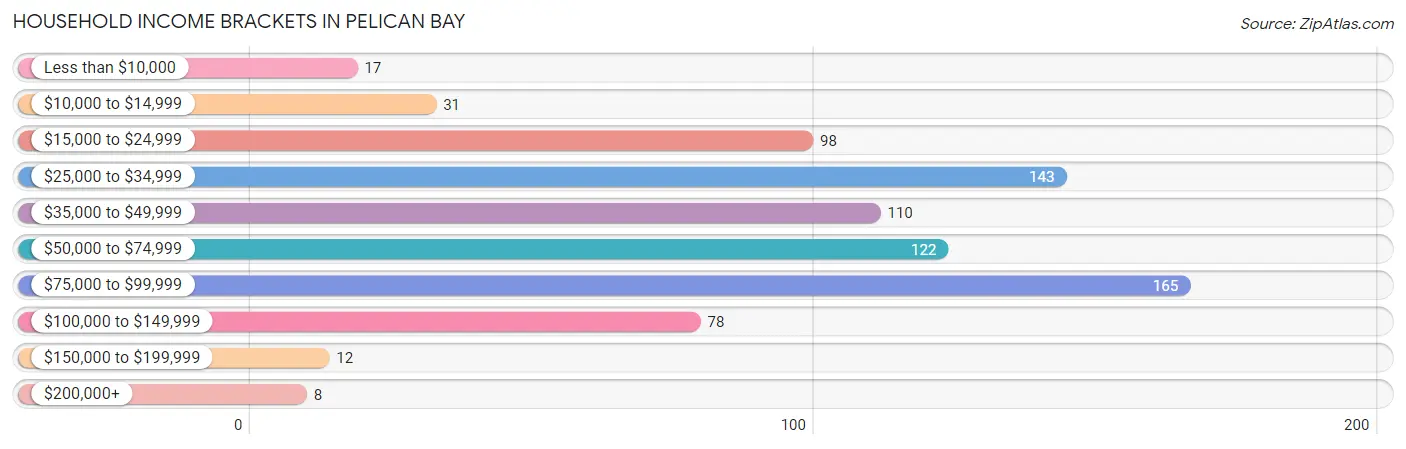
| Income Bracket | # Households | % Households |
| Less than $10,000 | 17 | 2.2% |
| $10,000 to $14,999 | 31 | 4.0% |
| $15,000 to $24,999 | 98 | 12.5% |
| $25,000 to $34,999 | 143 | 18.2% |
| $35,000 to $49,999 | 110 | 14.0% |
| $50,000 to $74,999 | 122 | 15.6% |
| $75,000 to $99,999 | 165 | 21.0% |
| $100,000 to $149,999 | 78 | 9.9% |
| $150,000 to $199,999 | 12 | 1.5% |
| $200,000+ | 8 | 1.0% |
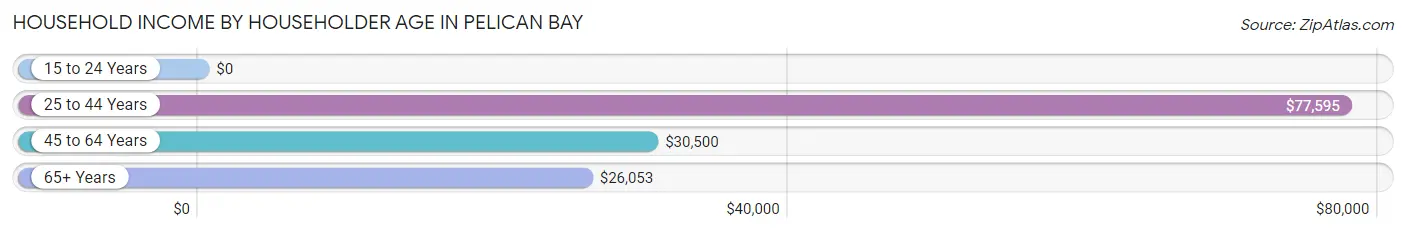
Household Income by Householder Age in Pelican Bay
The median household income in Pelican Bay is $49,657, with the highest median household income of $77,595 found in the 25 to 44 years age bracket for the primary householder. A total of 323 households (41.2%) fall into this category. Meanwhile, the 15 to 24 years age bracket for the primary householder has the lowest median household income of $0, with 29 households (3.7%) in this group.
| Income Bracket | # Households | Median Income |
| 15 to 24 Years | 29 (3.7%) | $0 |
| 25 to 44 Years | 323 (41.2%) | $77,595 |
| 45 to 64 Years | 268 (34.2%) | $30,500 |
| 65+ Years | 164 (20.9%) | $26,053 |
| Total | 784 (100.0%) | $49,657 |
Poverty in Pelican Bay
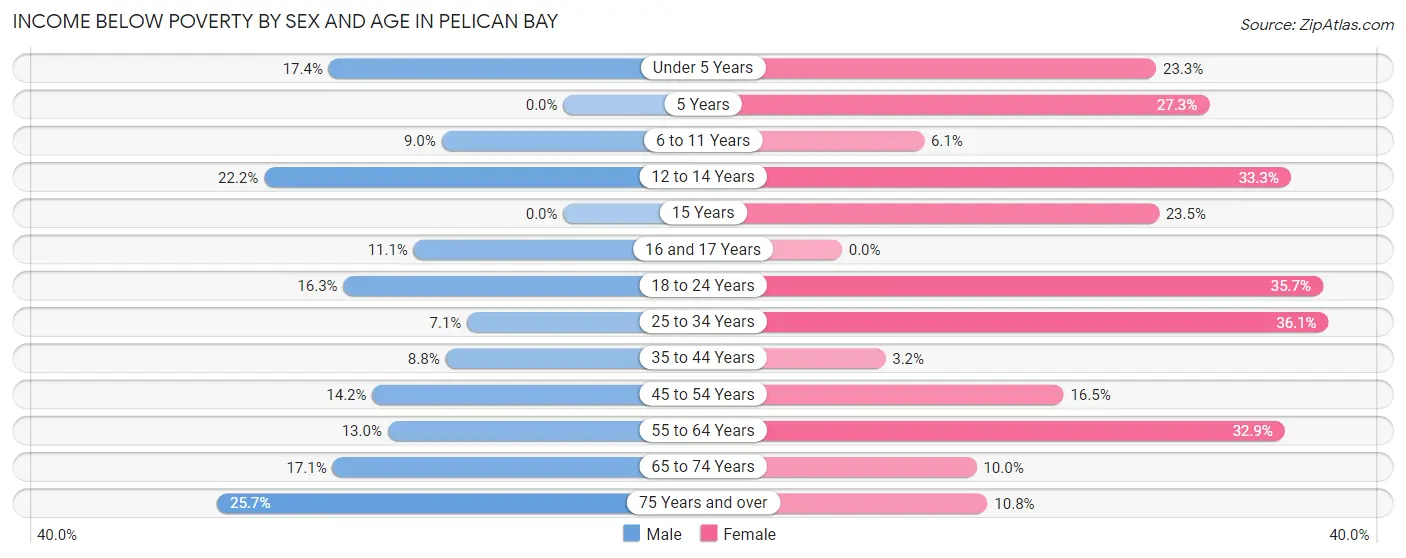
Income Below Poverty by Sex and Age in Pelican Bay
With 12.1% poverty level for males and 22.9% for females among the residents of Pelican Bay, 75 year old and over males and 25 to 34 year old females are the most vulnerable to poverty, with 9 males (25.7%) and 69 females (36.1%) in their respective age groups living below the poverty level.
| Age Bracket | Male | Female |
| Under 5 Years | 23 (17.4%) | 21 (23.3%) |
| 5 Years | 0 (0.0%) | 6 (27.3%) |
| 6 to 11 Years | 15 (9.0%) | 8 (6.1%) |
| 12 to 14 Years | 4 (22.2%) | 13 (33.3%) |
| 15 Years | 0 (0.0%) | 4 (23.5%) |
| 16 and 17 Years | 3 (11.1%) | 0 (0.0%) |
| 18 to 24 Years | 8 (16.3%) | 45 (35.7%) |
| 25 to 34 Years | 20 (7.1%) | 69 (36.1%) |
| 35 to 44 Years | 7 (8.7%) | 3 (3.2%) |
| 45 to 54 Years | 20 (14.2%) | 13 (16.5%) |
| 55 to 64 Years | 15 (13.0%) | 48 (32.9%) |
| 65 to 74 Years | 12 (17.1%) | 7 (10.0%) |
| 75 Years and over | 9 (25.7%) | 4 (10.8%) |
| Total | 136 (12.1%) | 241 (22.9%) |
Income Above Poverty by Sex and Age in Pelican Bay
According to the poverty statistics in Pelican Bay, males aged 15 years and females aged 16 and 17 years are the age groups that are most secure financially, with 100.0% of males and 100.0% of females in these age groups living above the poverty line.

| Age Bracket | Male | Female |
| Under 5 Years | 109 (82.6%) | 69 (76.7%) |
| 5 Years | 0 (0.0%) | 16 (72.7%) |
| 6 to 11 Years | 151 (91.0%) | 123 (93.9%) |
| 12 to 14 Years | 14 (77.8%) | 26 (66.7%) |
| 15 Years | 8 (100.0%) | 13 (76.5%) |
| 16 and 17 Years | 24 (88.9%) | 10 (100.0%) |
| 18 to 24 Years | 41 (83.7%) | 81 (64.3%) |
| 25 to 34 Years | 260 (92.9%) | 122 (63.9%) |
| 35 to 44 Years | 73 (91.2%) | 90 (96.8%) |
| 45 to 54 Years | 121 (85.8%) | 66 (83.5%) |
| 55 to 64 Years | 100 (87.0%) | 98 (67.1%) |
| 65 to 74 Years | 58 (82.9%) | 63 (90.0%) |
| 75 Years and over | 26 (74.3%) | 33 (89.2%) |
| Total | 985 (87.9%) | 810 (77.1%) |
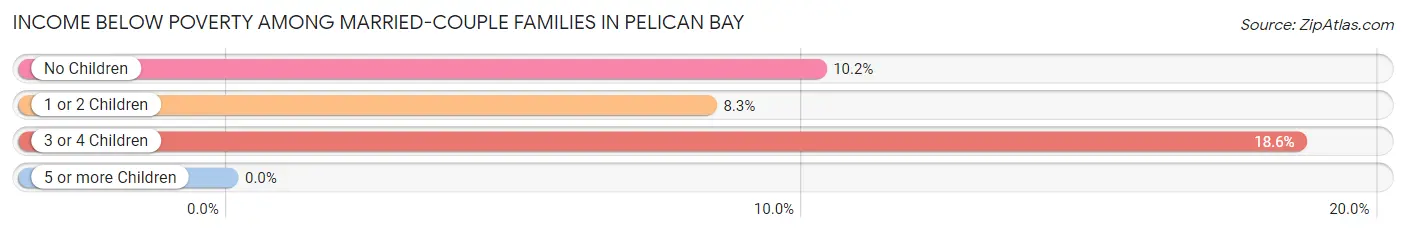
Income Below Poverty Among Married-Couple Families in Pelican Bay
The poverty statistics for married-couple families in Pelican Bay show that 10.6% or 35 of the total 329 families live below the poverty line. Families with 3 or 4 children have the highest poverty rate of 18.6%, comprising of 8 families. On the other hand, families with 1 or 2 children have the lowest poverty rate of 8.3%, which includes 10 families.
| Children | Above Poverty | Below Poverty |
| No Children | 149 (89.8%) | 17 (10.2%) |
| 1 or 2 Children | 110 (91.7%) | 10 (8.3%) |
| 3 or 4 Children | 35 (81.4%) | 8 (18.6%) |
| 5 or more Children | 0 (0.0%) | 0 (0.0%) |
| Total | 294 (89.4%) | 35 (10.6%) |
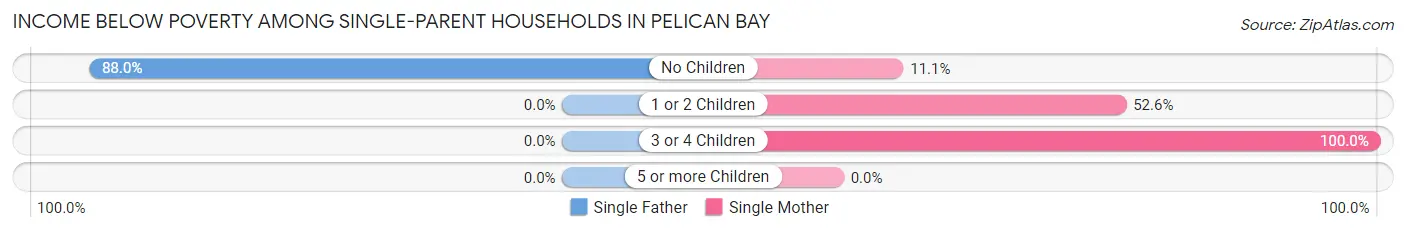
Income Below Poverty Among Single-Parent Households in Pelican Bay
According to the poverty data in Pelican Bay, 16.2% or 22 single-father households and 48.5% or 32 single-mother households are living below the poverty line. Among single-father households, those with no children have the highest poverty rate, with 22 households (88.0%) experiencing poverty. Likewise, among single-mother households, those with 3 or 4 children have the highest poverty rate, with 10 households (100.0%) falling below the poverty line.
| Children | Single Father | Single Mother |
| No Children | 22 (88.0%) | 2 (11.1%) |
| 1 or 2 Children | 0 (0.0%) | 20 (52.6%) |
| 3 or 4 Children | 0 (0.0%) | 10 (100.0%) |
| 5 or more Children | 0 (0.0%) | 0 (0.0%) |
| Total | 22 (16.2%) | 32 (48.5%) |
Income Below Poverty Among Married-Couple vs Single-Parent Households in Pelican Bay
The poverty data for Pelican Bay shows that 35 of the married-couple family households (10.6%) and 54 of the single-parent households (26.7%) are living below the poverty level. Within the married-couple family households, those with 3 or 4 children have the highest poverty rate, with 8 households (18.6%) falling below the poverty line. Among the single-parent households, those with no children have the highest poverty rate, with 24 household (55.8%) living below poverty.
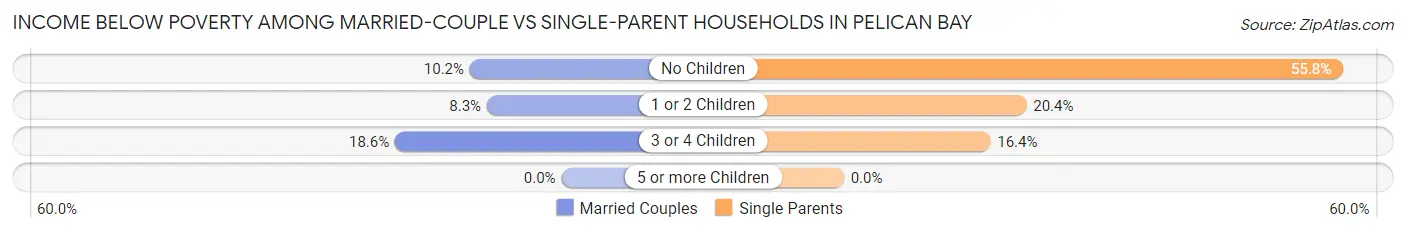
| Children | Married-Couple Families | Single-Parent Households |
| No Children | 17 (10.2%) | 24 (55.8%) |
| 1 or 2 Children | 10 (8.3%) | 20 (20.4%) |
| 3 or 4 Children | 8 (18.6%) | 10 (16.4%) |
| 5 or more Children | 0 (0.0%) | 0 (0.0%) |
| Total | 35 (10.6%) | 54 (26.7%) |
Race in Pelican Bay
The most populous races in Pelican Bay are White / Caucasian (1,715 | 79.0%), Hispanic or Latino (632 | 29.1%), and Some other Race (328 | 15.1%).
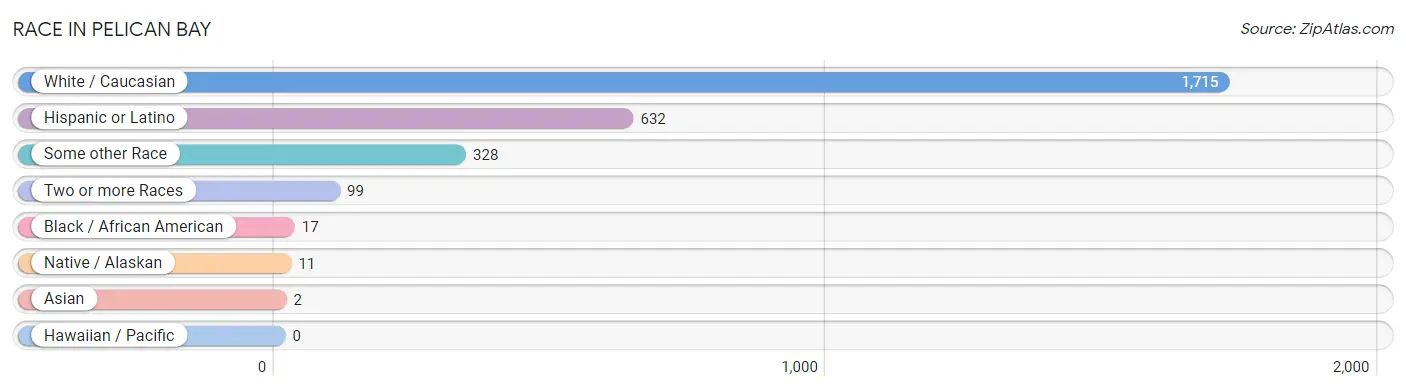
| Race | # Population | % Population |
| Asian | 2 | 0.1% |
| Black / African American | 17 | 0.8% |
| Hawaiian / Pacific | 0 | 0.0% |
| Hispanic or Latino | 632 | 29.1% |
| Native / Alaskan | 11 | 0.5% |
| White / Caucasian | 1,715 | 79.0% |
| Two or more Races | 99 | 4.6% |
| Some other Race | 328 | 15.1% |
| Total | 2,172 | 100.0% |
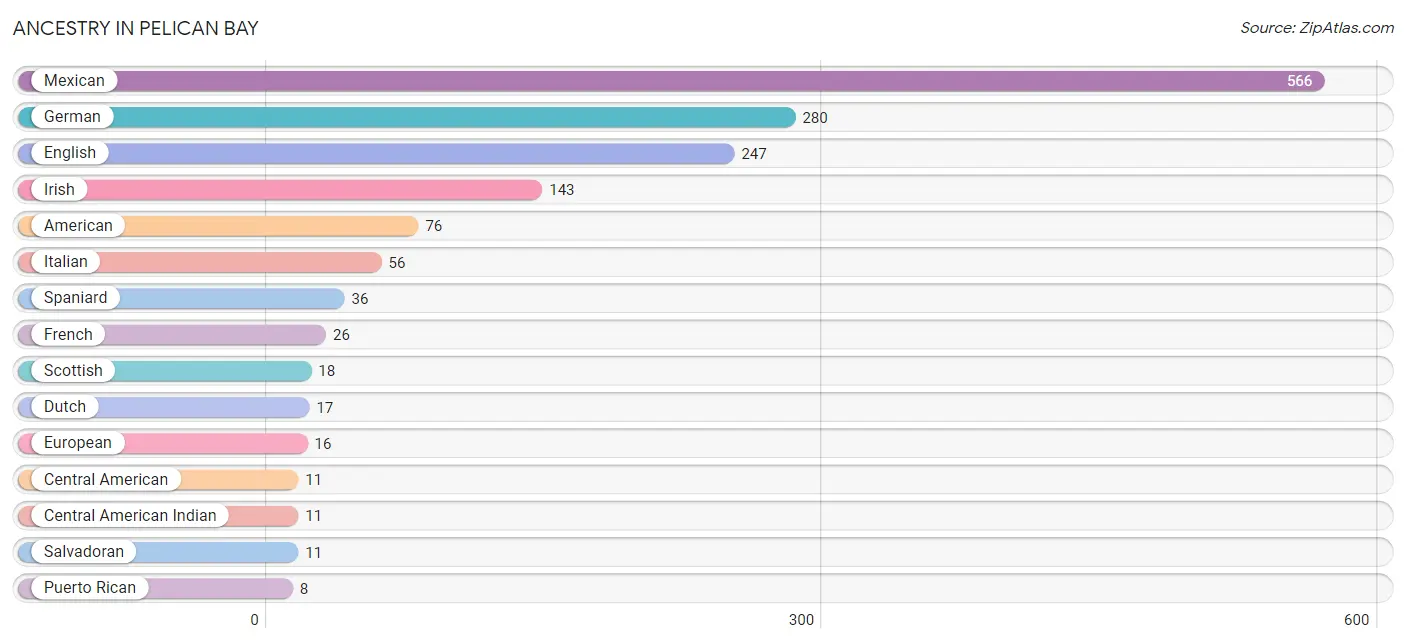
Ancestry in Pelican Bay
The most populous ancestries reported in Pelican Bay are Mexican (566 | 26.1%), German (280 | 12.9%), English (247 | 11.4%), Irish (143 | 6.6%), and American (76 | 3.5%), together accounting for 60.4% of all Pelican Bay residents.
| Ancestry | # Population | % Population |
| African | 5 | 0.2% |
| American | 76 | 3.5% |
| Bhutanese | 3 | 0.1% |
| Blackfeet | 1 | 0.1% |
| Central American | 11 | 0.5% |
| Central American Indian | 11 | 0.5% |
| Cherokee | 4 | 0.2% |
| Dutch | 17 | 0.8% |
| Dutch West Indian | 4 | 0.2% |
| English | 247 | 11.4% |
| European | 16 | 0.7% |
| French | 26 | 1.2% |
| French Canadian | 5 | 0.2% |
| German | 280 | 12.9% |
| Greek | 2 | 0.1% |
| Indian (Asian) | 2 | 0.1% |
| Irish | 143 | 6.6% |
| Italian | 56 | 2.6% |
| Mexican | 566 | 26.1% |
| Norwegian | 6 | 0.3% |
| Polish | 3 | 0.1% |
| Puerto Rican | 8 | 0.4% |
| Salvadoran | 11 | 0.5% |
| Scotch-Irish | 4 | 0.2% |
| Scottish | 18 | 0.8% |
| Spaniard | 36 | 1.7% |
| Subsaharan African | 5 | 0.2% |
| Swedish | 5 | 0.2% |
| Welsh | 3 | 0.1% | View All 29 Rows |
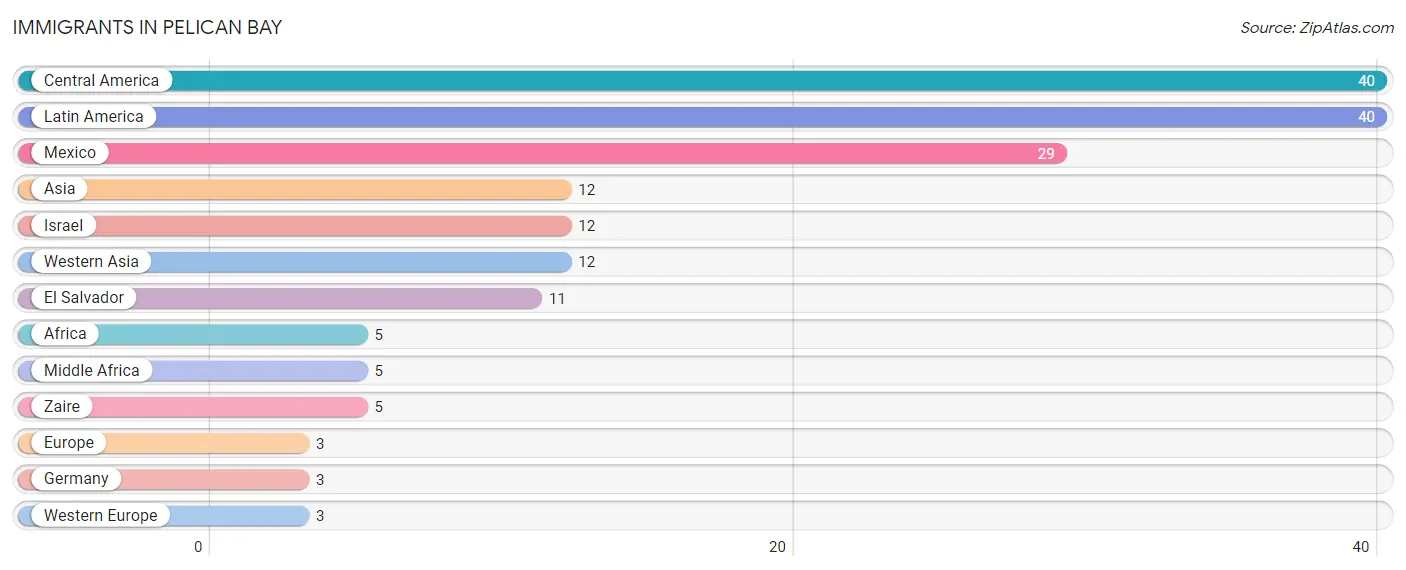
Immigrants in Pelican Bay
The most numerous immigrant groups reported in Pelican Bay came from Central America (40 | 1.8%), Latin America (40 | 1.8%), Mexico (29 | 1.3%), Asia (12 | 0.5%), and Israel (12 | 0.5%), together accounting for 6.1% of all Pelican Bay residents.
| Immigration Origin | # Population | % Population |
| Africa | 5 | 0.2% |
| Asia | 12 | 0.5% |
| Central America | 40 | 1.8% |
| El Salvador | 11 | 0.5% |
| Europe | 3 | 0.1% |
| Germany | 3 | 0.1% |
| Israel | 12 | 0.5% |
| Latin America | 40 | 1.8% |
| Mexico | 29 | 1.3% |
| Middle Africa | 5 | 0.2% |
| Western Asia | 12 | 0.5% |
| Western Europe | 3 | 0.1% |
| Zaire | 5 | 0.2% | View All 13 Rows |
Sex and Age in Pelican Bay
Sex and Age in Pelican Bay
The most populous age groups in Pelican Bay are 5 to 9 Years (145 | 12.9%) for men and 25 to 29 Years (135 | 12.8%) for women.
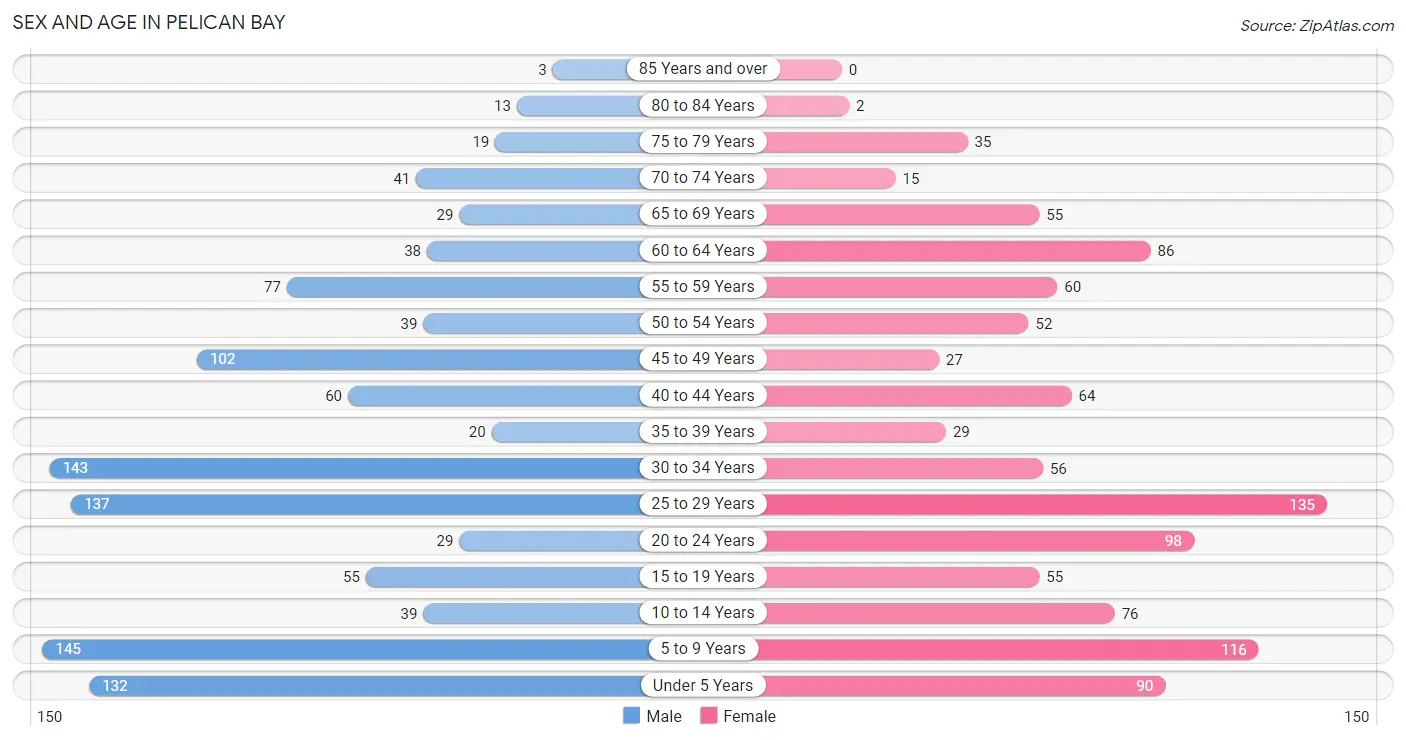
| Age Bracket | Male | Female |
| Under 5 Years | 132 (11.8%) | 90 (8.6%) |
| 5 to 9 Years | 145 (12.9%) | 116 (11.0%) |
| 10 to 14 Years | 39 (3.5%) | 76 (7.2%) |
| 15 to 19 Years | 55 (4.9%) | 55 (5.2%) |
| 20 to 24 Years | 29 (2.6%) | 98 (9.3%) |
| 25 to 29 Years | 137 (12.2%) | 135 (12.8%) |
| 30 to 34 Years | 143 (12.8%) | 56 (5.3%) |
| 35 to 39 Years | 20 (1.8%) | 29 (2.8%) |
| 40 to 44 Years | 60 (5.3%) | 64 (6.1%) |
| 45 to 49 Years | 102 (9.1%) | 27 (2.6%) |
| 50 to 54 Years | 39 (3.5%) | 52 (5.0%) |
| 55 to 59 Years | 77 (6.9%) | 60 (5.7%) |
| 60 to 64 Years | 38 (3.4%) | 86 (8.2%) |
| 65 to 69 Years | 29 (2.6%) | 55 (5.2%) |
| 70 to 74 Years | 41 (3.7%) | 15 (1.4%) |
| 75 to 79 Years | 19 (1.7%) | 35 (3.3%) |
| 80 to 84 Years | 13 (1.2%) | 2 (0.2%) |
| 85 Years and over | 3 (0.3%) | 0 (0.0%) |
| Total | 1,121 (100.0%) | 1,051 (100.0%) |
Families and Households in Pelican Bay
Median Family Size in Pelican Bay
The median family size in Pelican Bay is 3.36 persons per family, with single male/father families (136 | 25.6%) accounting for the largest median family size of 3.77 persons per family. On the other hand, married-couple families (329 | 62.0%) represent the smallest median family size with 3.14 persons per family.
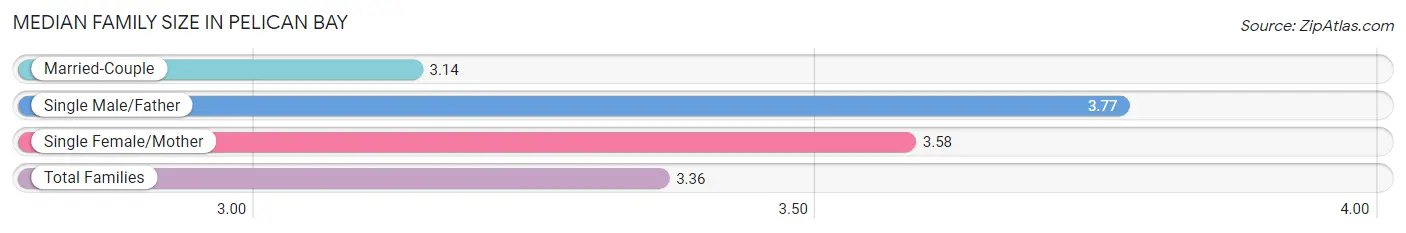
| Family Type | # Families | Family Size |
| Married-Couple | 329 (62.0%) | 3.14 |
| Single Male/Father | 136 (25.6%) | 3.77 |
| Single Female/Mother | 66 (12.4%) | 3.58 |
| Total Families | 531 (100.0%) | 3.36 |
Median Household Size in Pelican Bay
The median household size in Pelican Bay is 2.77 persons per household, with single male/father households (136 | 17.3%) accounting for the largest median household size of 4.25 persons per household. non-family households (253 | 32.3%) represent the smallest median household size with 1.14 persons per household.
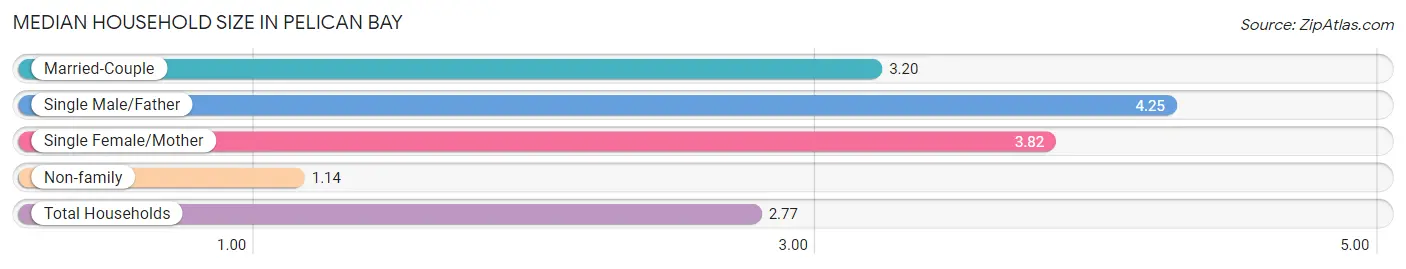
| Household Type | # Households | Household Size |
| Married-Couple | 329 (42.0%) | 3.20 |
| Single Male/Father | 136 (17.3%) | 4.25 |
| Single Female/Mother | 66 (8.4%) | 3.82 |
| Non-family | 253 (32.3%) | 1.14 |
| Total Households | 784 (100.0%) | 2.77 |
Household Size by Marriage Status in Pelican Bay
Out of a total of 784 households in Pelican Bay, 531 (67.7%) are family households, while 253 (32.3%) are nonfamily households. The most numerous type of family households are 2-person households, comprising 204, and the most common type of nonfamily households are 1-person households, comprising 222.
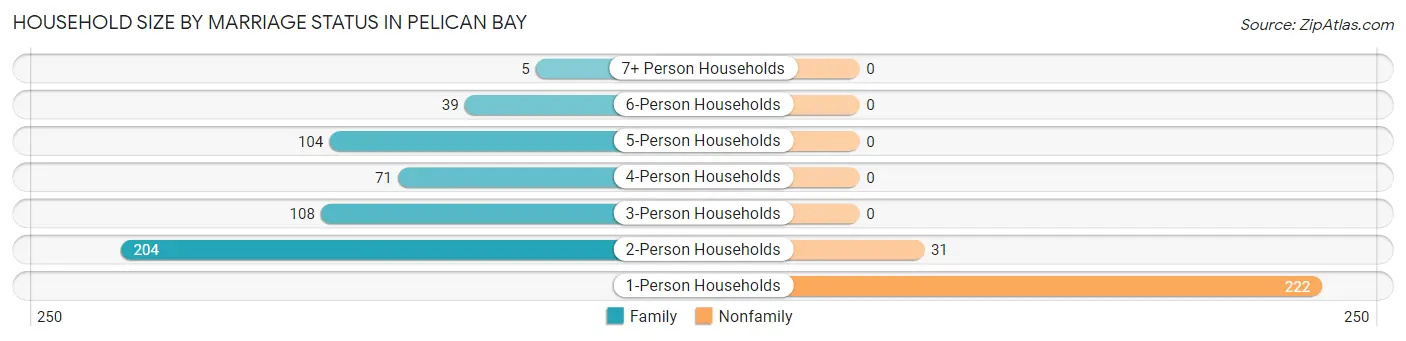
| Household Size | Family Households | Nonfamily Households |
| 1-Person Households | - | 222 (28.3%) |
| 2-Person Households | 204 (26.0%) | 31 (4.0%) |
| 3-Person Households | 108 (13.8%) | 0 (0.0%) |
| 4-Person Households | 71 (9.1%) | 0 (0.0%) |
| 5-Person Households | 104 (13.3%) | 0 (0.0%) |
| 6-Person Households | 39 (5.0%) | 0 (0.0%) |
| 7+ Person Households | 5 (0.6%) | 0 (0.0%) |
| Total | 531 (67.7%) | 253 (32.3%) |
Female Fertility in Pelican Bay
Fertility by Age in Pelican Bay
Average fertility rate in Pelican Bay is 129.0 births per 1,000 women. Women in the age bracket of 20 to 34 years have the highest fertility rate with 208.0 births per 1,000 women. Women in the age bracket of 20 to 34 years acount for 100.0% of all women with births.

| Age Bracket | Women with Births | Births / 1,000 Women |
| 15 to 19 years | 0 (0.0%) | 0.0 |
| 20 to 34 years | 60 (100.0%) | 208.0 |
| 35 to 50 years | 0 (0.0%) | 0.0 |
| Total | 60 (100.0%) | 129.0 |
Fertility by Age by Marriage Status in Pelican Bay
26.7% of women with births (60) in Pelican Bay are married. The highest percentage of unmarried women with births falls into 20 to 34 years age bracket with 73.3% of them unmarried at the time of birth, while the lowest percentage of unmarried women with births belong to 20 to 34 years age bracket with 73.3% of them unmarried.
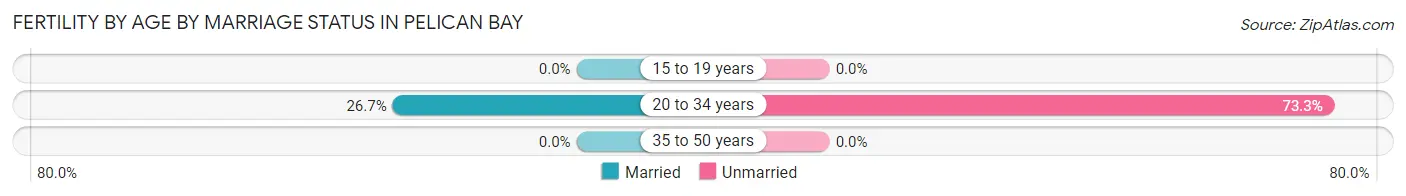
| Age Bracket | Married | Unmarried |
| 15 to 19 years | 0 (0.0%) | 0 (0.0%) |
| 20 to 34 years | 16 (26.7%) | 44 (73.3%) |
| 35 to 50 years | 0 (0.0%) | 0 (0.0%) |
| Total | 16 (26.7%) | 44 (73.3%) |
Fertility by Education in Pelican Bay
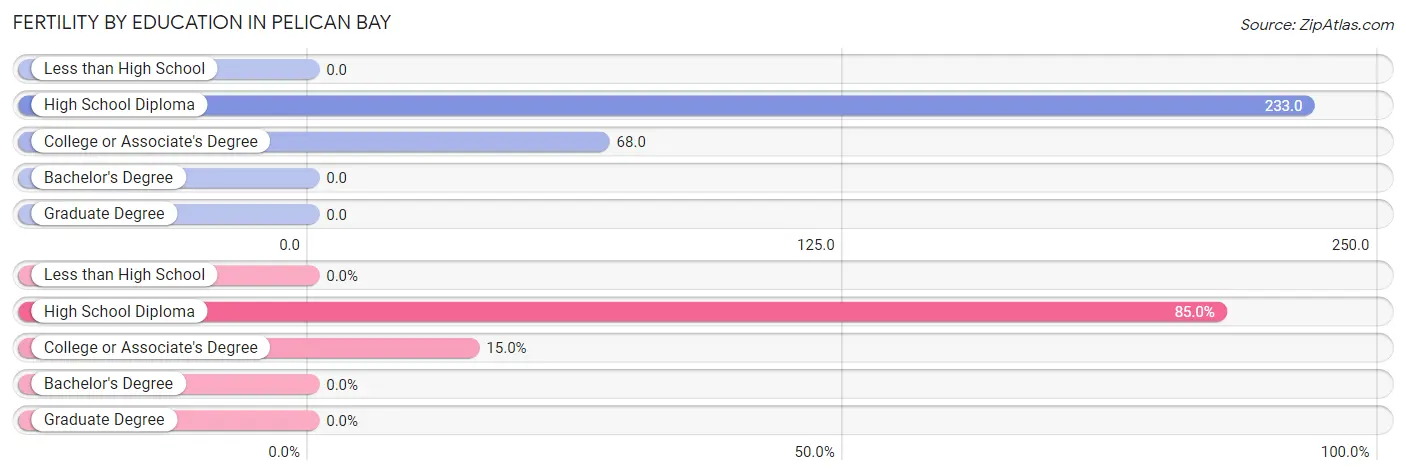
| Educational Attainment | Women with Births | Births / 1,000 Women |
| Less than High School | 0 (0.0%) | 0.0 |
| High School Diploma | 51 (85.0%) | 233.0 |
| College or Associate's Degree | 9 (15.0%) | 68.0 |
| Bachelor's Degree | 0 (0.0%) | 0.0 |
| Graduate Degree | 0 (0.0%) | 0.0 |
| Total | 60 (100.0%) | 129.0 |
Fertility by Education by Marriage Status in Pelican Bay
73.3% of women with births in Pelican Bay are unmarried. Women with the educational attainment of college or associate's degree are most likely to be married with 100.0% of them married at childbirth, while women with the educational attainment of high school diploma are least likely to be married with 86.3% of them unmarried at childbirth.
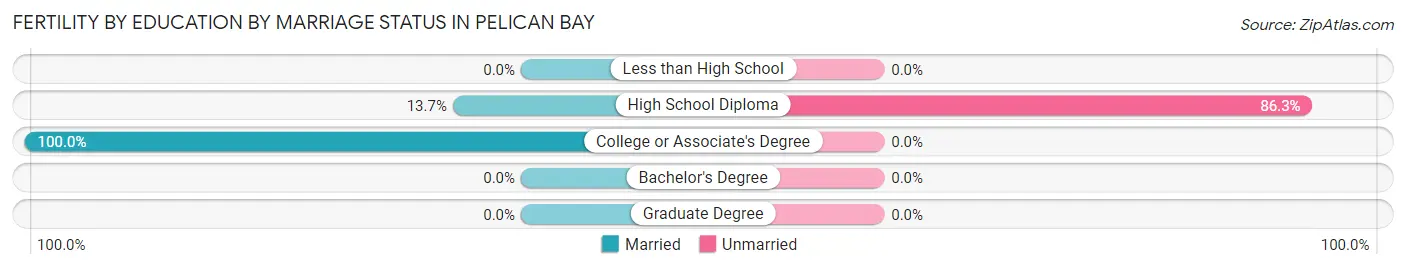
| Educational Attainment | Married | Unmarried |
| Less than High School | 0 (0.0%) | 0 (0.0%) |
| High School Diploma | 7 (13.7%) | 44 (86.3%) |
| College or Associate's Degree | 9 (100.0%) | 0 (0.0%) |
| Bachelor's Degree | 0 (0.0%) | 0 (0.0%) |
| Graduate Degree | 0 (0.0%) | 0 (0.0%) |
| Total | 16 (26.7%) | 44 (73.3%) |
Employment Characteristics in Pelican Bay
Employment by Class of Employer in Pelican Bay
Among the 796 employed individuals in Pelican Bay, private company employees (579 | 72.7%), local government employees (100 | 12.6%), and self-employed (not incorporated) (85 | 10.7%) make up the most common classes of employment.
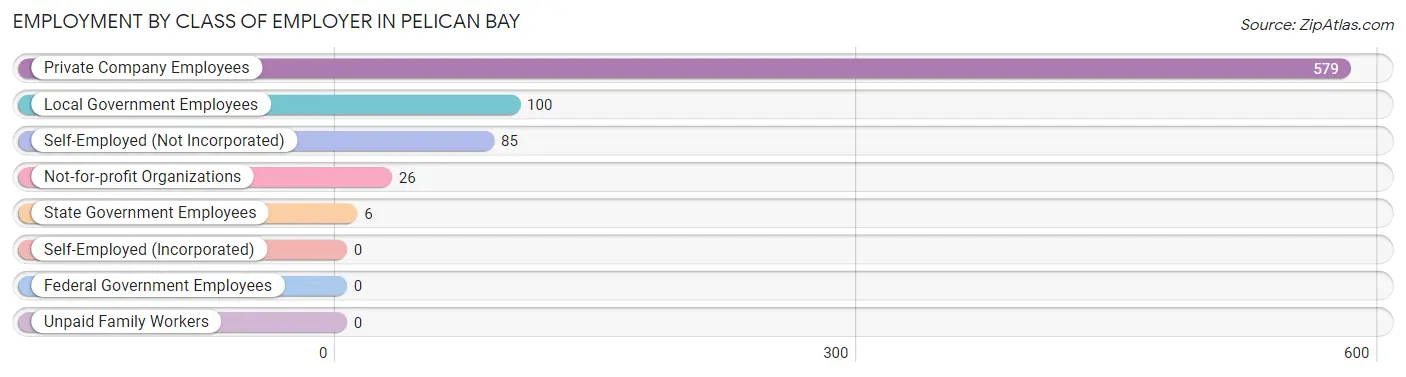
| Employer Class | # Employees | % Employees |
| Private Company Employees | 579 | 72.7% |
| Self-Employed (Incorporated) | 0 | 0.0% |
| Self-Employed (Not Incorporated) | 85 | 10.7% |
| Not-for-profit Organizations | 26 | 3.3% |
| Local Government Employees | 100 | 12.6% |
| State Government Employees | 6 | 0.7% |
| Federal Government Employees | 0 | 0.0% |
| Unpaid Family Workers | 0 | 0.0% |
| Total | 796 | 100.0% |
Employment Status by Age in Pelican Bay
According to the labor force statistics for Pelican Bay, out of the total population over 16 years of age (1,549), 61.1% or 946 individuals are in the labor force, with 10.2% or 96 of them unemployed. The age group with the highest labor force participation rate is 30 to 34 years, with 94.5% or 188 individuals in the labor force. Within the labor force, the 35 to 44 years age range has the highest percentage of unemployed individuals, with 23.9% or 28 of them being unemployed.
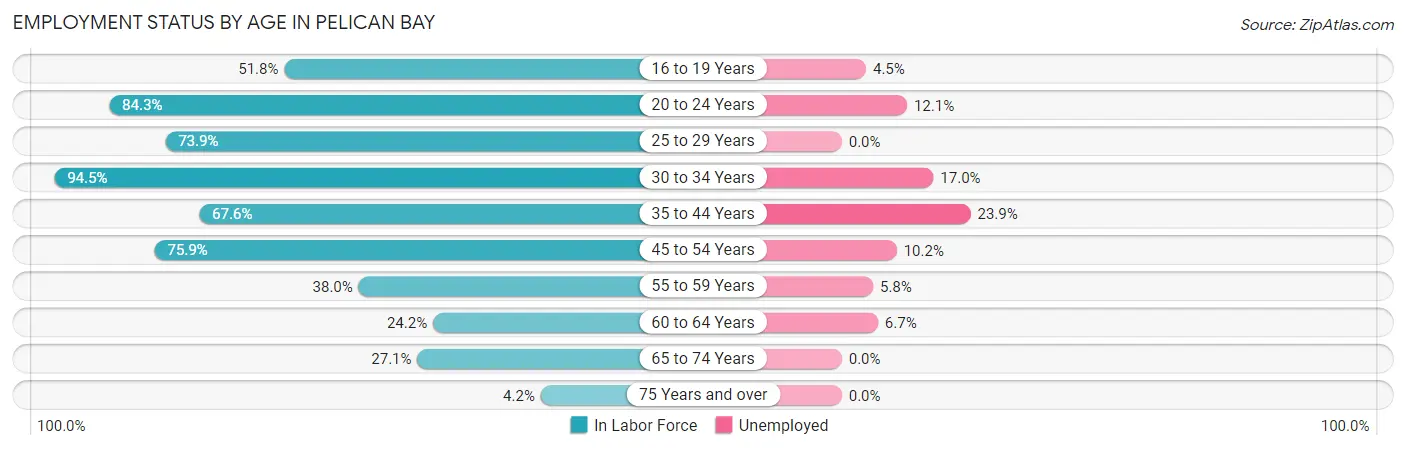
| Age Bracket | In Labor Force | Unemployed |
| 16 to 19 Years | 44 (51.8%) | 2 (4.5%) |
| 20 to 24 Years | 107 (84.3%) | 13 (12.1%) |
| 25 to 29 Years | 201 (73.9%) | 0 (0.0%) |
| 30 to 34 Years | 188 (94.5%) | 32 (17.0%) |
| 35 to 44 Years | 117 (67.6%) | 28 (23.9%) |
| 45 to 54 Years | 167 (75.9%) | 17 (10.2%) |
| 55 to 59 Years | 52 (38.0%) | 3 (5.8%) |
| 60 to 64 Years | 30 (24.2%) | 2 (6.7%) |
| 65 to 74 Years | 38 (27.1%) | 0 (0.0%) |
| 75 Years and over | 3 (4.2%) | 0 (0.0%) |
| Total | 946 (61.1%) | 96 (10.2%) |
Employment Status by Educational Attainment in Pelican Bay
According to labor force statistics for Pelican Bay, 67.1% of individuals (755) out of the total population between 25 and 64 years of age (1,125) are in the labor force, with 10.9% or 82 of them being unemployed. The group with the highest labor force participation rate are those with the educational attainment of college / associate degree, with 81.9% or 289 individuals in the labor force. Within the labor force, individuals with high school diploma education have the highest percentage of unemployment, with 24.1% or 57 of them being unemployed.
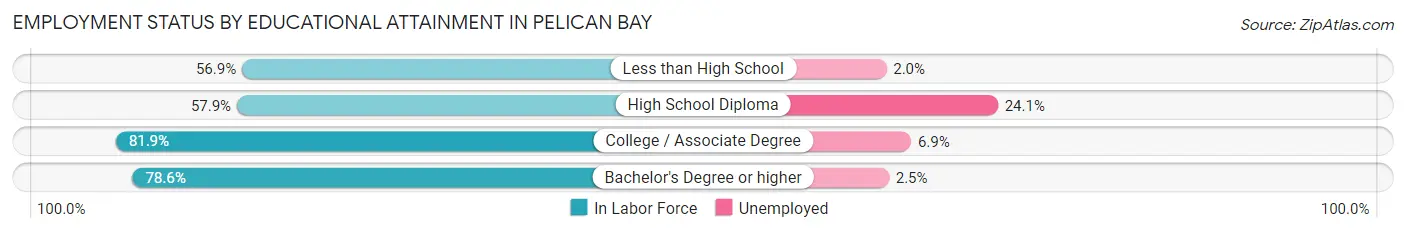
| Educational Attainment | In Labor Force | Unemployed |
| Less than High School | 148 (56.9%) | 5 (2.0%) |
| High School Diploma | 237 (57.9%) | 99 (24.1%) |
| College / Associate Degree | 289 (81.9%) | 24 (6.9%) |
| Bachelor's Degree or higher | 81 (78.6%) | 3 (2.5%) |
| Total | 755 (67.1%) | 123 (10.9%) |
Employment Occupations by Sex in Pelican Bay
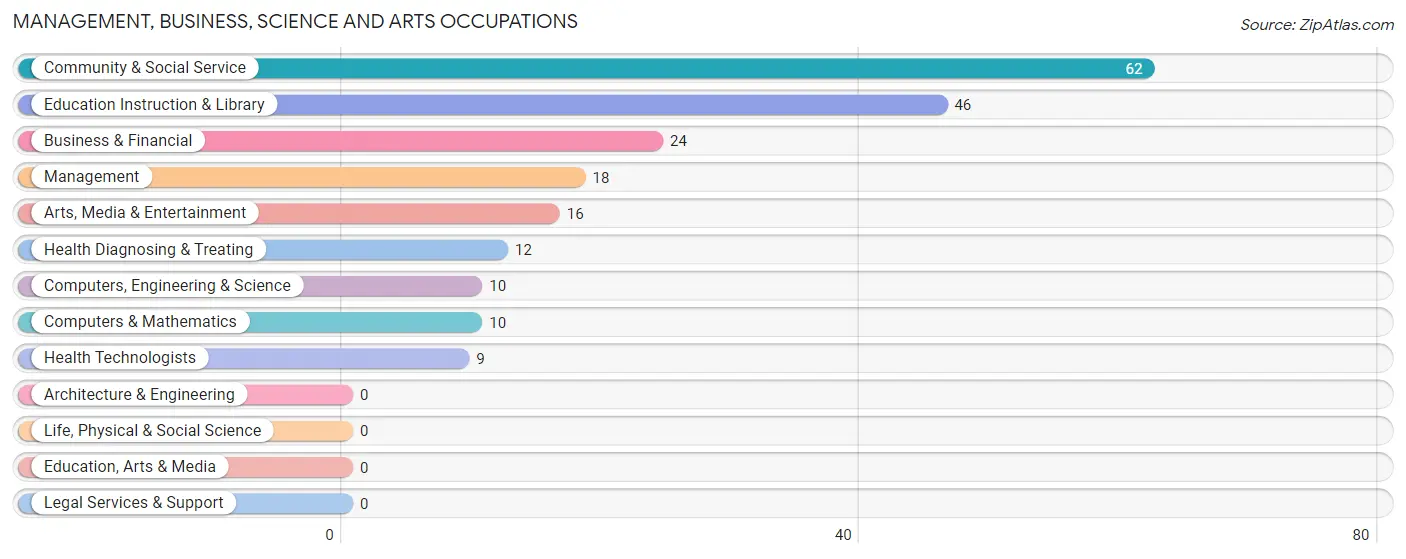
Management, Business, Science and Arts Occupations
The most common Management, Business, Science and Arts occupations in Pelican Bay are Community & Social Service (62 | 7.3%), Education Instruction & Library (46 | 5.4%), Business & Financial (24 | 2.8%), Management (18 | 2.1%), and Arts, Media & Entertainment (16 | 1.9%).
Management, Business, Science and Arts Occupations by Sex
Within the Management, Business, Science and Arts occupations in Pelican Bay, the most male-oriented occupations are Management (77.8%), Computers, Engineering & Science (70.0%), and Computers & Mathematics (70.0%), while the most female-oriented occupations are Community & Social Service (100.0%), Education Instruction & Library (100.0%), and Arts, Media & Entertainment (100.0%).
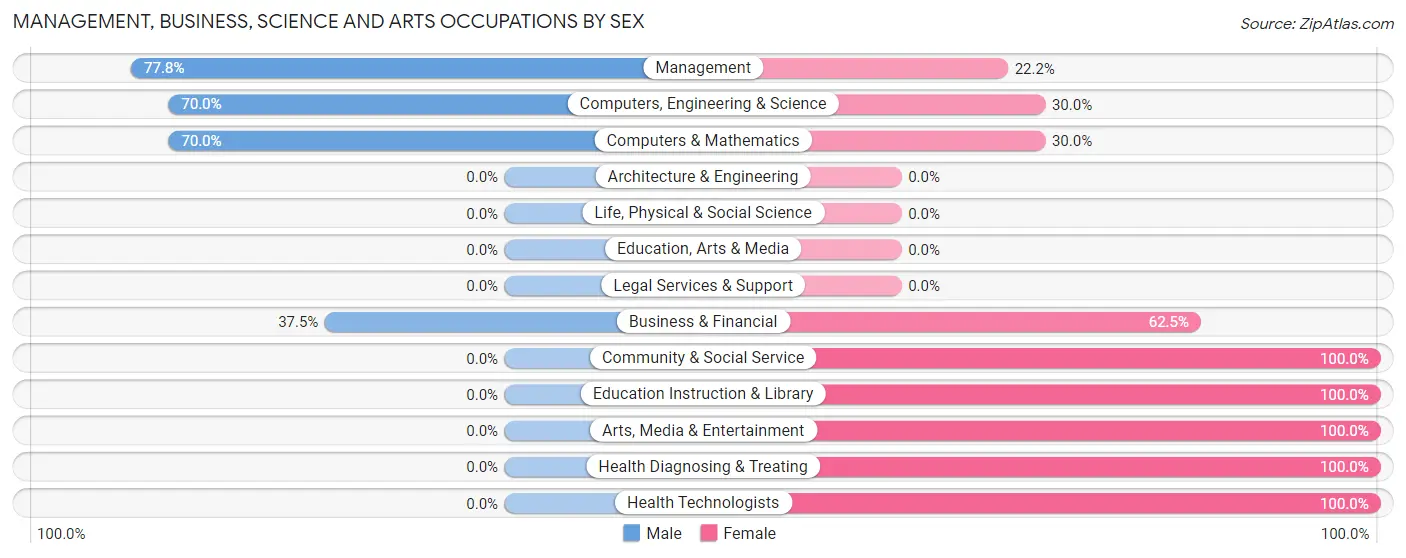
| Occupation | Male | Female |
| Management | 14 (77.8%) | 4 (22.2%) |
| Business & Financial | 9 (37.5%) | 15 (62.5%) |
| Computers, Engineering & Science | 7 (70.0%) | 3 (30.0%) |
| Computers & Mathematics | 7 (70.0%) | 3 (30.0%) |
| Architecture & Engineering | 0 (0.0%) | 0 (0.0%) |
| Life, Physical & Social Science | 0 (0.0%) | 0 (0.0%) |
| Community & Social Service | 0 (0.0%) | 62 (100.0%) |
| Education, Arts & Media | 0 (0.0%) | 0 (0.0%) |
| Legal Services & Support | 0 (0.0%) | 0 (0.0%) |
| Education Instruction & Library | 0 (0.0%) | 46 (100.0%) |
| Arts, Media & Entertainment | 0 (0.0%) | 16 (100.0%) |
| Health Diagnosing & Treating | 0 (0.0%) | 12 (100.0%) |
| Health Technologists | 0 (0.0%) | 9 (100.0%) |
| Total (Category) | 30 (23.8%) | 96 (76.2%) |
| Total (Overall) | 511 (60.1%) | 339 (39.9%) |
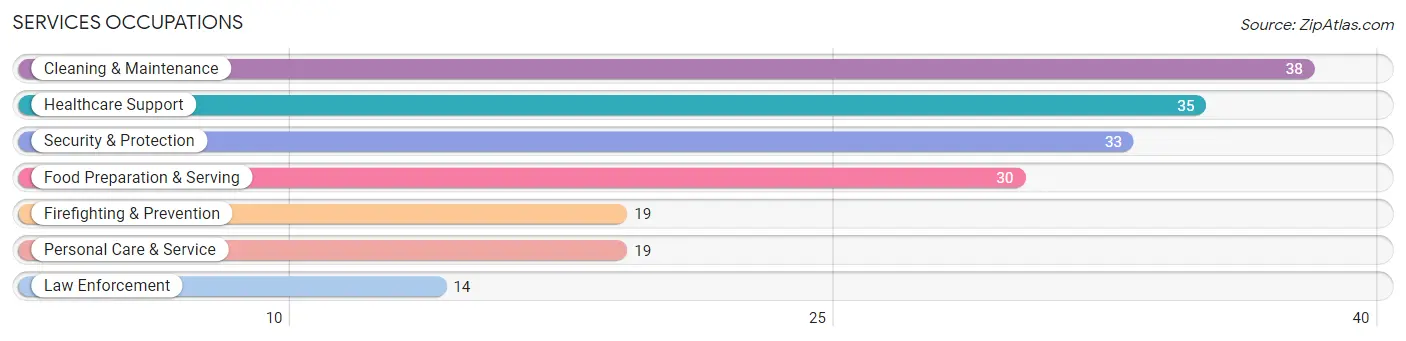
Services Occupations
The most common Services occupations in Pelican Bay are Cleaning & Maintenance (38 | 4.5%), Healthcare Support (35 | 4.1%), Security & Protection (33 | 3.9%), Food Preparation & Serving (30 | 3.5%), and Firefighting & Prevention (19 | 2.2%).
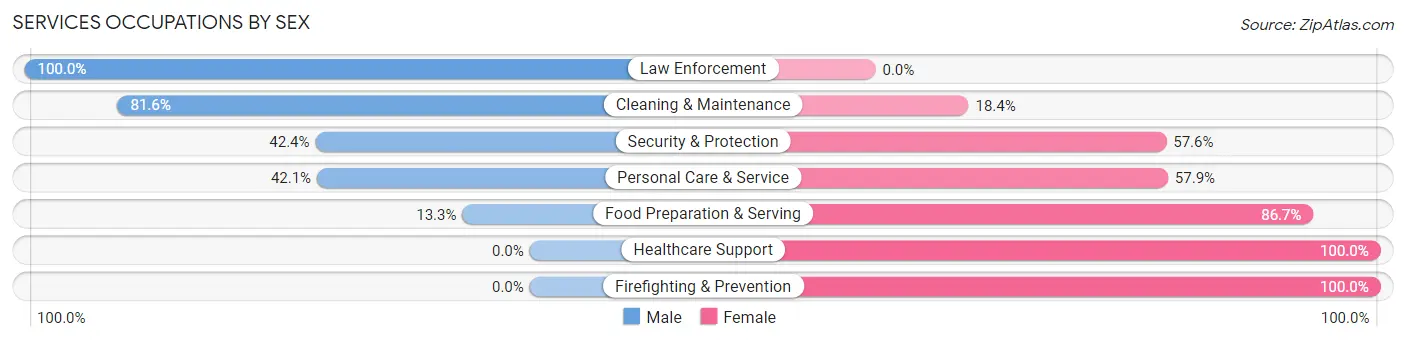
Services Occupations by Sex
Within the Services occupations in Pelican Bay, the most male-oriented occupations are Law Enforcement (100.0%), Cleaning & Maintenance (81.6%), and Security & Protection (42.4%), while the most female-oriented occupations are Healthcare Support (100.0%), Firefighting & Prevention (100.0%), and Food Preparation & Serving (86.7%).
| Occupation | Male | Female |
| Healthcare Support | 0 (0.0%) | 35 (100.0%) |
| Security & Protection | 14 (42.4%) | 19 (57.6%) |
| Firefighting & Prevention | 0 (0.0%) | 19 (100.0%) |
| Law Enforcement | 14 (100.0%) | 0 (0.0%) |
| Food Preparation & Serving | 4 (13.3%) | 26 (86.7%) |
| Cleaning & Maintenance | 31 (81.6%) | 7 (18.4%) |
| Personal Care & Service | 8 (42.1%) | 11 (57.9%) |
| Total (Category) | 57 (36.8%) | 98 (63.2%) |
| Total (Overall) | 511 (60.1%) | 339 (39.9%) |
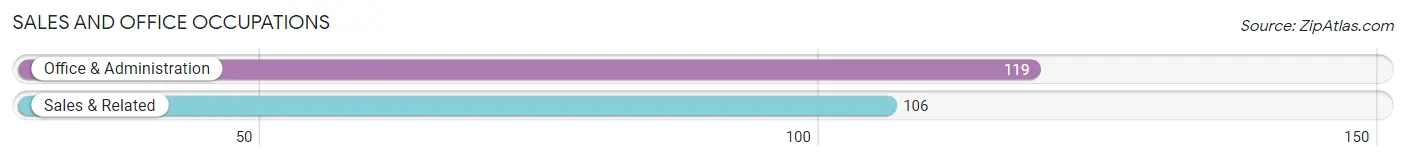
Sales and Office Occupations
The most common Sales and Office occupations in Pelican Bay are Office & Administration (119 | 14.0%), and Sales & Related (106 | 12.5%).
Sales and Office Occupations by Sex
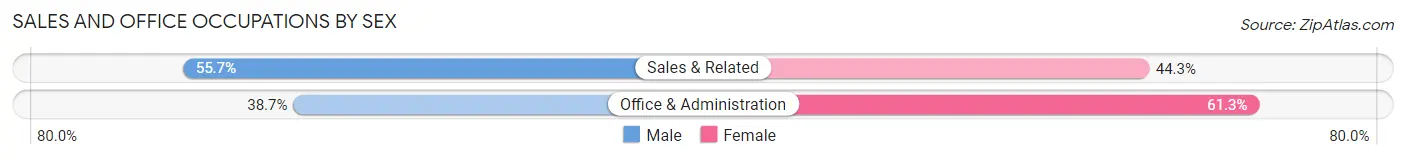
| Occupation | Male | Female |
| Sales & Related | 59 (55.7%) | 47 (44.3%) |
| Office & Administration | 46 (38.7%) | 73 (61.3%) |
| Total (Category) | 105 (46.7%) | 120 (53.3%) |
| Total (Overall) | 511 (60.1%) | 339 (39.9%) |
Natural Resources, Construction and Maintenance Occupations
The most common Natural Resources, Construction and Maintenance occupations in Pelican Bay are Installation, Maintenance & Repair (105 | 12.3%), and Construction & Extraction (74 | 8.7%).
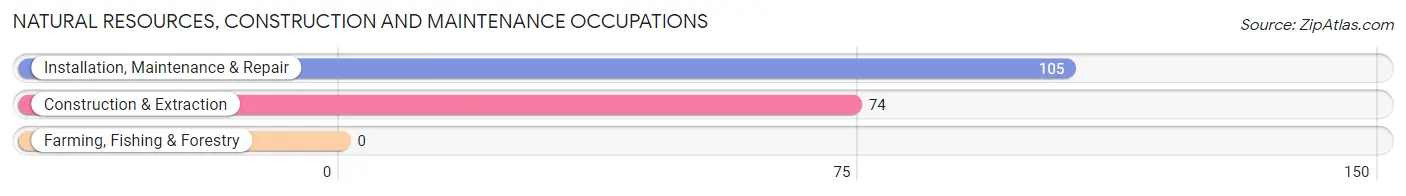
Natural Resources, Construction and Maintenance Occupations by Sex
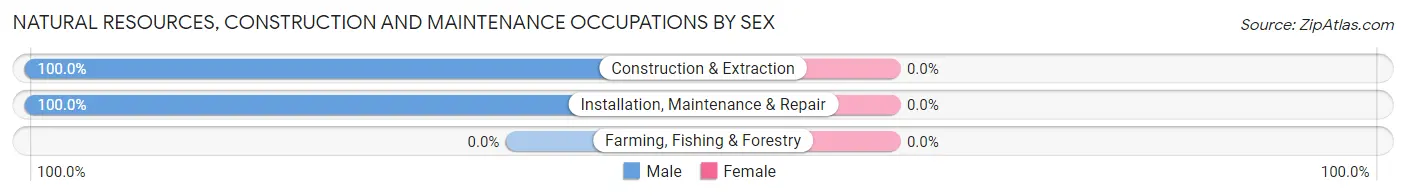
| Occupation | Male | Female |
| Farming, Fishing & Forestry | 0 (0.0%) | 0 (0.0%) |
| Construction & Extraction | 74 (100.0%) | 0 (0.0%) |
| Installation, Maintenance & Repair | 105 (100.0%) | 0 (0.0%) |
| Total (Category) | 179 (100.0%) | 0 (0.0%) |
| Total (Overall) | 511 (60.1%) | 339 (39.9%) |
Production, Transportation and Moving Occupations
The most common Production, Transportation and Moving occupations in Pelican Bay are Production (75 | 8.8%), Material Moving (58 | 6.8%), and Transportation (32 | 3.8%).
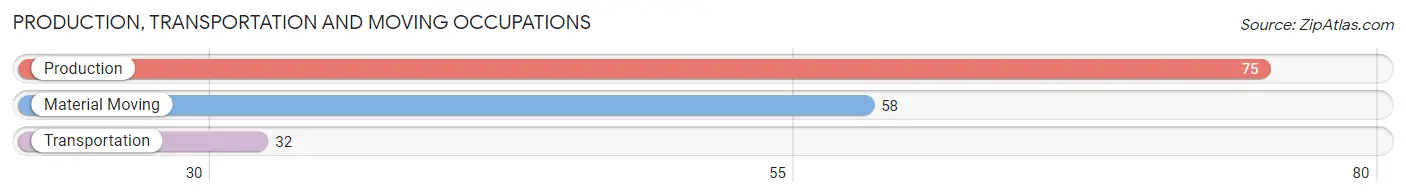
Production, Transportation and Moving Occupations by Sex
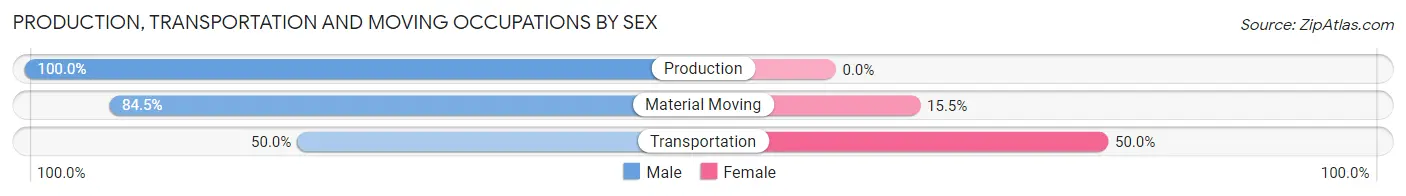
| Occupation | Male | Female |
| Production | 75 (100.0%) | 0 (0.0%) |
| Transportation | 16 (50.0%) | 16 (50.0%) |
| Material Moving | 49 (84.5%) | 9 (15.5%) |
| Total (Category) | 140 (84.9%) | 25 (15.1%) |
| Total (Overall) | 511 (60.1%) | 339 (39.9%) |
Employment Industries by Sex in Pelican Bay
Employment Industries in Pelican Bay
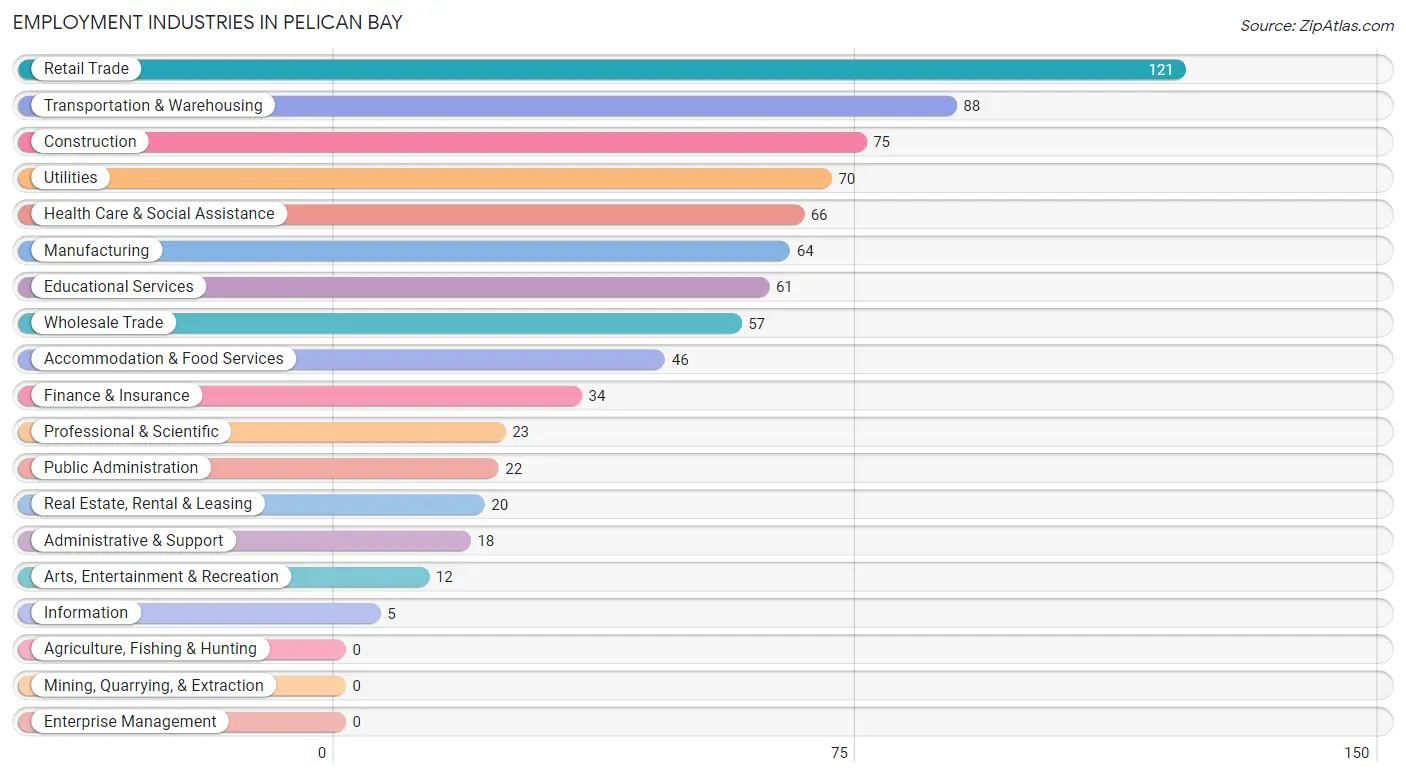
The major employment industries in Pelican Bay include Retail Trade (121 | 14.2%), Transportation & Warehousing (88 | 10.3%), Construction (75 | 8.8%), Utilities (70 | 8.2%), and Health Care & Social Assistance (66 | 7.8%).
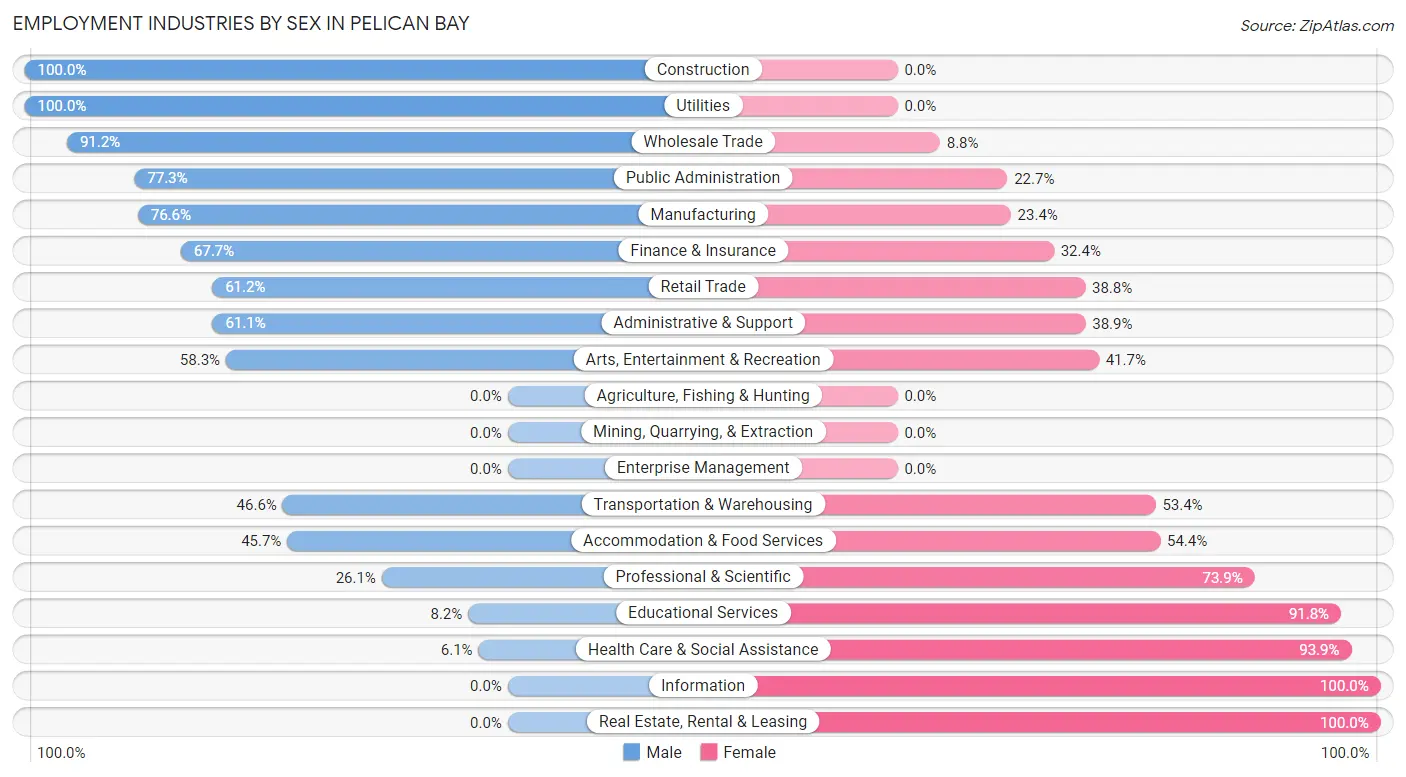
Employment Industries by Sex in Pelican Bay
The Pelican Bay industries that see more men than women are Construction (100.0%), Utilities (100.0%), and Wholesale Trade (91.2%), whereas the industries that tend to have a higher number of women are Information (100.0%), Real Estate, Rental & Leasing (100.0%), and Health Care & Social Assistance (93.9%).
| Industry | Male | Female |
| Agriculture, Fishing & Hunting | 0 (0.0%) | 0 (0.0%) |
| Mining, Quarrying, & Extraction | 0 (0.0%) | 0 (0.0%) |
| Construction | 75 (100.0%) | 0 (0.0%) |
| Manufacturing | 49 (76.6%) | 15 (23.4%) |
| Wholesale Trade | 52 (91.2%) | 5 (8.8%) |
| Retail Trade | 74 (61.2%) | 47 (38.8%) |
| Transportation & Warehousing | 41 (46.6%) | 47 (53.4%) |
| Utilities | 70 (100.0%) | 0 (0.0%) |
| Information | 0 (0.0%) | 5 (100.0%) |
| Finance & Insurance | 23 (67.6%) | 11 (32.4%) |
| Real Estate, Rental & Leasing | 0 (0.0%) | 20 (100.0%) |
| Professional & Scientific | 6 (26.1%) | 17 (73.9%) |
| Enterprise Management | 0 (0.0%) | 0 (0.0%) |
| Administrative & Support | 11 (61.1%) | 7 (38.9%) |
| Educational Services | 5 (8.2%) | 56 (91.8%) |
| Health Care & Social Assistance | 4 (6.1%) | 62 (93.9%) |
| Arts, Entertainment & Recreation | 7 (58.3%) | 5 (41.7%) |
| Accommodation & Food Services | 21 (45.7%) | 25 (54.3%) |
| Public Administration | 17 (77.3%) | 5 (22.7%) |
| Total | 511 (60.1%) | 339 (39.9%) |
Education in Pelican Bay
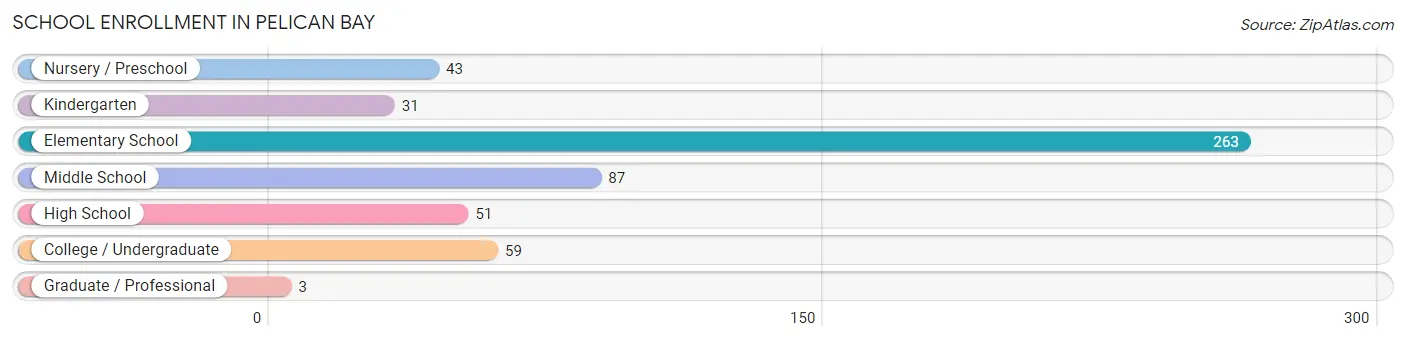
School Enrollment in Pelican Bay
The most common levels of schooling among the 537 students in Pelican Bay are elementary school (263 | 49.0%), middle school (87 | 16.2%), and college / undergraduate (59 | 11.0%).
| School Level | # Students | % Students |
| Nursery / Preschool | 43 | 8.0% |
| Kindergarten | 31 | 5.8% |
| Elementary School | 263 | 49.0% |
| Middle School | 87 | 16.2% |
| High School | 51 | 9.5% |
| College / Undergraduate | 59 | 11.0% |
| Graduate / Professional | 3 | 0.6% |
| Total | 537 | 100.0% |
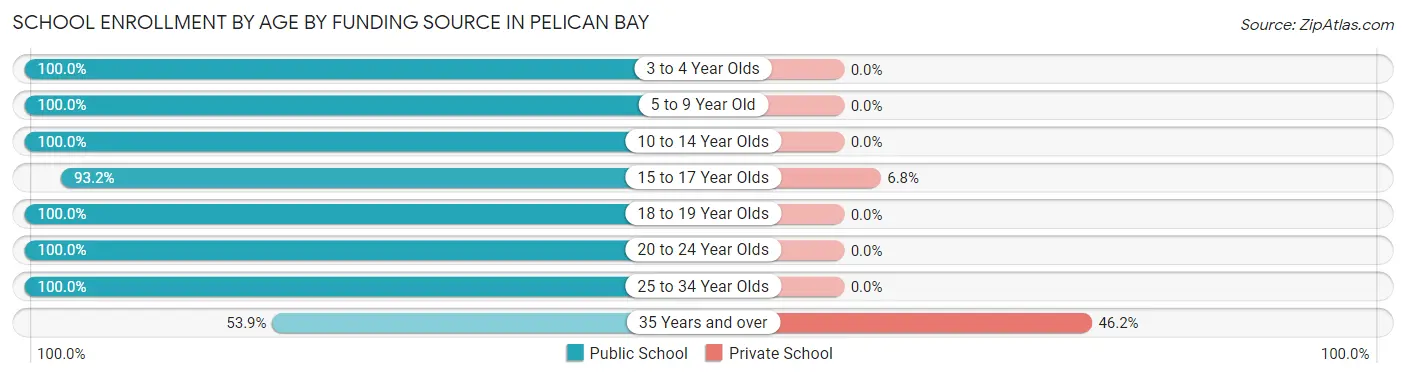
School Enrollment by Age by Funding Source in Pelican Bay
Out of a total of 537 students who are enrolled in schools in Pelican Bay, 9 (1.7%) attend a private institution, while the remaining 528 (98.3%) are enrolled in public schools. The age group of 35 years and over has the highest likelihood of being enrolled in private schools, with 6 (46.2% in the age bracket) enrolled. Conversely, the age group of 3 to 4 year olds has the lowest likelihood of being enrolled in a private school, with 43 (100.0% in the age bracket) attending a public institution.
| Age Bracket | Public School | Private School |
| 3 to 4 Year Olds | 43 (100.0%) | 0 (0.0%) |
| 5 to 9 Year Old | 261 (100.0%) | 0 (0.0%) |
| 10 to 14 Year Olds | 107 (100.0%) | 0 (0.0%) |
| 15 to 17 Year Olds | 41 (93.2%) | 3 (6.8%) |
| 18 to 19 Year Olds | 20 (100.0%) | 0 (0.0%) |
| 20 to 24 Year Olds | 23 (100.0%) | 0 (0.0%) |
| 25 to 34 Year Olds | 26 (100.0%) | 0 (0.0%) |
| 35 Years and over | 7 (53.8%) | 6 (46.2%) |
| Total | 528 (98.3%) | 9 (1.7%) |
Educational Attainment by Field of Study in Pelican Bay
Business (43 | 32.8%), bio, nature & agricultural (27 | 20.6%), physical & health sciences (19 | 14.5%), psychology (12 | 9.2%), and arts & humanities (12 | 9.2%) are the most common fields of study among 131 individuals in Pelican Bay who have obtained a bachelor's degree or higher.
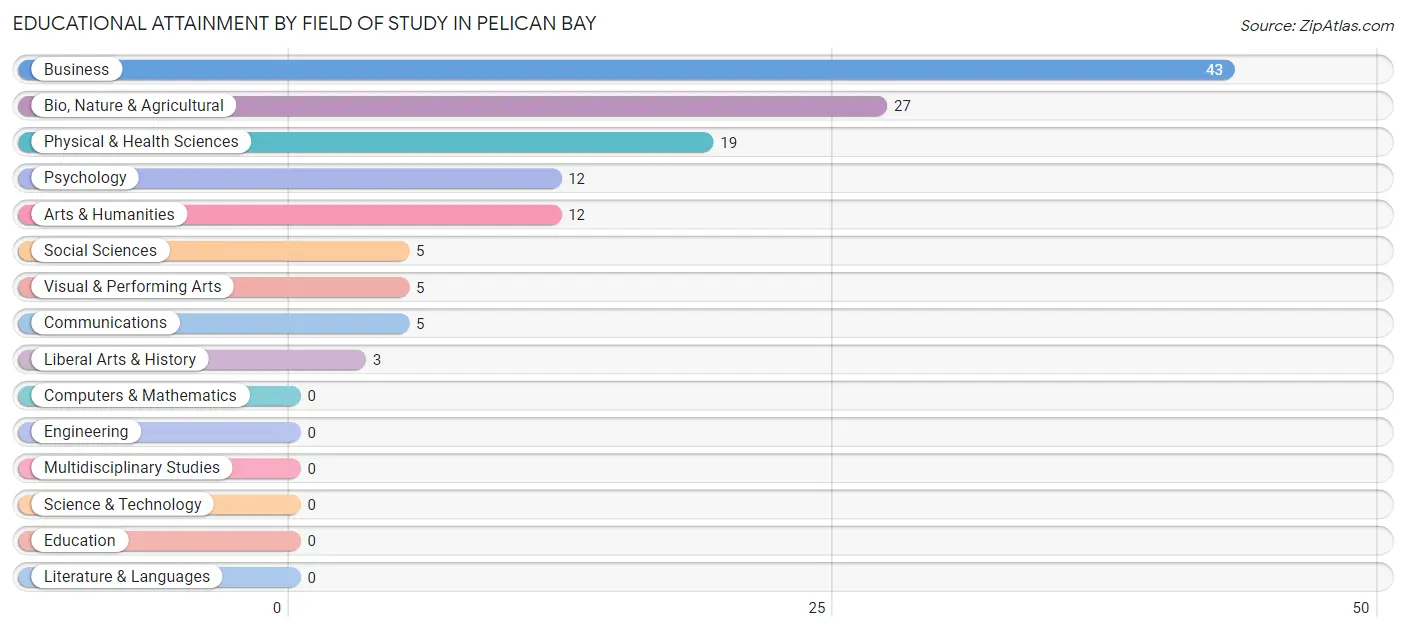
| Field of Study | # Graduates | % Graduates |
| Computers & Mathematics | 0 | 0.0% |
| Bio, Nature & Agricultural | 27 | 20.6% |
| Physical & Health Sciences | 19 | 14.5% |
| Psychology | 12 | 9.2% |
| Social Sciences | 5 | 3.8% |
| Engineering | 0 | 0.0% |
| Multidisciplinary Studies | 0 | 0.0% |
| Science & Technology | 0 | 0.0% |
| Business | 43 | 32.8% |
| Education | 0 | 0.0% |
| Literature & Languages | 0 | 0.0% |
| Liberal Arts & History | 3 | 2.3% |
| Visual & Performing Arts | 5 | 3.8% |
| Communications | 5 | 3.8% |
| Arts & Humanities | 12 | 9.2% |
| Total | 131 | 100.0% |
Transportation & Commute in Pelican Bay
Vehicle Availability by Sex in Pelican Bay
The most prevalent vehicle ownership categories in Pelican Bay are males with 2 vehicles (258, accounting for 56.5%) and females with 2 vehicles (163, making up 76.1%).
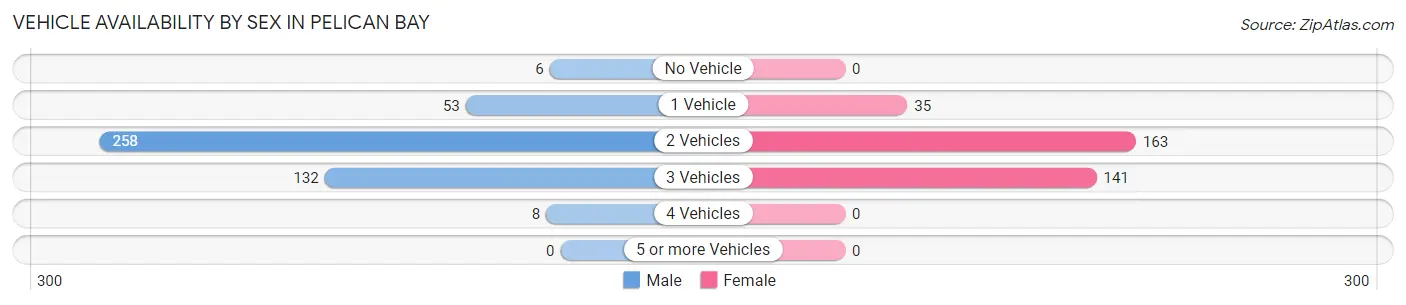
| Vehicles Available | Male | Female |
| No Vehicle | 6 (1.3%) | 0 (0.0%) |
| 1 Vehicle | 53 (11.6%) | 35 (10.3%) |
| 2 Vehicles | 258 (56.5%) | 163 (48.1%) |
| 3 Vehicles | 132 (28.9%) | 141 (41.6%) |
| 4 Vehicles | 8 (1.8%) | 0 (0.0%) |
| 5 or more Vehicles | 0 (0.0%) | 0 (0.0%) |
| Total | 457 (100.0%) | 339 (100.0%) |
Commute Time in Pelican Bay
The most frequently occuring commute durations in Pelican Bay are 45 to 59 minutes (160 commuters, 20.7%), 30 to 34 minutes (108 commuters, 14.0%), and 10 to 14 minutes (102 commuters, 13.2%).
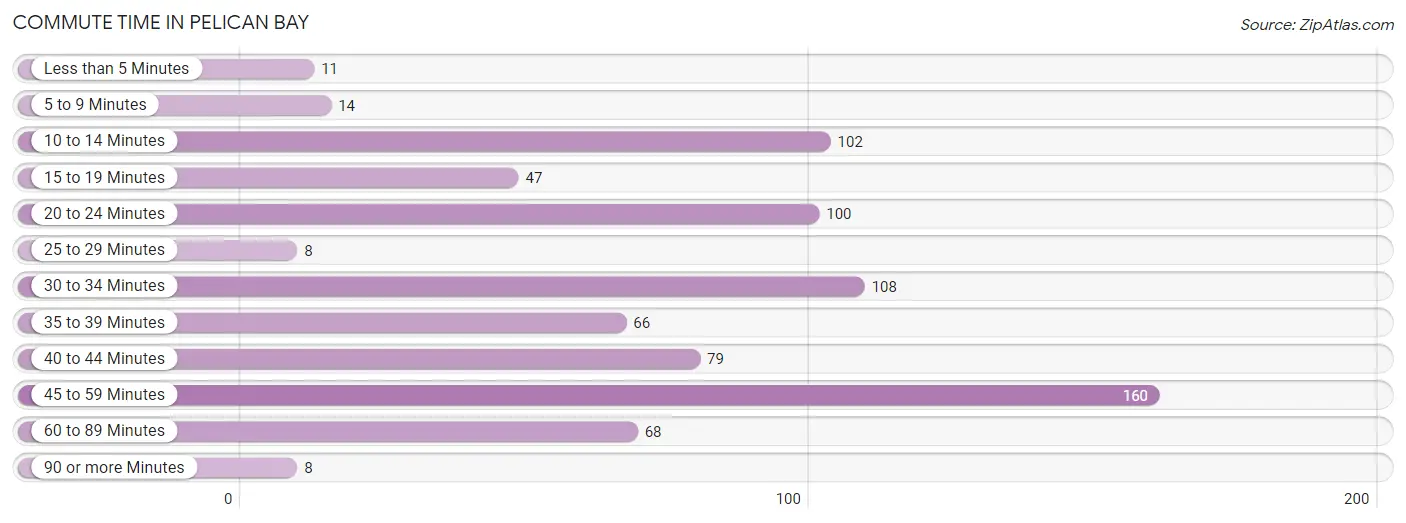
| Commute Time | # Commuters | % Commuters |
| Less than 5 Minutes | 11 | 1.4% |
| 5 to 9 Minutes | 14 | 1.8% |
| 10 to 14 Minutes | 102 | 13.2% |
| 15 to 19 Minutes | 47 | 6.1% |
| 20 to 24 Minutes | 100 | 13.0% |
| 25 to 29 Minutes | 8 | 1.0% |
| 30 to 34 Minutes | 108 | 14.0% |
| 35 to 39 Minutes | 66 | 8.6% |
| 40 to 44 Minutes | 79 | 10.2% |
| 45 to 59 Minutes | 160 | 20.7% |
| 60 to 89 Minutes | 68 | 8.8% |
| 90 or more Minutes | 8 | 1.0% |
Commute Time by Sex in Pelican Bay
The most common commute times in Pelican Bay are 45 to 59 minutes (122 commuters, 27.6%) for males and 30 to 34 minutes (74 commuters, 22.5%) for females.
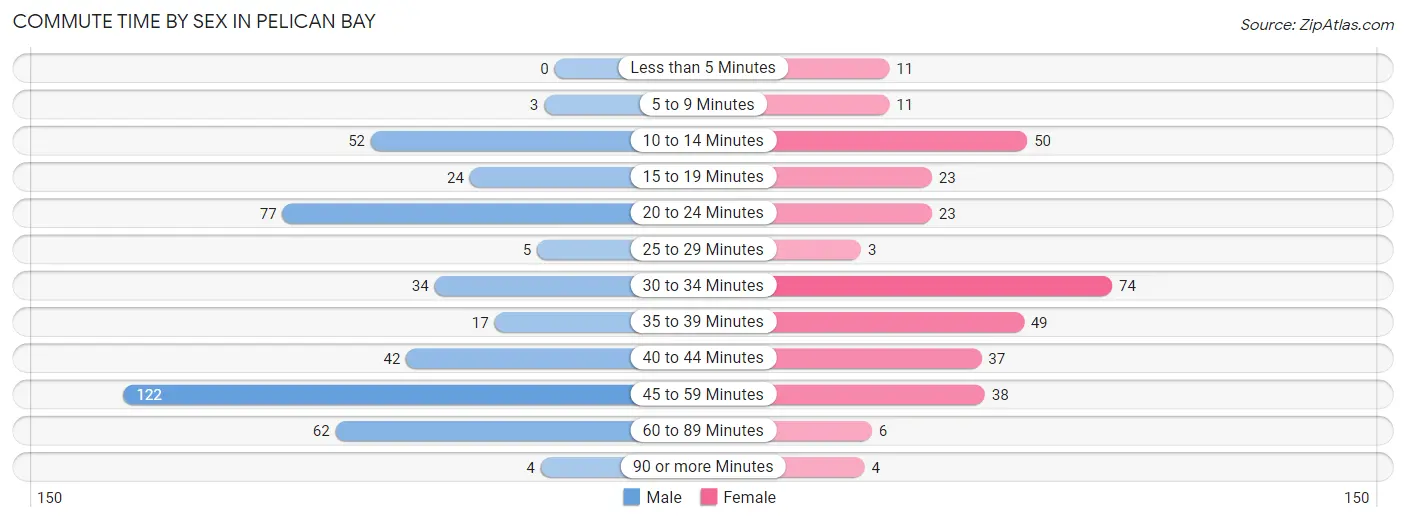
| Commute Time | Male | Female |
| Less than 5 Minutes | 0 (0.0%) | 11 (3.3%) |
| 5 to 9 Minutes | 3 (0.7%) | 11 (3.3%) |
| 10 to 14 Minutes | 52 (11.8%) | 50 (15.2%) |
| 15 to 19 Minutes | 24 (5.4%) | 23 (7.0%) |
| 20 to 24 Minutes | 77 (17.4%) | 23 (7.0%) |
| 25 to 29 Minutes | 5 (1.1%) | 3 (0.9%) |
| 30 to 34 Minutes | 34 (7.7%) | 74 (22.5%) |
| 35 to 39 Minutes | 17 (3.8%) | 49 (14.9%) |
| 40 to 44 Minutes | 42 (9.5%) | 37 (11.3%) |
| 45 to 59 Minutes | 122 (27.6%) | 38 (11.6%) |
| 60 to 89 Minutes | 62 (14.0%) | 6 (1.8%) |
| 90 or more Minutes | 4 (0.9%) | 4 (1.2%) |
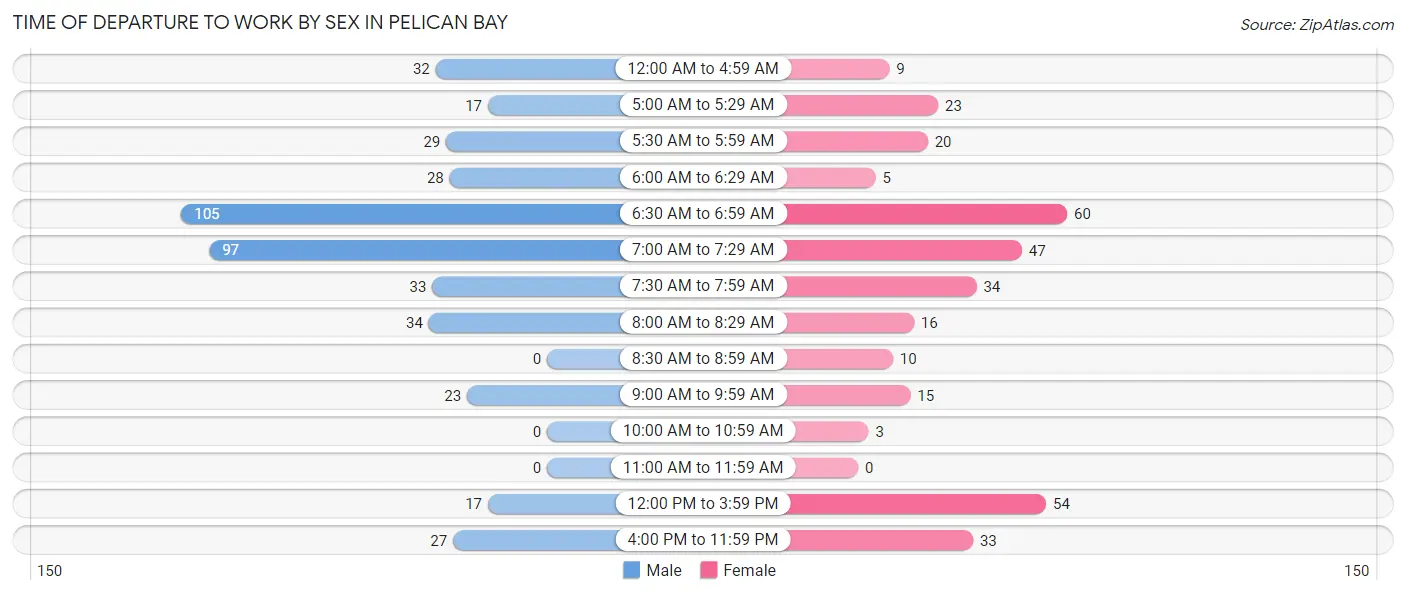
Time of Departure to Work by Sex in Pelican Bay
The most frequent times of departure to work in Pelican Bay are 6:30 AM to 6:59 AM (105, 23.8%) for males and 6:30 AM to 6:59 AM (60, 18.2%) for females.
| Time of Departure | Male | Female |
| 12:00 AM to 4:59 AM | 32 (7.2%) | 9 (2.7%) |
| 5:00 AM to 5:29 AM | 17 (3.8%) | 23 (7.0%) |
| 5:30 AM to 5:59 AM | 29 (6.6%) | 20 (6.1%) |
| 6:00 AM to 6:29 AM | 28 (6.3%) | 5 (1.5%) |
| 6:30 AM to 6:59 AM | 105 (23.8%) | 60 (18.2%) |
| 7:00 AM to 7:29 AM | 97 (22.0%) | 47 (14.3%) |
| 7:30 AM to 7:59 AM | 33 (7.5%) | 34 (10.3%) |
| 8:00 AM to 8:29 AM | 34 (7.7%) | 16 (4.9%) |
| 8:30 AM to 8:59 AM | 0 (0.0%) | 10 (3.0%) |
| 9:00 AM to 9:59 AM | 23 (5.2%) | 15 (4.6%) |
| 10:00 AM to 10:59 AM | 0 (0.0%) | 3 (0.9%) |
| 11:00 AM to 11:59 AM | 0 (0.0%) | 0 (0.0%) |
| 12:00 PM to 3:59 PM | 17 (3.8%) | 54 (16.4%) |
| 4:00 PM to 11:59 PM | 27 (6.1%) | 33 (10.0%) |
| Total | 442 (100.0%) | 329 (100.0%) |
Housing Occupancy in Pelican Bay
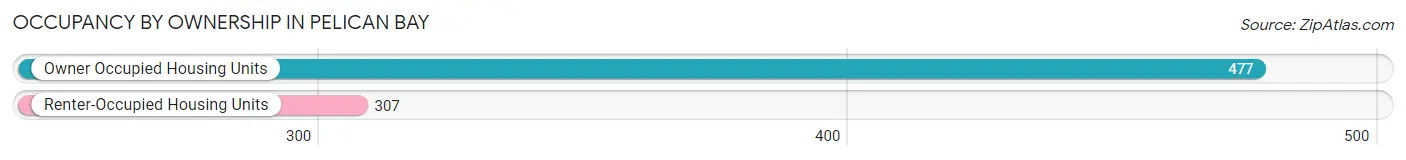
Occupancy by Ownership in Pelican Bay
Of the total 784 dwellings in Pelican Bay, owner-occupied units account for 477 (60.8%), while renter-occupied units make up 307 (39.2%).
| Occupancy | # Housing Units | % Housing Units |
| Owner Occupied Housing Units | 477 | 60.8% |
| Renter-Occupied Housing Units | 307 | 39.2% |
| Total Occupied Housing Units | 784 | 100.0% |
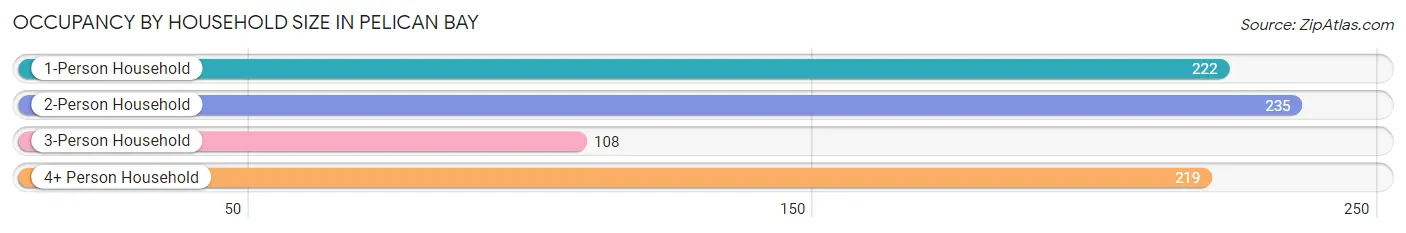
Occupancy by Household Size in Pelican Bay
| Household Size | # Housing Units | % Housing Units |
| 1-Person Household | 222 | 28.3% |
| 2-Person Household | 235 | 30.0% |
| 3-Person Household | 108 | 13.8% |
| 4+ Person Household | 219 | 27.9% |
| Total Housing Units | 784 | 100.0% |
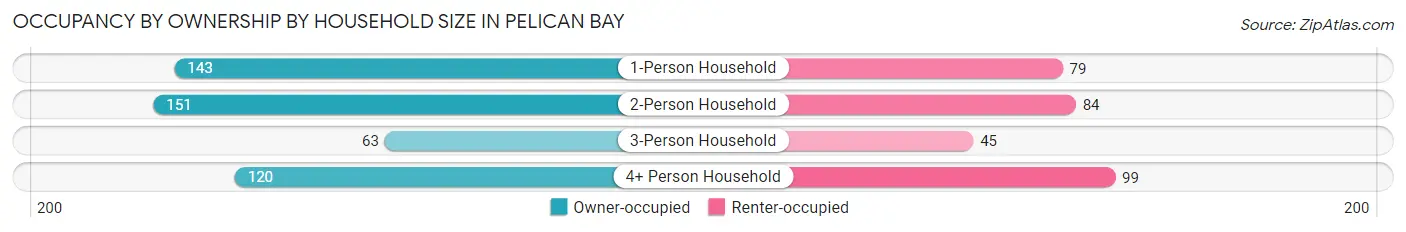
Occupancy by Ownership by Household Size in Pelican Bay
| Household Size | Owner-occupied | Renter-occupied |
| 1-Person Household | 143 (64.4%) | 79 (35.6%) |
| 2-Person Household | 151 (64.3%) | 84 (35.7%) |
| 3-Person Household | 63 (58.3%) | 45 (41.7%) |
| 4+ Person Household | 120 (54.8%) | 99 (45.2%) |
| Total Housing Units | 477 (60.8%) | 307 (39.2%) |
Occupancy by Educational Attainment in Pelican Bay
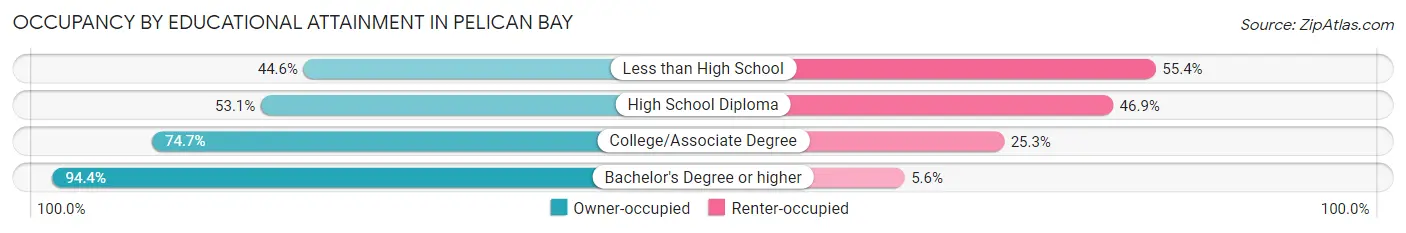
| Household Size | Owner-occupied | Renter-occupied |
| Less than High School | 100 (44.6%) | 124 (55.4%) |
| High School Diploma | 128 (53.1%) | 113 (46.9%) |
| College/Associate Degree | 198 (74.7%) | 67 (25.3%) |
| Bachelor's Degree or higher | 51 (94.4%) | 3 (5.6%) |
Occupancy by Age of Householder in Pelican Bay
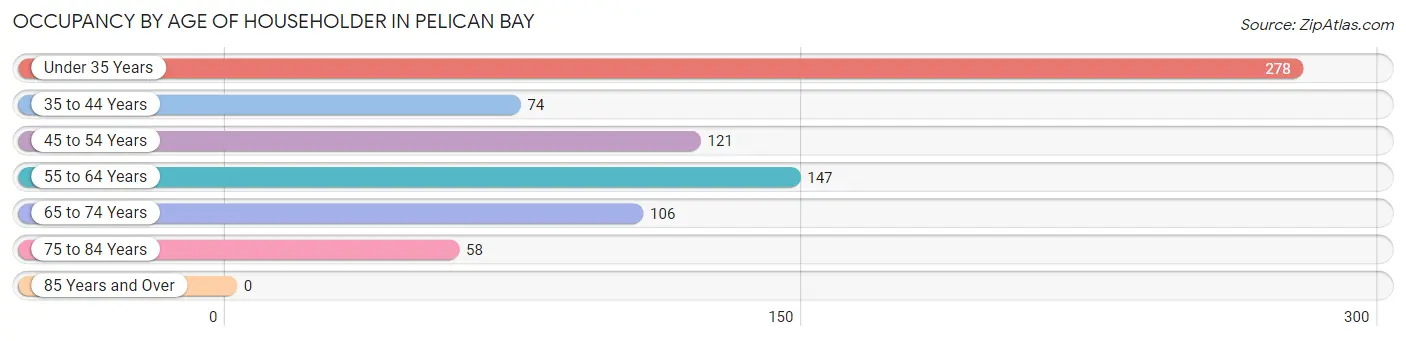
| Age Bracket | # Households | % Households |
| Under 35 Years | 278 | 35.5% |
| 35 to 44 Years | 74 | 9.4% |
| 45 to 54 Years | 121 | 15.4% |
| 55 to 64 Years | 147 | 18.8% |
| 65 to 74 Years | 106 | 13.5% |
| 75 to 84 Years | 58 | 7.4% |
| 85 Years and Over | 0 | 0.0% |
| Total | 784 | 100.0% |
Housing Finances in Pelican Bay
Median Income by Occupancy in Pelican Bay
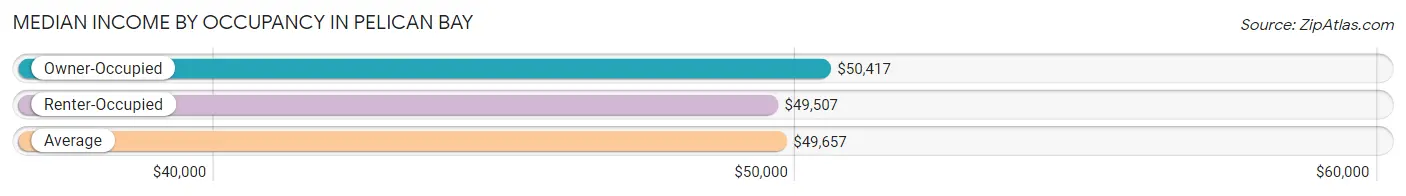
| Occupancy Type | # Households | Median Income |
| Owner-Occupied | 477 (60.8%) | $50,417 |
| Renter-Occupied | 307 (39.2%) | $49,507 |
| Average | 784 (100.0%) | $49,657 |
Occupancy by Householder Income Bracket in Pelican Bay
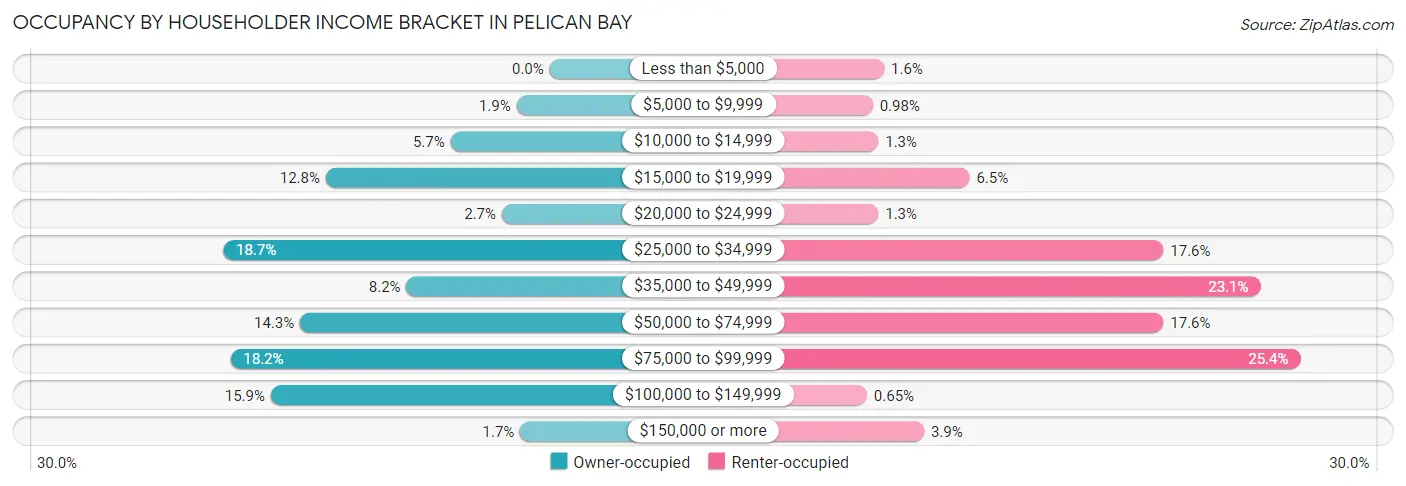
| Income Bracket | Owner-occupied | Renter-occupied |
| Less than $5,000 | 0 (0.0%) | 5 (1.6%) |
| $5,000 to $9,999 | 9 (1.9%) | 3 (1.0%) |
| $10,000 to $14,999 | 27 (5.7%) | 4 (1.3%) |
| $15,000 to $19,999 | 61 (12.8%) | 20 (6.5%) |
| $20,000 to $24,999 | 13 (2.7%) | 4 (1.3%) |
| $25,000 to $34,999 | 89 (18.7%) | 54 (17.6%) |
| $35,000 to $49,999 | 39 (8.2%) | 71 (23.1%) |
| $50,000 to $74,999 | 68 (14.3%) | 54 (17.6%) |
| $75,000 to $99,999 | 87 (18.2%) | 78 (25.4%) |
| $100,000 to $149,999 | 76 (15.9%) | 2 (0.6%) |
| $150,000 or more | 8 (1.7%) | 12 (3.9%) |
| Total | 477 (100.0%) | 307 (100.0%) |
Monthly Housing Cost Tiers in Pelican Bay
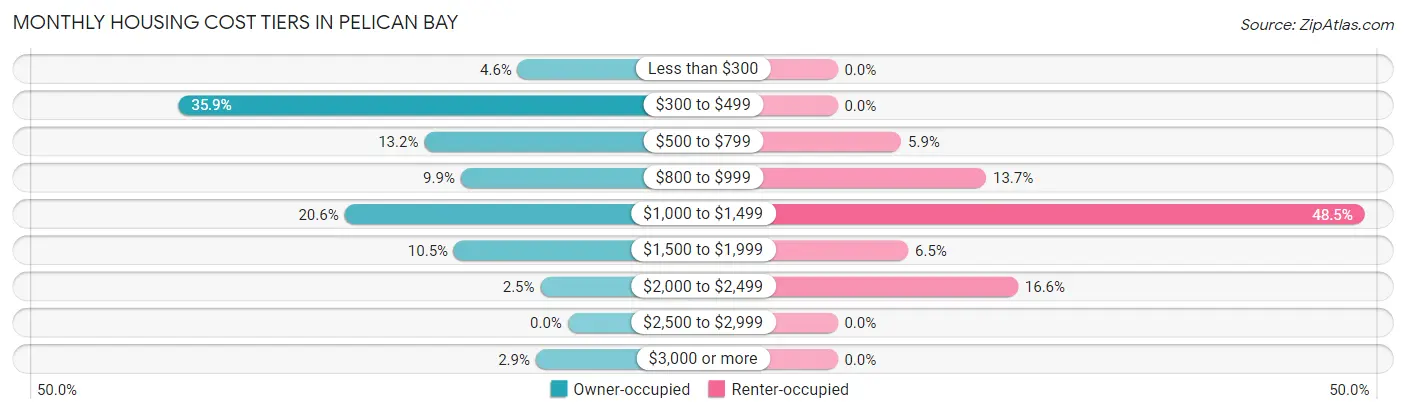
| Monthly Cost | Owner-occupied | Renter-occupied |
| Less than $300 | 22 (4.6%) | 0 (0.0%) |
| $300 to $499 | 171 (35.8%) | 0 (0.0%) |
| $500 to $799 | 63 (13.2%) | 18 (5.9%) |
| $800 to $999 | 47 (9.9%) | 42 (13.7%) |
| $1,000 to $1,499 | 98 (20.5%) | 149 (48.5%) |
| $1,500 to $1,999 | 50 (10.5%) | 20 (6.5%) |
| $2,000 to $2,499 | 12 (2.5%) | 51 (16.6%) |
| $2,500 to $2,999 | 0 (0.0%) | 0 (0.0%) |
| $3,000 or more | 14 (2.9%) | 0 (0.0%) |
| Total | 477 (100.0%) | 307 (100.0%) |
Physical Housing Characteristics in Pelican Bay
Housing Structures in Pelican Bay
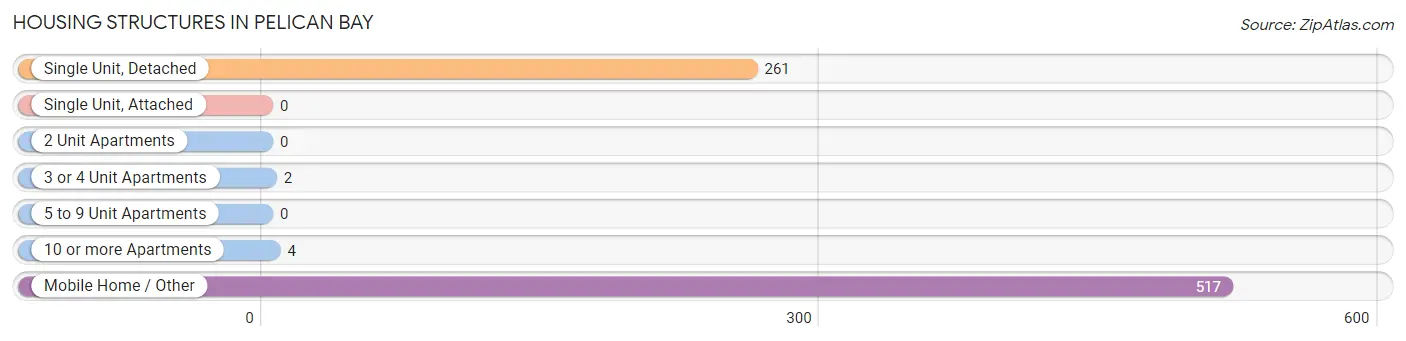
| Structure Type | # Housing Units | % Housing Units |
| Single Unit, Detached | 261 | 33.3% |
| Single Unit, Attached | 0 | 0.0% |
| 2 Unit Apartments | 0 | 0.0% |
| 3 or 4 Unit Apartments | 2 | 0.3% |
| 5 to 9 Unit Apartments | 0 | 0.0% |
| 10 or more Apartments | 4 | 0.5% |
| Mobile Home / Other | 517 | 65.9% |
| Total | 784 | 100.0% |
Housing Structures by Occupancy in Pelican Bay
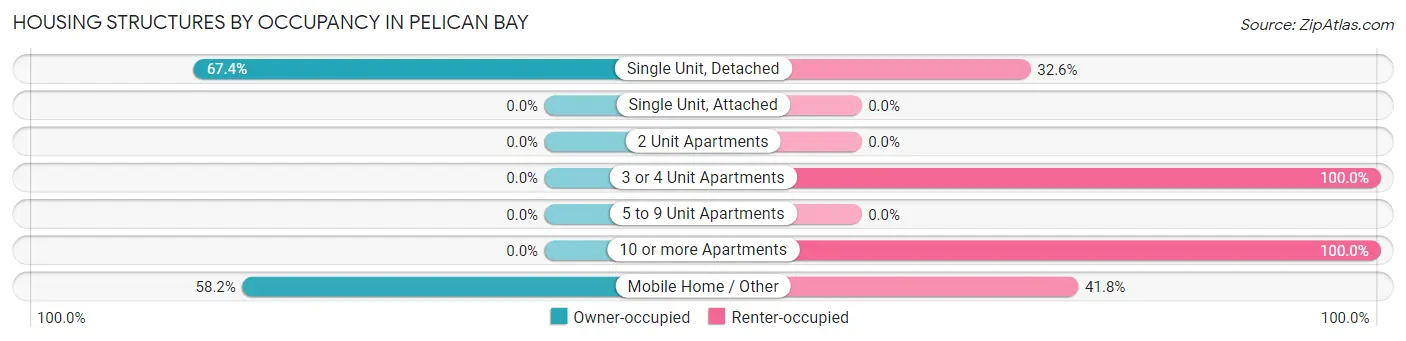
| Structure Type | Owner-occupied | Renter-occupied |
| Single Unit, Detached | 176 (67.4%) | 85 (32.6%) |
| Single Unit, Attached | 0 (0.0%) | 0 (0.0%) |
| 2 Unit Apartments | 0 (0.0%) | 0 (0.0%) |
| 3 or 4 Unit Apartments | 0 (0.0%) | 2 (100.0%) |
| 5 to 9 Unit Apartments | 0 (0.0%) | 0 (0.0%) |
| 10 or more Apartments | 0 (0.0%) | 4 (100.0%) |
| Mobile Home / Other | 301 (58.2%) | 216 (41.8%) |
| Total | 477 (60.8%) | 307 (39.2%) |
Housing Structures by Number of Rooms in Pelican Bay
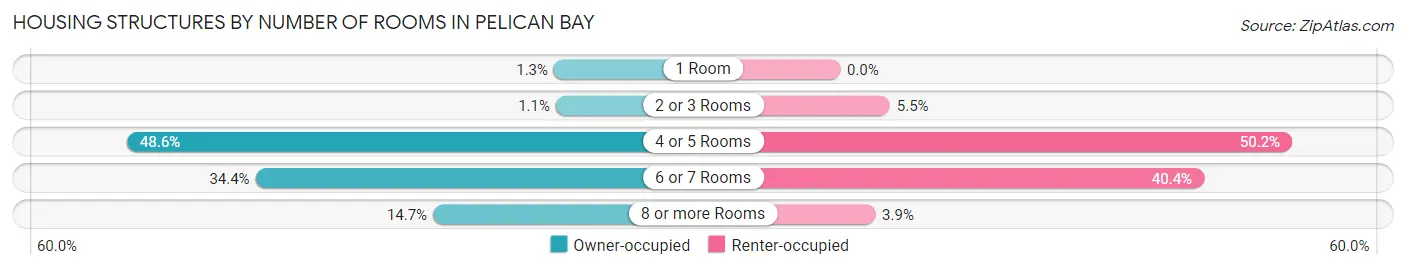
| Number of Rooms | Owner-occupied | Renter-occupied |
| 1 Room | 6 (1.3%) | 0 (0.0%) |
| 2 or 3 Rooms | 5 (1.1%) | 17 (5.5%) |
| 4 or 5 Rooms | 232 (48.6%) | 154 (50.2%) |
| 6 or 7 Rooms | 164 (34.4%) | 124 (40.4%) |
| 8 or more Rooms | 70 (14.7%) | 12 (3.9%) |
| Total | 477 (100.0%) | 307 (100.0%) |
Housing Structure by Heating Type in Pelican Bay
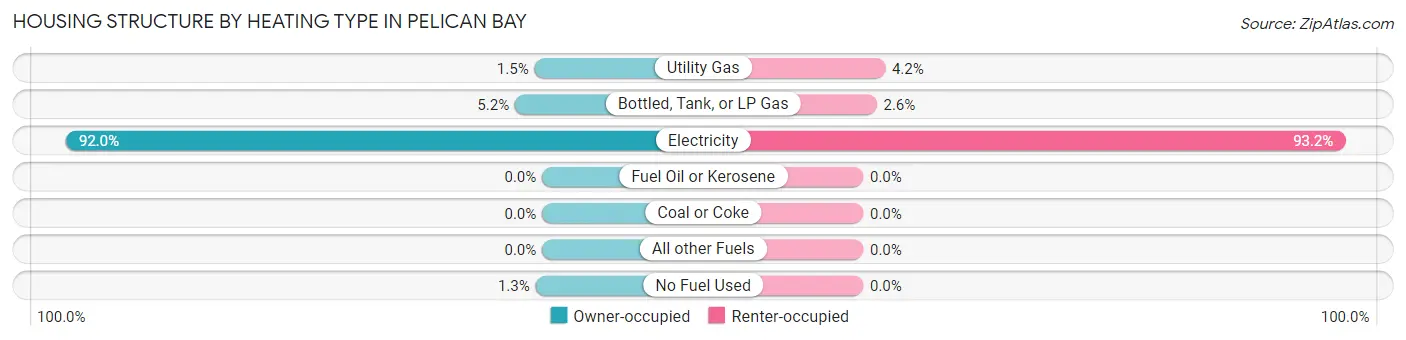
| Heating Type | Owner-occupied | Renter-occupied |
| Utility Gas | 7 (1.5%) | 13 (4.2%) |
| Bottled, Tank, or LP Gas | 25 (5.2%) | 8 (2.6%) |
| Electricity | 439 (92.0%) | 286 (93.2%) |
| Fuel Oil or Kerosene | 0 (0.0%) | 0 (0.0%) |
| Coal or Coke | 0 (0.0%) | 0 (0.0%) |
| All other Fuels | 0 (0.0%) | 0 (0.0%) |
| No Fuel Used | 6 (1.3%) | 0 (0.0%) |
| Total | 477 (100.0%) | 307 (100.0%) |
Household Vehicle Usage in Pelican Bay
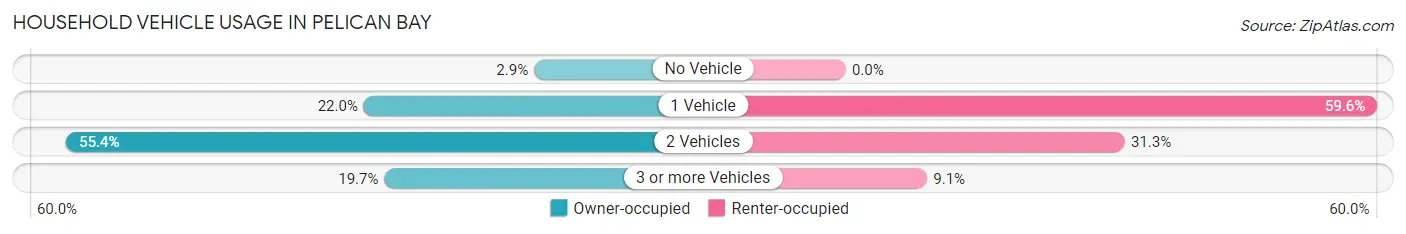
| Vehicles per Household | Owner-occupied | Renter-occupied |
| No Vehicle | 14 (2.9%) | 0 (0.0%) |
| 1 Vehicle | 105 (22.0%) | 183 (59.6%) |
| 2 Vehicles | 264 (55.3%) | 96 (31.3%) |
| 3 or more Vehicles | 94 (19.7%) | 28 (9.1%) |
| Total | 477 (100.0%) | 307 (100.0%) |
Real Estate & Mortgages in Pelican Bay
Real Estate and Mortgage Overview in Pelican Bay
| Characteristic | Without Mortgage | With Mortgage |
| Housing Units | 228 | 249 |
| Median Property Value | $53,200 | $169,700 |
| Median Household Income | - | - |
| Monthly Housing Costs | $359 | $7 |
| Real Estate Taxes | $558 | $46 |
Property Value by Mortgage Status in Pelican Bay
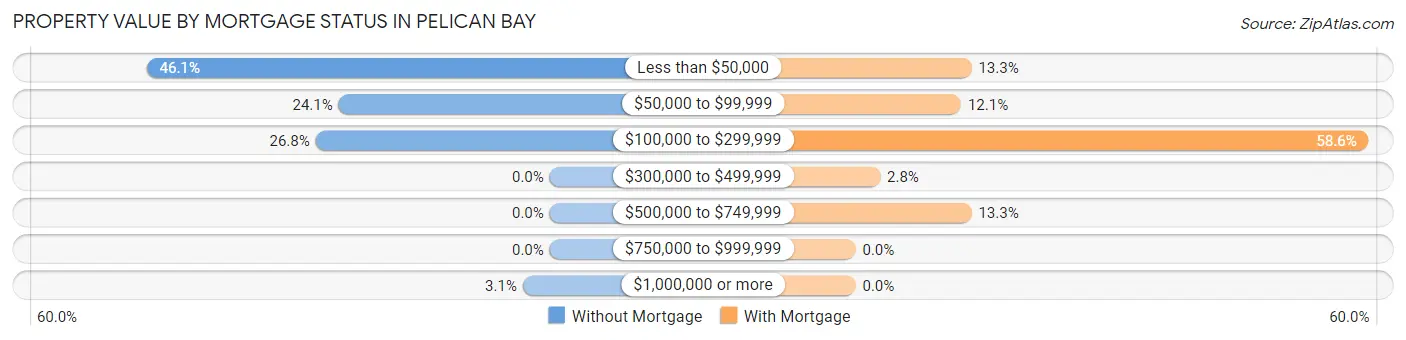
| Property Value | Without Mortgage | With Mortgage |
| Less than $50,000 | 105 (46.1%) | 33 (13.3%) |
| $50,000 to $99,999 | 55 (24.1%) | 30 (12.0%) |
| $100,000 to $299,999 | 61 (26.8%) | 146 (58.6%) |
| $300,000 to $499,999 | 0 (0.0%) | 7 (2.8%) |
| $500,000 to $749,999 | 0 (0.0%) | 33 (13.3%) |
| $750,000 to $999,999 | 0 (0.0%) | 0 (0.0%) |
| $1,000,000 or more | 7 (3.1%) | 0 (0.0%) |
| Total | 228 (100.0%) | 249 (100.0%) |
Household Income by Mortgage Status in Pelican Bay
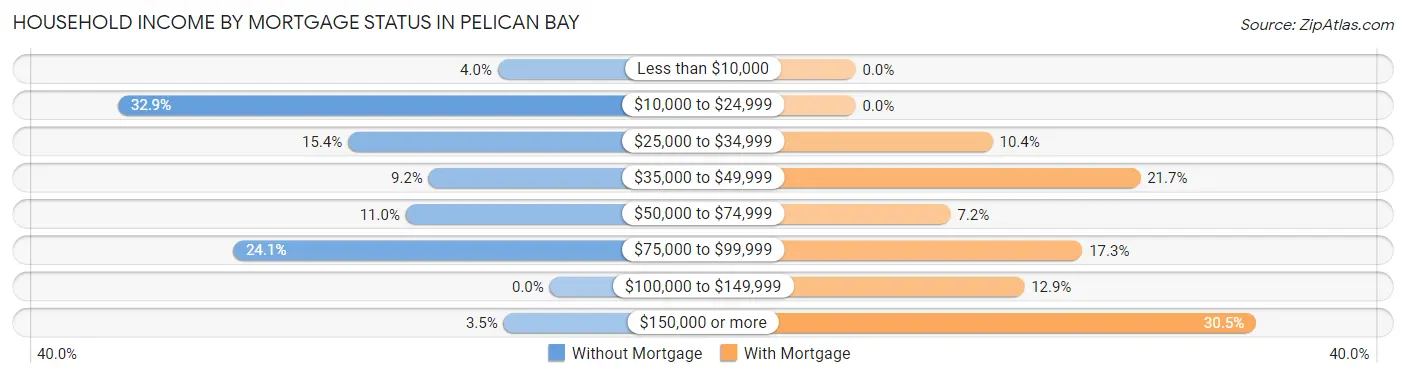
| Household Income | Without Mortgage | With Mortgage |
| Less than $10,000 | 9 (4.0%) | 0 (0.0%) |
| $10,000 to $24,999 | 75 (32.9%) | 0 (0.0%) |
| $25,000 to $34,999 | 35 (15.3%) | 26 (10.4%) |
| $35,000 to $49,999 | 21 (9.2%) | 54 (21.7%) |
| $50,000 to $74,999 | 25 (11.0%) | 18 (7.2%) |
| $75,000 to $99,999 | 55 (24.1%) | 43 (17.3%) |
| $100,000 to $149,999 | 0 (0.0%) | 32 (12.9%) |
| $150,000 or more | 8 (3.5%) | 76 (30.5%) |
| Total | 228 (100.0%) | 249 (100.0%) |
Property Value to Household Income Ratio in Pelican Bay
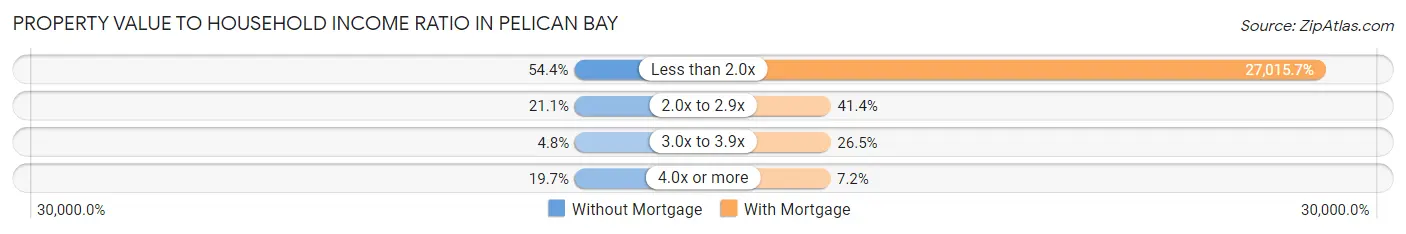
| Value-to-Income Ratio | Without Mortgage | With Mortgage |
| Less than 2.0x | 124 (54.4%) | 67,269 (27,015.7%) |
| 2.0x to 2.9x | 48 (21.0%) | 103 (41.4%) |
| 3.0x to 3.9x | 11 (4.8%) | 66 (26.5%) |
| 4.0x or more | 45 (19.7%) | 18 (7.2%) |
| Total | 228 (100.0%) | 249 (100.0%) |
Real Estate Taxes by Mortgage Status in Pelican Bay
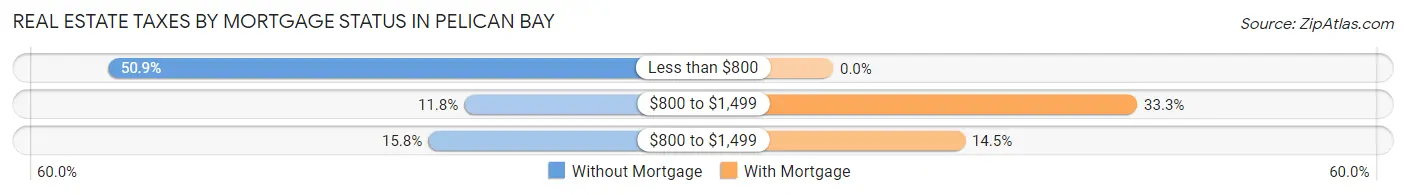
| Property Taxes | Without Mortgage | With Mortgage |
| Less than $800 | 116 (50.9%) | 0 (0.0%) |
| $800 to $1,499 | 27 (11.8%) | 83 (33.3%) |
| $800 to $1,499 | 36 (15.8%) | 36 (14.5%) |
| Total | 228 (100.0%) | 249 (100.0%) |
Health & Disability in Pelican Bay
Health Insurance Coverage by Age in Pelican Bay
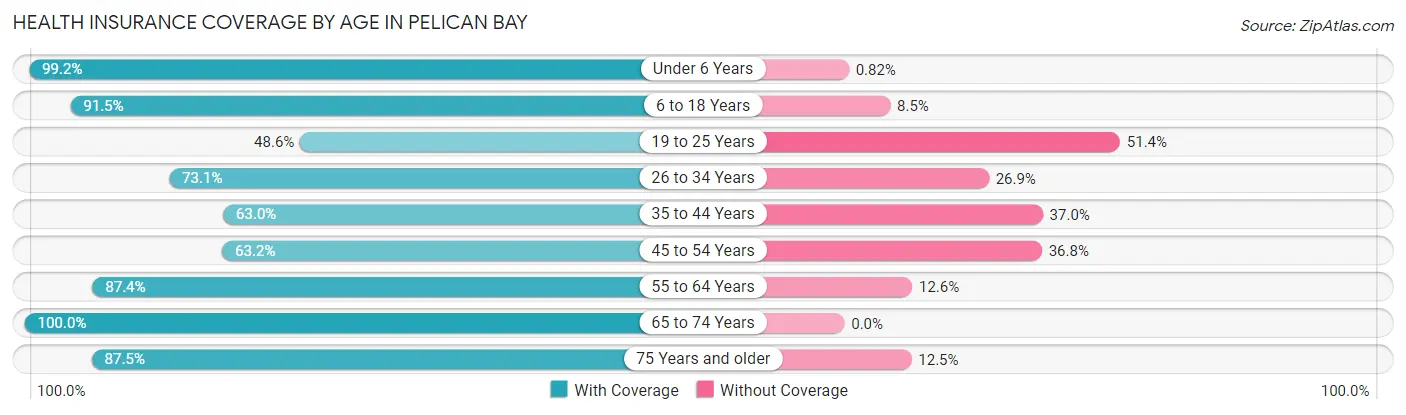
| Age Bracket | With Coverage | Without Coverage |
| Under 6 Years | 242 (99.2%) | 2 (0.8%) |
| 6 to 18 Years | 407 (91.5%) | 38 (8.5%) |
| 19 to 25 Years | 105 (48.6%) | 111 (51.4%) |
| 26 to 34 Years | 293 (73.1%) | 108 (26.9%) |
| 35 to 44 Years | 109 (63.0%) | 64 (37.0%) |
| 45 to 54 Years | 139 (63.2%) | 81 (36.8%) |
| 55 to 64 Years | 228 (87.4%) | 33 (12.6%) |
| 65 to 74 Years | 140 (100.0%) | 0 (0.0%) |
| 75 Years and older | 63 (87.5%) | 9 (12.5%) |
| Total | 1,726 (79.5%) | 446 (20.5%) |
Health Insurance Coverage by Citizenship Status in Pelican Bay
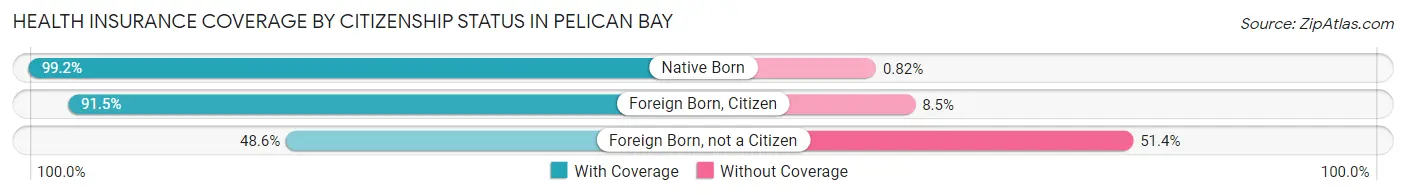
| Citizenship Status | With Coverage | Without Coverage |
| Native Born | 242 (99.2%) | 2 (0.8%) |
| Foreign Born, Citizen | 407 (91.5%) | 38 (8.5%) |
| Foreign Born, not a Citizen | 105 (48.6%) | 111 (51.4%) |
Health Insurance Coverage by Household Income in Pelican Bay
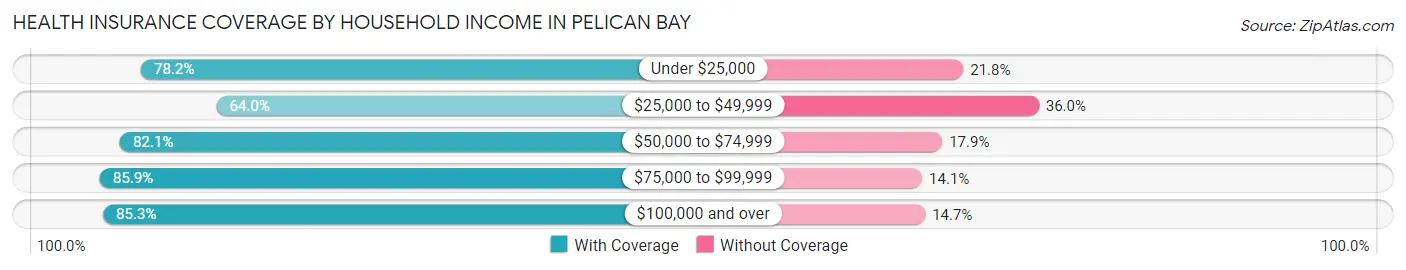
| Household Income | With Coverage | Without Coverage |
| Under $25,000 | 197 (78.2%) | 55 (21.8%) |
| $25,000 to $49,999 | 299 (64.0%) | 168 (36.0%) |
| $50,000 to $74,999 | 349 (82.1%) | 76 (17.9%) |
| $75,000 to $99,999 | 608 (85.9%) | 100 (14.1%) |
| $100,000 and over | 273 (85.3%) | 47 (14.7%) |
Public vs Private Health Insurance Coverage by Age in Pelican Bay
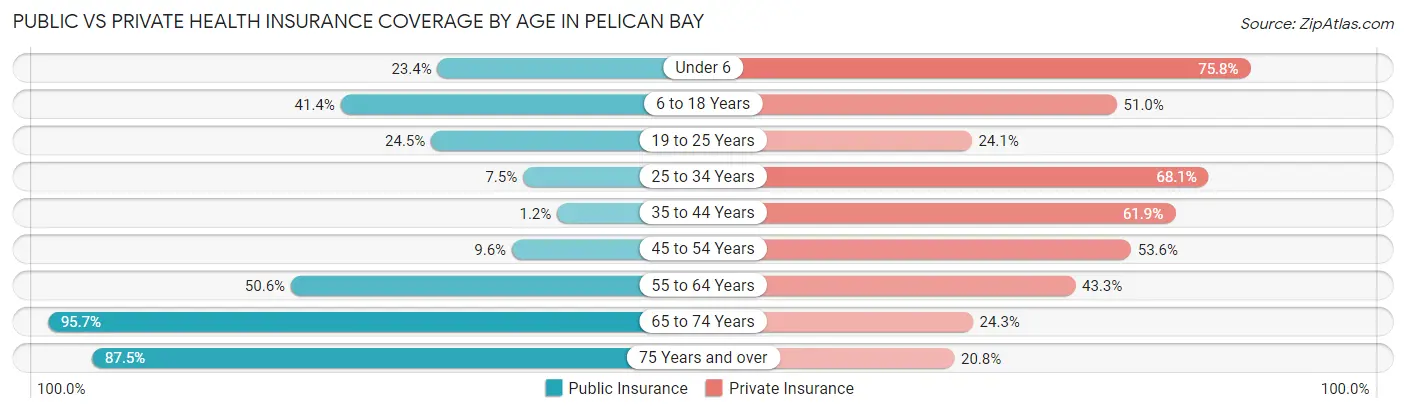
| Age Bracket | Public Insurance | Private Insurance |
| Under 6 | 57 (23.4%) | 185 (75.8%) |
| 6 to 18 Years | 184 (41.3%) | 227 (51.0%) |
| 19 to 25 Years | 53 (24.5%) | 52 (24.1%) |
| 25 to 34 Years | 30 (7.5%) | 273 (68.1%) |
| 35 to 44 Years | 2 (1.2%) | 107 (61.9%) |
| 45 to 54 Years | 21 (9.6%) | 118 (53.6%) |
| 55 to 64 Years | 132 (50.6%) | 113 (43.3%) |
| 65 to 74 Years | 134 (95.7%) | 34 (24.3%) |
| 75 Years and over | 63 (87.5%) | 15 (20.8%) |
| Total | 676 (31.1%) | 1,124 (51.7%) |
Disability Status by Sex by Age in Pelican Bay
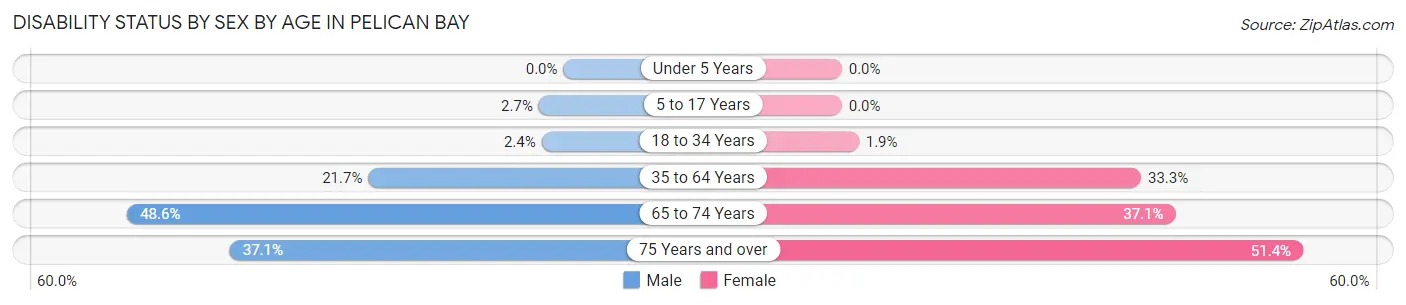
| Age Bracket | Male | Female |
| Under 5 Years | 0 (0.0%) | 0 (0.0%) |
| 5 to 17 Years | 6 (2.7%) | 0 (0.0%) |
| 18 to 34 Years | 8 (2.4%) | 6 (1.9%) |
| 35 to 64 Years | 73 (21.7%) | 106 (33.3%) |
| 65 to 74 Years | 34 (48.6%) | 26 (37.1%) |
| 75 Years and over | 13 (37.1%) | 19 (51.3%) |
Disability Class by Sex by Age in Pelican Bay
Disability Class: Hearing Difficulty
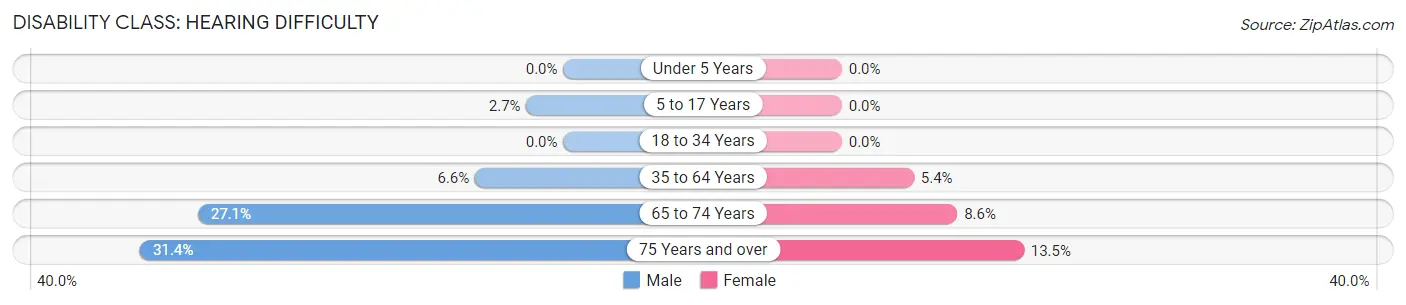
| Age Bracket | Male | Female |
| Under 5 Years | 0 (0.0%) | 0 (0.0%) |
| 5 to 17 Years | 6 (2.7%) | 0 (0.0%) |
| 18 to 34 Years | 0 (0.0%) | 0 (0.0%) |
| 35 to 64 Years | 22 (6.6%) | 17 (5.3%) |
| 65 to 74 Years | 19 (27.1%) | 6 (8.6%) |
| 75 Years and over | 11 (31.4%) | 5 (13.5%) |
Disability Class: Vision Difficulty
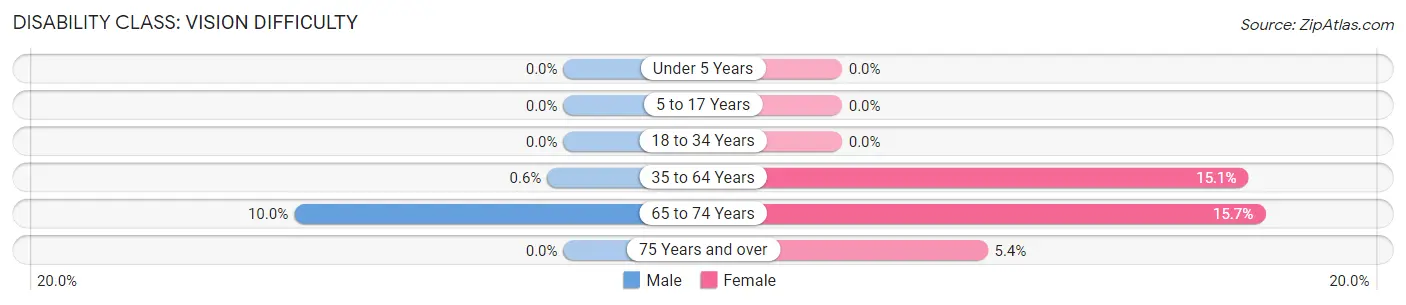
| Age Bracket | Male | Female |
| Under 5 Years | 0 (0.0%) | 0 (0.0%) |
| 5 to 17 Years | 0 (0.0%) | 0 (0.0%) |
| 18 to 34 Years | 0 (0.0%) | 0 (0.0%) |
| 35 to 64 Years | 2 (0.6%) | 48 (15.1%) |
| 65 to 74 Years | 7 (10.0%) | 11 (15.7%) |
| 75 Years and over | 0 (0.0%) | 2 (5.4%) |
Disability Class: Cognitive Difficulty
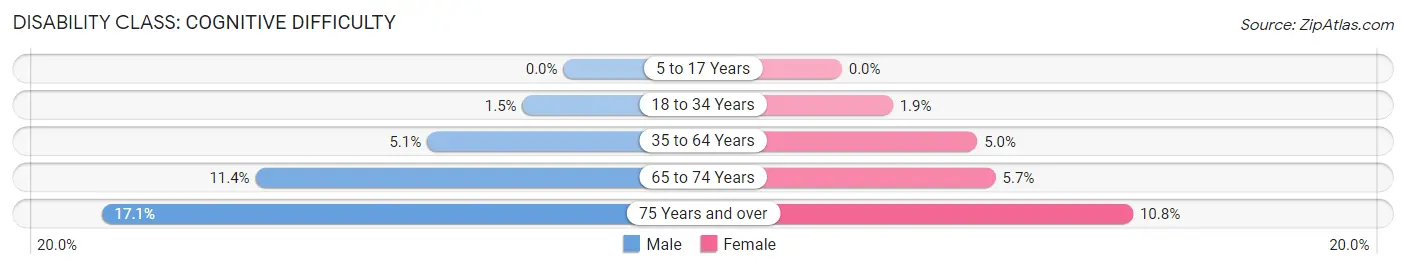
| Age Bracket | Male | Female |
| 5 to 17 Years | 0 (0.0%) | 0 (0.0%) |
| 18 to 34 Years | 5 (1.5%) | 6 (1.9%) |
| 35 to 64 Years | 17 (5.1%) | 16 (5.0%) |
| 65 to 74 Years | 8 (11.4%) | 4 (5.7%) |
| 75 Years and over | 6 (17.1%) | 4 (10.8%) |
Disability Class: Ambulatory Difficulty
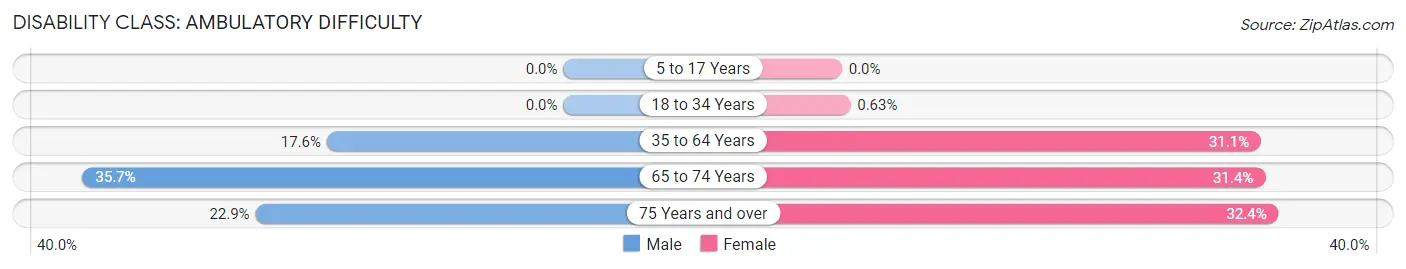
| Age Bracket | Male | Female |
| 5 to 17 Years | 0 (0.0%) | 0 (0.0%) |
| 18 to 34 Years | 0 (0.0%) | 2 (0.6%) |
| 35 to 64 Years | 59 (17.6%) | 99 (31.1%) |
| 65 to 74 Years | 25 (35.7%) | 22 (31.4%) |
| 75 Years and over | 8 (22.9%) | 12 (32.4%) |
Disability Class: Self-Care Difficulty
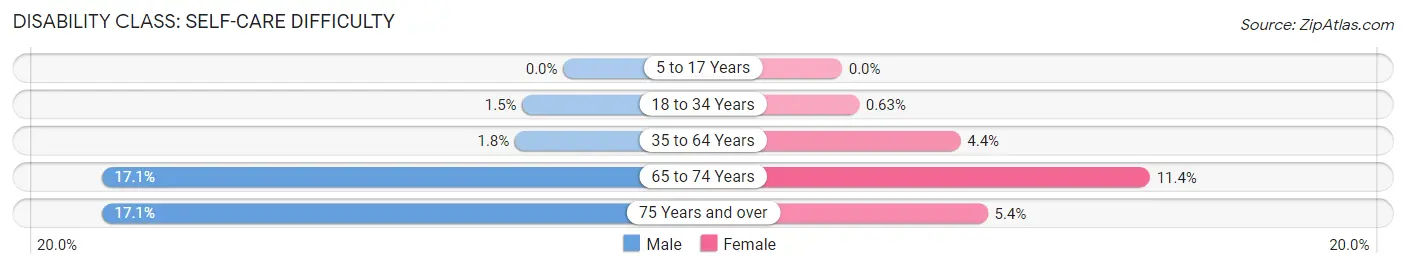
| Age Bracket | Male | Female |
| 5 to 17 Years | 0 (0.0%) | 0 (0.0%) |
| 18 to 34 Years | 5 (1.5%) | 2 (0.6%) |
| 35 to 64 Years | 6 (1.8%) | 14 (4.4%) |
| 65 to 74 Years | 12 (17.1%) | 8 (11.4%) |
| 75 Years and over | 6 (17.1%) | 2 (5.4%) |
Technology Access in Pelican Bay
Computing Device Access in Pelican Bay
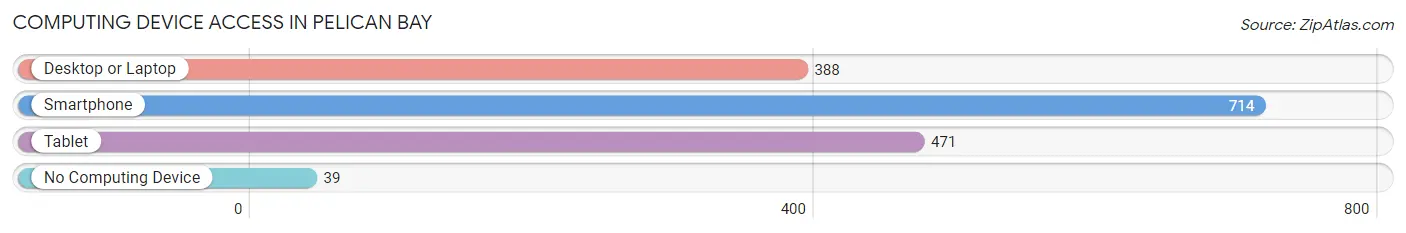
| Device Type | # Households | % Households |
| Desktop or Laptop | 388 | 49.5% |
| Smartphone | 714 | 91.1% |
| Tablet | 471 | 60.1% |
| No Computing Device | 39 | 5.0% |
| Total | 784 | 100.0% |
Internet Access in Pelican Bay
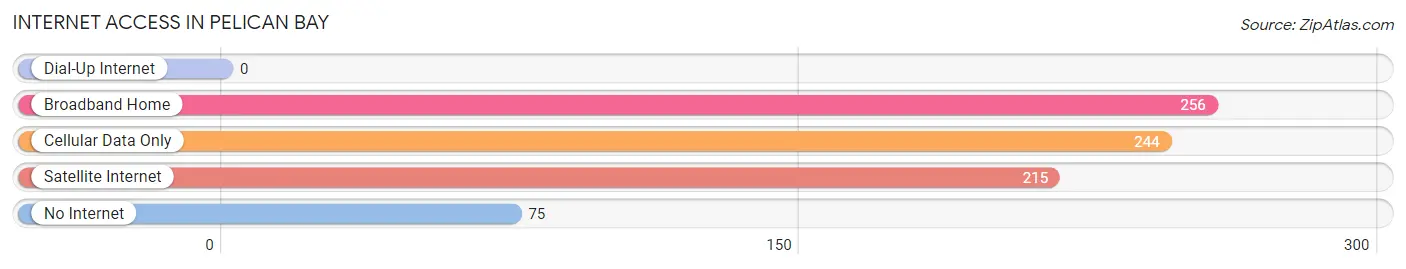
| Internet Type | # Households | % Households |
| Dial-Up Internet | 0 | 0.0% |
| Broadband Home | 256 | 32.7% |
| Cellular Data Only | 244 | 31.1% |
| Satellite Internet | 215 | 27.4% |
| No Internet | 75 | 9.6% |
| Total | 784 | 100.0% |
Pelican Bay Summary
Pelican Bay is a small unincorporated community located in Nueces County, Texas. It is situated on the Gulf of Mexico, approximately 20 miles south of Corpus Christi. The community is home to a variety of businesses, including a marina, a seafood market, and a few restaurants. The population of Pelican Bay is estimated to be around 500 people.
History
Pelican Bay was first settled in the late 1800s by a group of fishermen from Louisiana. The area was originally known as “Pelican Point” and was used as a fishing camp. In the early 1900s, the area was developed into a small community with a post office, a general store, and a few other businesses.
In the 1950s, the area began to grow as more people moved to the area. The population of Pelican Bay increased to around 500 people by the year 2000.
Geography
Pelican Bay is located on the Gulf of Mexico, approximately 20 miles south of Corpus Christi. The area is surrounded by a variety of wildlife, including pelicans, dolphins, and sea turtles. The area is also home to a variety of plants, including sea oats, sea grasses, and mangroves.
The climate in Pelican Bay is generally warm and humid. The average temperature in the summer is around 90 degrees Fahrenheit, while the average temperature in the winter is around 70 degrees Fahrenheit.
Economy
The economy of Pelican Bay is largely based on fishing and tourism. The area is home to a variety of businesses, including a marina, a seafood market, and a few restaurants. The area also has a few small shops and art galleries.
The area is also home to a variety of recreational activities, including fishing, boating, and bird watching. The area is also popular for its beaches, which are known for their white sand and crystal clear waters.
Demographics
The population of Pelican Bay is estimated to be around 500 people. The majority of the population is of Hispanic or Latino descent. The median household income in the area is around $30,000. The area is also home to a variety of religious denominations, including Catholic, Baptist, and Methodist.
Conclusion
Pelican Bay is a small unincorporated community located in Nueces County, Texas. It is situated on the Gulf of Mexico, approximately 20 miles south of Corpus Christi. The population of Pelican Bay is estimated to be around 500 people. The economy of the area is largely based on fishing and tourism. The majority of the population is of Hispanic or Latino descent. The area is also home to a variety of recreational activities, including fishing, boating, and bird watching.
Common Questions
What is Per Capita Income in Pelican Bay?
Per Capita income in Pelican Bay is $22,043.
What is the Median Family Income in Pelican Bay?
Median Family Income in Pelican Bay is $68,750.
What is the Median Household income in Pelican Bay?
Median Household Income in Pelican Bay is $49,657.
What is Income or Wage Gap in Pelican Bay?
Income or Wage Gap in Pelican Bay is 51.5%.
Women in Pelican Bay earn 48.5 cents for every dollar earned by a man.
What is Family Income Deficit in Pelican Bay?
Family Income Deficit in Pelican Bay is $7,874.
Families that are below poverty line in Pelican Bay earn $7,874 less on average than the poverty threshold level.
What is Inequality or Gini Index in Pelican Bay?
Inequality or Gini Index in Pelican Bay is 0.36.
What is the Total Population of Pelican Bay?
Total Population of Pelican Bay is 2,172.
What is the Total Male Population of Pelican Bay?
Total Male Population of Pelican Bay is 1,121.
What is the Total Female Population of Pelican Bay?
Total Female Population of Pelican Bay is 1,051.
What is the Ratio of Males per 100 Females in Pelican Bay?
There are 106.66 Males per 100 Females in Pelican Bay.
What is the Ratio of Females per 100 Males in Pelican Bay?
There are 93.76 Females per 100 Males in Pelican Bay.
What is the Median Population Age in Pelican Bay?
Median Population Age in Pelican Bay is 29.5 Years.
What is the Average Family Size in Pelican Bay
Average Family Size in Pelican Bay is 3.4 People.
What is the Average Household Size in Pelican Bay
Average Household Size in Pelican Bay is 2.8 People.
How Large is the Labor Force in Pelican Bay?
There are 946 People in the Labor Forcein in Pelican Bay.
What is the Percentage of People in the Labor Force in Pelican Bay?
61.1% of People are in the Labor Force in Pelican Bay.
What is the Unemployment Rate in Pelican Bay?
Unemployment Rate in Pelican Bay is 10.2%.