Las Palmas II, TX Map & Demographics
Las Palmas II Map
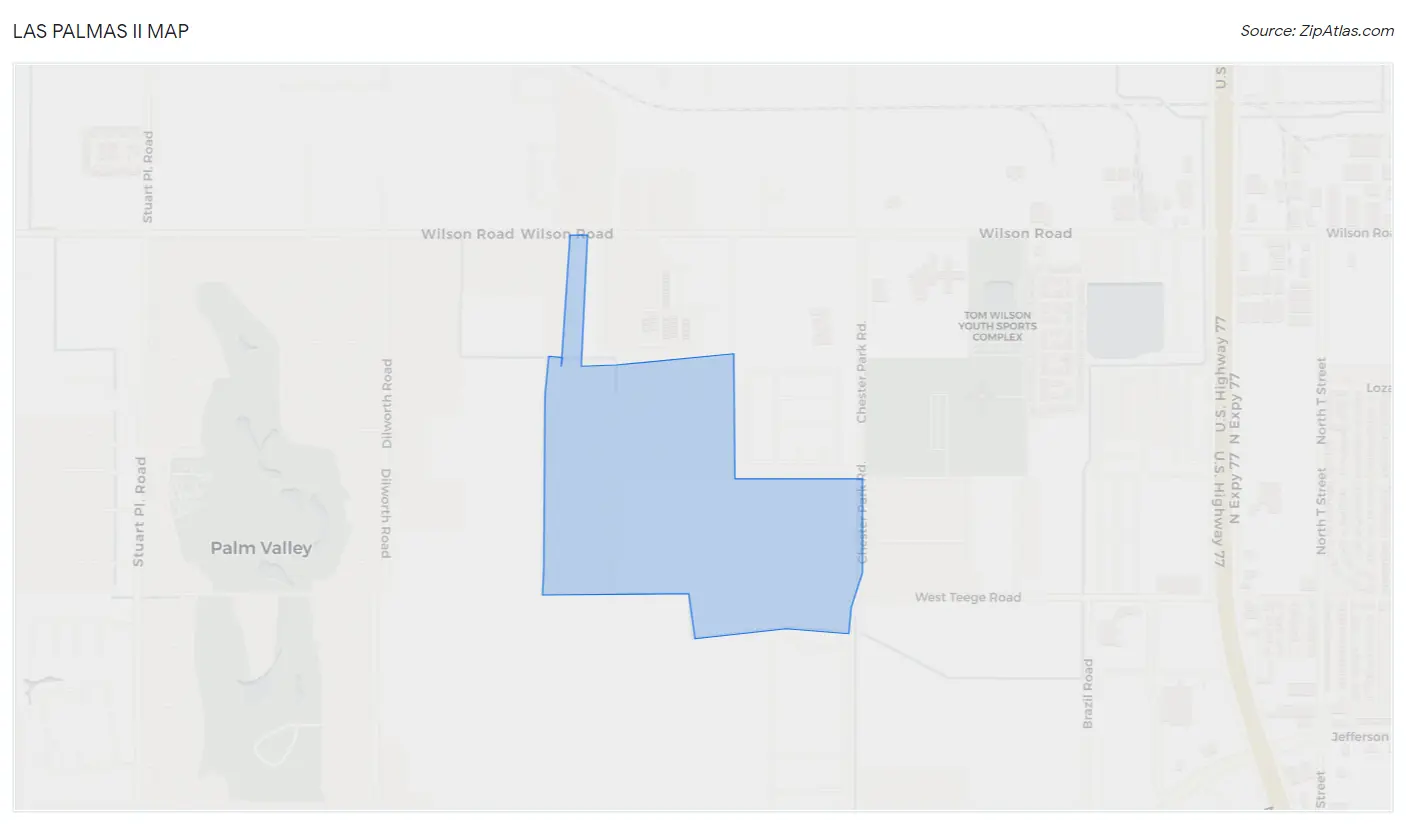
Las Palmas II Overview
$20,046
PER CAPITA INCOME
0.43
INEQUALITY / GINI INDEX
850
TOTAL POPULATION
461
MALE POPULATION
389
FEMALE POPULATION
118.51
MALES / 100 FEMALES
84.38
FEMALES / 100 MALES
39.2
MEDIAN AGE
3.6
AVG FAMILY SIZE
2.6
AVG HOUSEHOLD SIZE
394
LABOR FORCE [ PEOPLE ]
70.1%
PERCENT IN LABOR FORCE
Income in Las Palmas II
Income Overview in Las Palmas II
| Characteristic | Number | Measure |
| Per Capita Income | 850 | $20,046 |
| Median Family Income | 205 | $0 |
| Mean Family Income | 205 | $64,632 |
| Median Household Income | 323 | $0 |
| Mean Household Income | 323 | $52,777 |
| Income Deficit | 205 | $0 |
| Wage / Income Gap (%) | 850 | 0.00% |
| Wage / Income Gap ($) | 850 | 100.00¢ per $1 |
| Gini / Inequality Index | 850 | 0.43 |
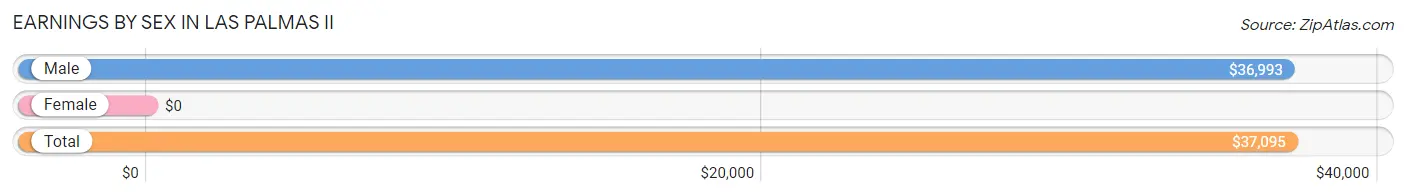
Earnings by Sex in Las Palmas II
| Sex | Number | Average Earnings |
| Male | 241 (61.2%) | $36,993 |
| Female | 153 (38.8%) | $0 |
| Total | 394 (100.0%) | $37,095 |
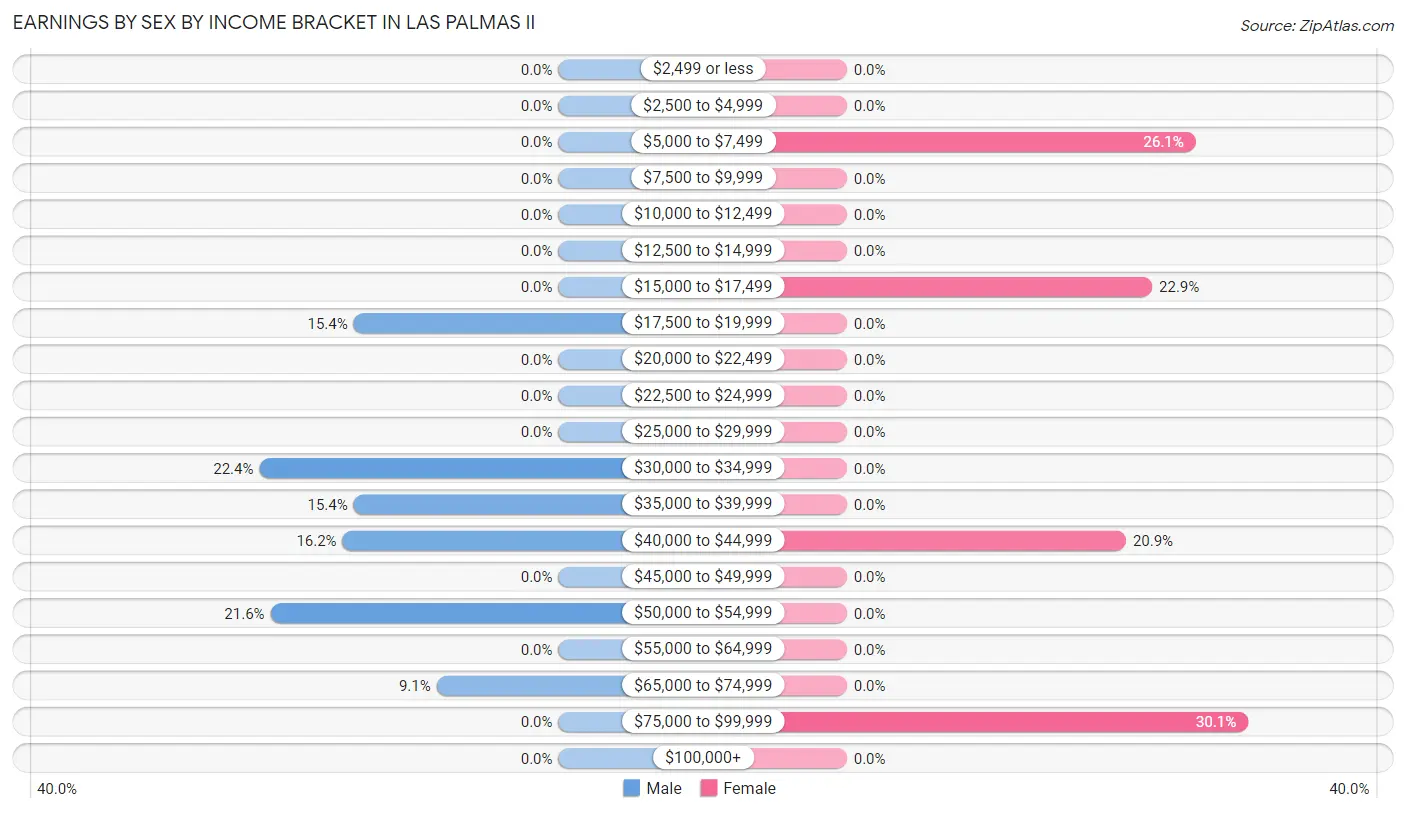
Earnings by Sex by Income Bracket in Las Palmas II
The most common earnings brackets in Las Palmas II are $30,000 to $34,999 for men (54 | 22.4%) and $75,000 to $99,999 for women (46 | 30.1%).
| Income | Male | Female |
| $2,499 or less | 0 (0.0%) | 0 (0.0%) |
| $2,500 to $4,999 | 0 (0.0%) | 0 (0.0%) |
| $5,000 to $7,499 | 0 (0.0%) | 40 (26.1%) |
| $7,500 to $9,999 | 0 (0.0%) | 0 (0.0%) |
| $10,000 to $12,499 | 0 (0.0%) | 0 (0.0%) |
| $12,500 to $14,999 | 0 (0.0%) | 0 (0.0%) |
| $15,000 to $17,499 | 0 (0.0%) | 35 (22.9%) |
| $17,500 to $19,999 | 37 (15.3%) | 0 (0.0%) |
| $20,000 to $22,499 | 0 (0.0%) | 0 (0.0%) |
| $22,500 to $24,999 | 0 (0.0%) | 0 (0.0%) |
| $25,000 to $29,999 | 0 (0.0%) | 0 (0.0%) |
| $30,000 to $34,999 | 54 (22.4%) | 0 (0.0%) |
| $35,000 to $39,999 | 37 (15.3%) | 0 (0.0%) |
| $40,000 to $44,999 | 39 (16.2%) | 32 (20.9%) |
| $45,000 to $49,999 | 0 (0.0%) | 0 (0.0%) |
| $50,000 to $54,999 | 52 (21.6%) | 0 (0.0%) |
| $55,000 to $64,999 | 0 (0.0%) | 0 (0.0%) |
| $65,000 to $74,999 | 22 (9.1%) | 0 (0.0%) |
| $75,000 to $99,999 | 0 (0.0%) | 46 (30.1%) |
| $100,000+ | 0 (0.0%) | 0 (0.0%) |
| Total | 241 (100.0%) | 153 (100.0%) |
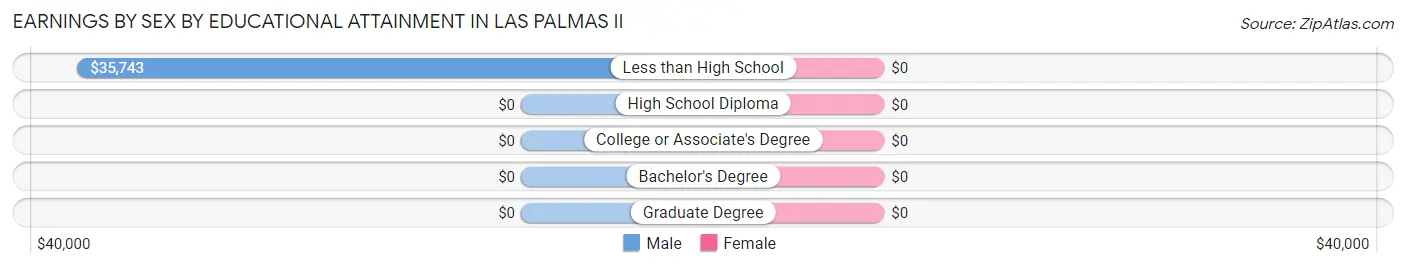
Earnings by Sex by Educational Attainment in Las Palmas II
| Educational Attainment | Male Income | Female Income |
| Less than High School | $35,743 | $0 |
| High School Diploma | - | - |
| College or Associate's Degree | - | - |
| Bachelor's Degree | - | - |
| Graduate Degree | - | - |
| Total | $36,993 | $0 |
Family Income in Las Palmas II
Family Income Brackets in Las Palmas II
According to the Las Palmas II family income data, there are 58 families falling into the $10,000 to $14,999 income range, which is the most common income bracket and makes up 28.3% of all families.
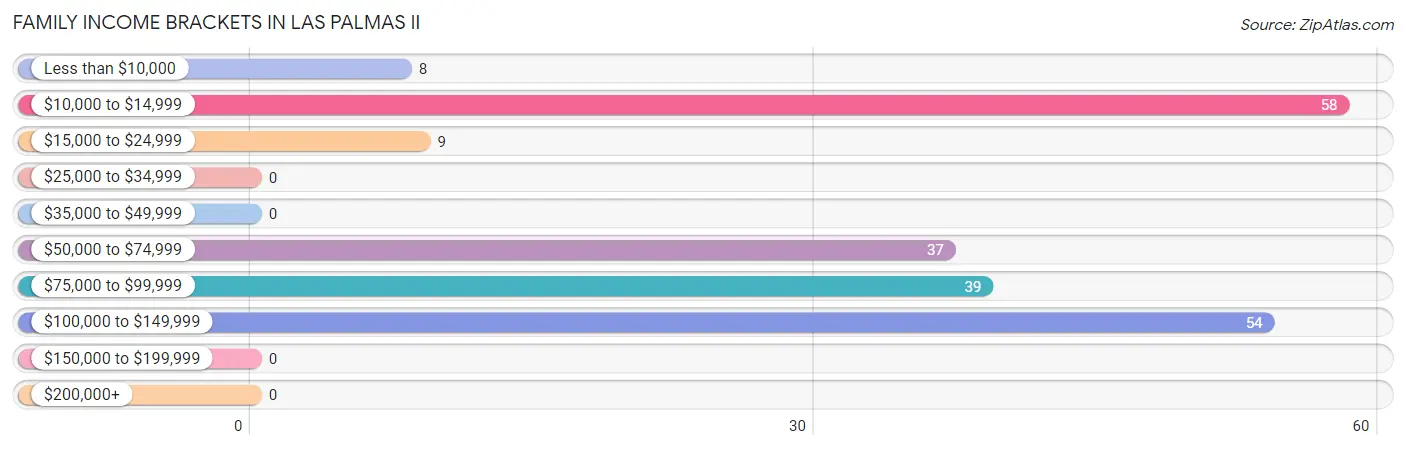
| Income Bracket | # Families | % Families |
| Less than $10,000 | 8 | 3.9% |
| $10,000 to $14,999 | 58 | 28.3% |
| $15,000 to $24,999 | 9 | 4.4% |
| $25,000 to $34,999 | 0 | 0.0% |
| $35,000 to $49,999 | 0 | 0.0% |
| $50,000 to $74,999 | 37 | 18.0% |
| $75,000 to $99,999 | 39 | 19.0% |
| $100,000 to $149,999 | 54 | 26.3% |
| $150,000 to $199,999 | 0 | 0.0% |
| $200,000+ | 0 | 0.0% |
Family Income by Famaliy Size in Las Palmas II
4-person families (130 | 63.4%) account for the highest median family income in Las Palmas II with $94,295 per family, while 4-person families (130 | 63.4%) have the highest median income of $23,574 per family member.
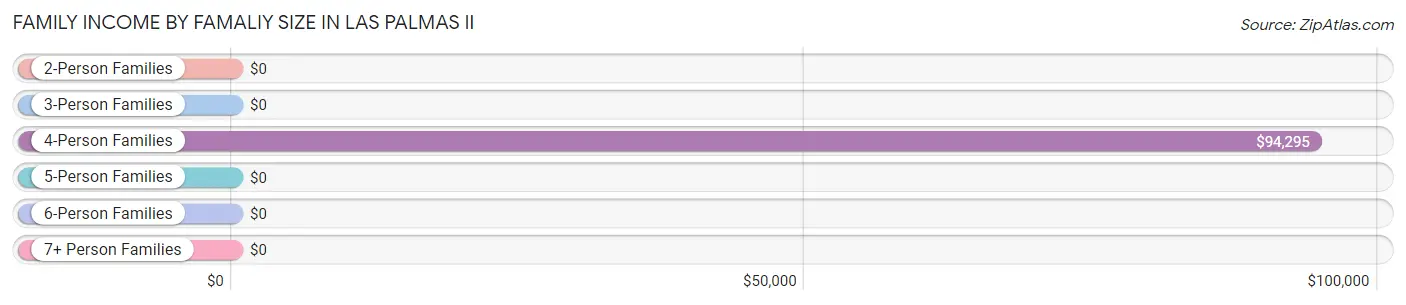
| Income Bracket | # Families | Median Income |
| 2-Person Families | 58 (28.3%) | $0 |
| 3-Person Families | 0 (0.0%) | $0 |
| 4-Person Families | 130 (63.4%) | $94,295 |
| 5-Person Families | 8 (3.9%) | $0 |
| 6-Person Families | 0 (0.0%) | $0 |
| 7+ Person Families | 9 (4.4%) | $0 |
| Total | 205 (100.0%) | $0 |
Family Income by Number of Earners in Las Palmas II
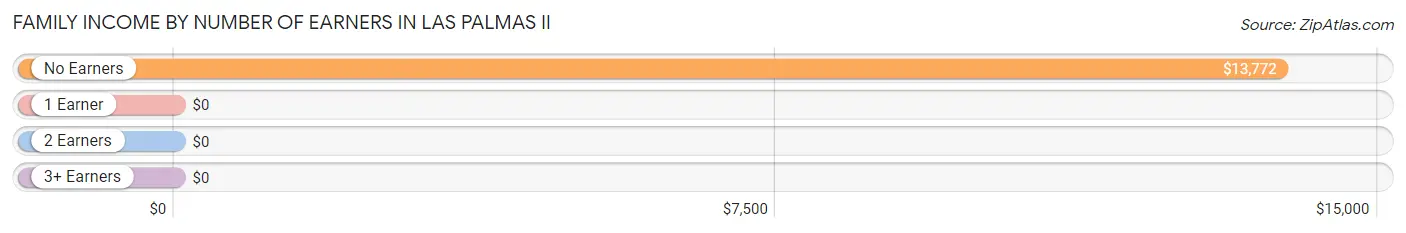
| Number of Earners | # Families | Median Income |
| No Earners | 75 (36.6%) | $13,772 |
| 1 Earner | 0 (0.0%) | $0 |
| 2 Earners | 93 (45.4%) | $0 |
| 3+ Earners | 37 (18.0%) | $0 |
| Total | 205 (100.0%) | $0 |
Household Income in Las Palmas II
Household Income Brackets in Las Palmas II
With 59 households falling in the category, the $50,000 to $74,999 income range is the most frequent in Las Palmas II, accounting for 18.3% of all households.
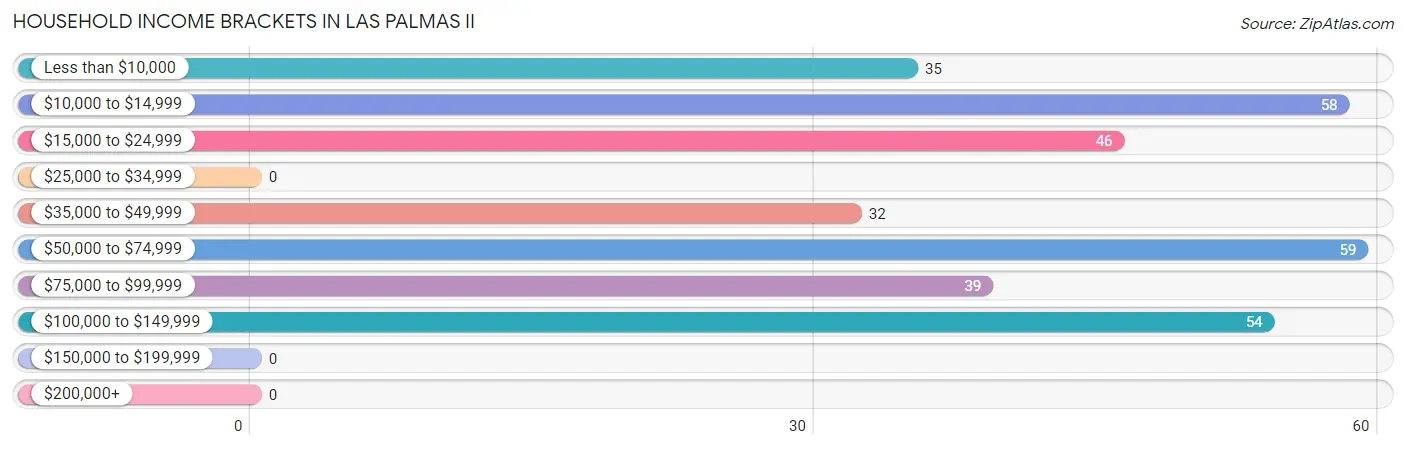
| Income Bracket | # Households | % Households |
| Less than $10,000 | 35 | 10.8% |
| $10,000 to $14,999 | 58 | 18.0% |
| $15,000 to $24,999 | 46 | 14.2% |
| $25,000 to $34,999 | 0 | 0.0% |
| $35,000 to $49,999 | 32 | 9.9% |
| $50,000 to $74,999 | 59 | 18.3% |
| $75,000 to $99,999 | 39 | 12.1% |
| $100,000 to $149,999 | 54 | 16.7% |
| $150,000 to $199,999 | 0 | 0.0% |
| $200,000+ | 0 | 0.0% |
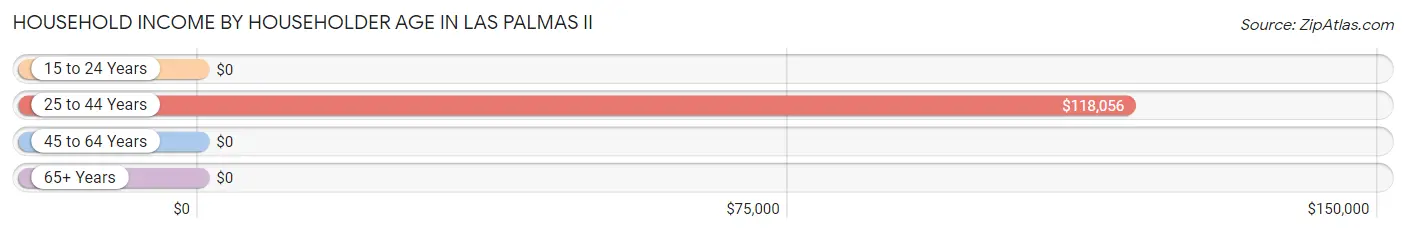
Household Income by Householder Age in Las Palmas II
The median household income in Las Palmas II is $0, with the highest median household income of $118,056 found in the 25 to 44 years age bracket for the primary householder. A total of 84 households (26.0%) fall into this category.
| Income Bracket | # Households | Median Income |
| 15 to 24 Years | 0 (0.0%) | $0 |
| 25 to 44 Years | 84 (26.0%) | $118,056 |
| 45 to 64 Years | 212 (65.6%) | $0 |
| 65+ Years | 27 (8.4%) | $0 |
| Total | 323 (100.0%) | $0 |
Poverty in Las Palmas II
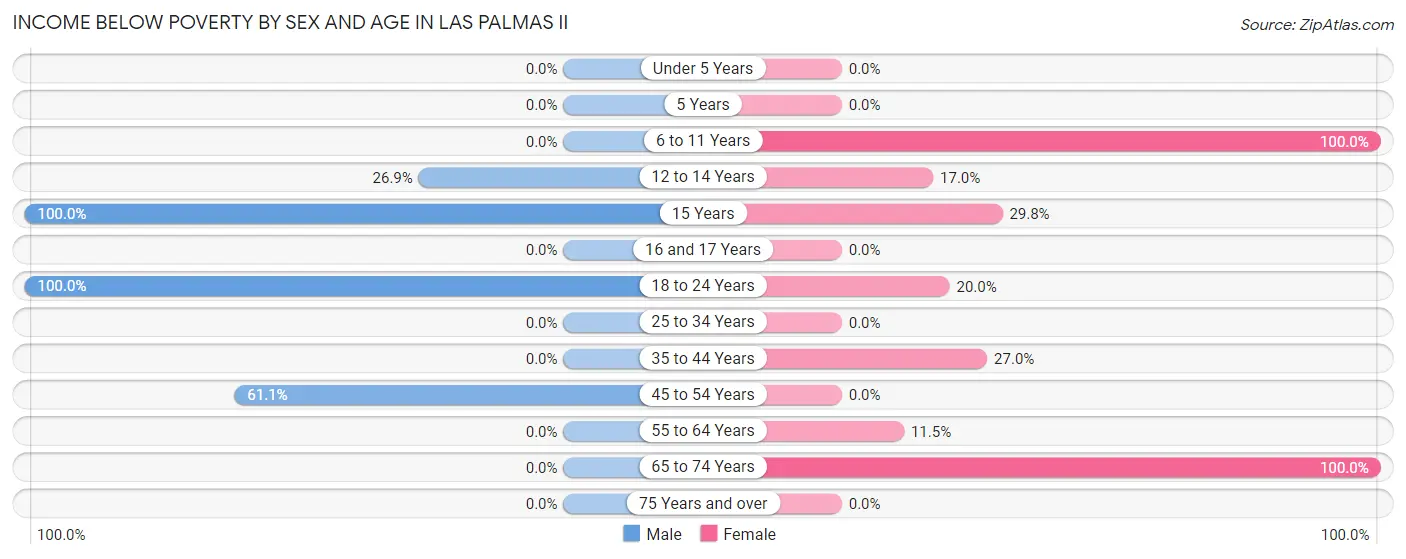
Income Below Poverty by Sex and Age in Las Palmas II
With 29.1% poverty level for males and 28.3% for females among the residents of Las Palmas II, 15 year old males and 6 to 11 year old females are the most vulnerable to poverty, with 48 males (100.0%) and 20 females (100.0%) in their respective age groups living below the poverty level.
| Age Bracket | Male | Female |
| Under 5 Years | 0 (0.0%) | 0 (0.0%) |
| 5 Years | 0 (0.0%) | 0 (0.0%) |
| 6 to 11 Years | 0 (0.0%) | 20 (100.0%) |
| 12 to 14 Years | 18 (26.9%) | 10 (17.0%) |
| 15 Years | 48 (100.0%) | 17 (29.8%) |
| 16 and 17 Years | 0 (0.0%) | 0 (0.0%) |
| 18 to 24 Years | 10 (100.0%) | 10 (20.0%) |
| 25 to 34 Years | 0 (0.0%) | 0 (0.0%) |
| 35 to 44 Years | 0 (0.0%) | 17 (27.0%) |
| 45 to 54 Years | 58 (61.1%) | 0 (0.0%) |
| 55 to 64 Years | 0 (0.0%) | 9 (11.5%) |
| 65 to 74 Years | 0 (0.0%) | 27 (100.0%) |
| 75 Years and over | 0 (0.0%) | 0 (0.0%) |
| Total | 134 (29.1%) | 110 (28.3%) |
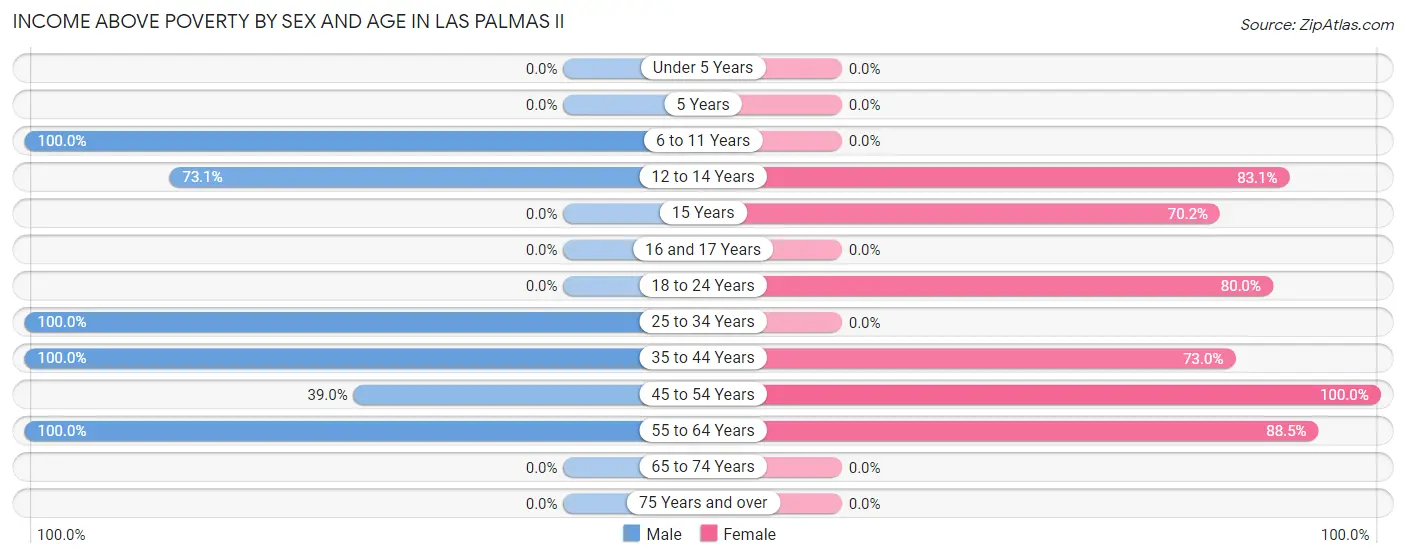
Income Above Poverty by Sex and Age in Las Palmas II
According to the poverty statistics in Las Palmas II, males aged 6 to 11 years and females aged 45 to 54 years are the age groups that are most secure financially, with 100.0% of males and 100.0% of females in these age groups living above the poverty line.
| Age Bracket | Male | Female |
| Under 5 Years | 0 (0.0%) | 0 (0.0%) |
| 5 Years | 0 (0.0%) | 0 (0.0%) |
| 6 to 11 Years | 37 (100.0%) | 0 (0.0%) |
| 12 to 14 Years | 49 (73.1%) | 49 (83.1%) |
| 15 Years | 0 (0.0%) | 40 (70.2%) |
| 16 and 17 Years | 0 (0.0%) | 0 (0.0%) |
| 18 to 24 Years | 0 (0.0%) | 40 (80.0%) |
| 25 to 34 Years | 52 (100.0%) | 0 (0.0%) |
| 35 to 44 Years | 76 (100.0%) | 46 (73.0%) |
| 45 to 54 Years | 37 (39.0%) | 35 (100.0%) |
| 55 to 64 Years | 76 (100.0%) | 69 (88.5%) |
| 65 to 74 Years | 0 (0.0%) | 0 (0.0%) |
| 75 Years and over | 0 (0.0%) | 0 (0.0%) |
| Total | 327 (70.9%) | 279 (71.7%) |
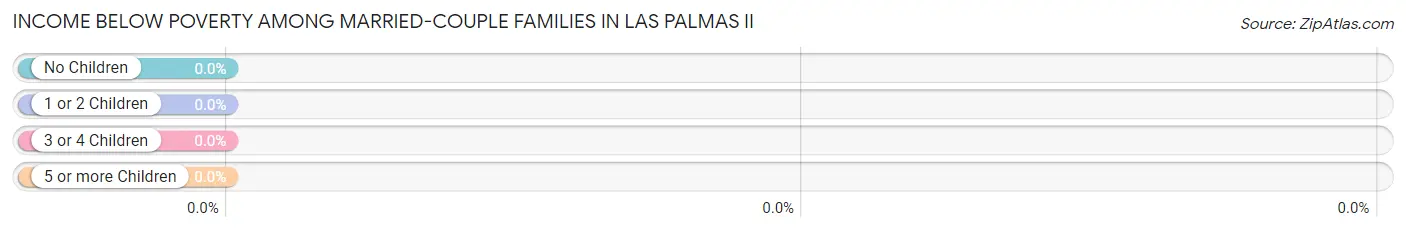
Income Below Poverty Among Married-Couple Families in Las Palmas II
| Children | Above Poverty | Below Poverty |
| No Children | 0 (0.0%) | 0 (0.0%) |
| 1 or 2 Children | 130 (100.0%) | 0 (0.0%) |
| 3 or 4 Children | 0 (0.0%) | 0 (0.0%) |
| 5 or more Children | 0 (0.0%) | 0 (0.0%) |
| Total | 130 (100.0%) | 0 (0.0%) |
Income Below Poverty Among Single-Parent Households in Las Palmas II
According to the poverty data in Las Palmas II, 100.0% or 58 single-father households and 100.0% or 17 single-mother households are living below the poverty line. Among single-father households, those with 1 or 2 children have the highest poverty rate, with 58 households (100.0%) experiencing poverty. Likewise, among single-mother households, those with 3 or 4 children have the highest poverty rate, with 17 households (100.0%) falling below the poverty line.
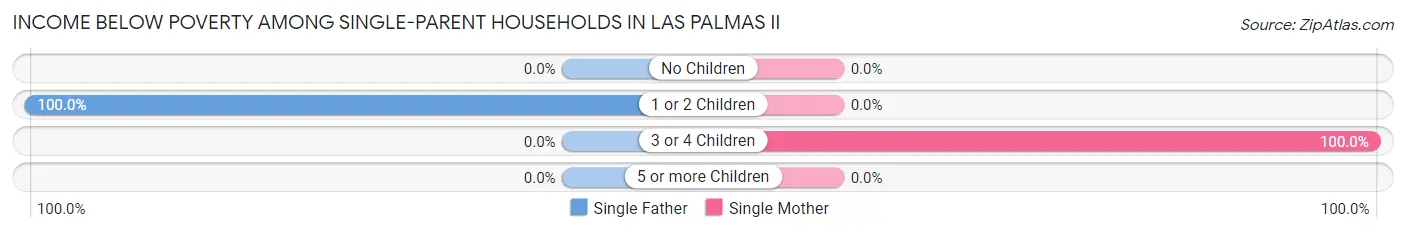
| Children | Single Father | Single Mother |
| No Children | 0 (0.0%) | 0 (0.0%) |
| 1 or 2 Children | 58 (100.0%) | 0 (0.0%) |
| 3 or 4 Children | 0 (0.0%) | 17 (100.0%) |
| 5 or more Children | 0 (0.0%) | 0 (0.0%) |
| Total | 58 (100.0%) | 17 (100.0%) |
Income Below Poverty Among Married-Couple vs Single-Parent Households in Las Palmas II
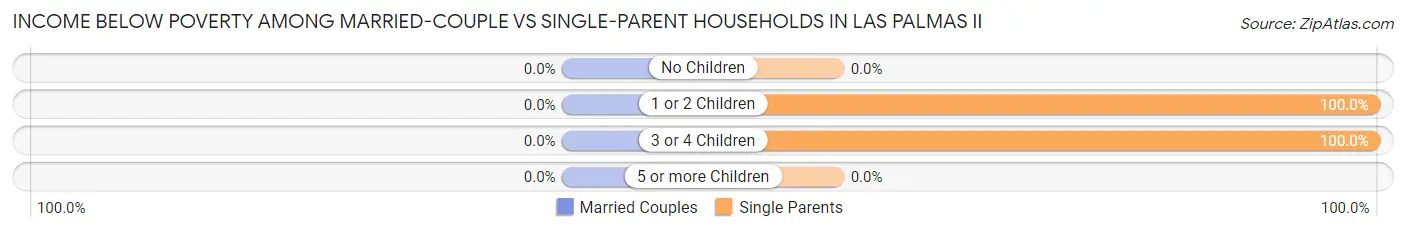
| Children | Married-Couple Families | Single-Parent Households |
| No Children | 0 (0.0%) | 0 (0.0%) |
| 1 or 2 Children | 0 (0.0%) | 58 (100.0%) |
| 3 or 4 Children | 0 (0.0%) | 17 (100.0%) |
| 5 or more Children | 0 (0.0%) | 0 (0.0%) |
| Total | 0 (0.0%) | 75 (100.0%) |
Race in Las Palmas II
The most populous races in Las Palmas II are Hispanic or Latino (850 | 100.0%), White / Caucasian (754 | 88.7%), and Some other Race (96 | 11.3%).
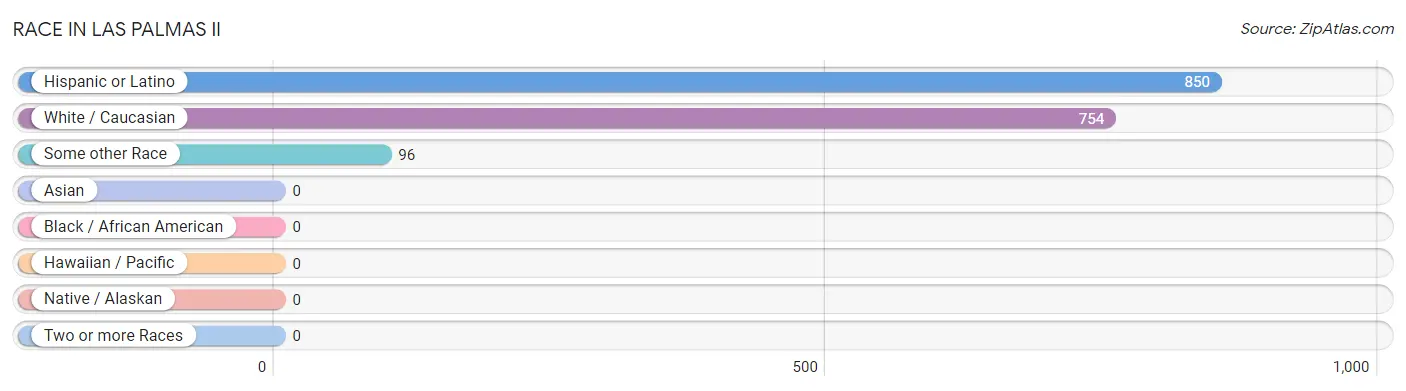
| Race | # Population | % Population |
| Asian | 0 | 0.0% |
| Black / African American | 0 | 0.0% |
| Hawaiian / Pacific | 0 | 0.0% |
| Hispanic or Latino | 850 | 100.0% |
| Native / Alaskan | 0 | 0.0% |
| White / Caucasian | 754 | 88.7% |
| Two or more Races | 0 | 0.0% |
| Some other Race | 96 | 11.3% |
| Total | 850 | 100.0% |
Ancestry in Las Palmas II
The most populous ancestries reported in Las Palmas II are Mexican (850 | 100.0%), and American (38 | 4.5%), together accounting for 104.5% of all Las Palmas II residents.
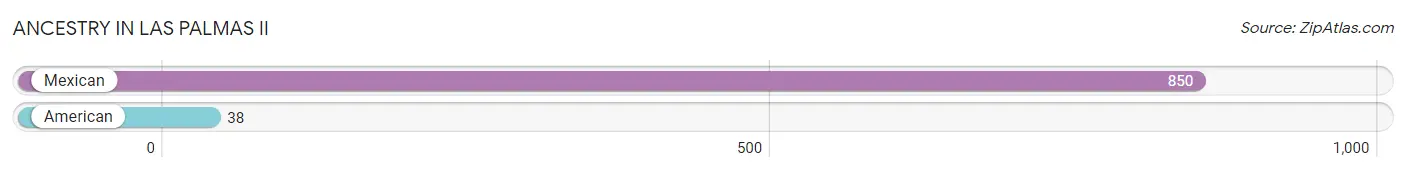
| Ancestry | # Population | % Population |
| American | 38 | 4.5% |
| Mexican | 850 | 100.0% | View All 2 Rows |
Immigrants in Las Palmas II
The most numerous immigrant groups reported in Las Palmas II came from Central America (133 | 15.7%), Latin America (133 | 15.7%), and Mexico (133 | 15.7%), together accounting for 47.0% of all Las Palmas II residents.
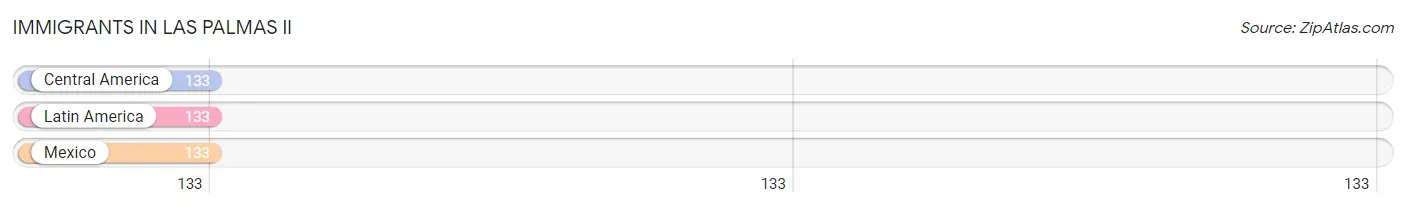
| Immigration Origin | # Population | % Population |
| Central America | 133 | 15.7% |
| Latin America | 133 | 15.7% |
| Mexico | 133 | 15.7% | View All 3 Rows |
Sex and Age in Las Palmas II
Sex and Age in Las Palmas II
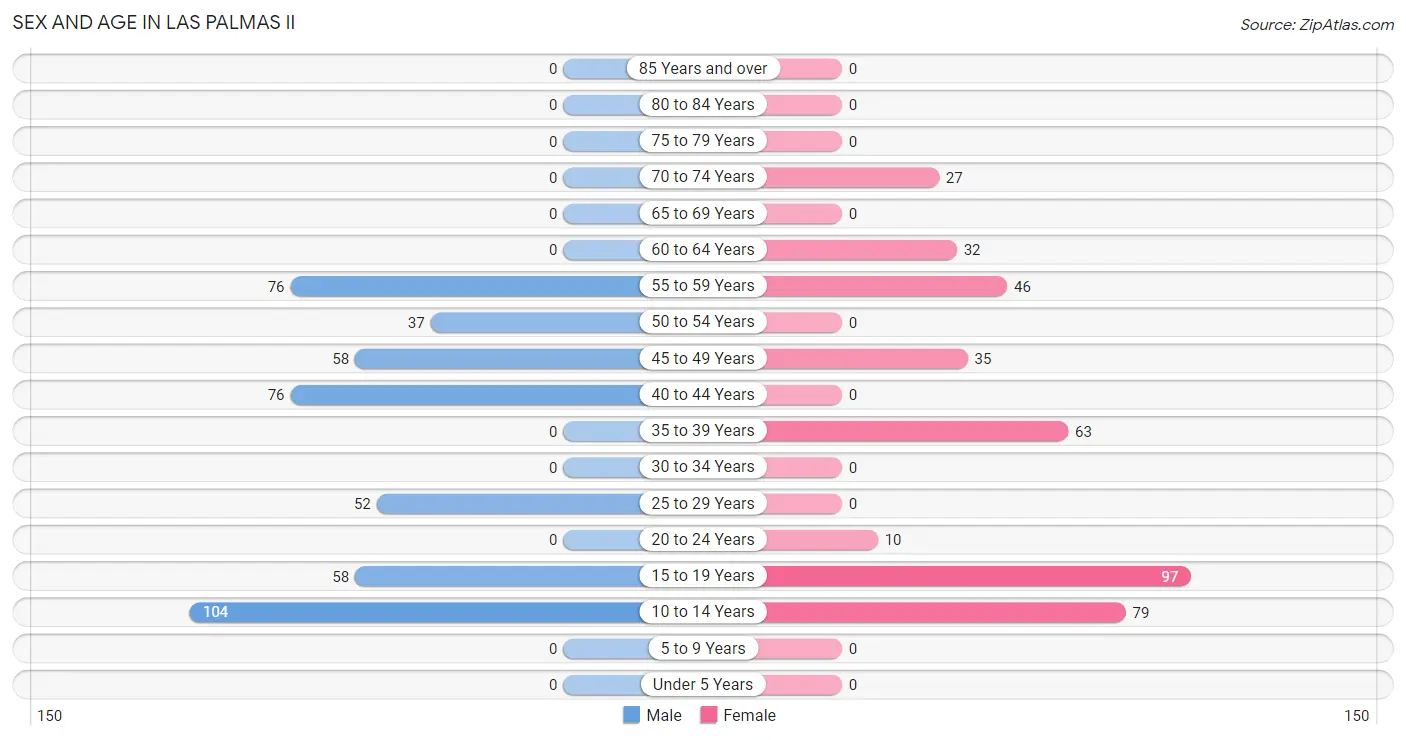
The most populous age groups in Las Palmas II are 10 to 14 Years (104 | 22.6%) for men and 15 to 19 Years (97 | 24.9%) for women.
| Age Bracket | Male | Female |
| Under 5 Years | 0 (0.0%) | 0 (0.0%) |
| 5 to 9 Years | 0 (0.0%) | 0 (0.0%) |
| 10 to 14 Years | 104 (22.6%) | 79 (20.3%) |
| 15 to 19 Years | 58 (12.6%) | 97 (24.9%) |
| 20 to 24 Years | 0 (0.0%) | 10 (2.6%) |
| 25 to 29 Years | 52 (11.3%) | 0 (0.0%) |
| 30 to 34 Years | 0 (0.0%) | 0 (0.0%) |
| 35 to 39 Years | 0 (0.0%) | 63 (16.2%) |
| 40 to 44 Years | 76 (16.5%) | 0 (0.0%) |
| 45 to 49 Years | 58 (12.6%) | 35 (9.0%) |
| 50 to 54 Years | 37 (8.0%) | 0 (0.0%) |
| 55 to 59 Years | 76 (16.5%) | 46 (11.8%) |
| 60 to 64 Years | 0 (0.0%) | 32 (8.2%) |
| 65 to 69 Years | 0 (0.0%) | 0 (0.0%) |
| 70 to 74 Years | 0 (0.0%) | 27 (6.9%) |
| 75 to 79 Years | 0 (0.0%) | 0 (0.0%) |
| 80 to 84 Years | 0 (0.0%) | 0 (0.0%) |
| 85 Years and over | 0 (0.0%) | 0 (0.0%) |
| Total | 461 (100.0%) | 389 (100.0%) |
Families and Households in Las Palmas II
Median Family Size in Las Palmas II
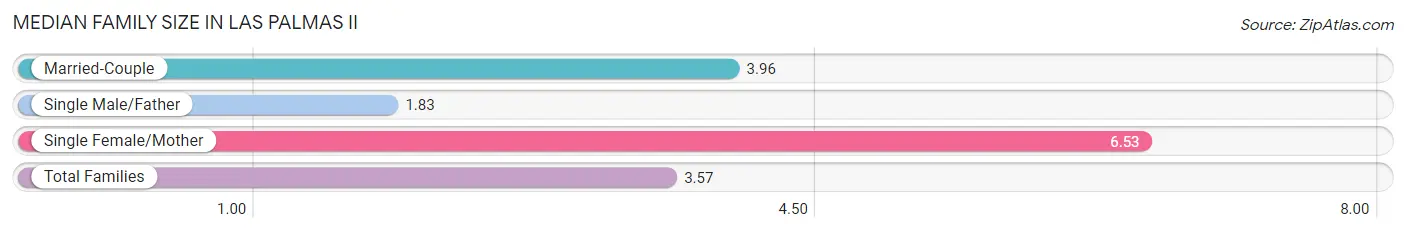
The median family size in Las Palmas II is 3.57 persons per family, with single female/mother families (17 | 8.3%) accounting for the largest median family size of 6.53 persons per family. On the other hand, single male/father families (58 | 28.3%) represent the smallest median family size with 1.83 persons per family.
| Family Type | # Families | Family Size |
| Married-Couple | 130 (63.4%) | 3.96 |
| Single Male/Father | 58 (28.3%) | 1.83 |
| Single Female/Mother | 17 (8.3%) | 6.53 |
| Total Families | 205 (100.0%) | 3.57 |
Median Household Size in Las Palmas II
| Household Type | # Households | Household Size |
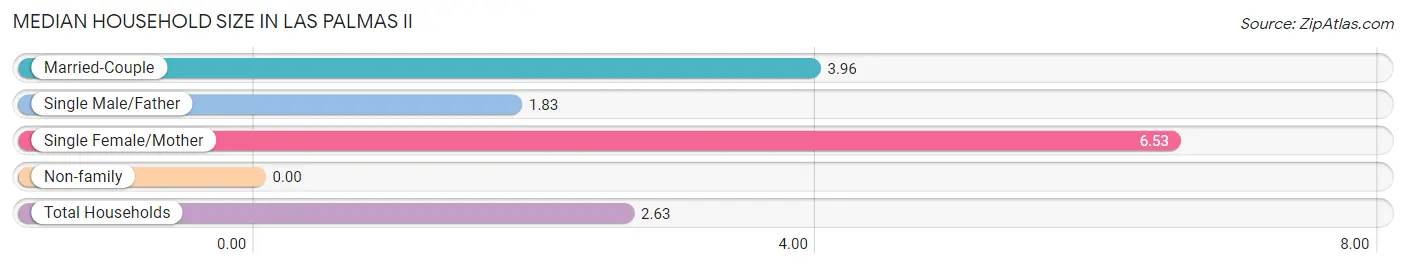
| Married-Couple | 130 (40.3%) | 3.96 |
| Single Male/Father | 58 (18.0%) | 1.83 |
| Single Female/Mother | 17 (5.3%) | 6.53 |
| Non-family | 118 (36.5%) | - |
| Total Households | 323 (100.0%) | 2.63 |
Household Size by Marriage Status in Las Palmas II
Out of a total of 323 households in Las Palmas II, 205 (63.5%) are family households, while 118 (36.5%) are nonfamily households. The most numerous type of family households are 4-person households, comprising 130, and the most common type of nonfamily households are 1-person households, comprising 118.
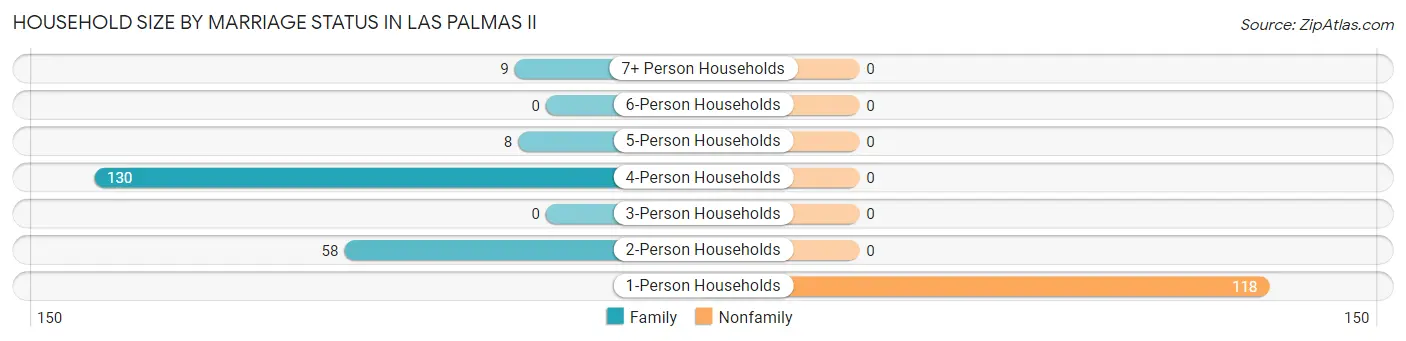
| Household Size | Family Households | Nonfamily Households |
| 1-Person Households | - | 118 (36.5%) |
| 2-Person Households | 58 (18.0%) | 0 (0.0%) |
| 3-Person Households | 0 (0.0%) | 0 (0.0%) |
| 4-Person Households | 130 (40.3%) | 0 (0.0%) |
| 5-Person Households | 8 (2.5%) | 0 (0.0%) |
| 6-Person Households | 0 (0.0%) | 0 (0.0%) |
| 7+ Person Households | 9 (2.8%) | 0 (0.0%) |
| Total | 205 (63.5%) | 118 (36.5%) |
Female Fertility in Las Palmas II
Fertility by Age in Las Palmas II
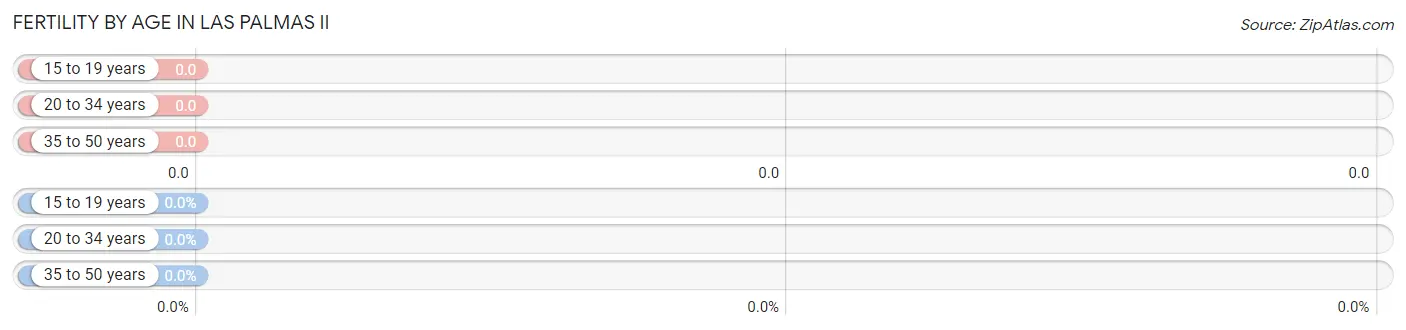
| Age Bracket | Women with Births | Births / 1,000 Women |
| 15 to 19 years | 0 (0.0%) | 0.0 |
| 20 to 34 years | 0 (0.0%) | 0.0 |
| 35 to 50 years | 0 (0.0%) | 0.0 |
| Total | 0 (0.0%) | 0.0 |
Fertility by Age by Marriage Status in Las Palmas II
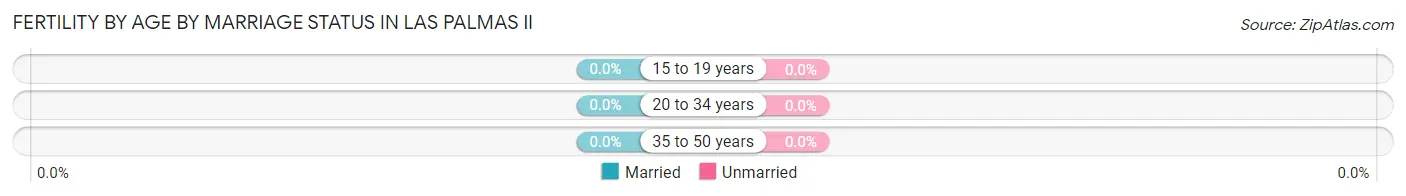
| Age Bracket | Married | Unmarried |
| 15 to 19 years | 0 (0.0%) | 0 (0.0%) |
| 20 to 34 years | 0 (0.0%) | 0 (0.0%) |
| 35 to 50 years | 0 (0.0%) | 0 (0.0%) |
| Total | 0 (0.0%) | 0 (0.0%) |
Fertility by Education in Las Palmas II
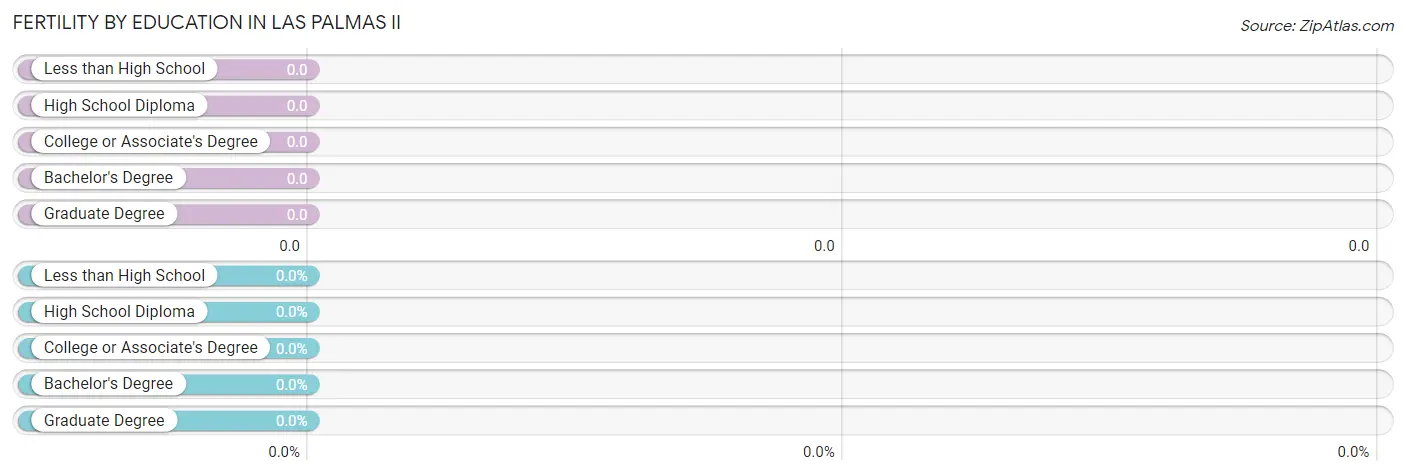
| Educational Attainment | Women with Births | Births / 1,000 Women |
| Less than High School | 0 (0.0%) | 0.0 |
| High School Diploma | 0 (0.0%) | 0.0 |
| College or Associate's Degree | 0 (0.0%) | 0.0 |
| Bachelor's Degree | 0 (0.0%) | 0.0 |
| Graduate Degree | 0 (0.0%) | 0.0 |
| Total | 0 (0.0%) | 0.0 |
Fertility by Education by Marriage Status in Las Palmas II
| Educational Attainment | Married | Unmarried |
| Less than High School | 0 (0.0%) | 0 (0.0%) |
| High School Diploma | 0 (0.0%) | 0 (0.0%) |
| College or Associate's Degree | 0 (0.0%) | 0 (0.0%) |
| Bachelor's Degree | 0 (0.0%) | 0 (0.0%) |
| Graduate Degree | 0 (0.0%) | 0 (0.0%) |
| Total | 0 (0.0%) | 0 (0.0%) |
Employment Characteristics in Las Palmas II
Employment by Class of Employer in Las Palmas II
Among the 394 employed individuals in Las Palmas II, private company employees (296 | 75.1%), self-employed (not incorporated) (52 | 13.2%), and state government employees (46 | 11.7%) make up the most common classes of employment.
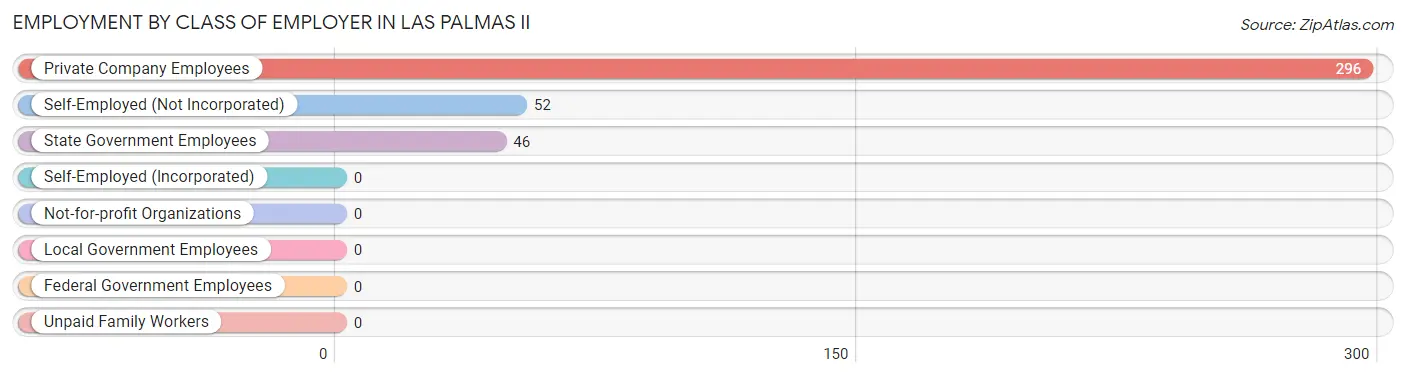
| Employer Class | # Employees | % Employees |
| Private Company Employees | 296 | 75.1% |
| Self-Employed (Incorporated) | 0 | 0.0% |
| Self-Employed (Not Incorporated) | 52 | 13.2% |
| Not-for-profit Organizations | 0 | 0.0% |
| Local Government Employees | 0 | 0.0% |
| State Government Employees | 46 | 11.7% |
| Federal Government Employees | 0 | 0.0% |
| Unpaid Family Workers | 0 | 0.0% |
| Total | 394 | 100.0% |
Employment Status by Age in Las Palmas II
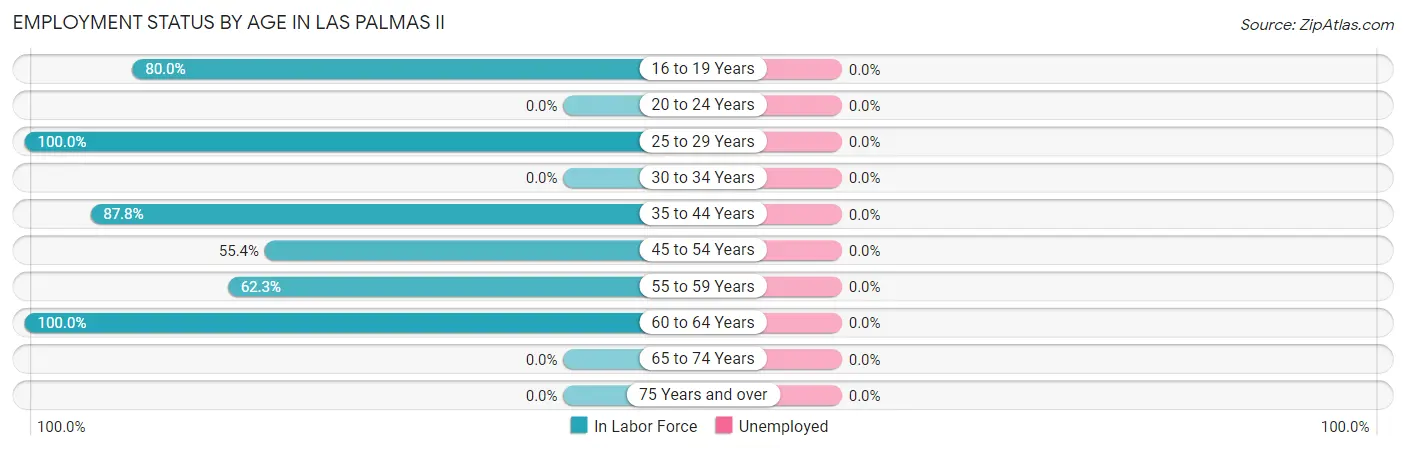
| Age Bracket | In Labor Force | Unemployed |
| 16 to 19 Years | 40 (80.0%) | 0 (0.0%) |
| 20 to 24 Years | 0 (0.0%) | 0 (0.0%) |
| 25 to 29 Years | 52 (100.0%) | 0 (0.0%) |
| 30 to 34 Years | 0 (0.0%) | 0 (0.0%) |
| 35 to 44 Years | 122 (87.8%) | 0 (0.0%) |
| 45 to 54 Years | 72 (55.4%) | 0 (0.0%) |
| 55 to 59 Years | 76 (62.3%) | 0 (0.0%) |
| 60 to 64 Years | 32 (100.0%) | 0 (0.0%) |
| 65 to 74 Years | 0 (0.0%) | 0 (0.0%) |
| 75 Years and over | 0 (0.0%) | 0 (0.0%) |
| Total | 394 (70.1%) | 0 (0.0%) |
Employment Status by Educational Attainment in Las Palmas II
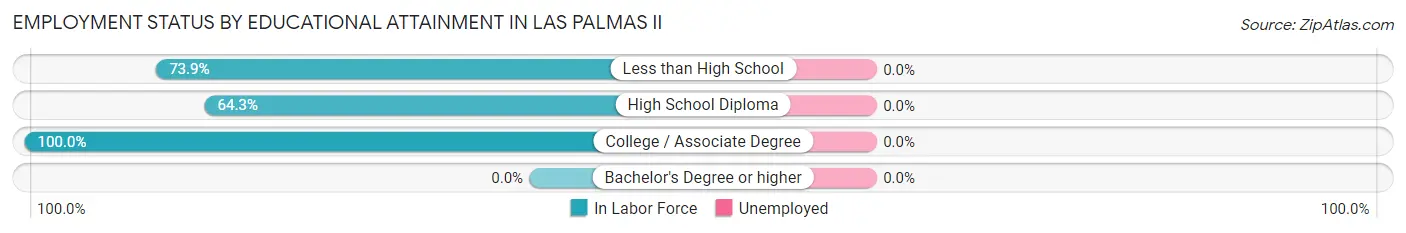
| Educational Attainment | In Labor Force | Unemployed |
| Less than High School | 130 (73.9%) | 0 (0.0%) |
| High School Diploma | 135 (64.3%) | 0 (0.0%) |
| College / Associate Degree | 89 (100.0%) | 0 (0.0%) |
| Bachelor's Degree or higher | 0 (0.0%) | 0 (0.0%) |
| Total | 354 (74.5%) | 0 (0.0%) |
Employment Occupations by Sex in Las Palmas II
Management, Business, Science and Arts Occupations
The most common Management, Business, Science and Arts occupations in Las Palmas II are Community & Social Service (46 | 11.7%), Education, Arts & Media (46 | 11.7%), and Management (22 | 5.6%).
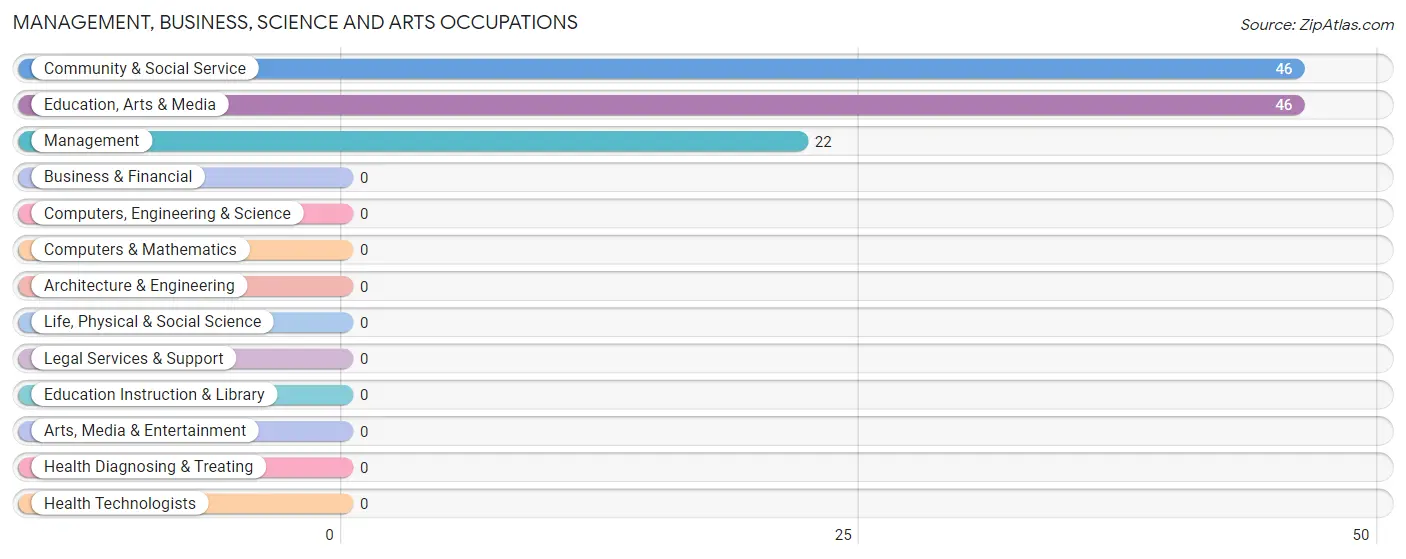
Management, Business, Science and Arts Occupations by Sex
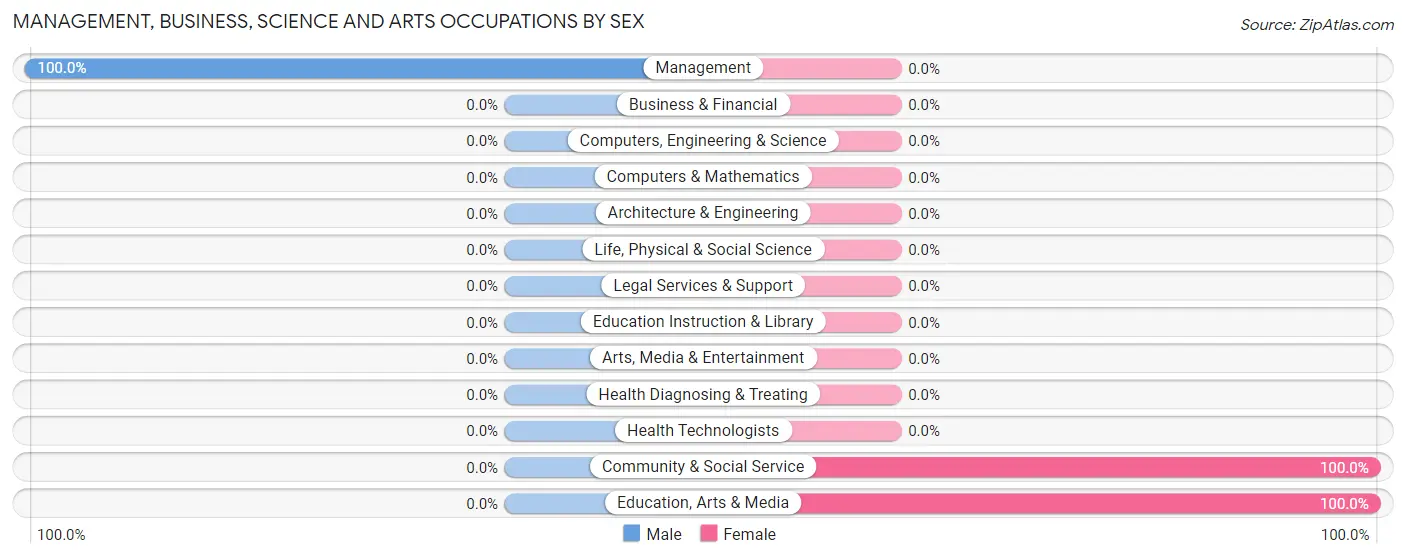
| Occupation | Male | Female |
| Management | 22 (100.0%) | 0 (0.0%) |
| Business & Financial | 0 (0.0%) | 0 (0.0%) |
| Computers, Engineering & Science | 0 (0.0%) | 0 (0.0%) |
| Computers & Mathematics | 0 (0.0%) | 0 (0.0%) |
| Architecture & Engineering | 0 (0.0%) | 0 (0.0%) |
| Life, Physical & Social Science | 0 (0.0%) | 0 (0.0%) |
| Community & Social Service | 0 (0.0%) | 46 (100.0%) |
| Education, Arts & Media | 0 (0.0%) | 46 (100.0%) |
| Legal Services & Support | 0 (0.0%) | 0 (0.0%) |
| Education Instruction & Library | 0 (0.0%) | 0 (0.0%) |
| Arts, Media & Entertainment | 0 (0.0%) | 0 (0.0%) |
| Health Diagnosing & Treating | 0 (0.0%) | 0 (0.0%) |
| Health Technologists | 0 (0.0%) | 0 (0.0%) |
| Total (Category) | 22 (32.4%) | 46 (67.6%) |
| Total (Overall) | 241 (61.2%) | 153 (38.8%) |
Services Occupations
The most common Services occupations in Las Palmas II are Personal Care & Service (52 | 13.2%), Healthcare Support (35 | 8.9%), and Cleaning & Maintenance (32 | 8.1%).
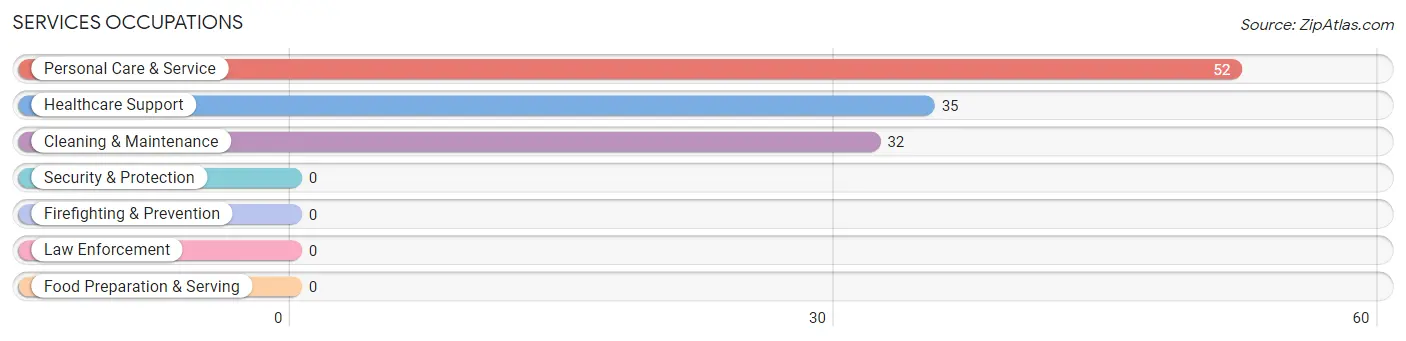
Services Occupations by Sex
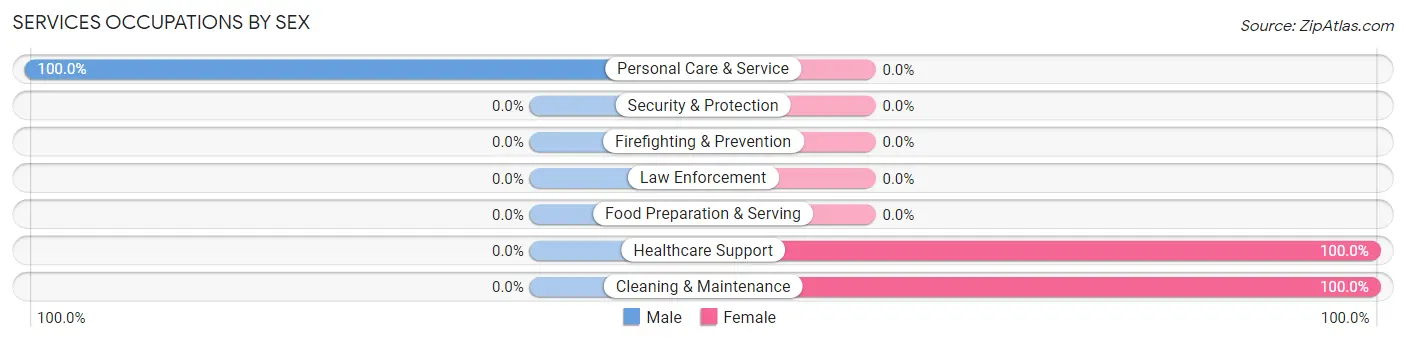
| Occupation | Male | Female |
| Healthcare Support | 0 (0.0%) | 35 (100.0%) |
| Security & Protection | 0 (0.0%) | 0 (0.0%) |
| Firefighting & Prevention | 0 (0.0%) | 0 (0.0%) |
| Law Enforcement | 0 (0.0%) | 0 (0.0%) |
| Food Preparation & Serving | 0 (0.0%) | 0 (0.0%) |
| Cleaning & Maintenance | 0 (0.0%) | 32 (100.0%) |
| Personal Care & Service | 52 (100.0%) | 0 (0.0%) |
| Total (Category) | 52 (43.7%) | 67 (56.3%) |
| Total (Overall) | 241 (61.2%) | 153 (38.8%) |
Sales and Office Occupations
The most common Sales and Office occupations in Las Palmas II are , and Sales & Related (79 | 20.1%).
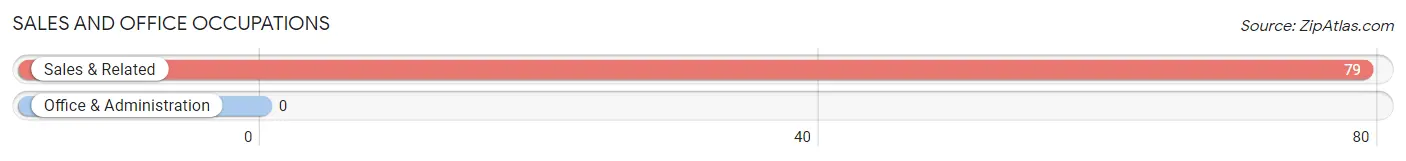
Sales and Office Occupations by Sex
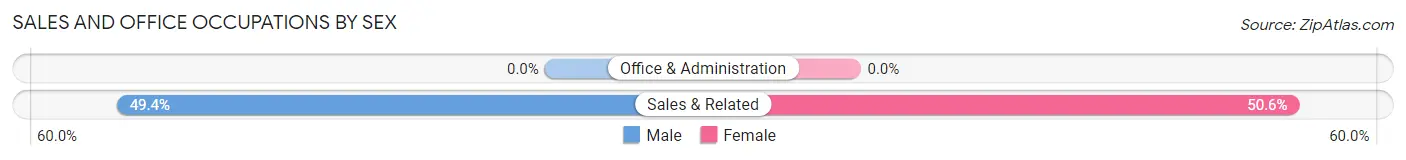
| Occupation | Male | Female |
| Sales & Related | 39 (49.4%) | 40 (50.6%) |
| Office & Administration | 0 (0.0%) | 0 (0.0%) |
| Total (Category) | 39 (49.4%) | 40 (50.6%) |
| Total (Overall) | 241 (61.2%) | 153 (38.8%) |
Natural Resources, Construction and Maintenance Occupations
The most common Natural Resources, Construction and Maintenance occupations in Las Palmas II are Installation, Maintenance & Repair (54 | 13.7%), and Construction & Extraction (37 | 9.4%).
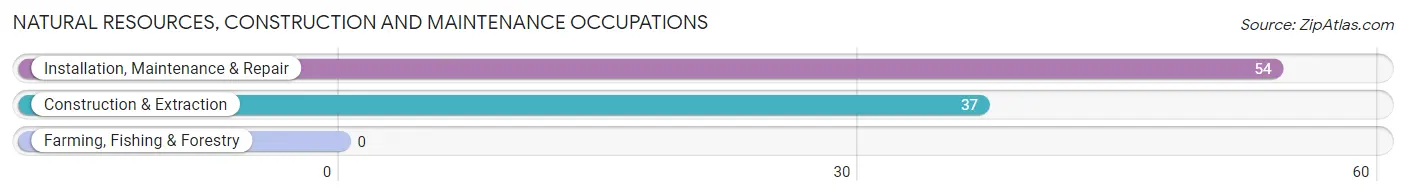
Natural Resources, Construction and Maintenance Occupations by Sex
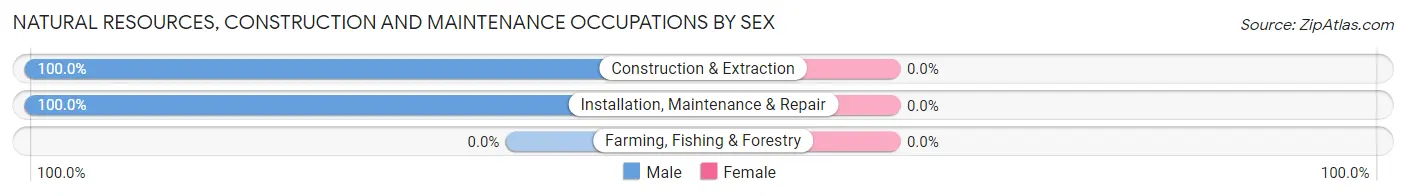
| Occupation | Male | Female |
| Farming, Fishing & Forestry | 0 (0.0%) | 0 (0.0%) |
| Construction & Extraction | 37 (100.0%) | 0 (0.0%) |
| Installation, Maintenance & Repair | 54 (100.0%) | 0 (0.0%) |
| Total (Category) | 91 (100.0%) | 0 (0.0%) |
| Total (Overall) | 241 (61.2%) | 153 (38.8%) |
Production, Transportation and Moving Occupations
The most common Production, Transportation and Moving occupations in Las Palmas II are , and Transportation (37 | 9.4%).
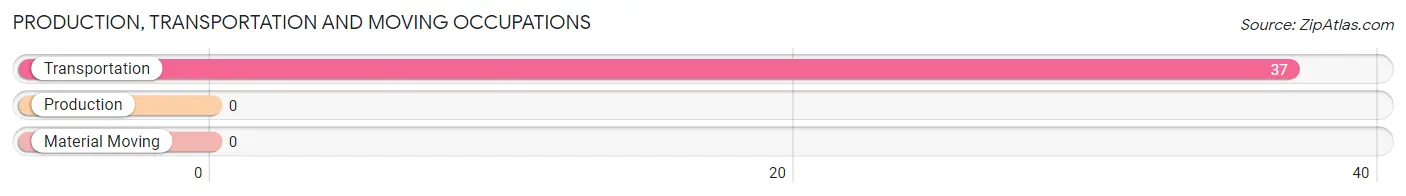
Production, Transportation and Moving Occupations by Sex
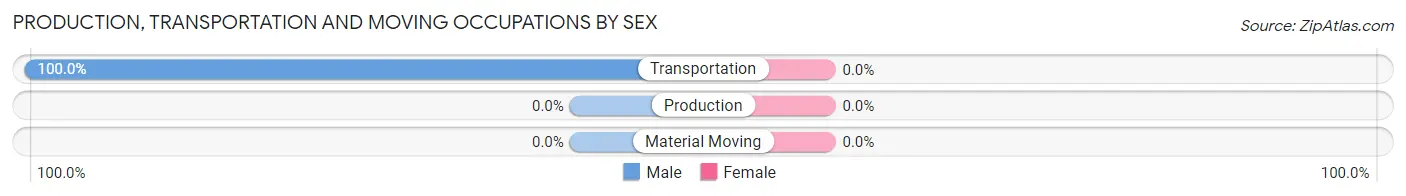
| Occupation | Male | Female |
| Production | 0 (0.0%) | 0 (0.0%) |
| Transportation | 37 (100.0%) | 0 (0.0%) |
| Material Moving | 0 (0.0%) | 0 (0.0%) |
| Total (Category) | 37 (100.0%) | 0 (0.0%) |
| Total (Overall) | 241 (61.2%) | 153 (38.8%) |
Employment Industries by Sex in Las Palmas II
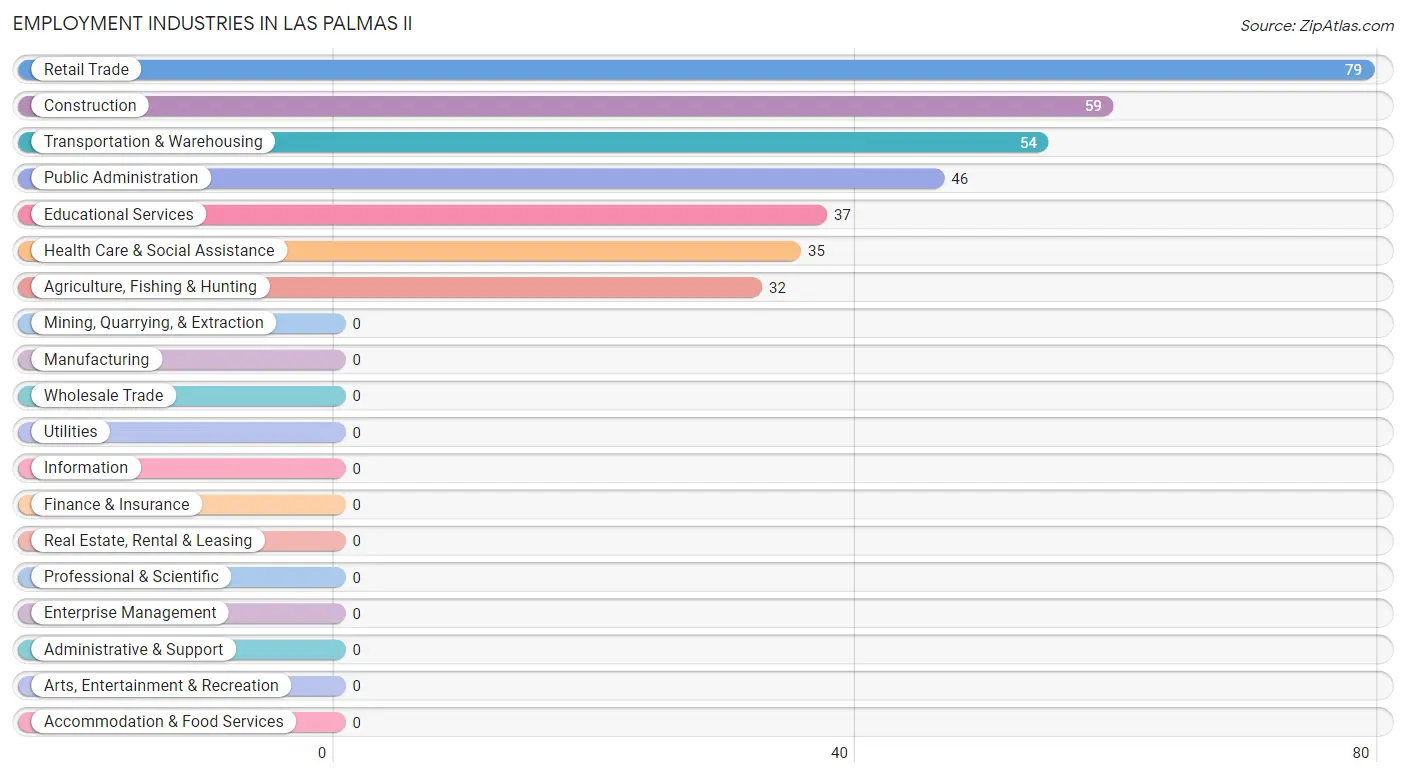
Employment Industries in Las Palmas II
The major employment industries in Las Palmas II include Retail Trade (79 | 20.1%), Construction (59 | 15.0%), Transportation & Warehousing (54 | 13.7%), Public Administration (46 | 11.7%), and Educational Services (37 | 9.4%).
Employment Industries by Sex in Las Palmas II
The Las Palmas II industries that see more men than women are Construction (100.0%), Transportation & Warehousing (100.0%), and Educational Services (100.0%), whereas the industries that tend to have a higher number of women are Agriculture, Fishing & Hunting (100.0%), Health Care & Social Assistance (100.0%), and Public Administration (100.0%).
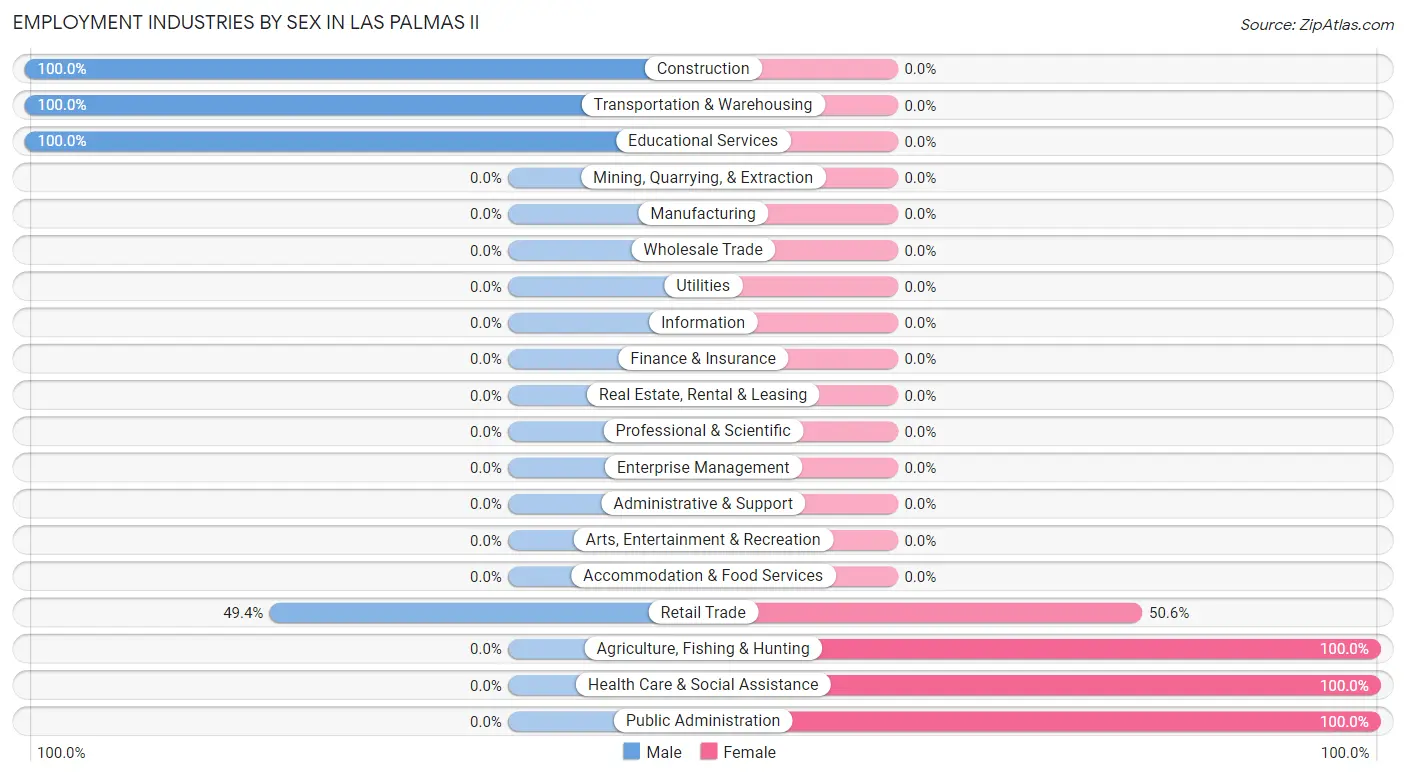
| Industry | Male | Female |
| Agriculture, Fishing & Hunting | 0 (0.0%) | 32 (100.0%) |
| Mining, Quarrying, & Extraction | 0 (0.0%) | 0 (0.0%) |
| Construction | 59 (100.0%) | 0 (0.0%) |
| Manufacturing | 0 (0.0%) | 0 (0.0%) |
| Wholesale Trade | 0 (0.0%) | 0 (0.0%) |
| Retail Trade | 39 (49.4%) | 40 (50.6%) |
| Transportation & Warehousing | 54 (100.0%) | 0 (0.0%) |
| Utilities | 0 (0.0%) | 0 (0.0%) |
| Information | 0 (0.0%) | 0 (0.0%) |
| Finance & Insurance | 0 (0.0%) | 0 (0.0%) |
| Real Estate, Rental & Leasing | 0 (0.0%) | 0 (0.0%) |
| Professional & Scientific | 0 (0.0%) | 0 (0.0%) |
| Enterprise Management | 0 (0.0%) | 0 (0.0%) |
| Administrative & Support | 0 (0.0%) | 0 (0.0%) |
| Educational Services | 37 (100.0%) | 0 (0.0%) |
| Health Care & Social Assistance | 0 (0.0%) | 35 (100.0%) |
| Arts, Entertainment & Recreation | 0 (0.0%) | 0 (0.0%) |
| Accommodation & Food Services | 0 (0.0%) | 0 (0.0%) |
| Public Administration | 0 (0.0%) | 46 (100.0%) |
| Total | 241 (61.2%) | 153 (38.8%) |
Education in Las Palmas II
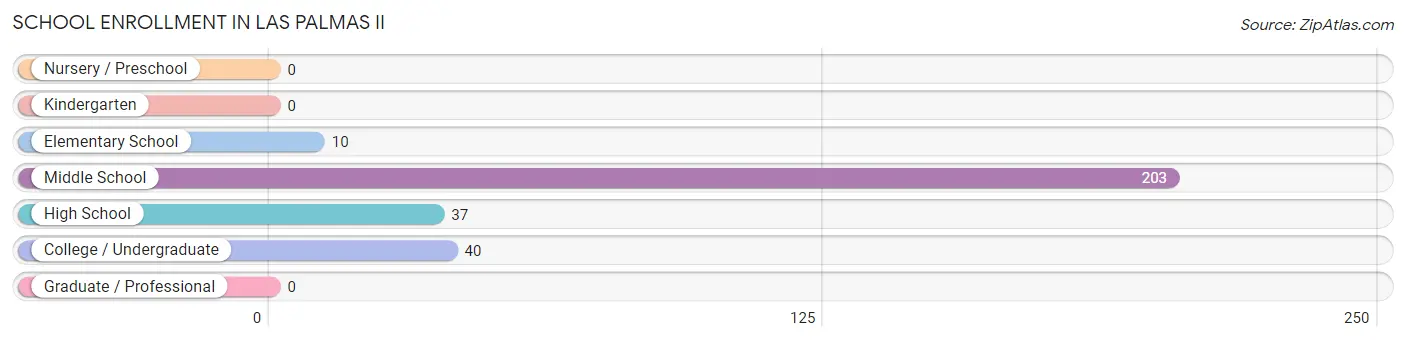
School Enrollment in Las Palmas II
The most common levels of schooling among the 290 students in Las Palmas II are middle school (203 | 70.0%), college / undergraduate (40 | 13.8%), and high school (37 | 12.8%).
| School Level | # Students | % Students |
| Nursery / Preschool | 0 | 0.0% |
| Kindergarten | 0 | 0.0% |
| Elementary School | 10 | 3.5% |
| Middle School | 203 | 70.0% |
| High School | 37 | 12.8% |
| College / Undergraduate | 40 | 13.8% |
| Graduate / Professional | 0 | 0.0% |
| Total | 290 | 100.0% |
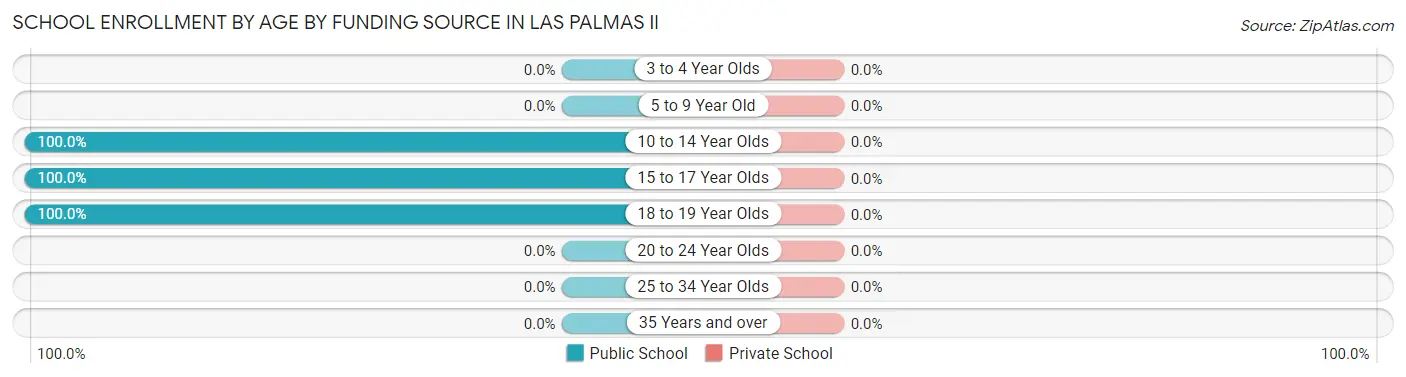
School Enrollment by Age by Funding Source in Las Palmas II
| Age Bracket | Public School | Private School |
| 3 to 4 Year Olds | 0 (0.0%) | 0 (0.0%) |
| 5 to 9 Year Old | 0 (0.0%) | 0 (0.0%) |
| 10 to 14 Year Olds | 183 (100.0%) | 0 (0.0%) |
| 15 to 17 Year Olds | 57 (100.0%) | 0 (0.0%) |
| 18 to 19 Year Olds | 50 (100.0%) | 0 (0.0%) |
| 20 to 24 Year Olds | 0 (0.0%) | 0 (0.0%) |
| 25 to 34 Year Olds | 0 (0.0%) | 0 (0.0%) |
| 35 Years and over | 0 (0.0%) | 0 (0.0%) |
| Total | 290 (100.0%) | 0 (0.0%) |
Educational Attainment by Field of Study in Las Palmas II
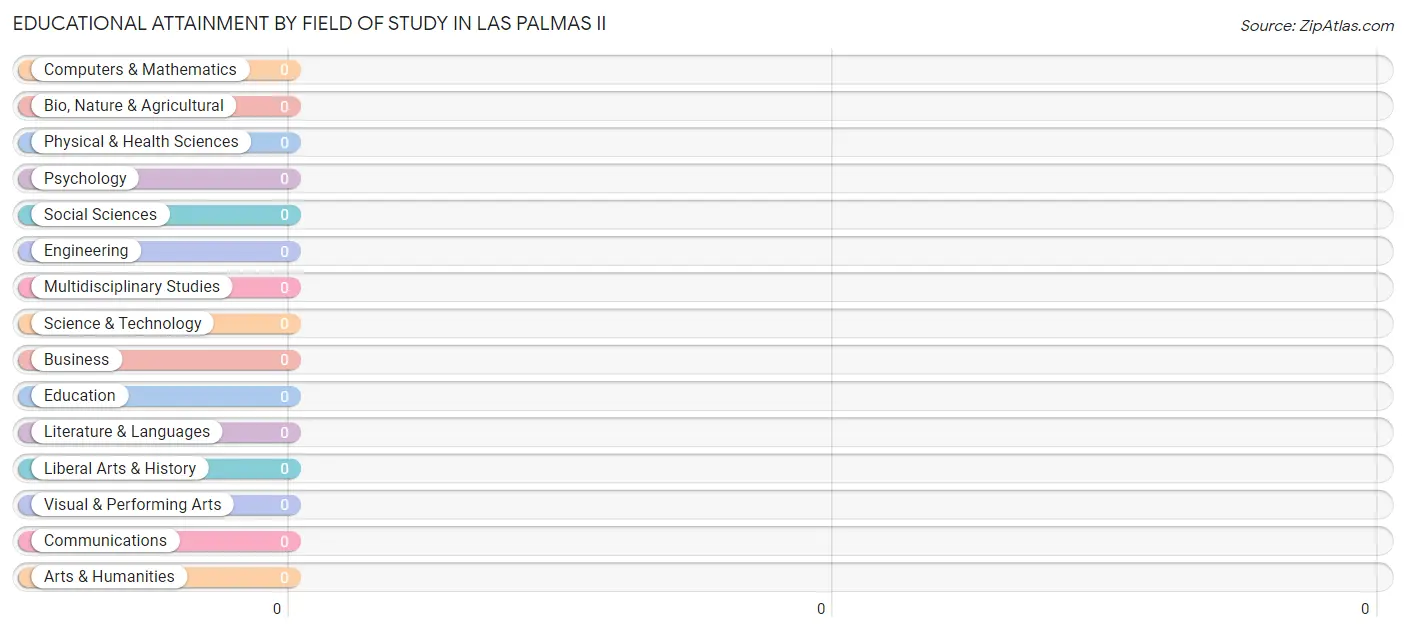
| Field of Study | # Graduates | % Graduates |
| Computers & Mathematics | 0 | 0.0% |
| Bio, Nature & Agricultural | 0 | 0.0% |
| Physical & Health Sciences | 0 | 0.0% |
| Psychology | 0 | 0.0% |
| Social Sciences | 0 | 0.0% |
| Engineering | 0 | 0.0% |
| Multidisciplinary Studies | 0 | 0.0% |
| Science & Technology | 0 | 0.0% |
| Business | 0 | 0.0% |
| Education | 0 | 0.0% |
| Literature & Languages | 0 | 0.0% |
| Liberal Arts & History | 0 | 0.0% |
| Visual & Performing Arts | 0 | 0.0% |
| Communications | 0 | 0.0% |
| Arts & Humanities | 0 | 0.0% |
| Total | 0 | 0.0% |
Transportation & Commute in Las Palmas II
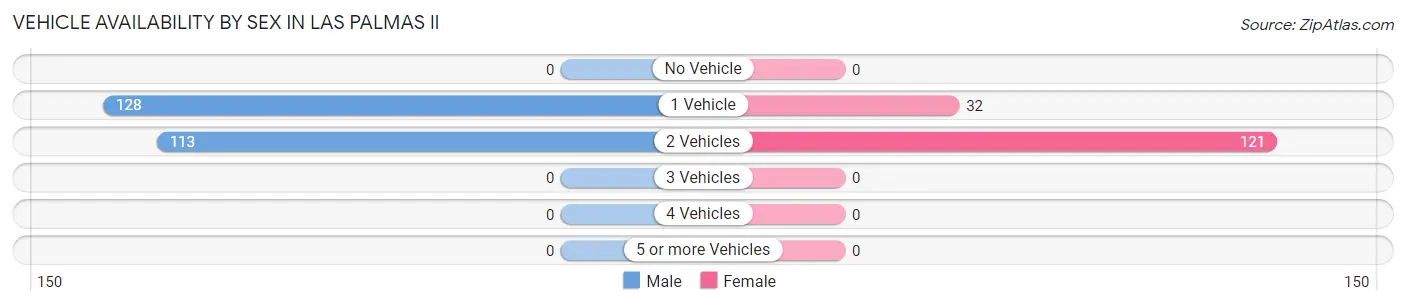
Vehicle Availability by Sex in Las Palmas II
The most prevalent vehicle ownership categories in Las Palmas II are males with 1 vehicle (128, accounting for 53.1%) and females with 1 vehicle (32, making up 83.7%).
| Vehicles Available | Male | Female |
| No Vehicle | 0 (0.0%) | 0 (0.0%) |
| 1 Vehicle | 128 (53.1%) | 32 (20.9%) |
| 2 Vehicles | 113 (46.9%) | 121 (79.1%) |
| 3 Vehicles | 0 (0.0%) | 0 (0.0%) |
| 4 Vehicles | 0 (0.0%) | 0 (0.0%) |
| 5 or more Vehicles | 0 (0.0%) | 0 (0.0%) |
| Total | 241 (100.0%) | 153 (100.0%) |
Commute Time in Las Palmas II
The most frequently occuring commute durations in Las Palmas II are 5 to 9 minutes (143 commuters, 41.8%), 15 to 19 minutes (54 commuters, 15.8%), and 45 to 59 minutes (46 commuters, 13.5%).
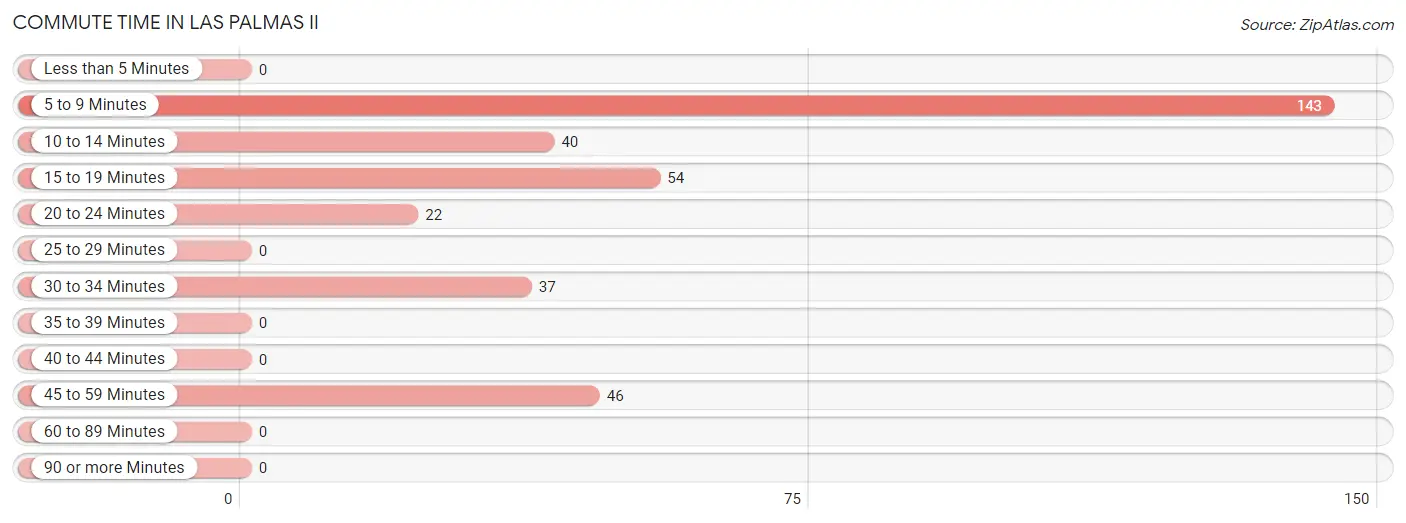
| Commute Time | # Commuters | % Commuters |
| Less than 5 Minutes | 0 | 0.0% |
| 5 to 9 Minutes | 143 | 41.8% |
| 10 to 14 Minutes | 40 | 11.7% |
| 15 to 19 Minutes | 54 | 15.8% |
| 20 to 24 Minutes | 22 | 6.4% |
| 25 to 29 Minutes | 0 | 0.0% |
| 30 to 34 Minutes | 37 | 10.8% |
| 35 to 39 Minutes | 0 | 0.0% |
| 40 to 44 Minutes | 0 | 0.0% |
| 45 to 59 Minutes | 46 | 13.5% |
| 60 to 89 Minutes | 0 | 0.0% |
| 90 or more Minutes | 0 | 0.0% |
Commute Time by Sex in Las Palmas II
The most common commute times in Las Palmas II are 5 to 9 minutes (76 commuters, 40.2%) for males and 5 to 9 minutes (67 commuters, 43.8%) for females.
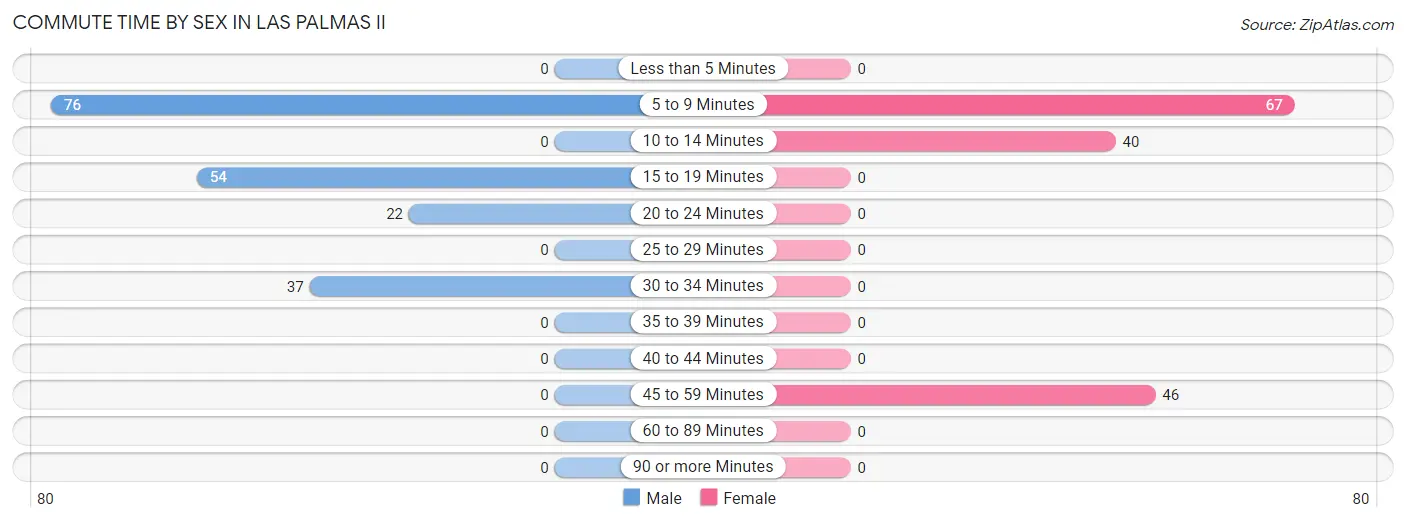
| Commute Time | Male | Female |
| Less than 5 Minutes | 0 (0.0%) | 0 (0.0%) |
| 5 to 9 Minutes | 76 (40.2%) | 67 (43.8%) |
| 10 to 14 Minutes | 0 (0.0%) | 40 (26.1%) |
| 15 to 19 Minutes | 54 (28.6%) | 0 (0.0%) |
| 20 to 24 Minutes | 22 (11.6%) | 0 (0.0%) |
| 25 to 29 Minutes | 0 (0.0%) | 0 (0.0%) |
| 30 to 34 Minutes | 37 (19.6%) | 0 (0.0%) |
| 35 to 39 Minutes | 0 (0.0%) | 0 (0.0%) |
| 40 to 44 Minutes | 0 (0.0%) | 0 (0.0%) |
| 45 to 59 Minutes | 0 (0.0%) | 46 (30.1%) |
| 60 to 89 Minutes | 0 (0.0%) | 0 (0.0%) |
| 90 or more Minutes | 0 (0.0%) | 0 (0.0%) |
Time of Departure to Work by Sex in Las Palmas II
The most frequent times of departure to work in Las Palmas II are 7:00 AM to 7:29 AM (59, 31.2%) for males and 7:00 AM to 7:29 AM (75, 49.0%) for females.
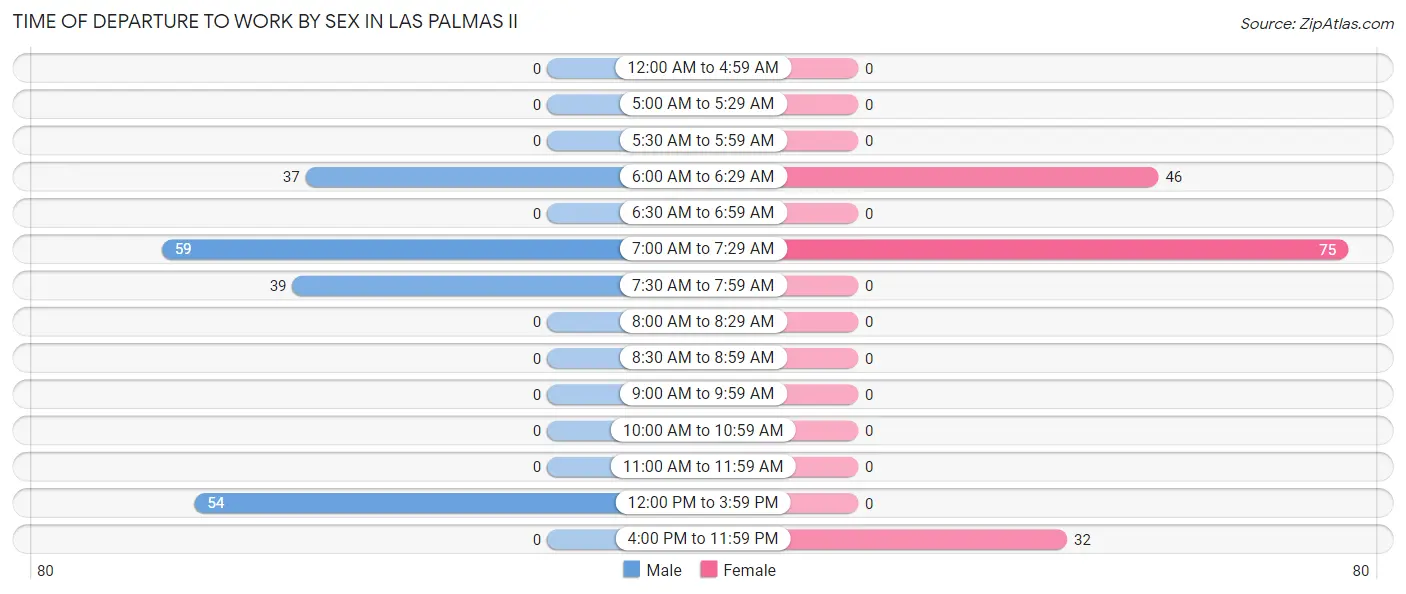
| Time of Departure | Male | Female |
| 12:00 AM to 4:59 AM | 0 (0.0%) | 0 (0.0%) |
| 5:00 AM to 5:29 AM | 0 (0.0%) | 0 (0.0%) |
| 5:30 AM to 5:59 AM | 0 (0.0%) | 0 (0.0%) |
| 6:00 AM to 6:29 AM | 37 (19.6%) | 46 (30.1%) |
| 6:30 AM to 6:59 AM | 0 (0.0%) | 0 (0.0%) |
| 7:00 AM to 7:29 AM | 59 (31.2%) | 75 (49.0%) |
| 7:30 AM to 7:59 AM | 39 (20.6%) | 0 (0.0%) |
| 8:00 AM to 8:29 AM | 0 (0.0%) | 0 (0.0%) |
| 8:30 AM to 8:59 AM | 0 (0.0%) | 0 (0.0%) |
| 9:00 AM to 9:59 AM | 0 (0.0%) | 0 (0.0%) |
| 10:00 AM to 10:59 AM | 0 (0.0%) | 0 (0.0%) |
| 11:00 AM to 11:59 AM | 0 (0.0%) | 0 (0.0%) |
| 12:00 PM to 3:59 PM | 54 (28.6%) | 0 (0.0%) |
| 4:00 PM to 11:59 PM | 0 (0.0%) | 32 (20.9%) |
| Total | 189 (100.0%) | 153 (100.0%) |
Housing Occupancy in Las Palmas II
Occupancy by Ownership in Las Palmas II
Of the total 323 dwellings in Las Palmas II, owner-occupied units account for 135 (41.8%), while renter-occupied units make up 188 (58.2%).
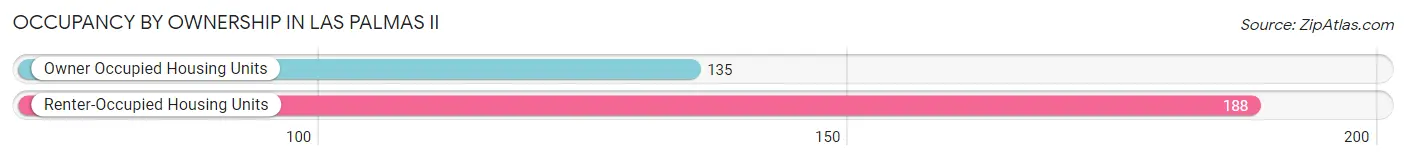
| Occupancy | # Housing Units | % Housing Units |
| Owner Occupied Housing Units | 135 | 41.8% |
| Renter-Occupied Housing Units | 188 | 58.2% |
| Total Occupied Housing Units | 323 | 100.0% |
Occupancy by Household Size in Las Palmas II
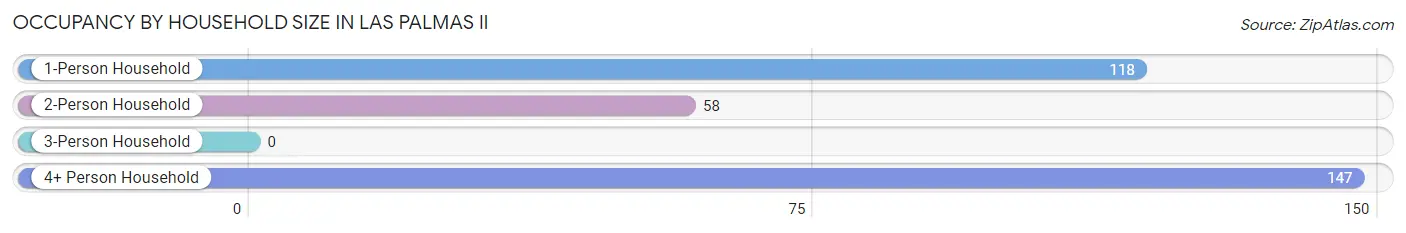
| Household Size | # Housing Units | % Housing Units |
| 1-Person Household | 118 | 36.5% |
| 2-Person Household | 58 | 18.0% |
| 3-Person Household | 0 | 0.0% |
| 4+ Person Household | 147 | 45.5% |
| Total Housing Units | 323 | 100.0% |
Occupancy by Ownership by Household Size in Las Palmas II
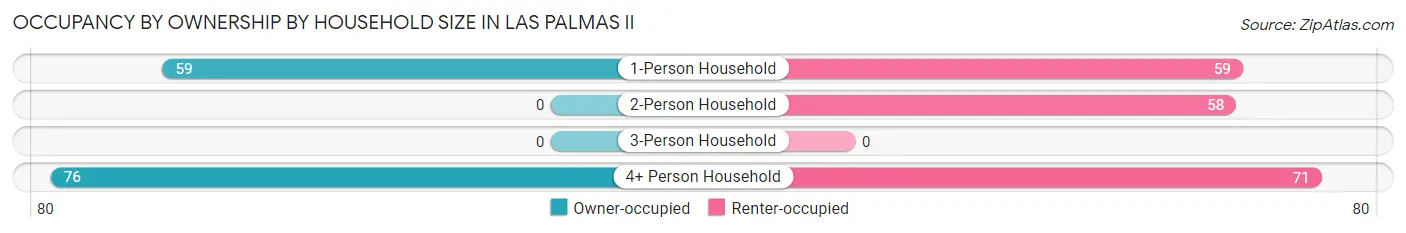
| Household Size | Owner-occupied | Renter-occupied |
| 1-Person Household | 59 (50.0%) | 59 (50.0%) |
| 2-Person Household | 0 (0.0%) | 58 (100.0%) |
| 3-Person Household | 0 (0.0%) | 0 (0.0%) |
| 4+ Person Household | 76 (51.7%) | 71 (48.3%) |
| Total Housing Units | 135 (41.8%) | 188 (58.2%) |
Occupancy by Educational Attainment in Las Palmas II
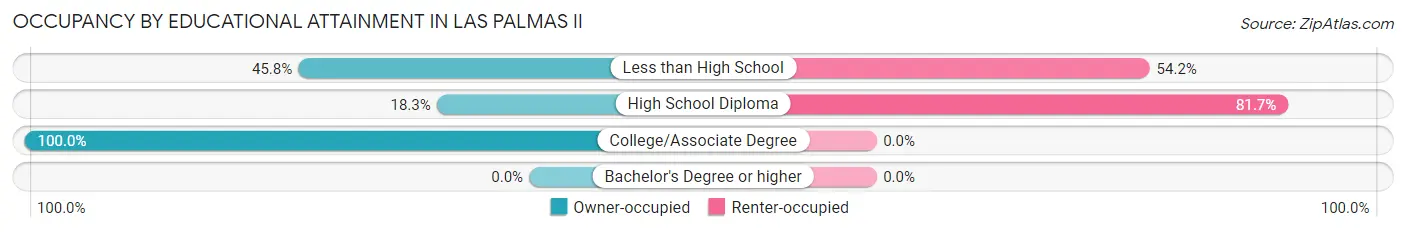
| Household Size | Owner-occupied | Renter-occupied |
| Less than High School | 76 (45.8%) | 90 (54.2%) |
| High School Diploma | 22 (18.3%) | 98 (81.7%) |
| College/Associate Degree | 37 (100.0%) | 0 (0.0%) |
| Bachelor's Degree or higher | 0 (0.0%) | 0 (0.0%) |
Occupancy by Age of Householder in Las Palmas II
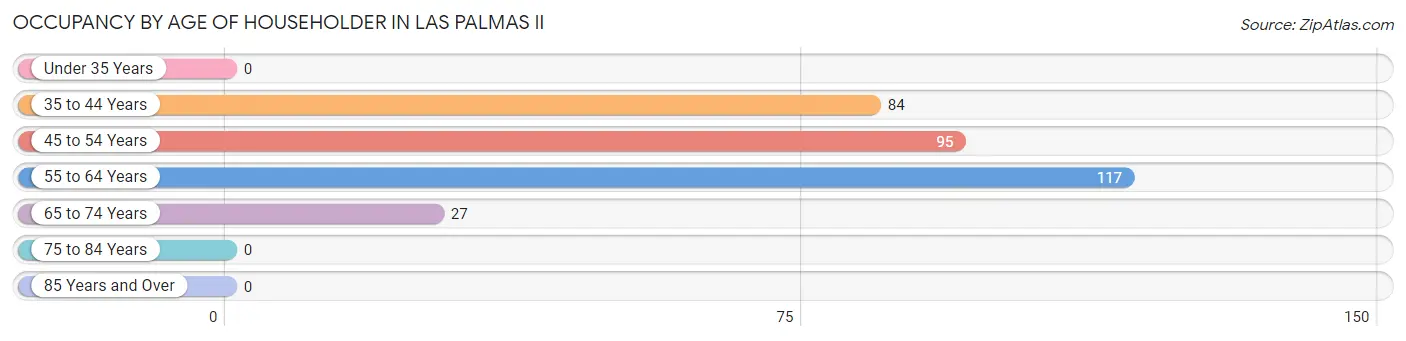
| Age Bracket | # Households | % Households |
| Under 35 Years | 0 | 0.0% |
| 35 to 44 Years | 84 | 26.0% |
| 45 to 54 Years | 95 | 29.4% |
| 55 to 64 Years | 117 | 36.2% |
| 65 to 74 Years | 27 | 8.4% |
| 75 to 84 Years | 0 | 0.0% |
| 85 Years and Over | 0 | 0.0% |
| Total | 323 | 100.0% |
Housing Finances in Las Palmas II
Median Income by Occupancy in Las Palmas II
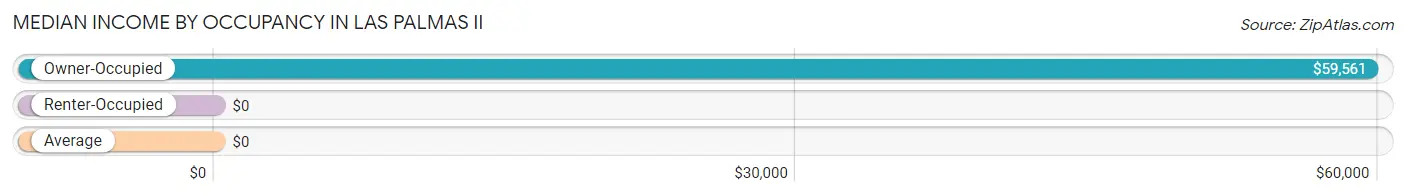
| Occupancy Type | # Households | Median Income |
| Owner-Occupied | 135 (41.8%) | $59,561 |
| Renter-Occupied | 188 (58.2%) | $0 |
| Average | 323 (100.0%) | $0 |
Occupancy by Householder Income Bracket in Las Palmas II
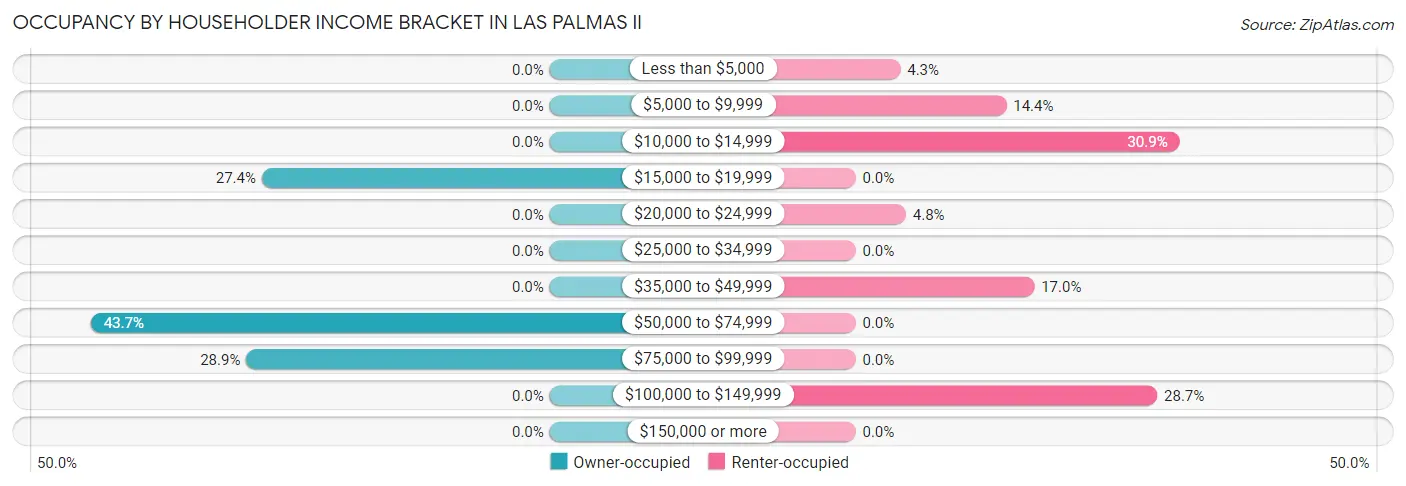
| Income Bracket | Owner-occupied | Renter-occupied |
| Less than $5,000 | 0 (0.0%) | 8 (4.3%) |
| $5,000 to $9,999 | 0 (0.0%) | 27 (14.4%) |
| $10,000 to $14,999 | 0 (0.0%) | 58 (30.8%) |
| $15,000 to $19,999 | 37 (27.4%) | 0 (0.0%) |
| $20,000 to $24,999 | 0 (0.0%) | 9 (4.8%) |
| $25,000 to $34,999 | 0 (0.0%) | 0 (0.0%) |
| $35,000 to $49,999 | 0 (0.0%) | 32 (17.0%) |
| $50,000 to $74,999 | 59 (43.7%) | 0 (0.0%) |
| $75,000 to $99,999 | 39 (28.9%) | 0 (0.0%) |
| $100,000 to $149,999 | 0 (0.0%) | 54 (28.7%) |
| $150,000 or more | 0 (0.0%) | 0 (0.0%) |
| Total | 135 (100.0%) | 188 (100.0%) |
Monthly Housing Cost Tiers in Las Palmas II
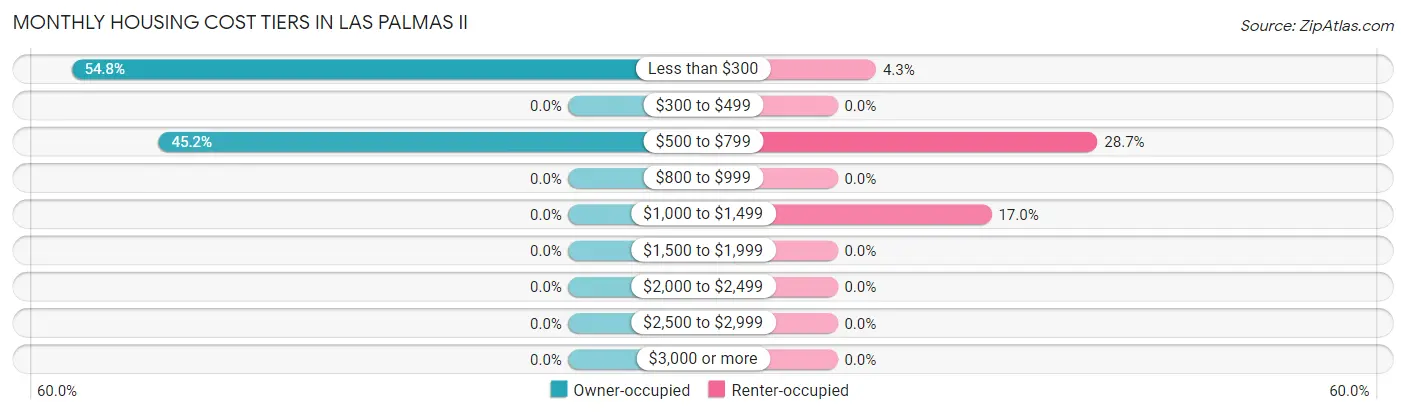
| Monthly Cost | Owner-occupied | Renter-occupied |
| Less than $300 | 74 (54.8%) | 8 (4.3%) |
| $300 to $499 | 0 (0.0%) | 0 (0.0%) |
| $500 to $799 | 61 (45.2%) | 54 (28.7%) |
| $800 to $999 | 0 (0.0%) | 0 (0.0%) |
| $1,000 to $1,499 | 0 (0.0%) | 32 (17.0%) |
| $1,500 to $1,999 | 0 (0.0%) | 0 (0.0%) |
| $2,000 to $2,499 | 0 (0.0%) | 0 (0.0%) |
| $2,500 to $2,999 | 0 (0.0%) | 0 (0.0%) |
| $3,000 or more | 0 (0.0%) | 0 (0.0%) |
| Total | 135 (100.0%) | 188 (100.0%) |
Physical Housing Characteristics in Las Palmas II
Housing Structures in Las Palmas II
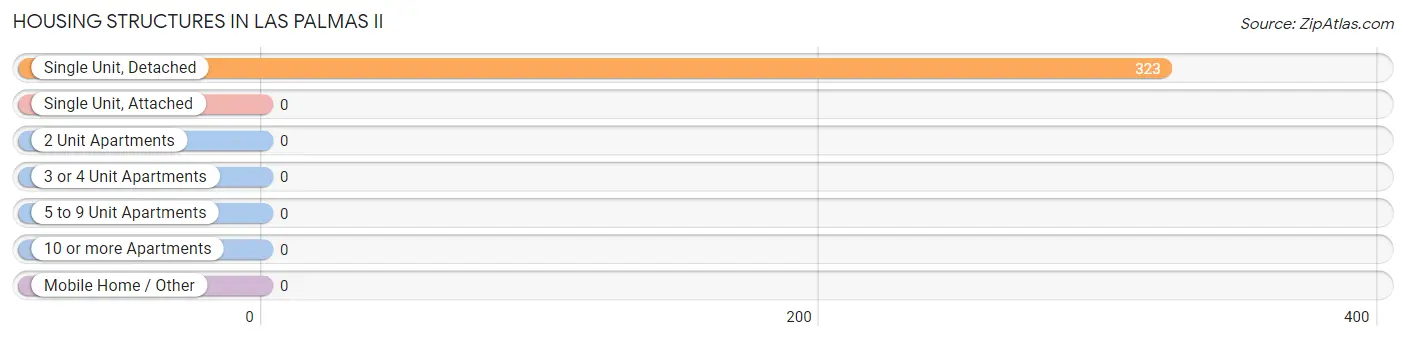
| Structure Type | # Housing Units | % Housing Units |
| Single Unit, Detached | 323 | 100.0% |
| Single Unit, Attached | 0 | 0.0% |
| 2 Unit Apartments | 0 | 0.0% |
| 3 or 4 Unit Apartments | 0 | 0.0% |
| 5 to 9 Unit Apartments | 0 | 0.0% |
| 10 or more Apartments | 0 | 0.0% |
| Mobile Home / Other | 0 | 0.0% |
| Total | 323 | 100.0% |
Housing Structures by Occupancy in Las Palmas II
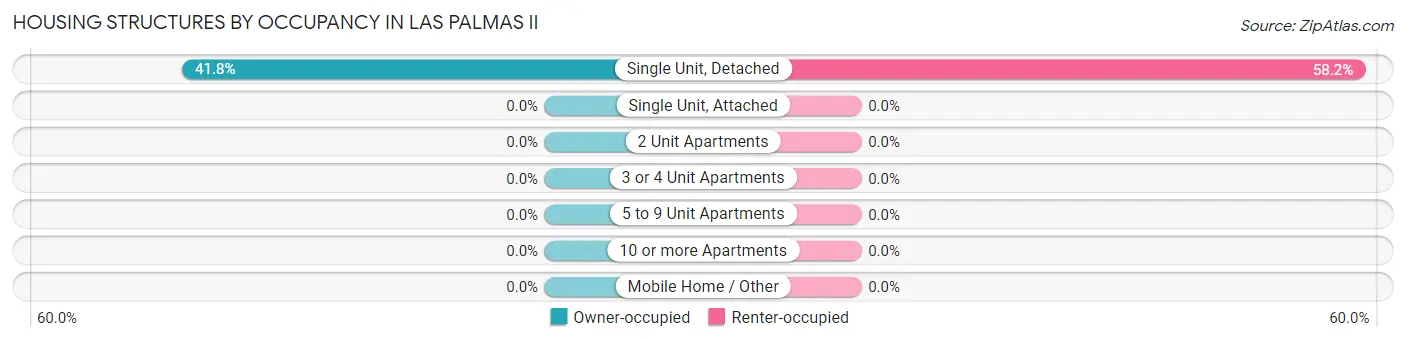
| Structure Type | Owner-occupied | Renter-occupied |
| Single Unit, Detached | 135 (41.8%) | 188 (58.2%) |
| Single Unit, Attached | 0 (0.0%) | 0 (0.0%) |
| 2 Unit Apartments | 0 (0.0%) | 0 (0.0%) |
| 3 or 4 Unit Apartments | 0 (0.0%) | 0 (0.0%) |
| 5 to 9 Unit Apartments | 0 (0.0%) | 0 (0.0%) |
| 10 or more Apartments | 0 (0.0%) | 0 (0.0%) |
| Mobile Home / Other | 0 (0.0%) | 0 (0.0%) |
| Total | 135 (41.8%) | 188 (58.2%) |
Housing Structures by Number of Rooms in Las Palmas II
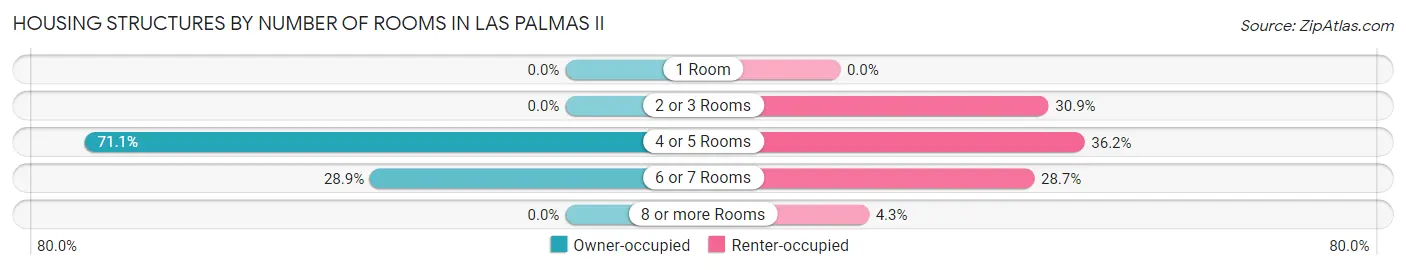
| Number of Rooms | Owner-occupied | Renter-occupied |
| 1 Room | 0 (0.0%) | 0 (0.0%) |
| 2 or 3 Rooms | 0 (0.0%) | 58 (30.8%) |
| 4 or 5 Rooms | 96 (71.1%) | 68 (36.2%) |
| 6 or 7 Rooms | 39 (28.9%) | 54 (28.7%) |
| 8 or more Rooms | 0 (0.0%) | 8 (4.3%) |
| Total | 135 (100.0%) | 188 (100.0%) |
Housing Structure by Heating Type in Las Palmas II
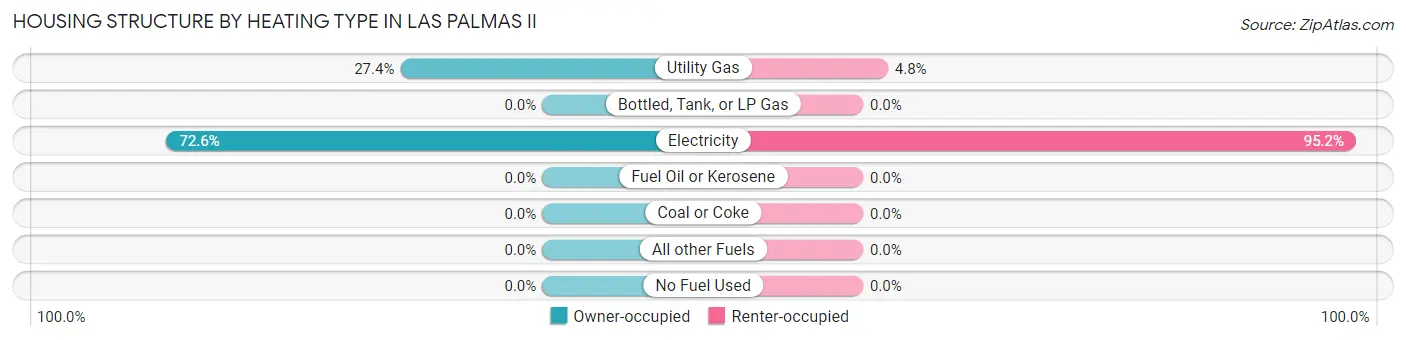
| Heating Type | Owner-occupied | Renter-occupied |
| Utility Gas | 37 (27.4%) | 9 (4.8%) |
| Bottled, Tank, or LP Gas | 0 (0.0%) | 0 (0.0%) |
| Electricity | 98 (72.6%) | 179 (95.2%) |
| Fuel Oil or Kerosene | 0 (0.0%) | 0 (0.0%) |
| Coal or Coke | 0 (0.0%) | 0 (0.0%) |
| All other Fuels | 0 (0.0%) | 0 (0.0%) |
| No Fuel Used | 0 (0.0%) | 0 (0.0%) |
| Total | 135 (100.0%) | 188 (100.0%) |
Household Vehicle Usage in Las Palmas II
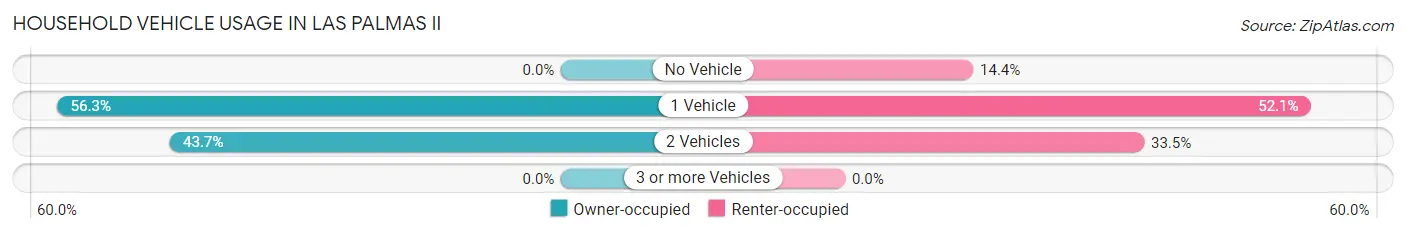
| Vehicles per Household | Owner-occupied | Renter-occupied |
| No Vehicle | 0 (0.0%) | 27 (14.4%) |
| 1 Vehicle | 76 (56.3%) | 98 (52.1%) |
| 2 Vehicles | 59 (43.7%) | 63 (33.5%) |
| 3 or more Vehicles | 0 (0.0%) | 0 (0.0%) |
| Total | 135 (100.0%) | 188 (100.0%) |
Real Estate & Mortgages in Las Palmas II
Real Estate and Mortgage Overview in Las Palmas II
| Characteristic | Without Mortgage | With Mortgage |
| Housing Units | 135 | 0 |
| Median Property Value | - | - |
| Median Household Income | $59,561 | $0 |
| Monthly Housing Costs | - | - |
| Real Estate Taxes | - | - |
Property Value by Mortgage Status in Las Palmas II
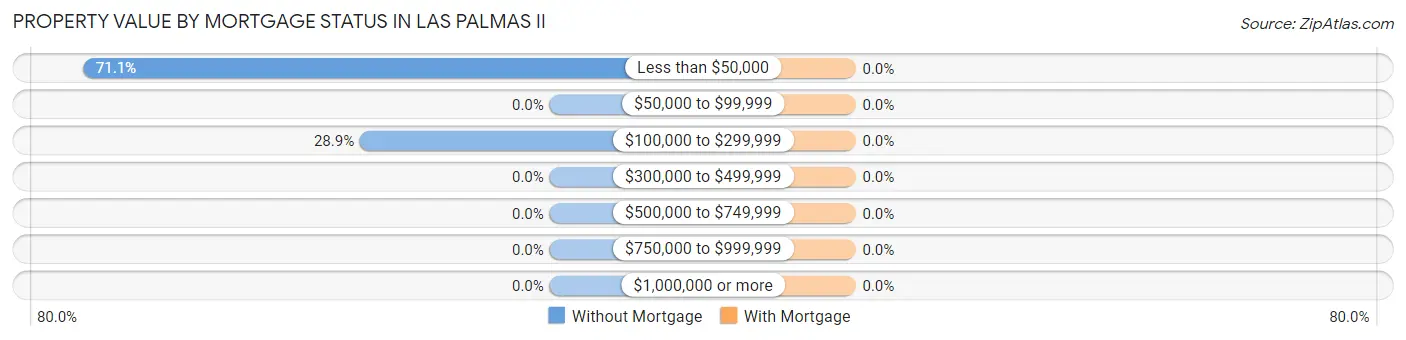
| Property Value | Without Mortgage | With Mortgage |
| Less than $50,000 | 96 (71.1%) | 0 (0.0%) |
| $50,000 to $99,999 | 0 (0.0%) | 0 (0.0%) |
| $100,000 to $299,999 | 39 (28.9%) | 0 (0.0%) |
| $300,000 to $499,999 | 0 (0.0%) | 0 (0.0%) |
| $500,000 to $749,999 | 0 (0.0%) | 0 (0.0%) |
| $750,000 to $999,999 | 0 (0.0%) | 0 (0.0%) |
| $1,000,000 or more | 0 (0.0%) | 0 (0.0%) |
| Total | 135 (100.0%) | 0 (0.0%) |
Household Income by Mortgage Status in Las Palmas II
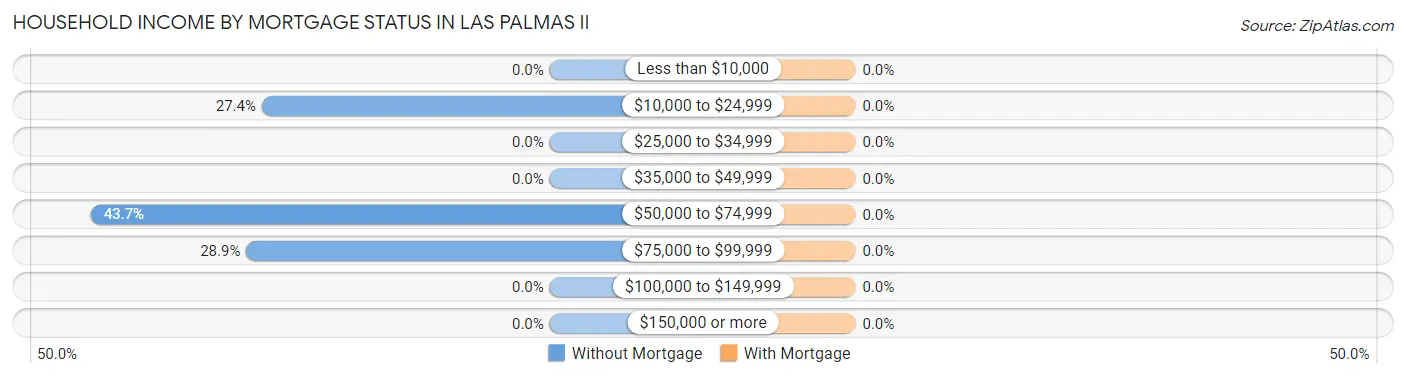
| Household Income | Without Mortgage | With Mortgage |
| Less than $10,000 | 0 (0.0%) | 0 (0.0%) |
| $10,000 to $24,999 | 37 (27.4%) | 0 (0.0%) |
| $25,000 to $34,999 | 0 (0.0%) | 0 (0.0%) |
| $35,000 to $49,999 | 0 (0.0%) | 0 (0.0%) |
| $50,000 to $74,999 | 59 (43.7%) | 0 (0.0%) |
| $75,000 to $99,999 | 39 (28.9%) | 0 (0.0%) |
| $100,000 to $149,999 | 0 (0.0%) | 0 (0.0%) |
| $150,000 or more | 0 (0.0%) | 0 (0.0%) |
| Total | 135 (100.0%) | 0 (0.0%) |
Property Value to Household Income Ratio in Las Palmas II
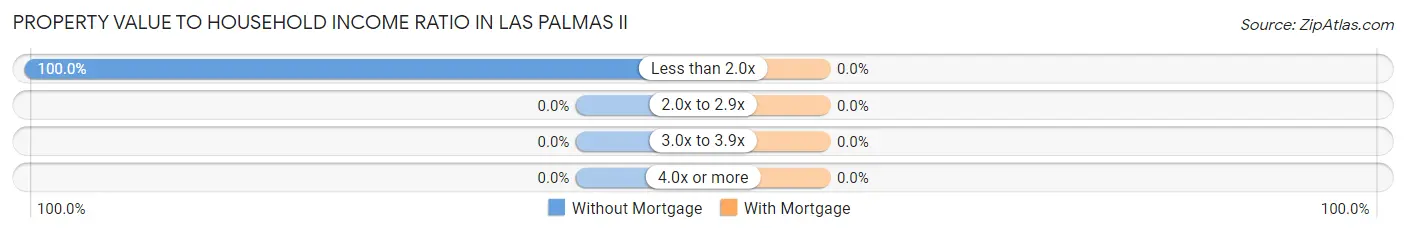
| Value-to-Income Ratio | Without Mortgage | With Mortgage |
| Less than 2.0x | 135 (100.0%) | 0 (0.0%) |
| 2.0x to 2.9x | 0 (0.0%) | 0 (0.0%) |
| 3.0x to 3.9x | 0 (0.0%) | 0 (0.0%) |
| 4.0x or more | 0 (0.0%) | 0 (0.0%) |
| Total | 135 (100.0%) | 0 (0.0%) |
Real Estate Taxes by Mortgage Status in Las Palmas II
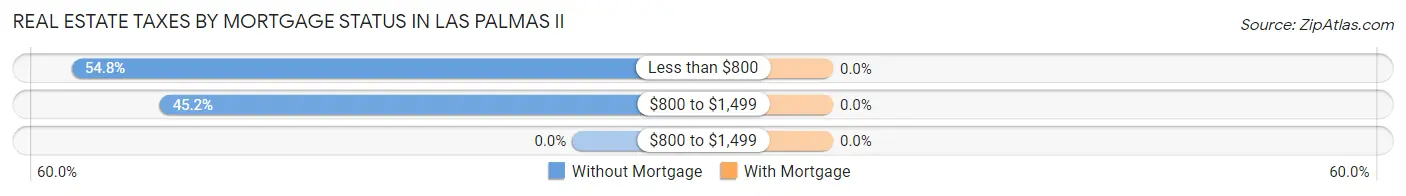
| Property Taxes | Without Mortgage | With Mortgage |
| Less than $800 | 74 (54.8%) | 0 (0.0%) |
| $800 to $1,499 | 61 (45.2%) | 0 (0.0%) |
| $800 to $1,499 | 0 (0.0%) | 0 (0.0%) |
| Total | 135 (100.0%) | 0 (0.0%) |
Health & Disability in Las Palmas II
Health Insurance Coverage by Age in Las Palmas II
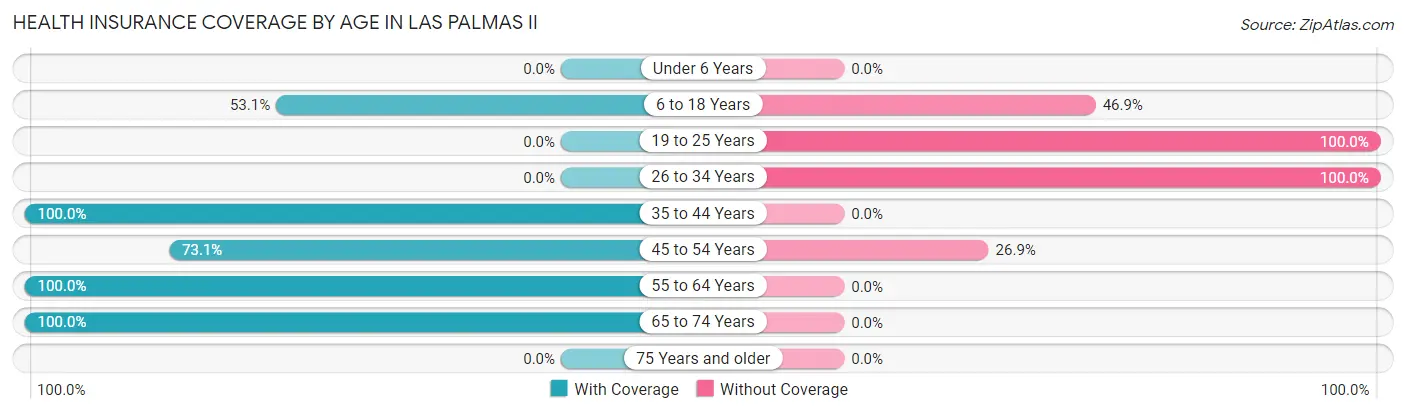
| Age Bracket | With Coverage | Without Coverage |
| Under 6 Years | 0 (0.0%) | 0 (0.0%) |
| 6 to 18 Years | 153 (53.1%) | 135 (46.9%) |
| 19 to 25 Years | 0 (0.0%) | 60 (100.0%) |
| 26 to 34 Years | 0 (0.0%) | 52 (100.0%) |
| 35 to 44 Years | 139 (100.0%) | 0 (0.0%) |
| 45 to 54 Years | 95 (73.1%) | 35 (26.9%) |
| 55 to 64 Years | 154 (100.0%) | 0 (0.0%) |
| 65 to 74 Years | 27 (100.0%) | 0 (0.0%) |
| 75 Years and older | 0 (0.0%) | 0 (0.0%) |
| Total | 568 (66.8%) | 282 (33.2%) |
Health Insurance Coverage by Citizenship Status in Las Palmas II

| Citizenship Status | With Coverage | Without Coverage |
| Native Born | 0 (0.0%) | 0 (0.0%) |
| Foreign Born, Citizen | 153 (53.1%) | 135 (46.9%) |
| Foreign Born, not a Citizen | 0 (0.0%) | 60 (100.0%) |
Health Insurance Coverage by Household Income in Las Palmas II
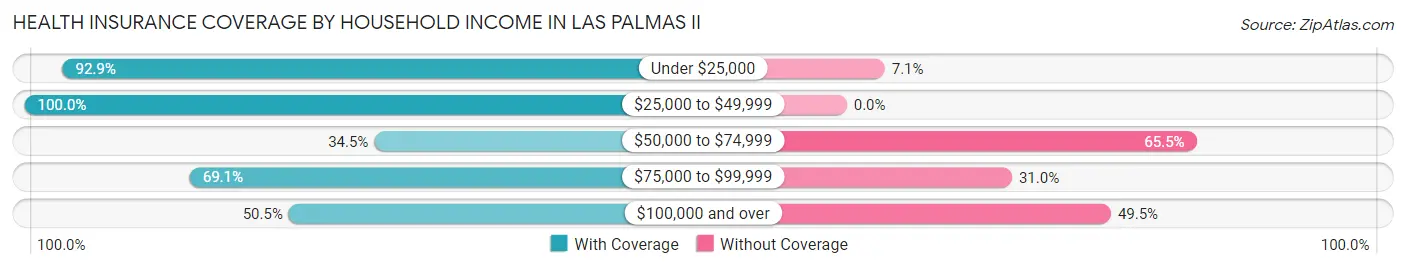
| Household Income | With Coverage | Without Coverage |
| Under $25,000 | 261 (92.9%) | 20 (7.1%) |
| $25,000 to $49,999 | 32 (100.0%) | 0 (0.0%) |
| $50,000 to $74,999 | 59 (34.5%) | 112 (65.5%) |
| $75,000 to $99,999 | 116 (69.1%) | 52 (30.9%) |
| $100,000 and over | 100 (50.5%) | 98 (49.5%) |
Public vs Private Health Insurance Coverage by Age in Las Palmas II
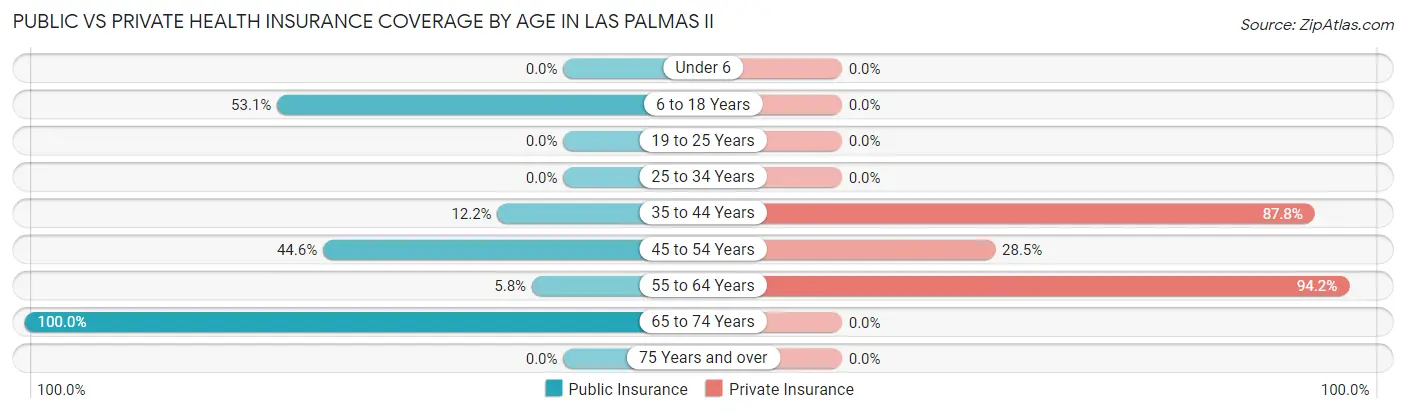
| Age Bracket | Public Insurance | Private Insurance |
| Under 6 | 0 (0.0%) | 0 (0.0%) |
| 6 to 18 Years | 153 (53.1%) | 0 (0.0%) |
| 19 to 25 Years | 0 (0.0%) | 0 (0.0%) |
| 25 to 34 Years | 0 (0.0%) | 0 (0.0%) |
| 35 to 44 Years | 17 (12.2%) | 122 (87.8%) |
| 45 to 54 Years | 58 (44.6%) | 37 (28.5%) |
| 55 to 64 Years | 9 (5.8%) | 145 (94.2%) |
| 65 to 74 Years | 27 (100.0%) | 0 (0.0%) |
| 75 Years and over | 0 (0.0%) | 0 (0.0%) |
| Total | 264 (31.1%) | 304 (35.8%) |
Disability Status by Sex by Age in Las Palmas II
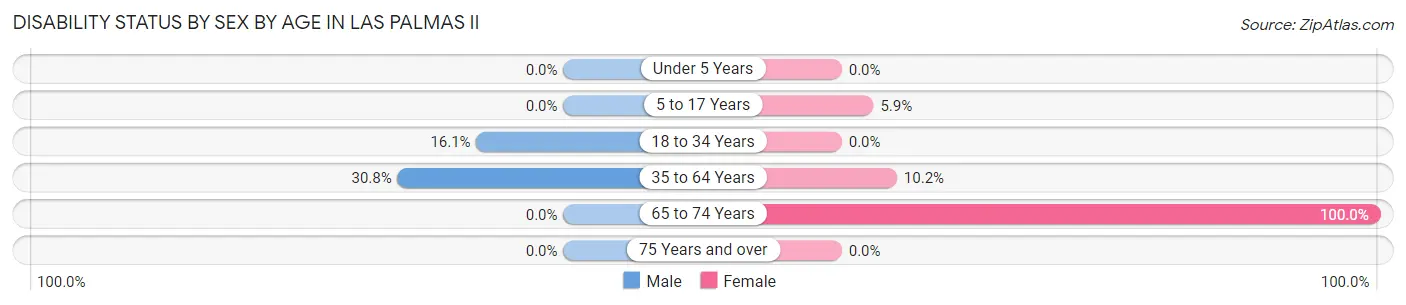
| Age Bracket | Male | Female |
| Under 5 Years | 0 (0.0%) | 0 (0.0%) |
| 5 to 17 Years | 0 (0.0%) | 8 (5.9%) |
| 18 to 34 Years | 10 (16.1%) | 0 (0.0%) |
| 35 to 64 Years | 76 (30.8%) | 18 (10.2%) |
| 65 to 74 Years | 0 (0.0%) | 27 (100.0%) |
| 75 Years and over | 0 (0.0%) | 0 (0.0%) |
Disability Class by Sex by Age in Las Palmas II
Disability Class: Hearing Difficulty
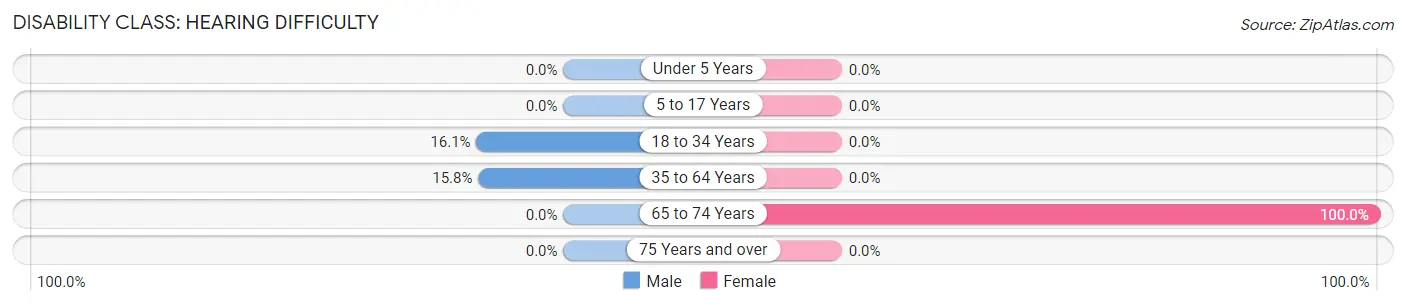
| Age Bracket | Male | Female |
| Under 5 Years | 0 (0.0%) | 0 (0.0%) |
| 5 to 17 Years | 0 (0.0%) | 0 (0.0%) |
| 18 to 34 Years | 10 (16.1%) | 0 (0.0%) |
| 35 to 64 Years | 39 (15.8%) | 0 (0.0%) |
| 65 to 74 Years | 0 (0.0%) | 27 (100.0%) |
| 75 Years and over | 0 (0.0%) | 0 (0.0%) |
Disability Class: Vision Difficulty
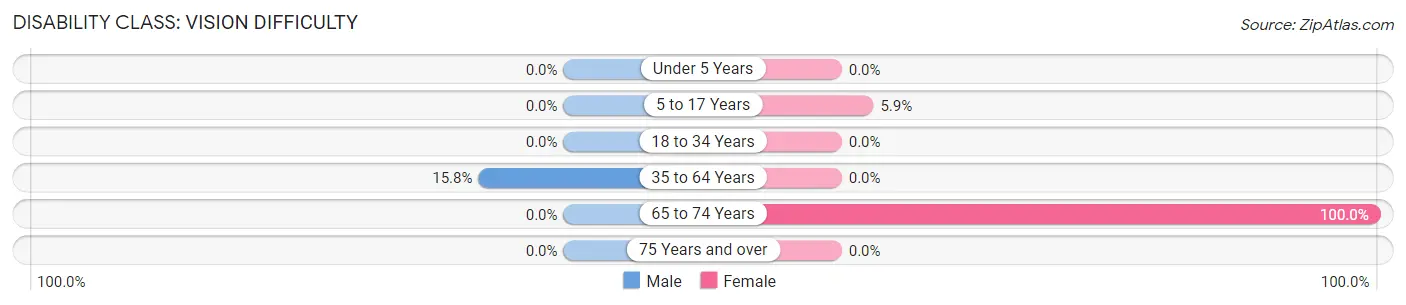
| Age Bracket | Male | Female |
| Under 5 Years | 0 (0.0%) | 0 (0.0%) |
| 5 to 17 Years | 0 (0.0%) | 8 (5.9%) |
| 18 to 34 Years | 0 (0.0%) | 0 (0.0%) |
| 35 to 64 Years | 39 (15.8%) | 0 (0.0%) |
| 65 to 74 Years | 0 (0.0%) | 27 (100.0%) |
| 75 Years and over | 0 (0.0%) | 0 (0.0%) |
Disability Class: Cognitive Difficulty
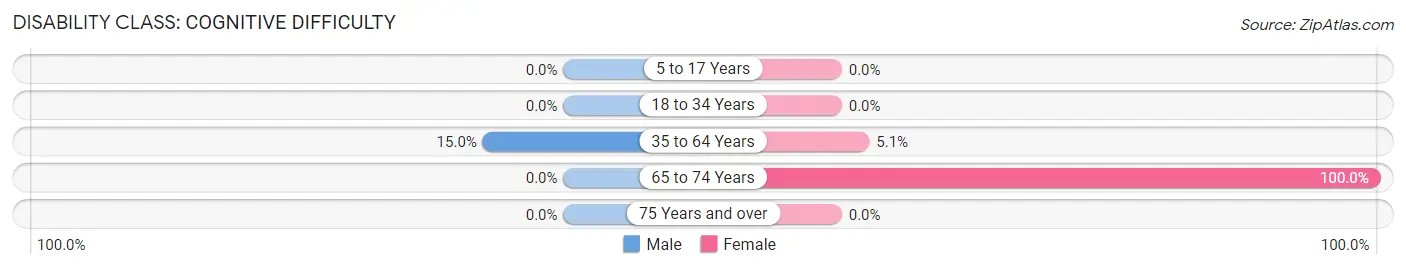
| Age Bracket | Male | Female |
| 5 to 17 Years | 0 (0.0%) | 0 (0.0%) |
| 18 to 34 Years | 0 (0.0%) | 0 (0.0%) |
| 35 to 64 Years | 37 (15.0%) | 9 (5.1%) |
| 65 to 74 Years | 0 (0.0%) | 27 (100.0%) |
| 75 Years and over | 0 (0.0%) | 0 (0.0%) |
Disability Class: Ambulatory Difficulty
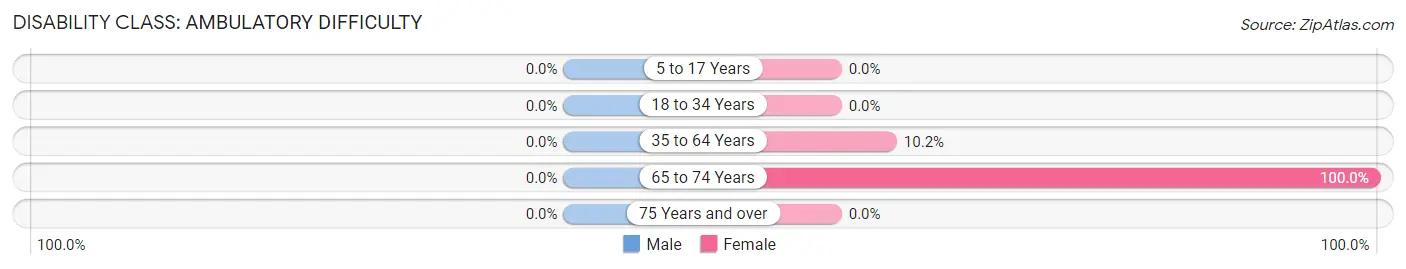
| Age Bracket | Male | Female |
| 5 to 17 Years | 0 (0.0%) | 0 (0.0%) |
| 18 to 34 Years | 0 (0.0%) | 0 (0.0%) |
| 35 to 64 Years | 0 (0.0%) | 18 (10.2%) |
| 65 to 74 Years | 0 (0.0%) | 27 (100.0%) |
| 75 Years and over | 0 (0.0%) | 0 (0.0%) |
Disability Class: Self-Care Difficulty
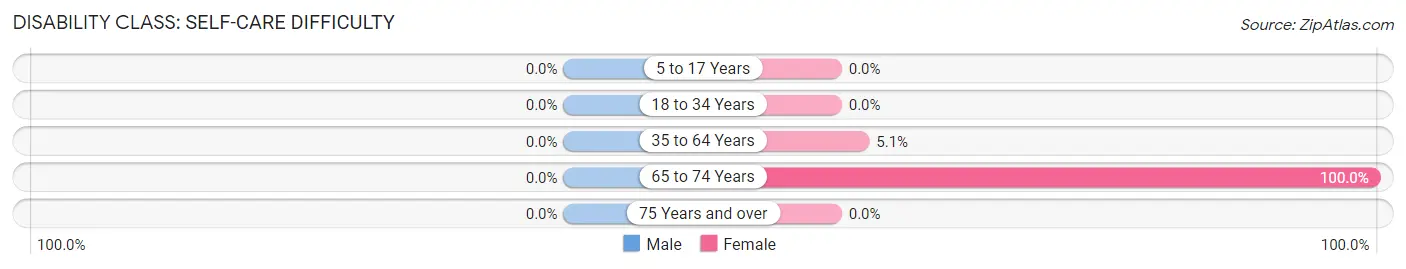
| Age Bracket | Male | Female |
| 5 to 17 Years | 0 (0.0%) | 0 (0.0%) |
| 18 to 34 Years | 0 (0.0%) | 0 (0.0%) |
| 35 to 64 Years | 0 (0.0%) | 9 (5.1%) |
| 65 to 74 Years | 0 (0.0%) | 27 (100.0%) |
| 75 Years and over | 0 (0.0%) | 0 (0.0%) |
Technology Access in Las Palmas II
Computing Device Access in Las Palmas II
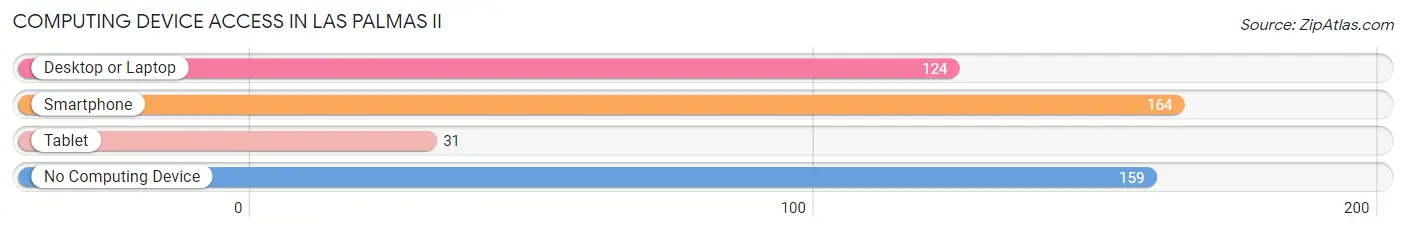
| Device Type | # Households | % Households |
| Desktop or Laptop | 124 | 38.4% |
| Smartphone | 164 | 50.8% |
| Tablet | 31 | 9.6% |
| No Computing Device | 159 | 49.2% |
| Total | 323 | 100.0% |
Internet Access in Las Palmas II
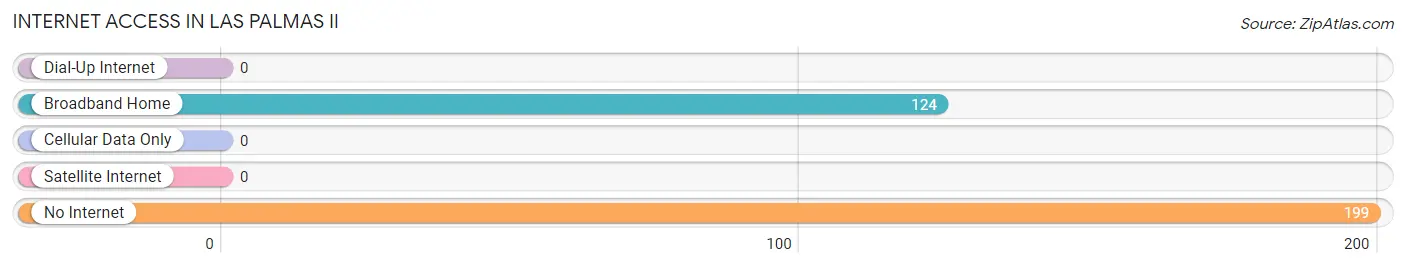
| Internet Type | # Households | % Households |
| Dial-Up Internet | 0 | 0.0% |
| Broadband Home | 124 | 38.4% |
| Cellular Data Only | 0 | 0.0% |
| Satellite Internet | 0 | 0.0% |
| No Internet | 199 | 61.6% |
| Total | 323 | 100.0% |
Las Palmas II Summary
Introduction
Las Palmas II is a small unincorporated community located in Hidalgo County, Texas. It is situated in the Rio Grande Valley, approximately 10 miles south of the city of McAllen. The community is part of the McAllen-Edinburg-Mission Metropolitan Statistical Area. Las Palmas II is a predominantly Hispanic community, with a population of approximately 1,000 people.
History
Las Palmas II was founded in the early 1900s by Mexican immigrants who were looking for a place to settle and start a new life. The community was originally known as Las Palmas, but the name was changed to Las Palmas II in the late 1950s to distinguish it from another nearby community with the same name.
Las Palmas II has a long history of agricultural production. The area was originally used for growing cotton, but in the 1950s, the community began to focus on growing vegetables, such as tomatoes, peppers, and squash. The community also began to produce dairy products, such as cheese and milk.
In the late 1970s, the community began to experience rapid growth due to the influx of Mexican immigrants. This growth was further accelerated by the passage of the Immigration Reform and Control Act of 1986, which allowed undocumented immigrants to obtain legal status in the United States.
Geography
Las Palmas II is located in the Rio Grande Valley, approximately 10 miles south of the city of McAllen. The community is situated on the banks of the Rio Grande River, which forms the border between the United States and Mexico. The area is characterized by flat terrain and is surrounded by agricultural fields.
The climate in Las Palmas II is subtropical, with hot summers and mild winters. The average annual temperature is 73°F, with an average high of 92°F in the summer and an average low of 55°F in the winter. The average annual precipitation is 22 inches.
Economy
The economy of Las Palmas II is largely based on agriculture. The community is home to several large vegetable farms, as well as several dairy farms. The area is also home to several small businesses, such as restaurants, grocery stores, and auto repair shops.
The community is also home to several manufacturing plants, including a plant that produces plastic containers and a plant that produces furniture. The area is also home to several oil and gas production facilities.
Demographics
As of the 2010 census, the population of Las Palmas II was 1,000 people. The population is predominantly Hispanic, with 97.7% of the population identifying as Hispanic or Latino. The median household income is $25,000, and the median age is 28 years.
Conclusion
Las Palmas II is a small unincorporated community located in Hidalgo County, Texas. The community is situated in the Rio Grande Valley, approximately 10 miles south of the city of McAllen. The population of Las Palmas II is predominantly Hispanic, with 97.7% of the population identifying as Hispanic or Latino. The economy of the community is largely based on agriculture, with several large vegetable farms and dairy farms in the area. The area is also home to several small businesses, manufacturing plants, and oil and gas production facilities.
Common Questions
What is Per Capita Income in Las Palmas II?
Per Capita income in Las Palmas II is $20,046.
What is Inequality or Gini Index in Las Palmas II?
Inequality or Gini Index in Las Palmas II is 0.43.
What is the Total Population of Las Palmas II?
Total Population of Las Palmas II is 850.
What is the Total Male Population of Las Palmas II?
Total Male Population of Las Palmas II is 461.
What is the Total Female Population of Las Palmas II?
Total Female Population of Las Palmas II is 389.
What is the Ratio of Males per 100 Females in Las Palmas II?
There are 118.51 Males per 100 Females in Las Palmas II.
What is the Ratio of Females per 100 Males in Las Palmas II?
There are 84.38 Females per 100 Males in Las Palmas II.
What is the Median Population Age in Las Palmas II?
Median Population Age in Las Palmas II is 39.2 Years.
What is the Average Family Size in Las Palmas II
Average Family Size in Las Palmas II is 3.6 People.
What is the Average Household Size in Las Palmas II
Average Household Size in Las Palmas II is 2.6 People.
How Large is the Labor Force in Las Palmas II?
There are 394 People in the Labor Forcein in Las Palmas II.
What is the Percentage of People in the Labor Force in Las Palmas II?
70.1% of People are in the Labor Force in Las Palmas II.