Springlake, TX Map & Demographics
Springlake Map
Springlake Overview
$16,912
PER CAPITA INCOME
0.41
INEQUALITY / GINI INDEX
91
TOTAL POPULATION
43
MALE POPULATION
48
FEMALE POPULATION
89.58
MALES / 100 FEMALES
111.63
FEMALES / 100 MALES
45.4
MEDIAN AGE
3.8
AVG FAMILY SIZE
3.4
AVG HOUSEHOLD SIZE
42
LABOR FORCE [ PEOPLE ]
59.2%
PERCENT IN LABOR FORCE
Springlake Zip Codes
Springlake Area Codes
Income in Springlake
Income Overview in Springlake
| Characteristic | Number | Measure |
| Per Capita Income | 91 | $16,912 |
| Median Family Income | 21 | $0 |
| Mean Family Income | 21 | $63,371 |
| Median Household Income | 27 | $0 |
| Mean Household Income | 27 | $52,337 |
| Income Deficit | 21 | $0 |
| Wage / Income Gap (%) | 91 | 0.00% |
| Wage / Income Gap ($) | 91 | 100.00¢ per $1 |
| Gini / Inequality Index | 91 | 0.41 |
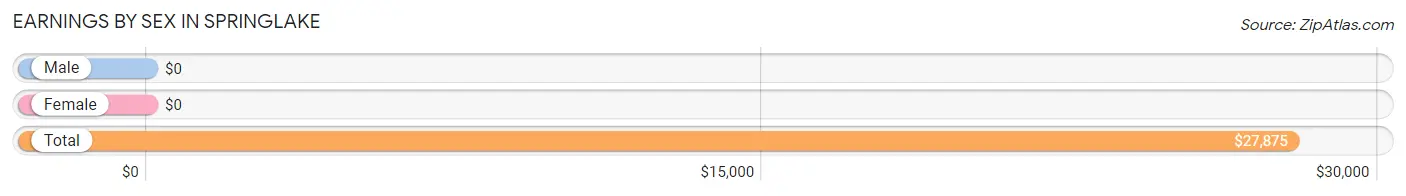
Earnings by Sex in Springlake
| Sex | Number | Average Earnings |
| Male | 24 (55.8%) | $0 |
| Female | 19 (44.2%) | $0 |
| Total | 43 (100.0%) | $27,875 |
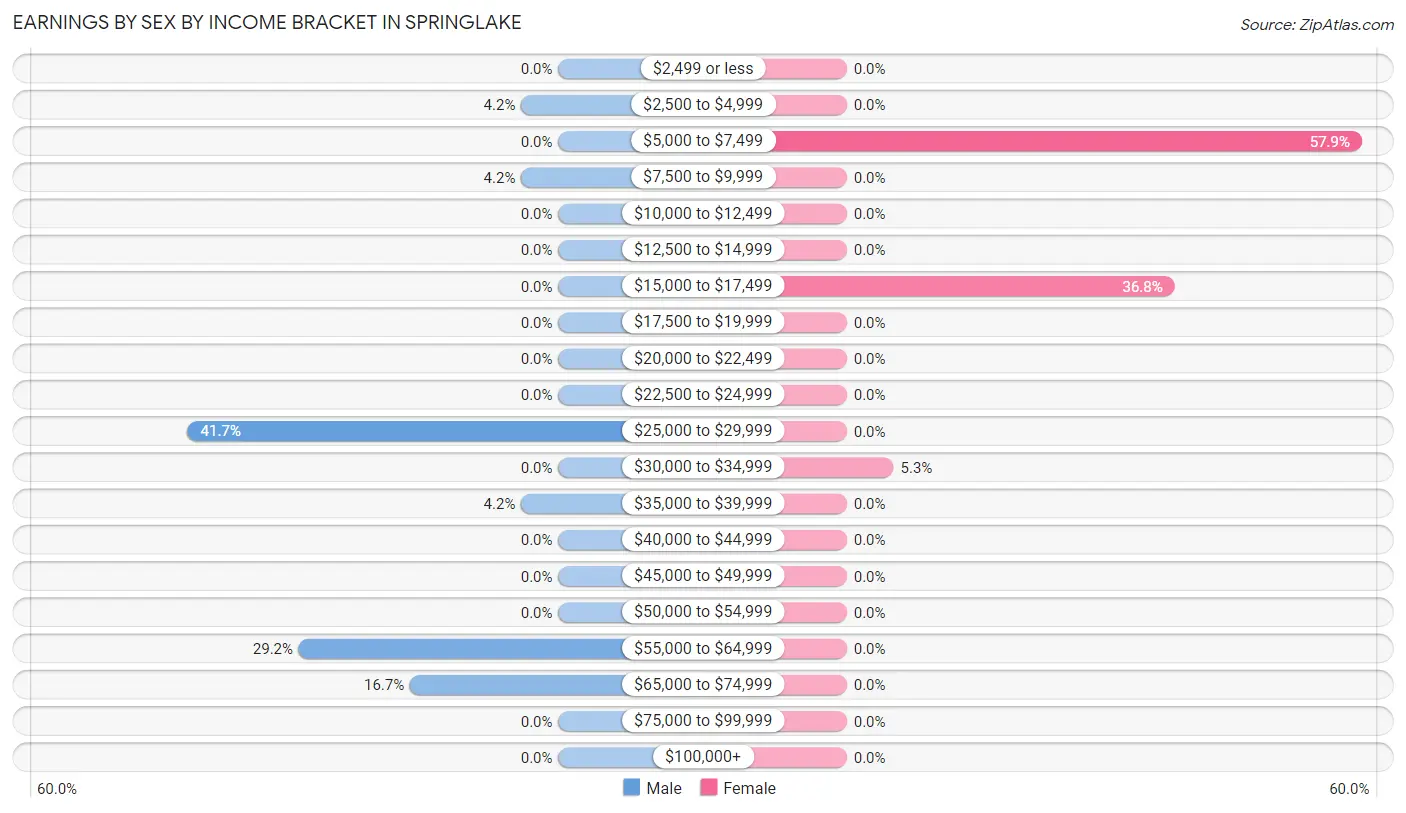
Earnings by Sex by Income Bracket in Springlake
The most common earnings brackets in Springlake are $25,000 to $29,999 for men (10 | 41.7%) and $5,000 to $7,499 for women (11 | 57.9%).
| Income | Male | Female |
| $2,499 or less | 0 (0.0%) | 0 (0.0%) |
| $2,500 to $4,999 | 1 (4.2%) | 0 (0.0%) |
| $5,000 to $7,499 | 0 (0.0%) | 11 (57.9%) |
| $7,500 to $9,999 | 1 (4.2%) | 0 (0.0%) |
| $10,000 to $12,499 | 0 (0.0%) | 0 (0.0%) |
| $12,500 to $14,999 | 0 (0.0%) | 0 (0.0%) |
| $15,000 to $17,499 | 0 (0.0%) | 7 (36.8%) |
| $17,500 to $19,999 | 0 (0.0%) | 0 (0.0%) |
| $20,000 to $22,499 | 0 (0.0%) | 0 (0.0%) |
| $22,500 to $24,999 | 0 (0.0%) | 0 (0.0%) |
| $25,000 to $29,999 | 10 (41.7%) | 0 (0.0%) |
| $30,000 to $34,999 | 0 (0.0%) | 1 (5.3%) |
| $35,000 to $39,999 | 1 (4.2%) | 0 (0.0%) |
| $40,000 to $44,999 | 0 (0.0%) | 0 (0.0%) |
| $45,000 to $49,999 | 0 (0.0%) | 0 (0.0%) |
| $50,000 to $54,999 | 0 (0.0%) | 0 (0.0%) |
| $55,000 to $64,999 | 7 (29.2%) | 0 (0.0%) |
| $65,000 to $74,999 | 4 (16.7%) | 0 (0.0%) |
| $75,000 to $99,999 | 0 (0.0%) | 0 (0.0%) |
| $100,000+ | 0 (0.0%) | 0 (0.0%) |
| Total | 24 (100.0%) | 19 (100.0%) |
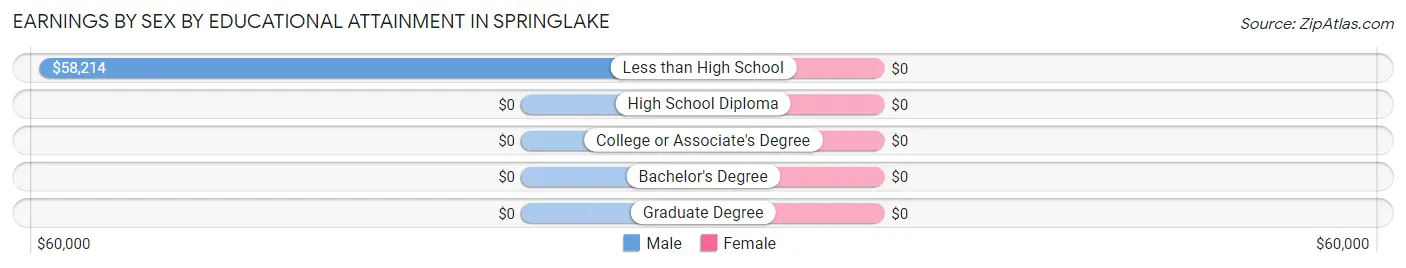
Earnings by Sex by Educational Attainment in Springlake
| Educational Attainment | Male Income | Female Income |
| Less than High School | $58,214 | $0 |
| High School Diploma | - | - |
| College or Associate's Degree | - | - |
| Bachelor's Degree | - | - |
| Graduate Degree | - | - |
| Total | $58,571 | $0 |
Family Income in Springlake
Family Income Brackets in Springlake
According to the Springlake family income data, there are 7 families falling into the $25,000 to $34,999 income range, which is the most common income bracket and makes up 33.3% of all families.
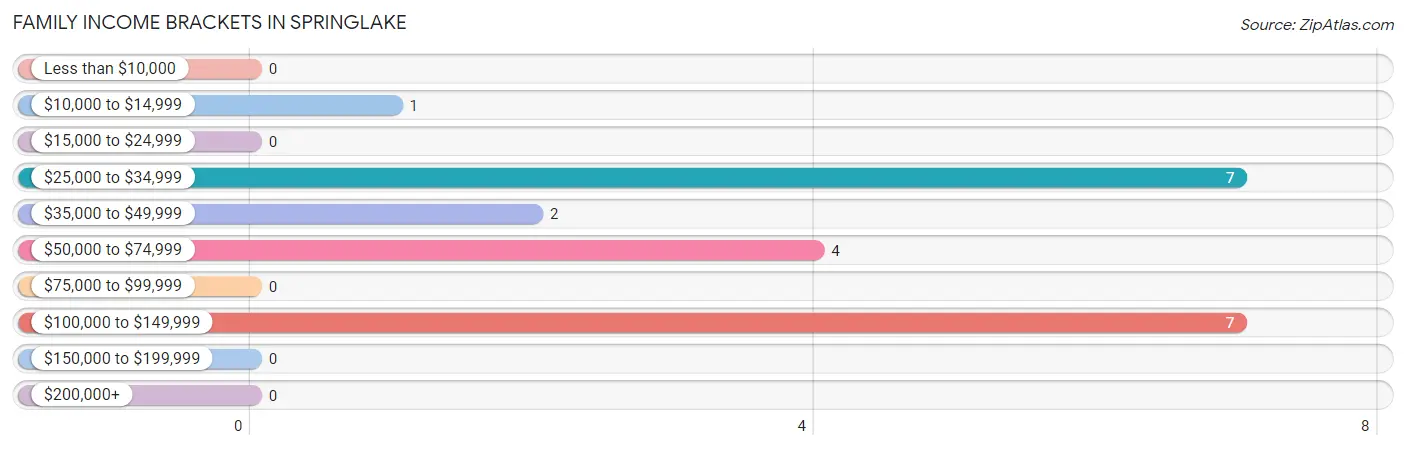
| Income Bracket | # Families | % Families |
| Less than $10,000 | 0 | 0.0% |
| $10,000 to $14,999 | 1 | 4.8% |
| $15,000 to $24,999 | 0 | 0.0% |
| $25,000 to $34,999 | 7 | 33.3% |
| $35,000 to $49,999 | 2 | 9.5% |
| $50,000 to $74,999 | 4 | 19.0% |
| $75,000 to $99,999 | 0 | 0.0% |
| $100,000 to $149,999 | 7 | 33.3% |
| $150,000 to $199,999 | 0 | 0.0% |
| $200,000+ | 0 | 0.0% |
Family Income by Famaliy Size in Springlake
2-person families (3 | 14.3%) account for the highest median family income in Springlake with $38,750 per family, while 2-person families (3 | 14.3%) have the highest median income of $19,375 per family member.
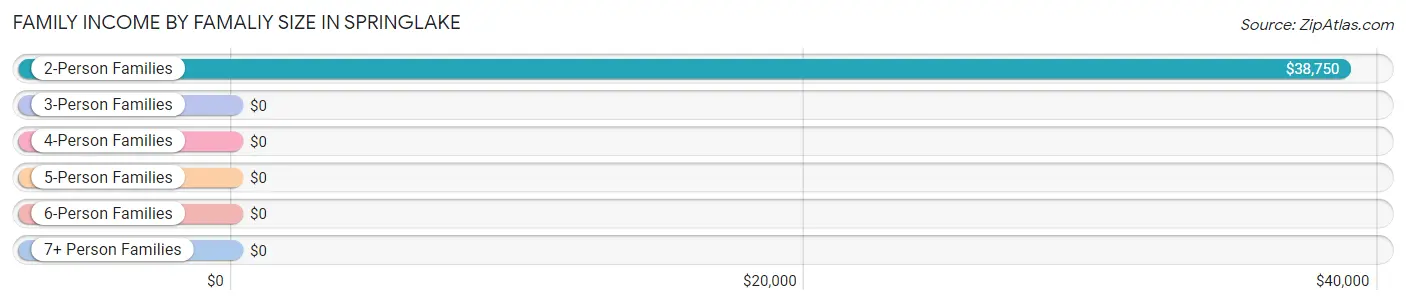
| Income Bracket | # Families | Median Income |
| 2-Person Families | 3 (14.3%) | $38,750 |
| 3-Person Families | 7 (33.3%) | $0 |
| 4-Person Families | 9 (42.9%) | $0 |
| 5-Person Families | 2 (9.5%) | $0 |
| 6-Person Families | 0 (0.0%) | $0 |
| 7+ Person Families | 0 (0.0%) | $0 |
| Total | 21 (100.0%) | $0 |
Family Income by Number of Earners in Springlake
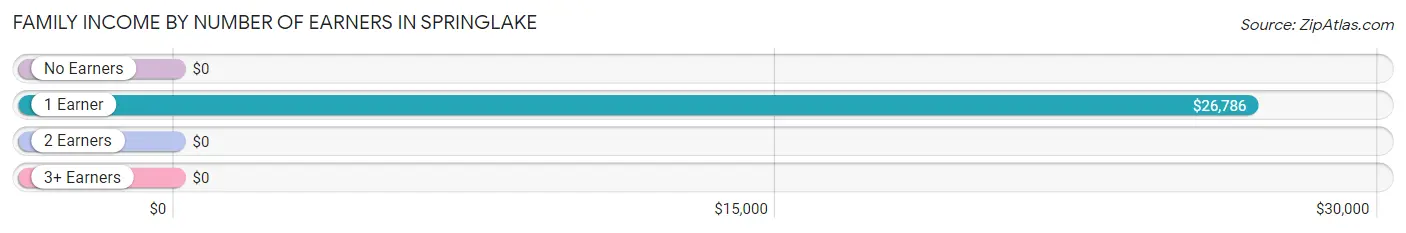
| Number of Earners | # Families | Median Income |
| No Earners | 1 (4.8%) | $0 |
| 1 Earner | 10 (47.6%) | $26,786 |
| 2 Earners | 3 (14.3%) | $0 |
| 3+ Earners | 7 (33.3%) | $0 |
| Total | 21 (100.0%) | $0 |
Household Income in Springlake
Household Income Brackets in Springlake
With 7 households falling in the category, the $25,000 to $34,999 income range is the most frequent in Springlake, accounting for 25.9% of all households.
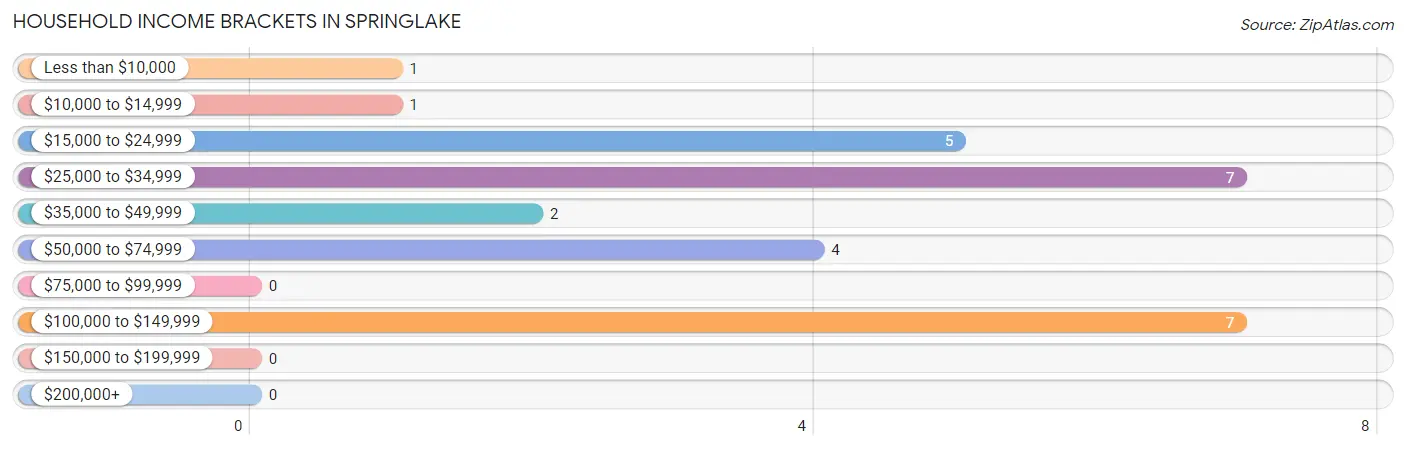
| Income Bracket | # Households | % Households |
| Less than $10,000 | 1 | 3.7% |
| $10,000 to $14,999 | 1 | 3.7% |
| $15,000 to $24,999 | 5 | 18.5% |
| $25,000 to $34,999 | 7 | 25.9% |
| $35,000 to $49,999 | 2 | 7.4% |
| $50,000 to $74,999 | 4 | 14.8% |
| $75,000 to $99,999 | 0 | 0.0% |
| $100,000 to $149,999 | 7 | 25.9% |
| $150,000 to $199,999 | 0 | 0.0% |
| $200,000+ | 0 | 0.0% |
Household Income by Householder Age in Springlake
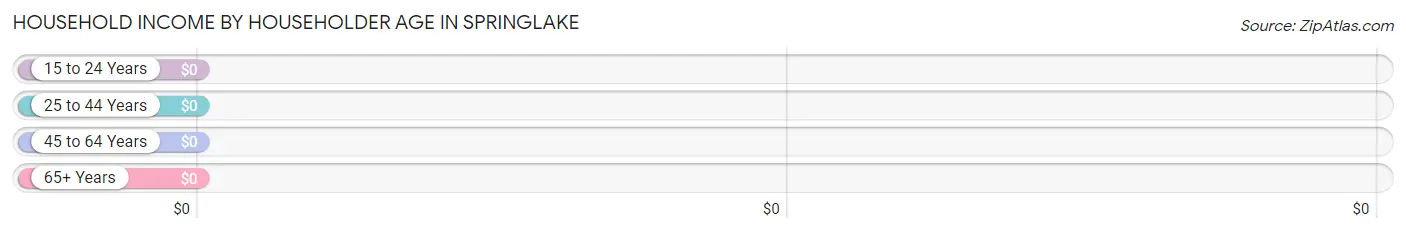
| Income Bracket | # Households | Median Income |
| 15 to 24 Years | 0 (0.0%) | $0 |
| 25 to 44 Years | 2 (7.4%) | $0 |
| 45 to 64 Years | 17 (63.0%) | $0 |
| 65+ Years | 8 (29.6%) | $0 |
| Total | 27 (100.0%) | $0 |
Poverty in Springlake
Income Below Poverty by Sex and Age in Springlake
With 18.6% poverty level for males and 12.5% for females among the residents of Springlake, 75 year old and over males and 55 to 64 year old females are the most vulnerable to poverty, with 6 males (75.0%) and 6 females (85.7%) in their respective age groups living below the poverty level.
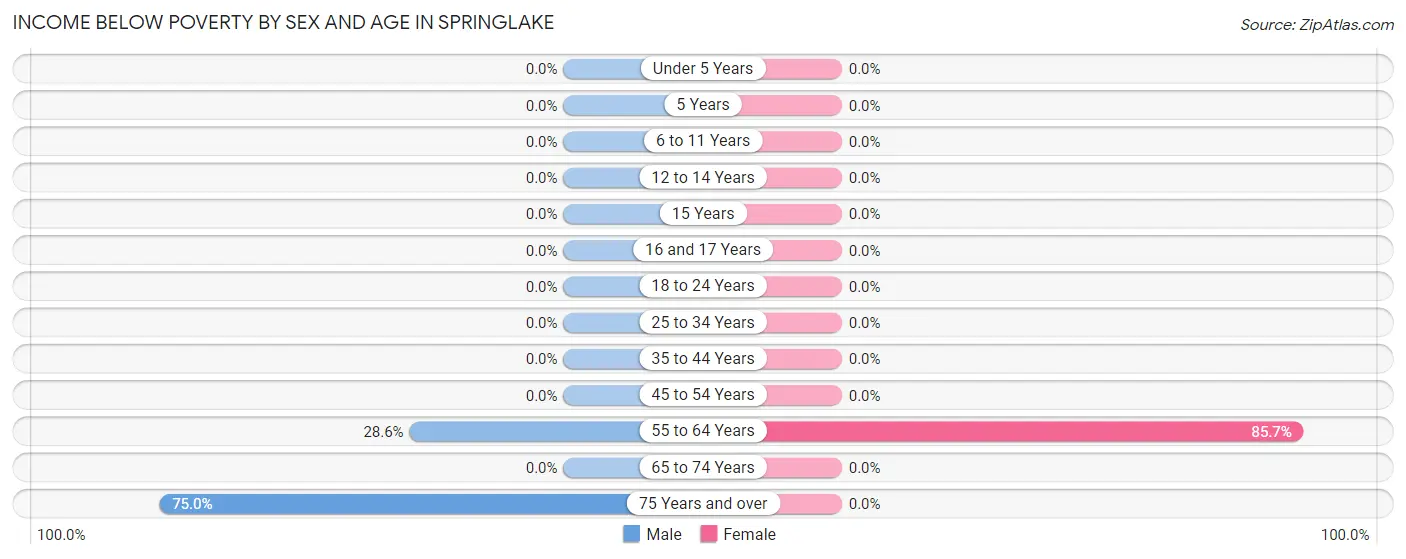
| Age Bracket | Male | Female |
| Under 5 Years | 0 (0.0%) | 0 (0.0%) |
| 5 Years | 0 (0.0%) | 0 (0.0%) |
| 6 to 11 Years | 0 (0.0%) | 0 (0.0%) |
| 12 to 14 Years | 0 (0.0%) | 0 (0.0%) |
| 15 Years | 0 (0.0%) | 0 (0.0%) |
| 16 and 17 Years | 0 (0.0%) | 0 (0.0%) |
| 18 to 24 Years | 0 (0.0%) | 0 (0.0%) |
| 25 to 34 Years | 0 (0.0%) | 0 (0.0%) |
| 35 to 44 Years | 0 (0.0%) | 0 (0.0%) |
| 45 to 54 Years | 0 (0.0%) | 0 (0.0%) |
| 55 to 64 Years | 2 (28.6%) | 6 (85.7%) |
| 65 to 74 Years | 0 (0.0%) | 0 (0.0%) |
| 75 Years and over | 6 (75.0%) | 0 (0.0%) |
| Total | 8 (18.6%) | 6 (12.5%) |
Income Above Poverty by Sex and Age in Springlake
According to the poverty statistics in Springlake, males aged 6 to 11 years and females aged 6 to 11 years are the age groups that are most secure financially, with 100.0% of males and 100.0% of females in these age groups living above the poverty line.
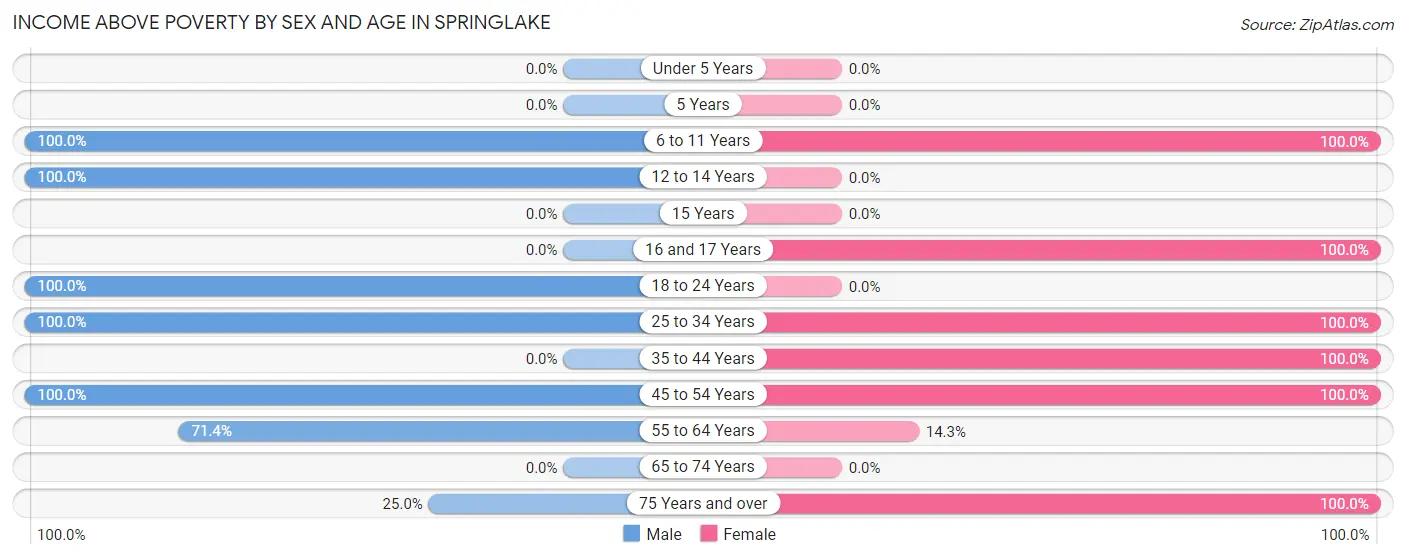
| Age Bracket | Male | Female |
| Under 5 Years | 0 (0.0%) | 0 (0.0%) |
| 5 Years | 0 (0.0%) | 0 (0.0%) |
| 6 to 11 Years | 9 (100.0%) | 9 (100.0%) |
| 12 to 14 Years | 2 (100.0%) | 0 (0.0%) |
| 15 Years | 0 (0.0%) | 0 (0.0%) |
| 16 and 17 Years | 0 (0.0%) | 4 (100.0%) |
| 18 to 24 Years | 8 (100.0%) | 0 (0.0%) |
| 25 to 34 Years | 7 (100.0%) | 2 (100.0%) |
| 35 to 44 Years | 0 (0.0%) | 1 (100.0%) |
| 45 to 54 Years | 2 (100.0%) | 17 (100.0%) |
| 55 to 64 Years | 5 (71.4%) | 1 (14.3%) |
| 65 to 74 Years | 0 (0.0%) | 0 (0.0%) |
| 75 Years and over | 2 (25.0%) | 8 (100.0%) |
| Total | 35 (81.4%) | 42 (87.5%) |
Income Below Poverty Among Married-Couple Families in Springlake
The poverty statistics for married-couple families in Springlake show that 7.1% or 1 of the total 14 families live below the poverty line. Families with no children have the highest poverty rate of 33.3%, comprising of 1 families. On the other hand, families with 1 or 2 children have the lowest poverty rate of 0.0%, which includes 0 families.
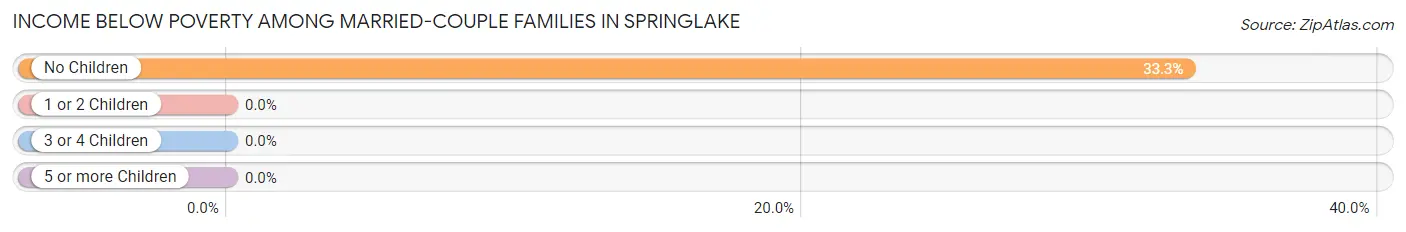
| Children | Above Poverty | Below Poverty |
| No Children | 2 (66.7%) | 1 (33.3%) |
| 1 or 2 Children | 9 (100.0%) | 0 (0.0%) |
| 3 or 4 Children | 2 (100.0%) | 0 (0.0%) |
| 5 or more Children | 0 (0.0%) | 0 (0.0%) |
| Total | 13 (92.9%) | 1 (7.1%) |
Income Below Poverty Among Single-Parent Households in Springlake
| Children | Single Father | Single Mother |
| No Children | 0 (0.0%) | 0 (0.0%) |
| 1 or 2 Children | 0 (0.0%) | 0 (0.0%) |
| 3 or 4 Children | 0 (0.0%) | 0 (0.0%) |
| 5 or more Children | 0 (0.0%) | 0 (0.0%) |
| Total | 0 (0.0%) | 0 (0.0%) |
Income Below Poverty Among Married-Couple vs Single-Parent Households in Springlake
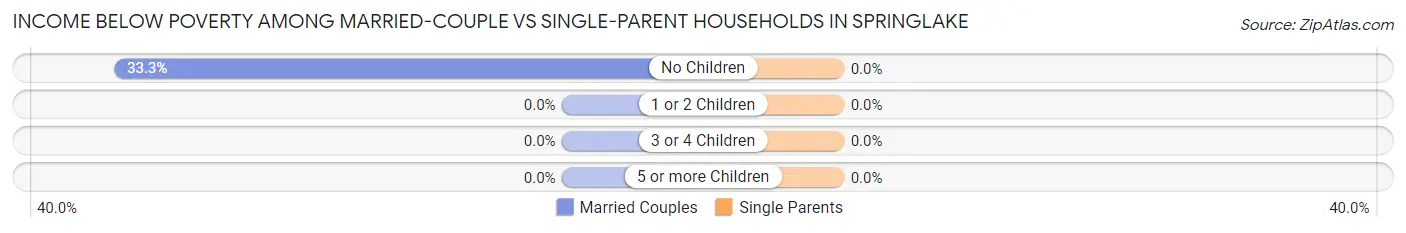
| Children | Married-Couple Families | Single-Parent Households |
| No Children | 1 (33.3%) | 0 (0.0%) |
| 1 or 2 Children | 0 (0.0%) | 0 (0.0%) |
| 3 or 4 Children | 0 (0.0%) | 0 (0.0%) |
| 5 or more Children | 0 (0.0%) | 0 (0.0%) |
| Total | 1 (7.1%) | 0 (0.0%) |
Race in Springlake
The most populous races in Springlake are White / Caucasian (55 | 60.4%), Hispanic or Latino (46 | 50.5%), and Two or more Races (25 | 27.5%).
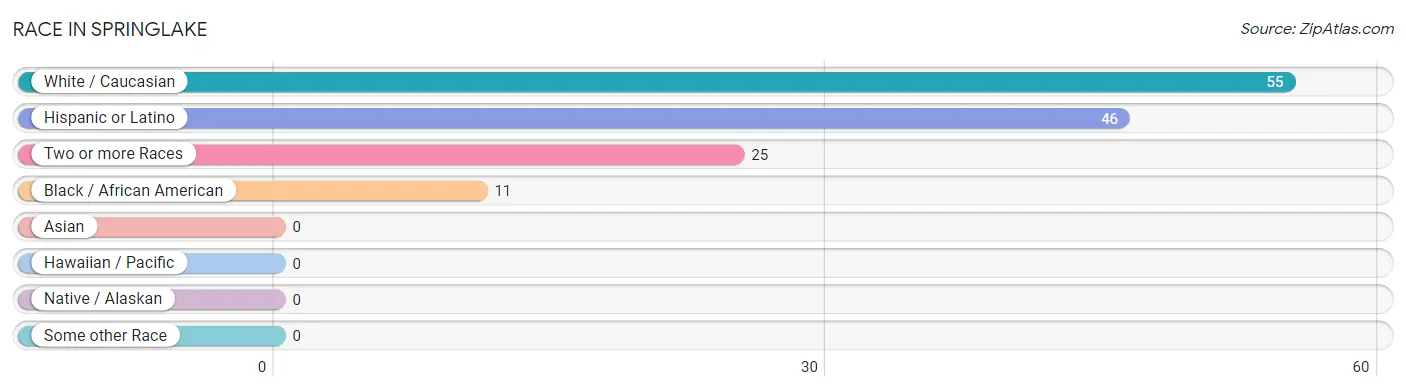
| Race | # Population | % Population |
| Asian | 0 | 0.0% |
| Black / African American | 11 | 12.1% |
| Hawaiian / Pacific | 0 | 0.0% |
| Hispanic or Latino | 46 | 50.5% |
| Native / Alaskan | 0 | 0.0% |
| White / Caucasian | 55 | 60.4% |
| Two or more Races | 25 | 27.5% |
| Some other Race | 0 | 0.0% |
| Total | 91 | 100.0% |
Ancestry in Springlake
The most populous ancestries reported in Springlake are Mexican (46 | 50.5%), German (15 | 16.5%), and English (1 | 1.1%), together accounting for 68.1% of all Springlake residents.
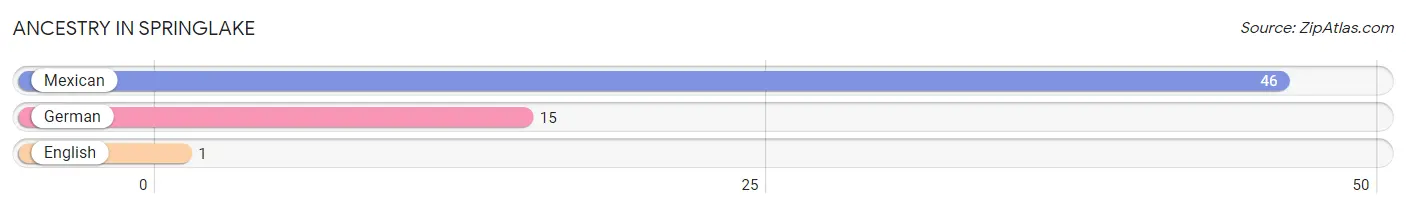
| Ancestry | # Population | % Population |
| English | 1 | 1.1% |
| German | 15 | 16.5% |
| Mexican | 46 | 50.5% | View All 3 Rows |
Immigrants in Springlake
The most numerous immigrant groups reported in Springlake came from Central America (9 | 9.9%), Latin America (9 | 9.9%), and Mexico (9 | 9.9%), together accounting for 29.7% of all Springlake residents.
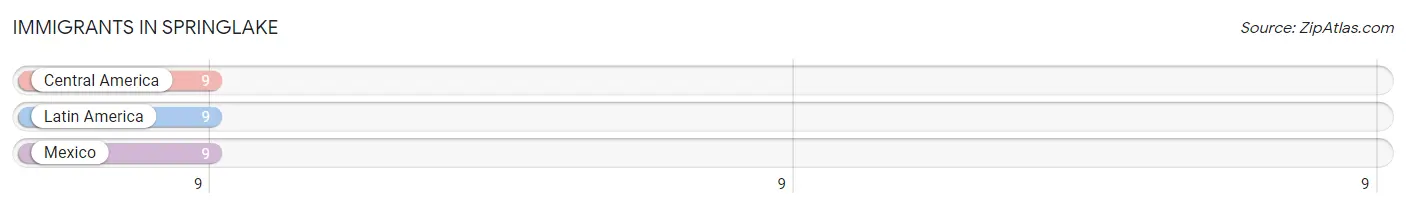
| Immigration Origin | # Population | % Population |
| Central America | 9 | 9.9% |
| Latin America | 9 | 9.9% |
| Mexico | 9 | 9.9% | View All 3 Rows |
Sex and Age in Springlake
Sex and Age in Springlake
The most populous age groups in Springlake are 5 to 9 Years (9 | 20.9%) for men and 45 to 49 Years (17 | 35.4%) for women.
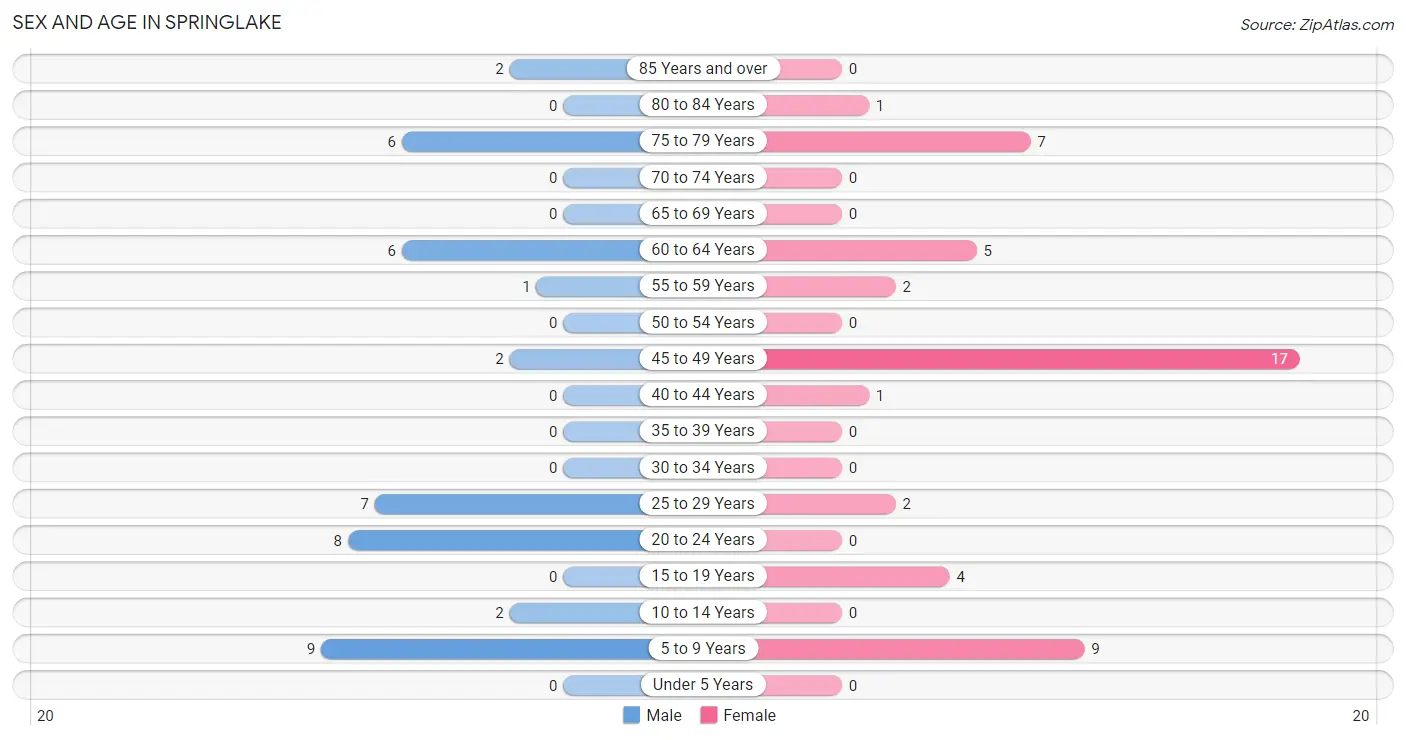
| Age Bracket | Male | Female |
| Under 5 Years | 0 (0.0%) | 0 (0.0%) |
| 5 to 9 Years | 9 (20.9%) | 9 (18.8%) |
| 10 to 14 Years | 2 (4.6%) | 0 (0.0%) |
| 15 to 19 Years | 0 (0.0%) | 4 (8.3%) |
| 20 to 24 Years | 8 (18.6%) | 0 (0.0%) |
| 25 to 29 Years | 7 (16.3%) | 2 (4.2%) |
| 30 to 34 Years | 0 (0.0%) | 0 (0.0%) |
| 35 to 39 Years | 0 (0.0%) | 0 (0.0%) |
| 40 to 44 Years | 0 (0.0%) | 1 (2.1%) |
| 45 to 49 Years | 2 (4.6%) | 17 (35.4%) |
| 50 to 54 Years | 0 (0.0%) | 0 (0.0%) |
| 55 to 59 Years | 1 (2.3%) | 2 (4.2%) |
| 60 to 64 Years | 6 (14.0%) | 5 (10.4%) |
| 65 to 69 Years | 0 (0.0%) | 0 (0.0%) |
| 70 to 74 Years | 0 (0.0%) | 0 (0.0%) |
| 75 to 79 Years | 6 (14.0%) | 7 (14.6%) |
| 80 to 84 Years | 0 (0.0%) | 1 (2.1%) |
| 85 Years and over | 2 (4.6%) | 0 (0.0%) |
| Total | 43 (100.0%) | 48 (100.0%) |
Families and Households in Springlake
Median Family Size in Springlake
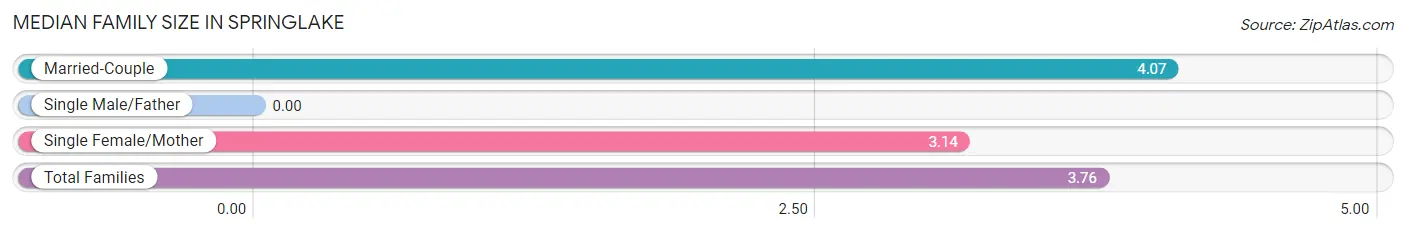
| Family Type | # Families | Family Size |
| Married-Couple | 14 (66.7%) | 4.07 |
| Single Male/Father | 0 (0.0%) | - |
| Single Female/Mother | 7 (33.3%) | 3.14 |
| Total Families | 21 (100.0%) | 3.76 |
Median Household Size in Springlake
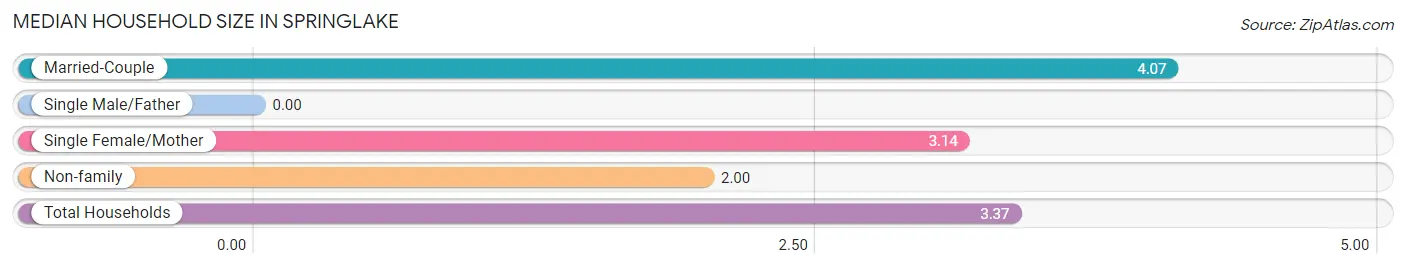
| Household Type | # Households | Household Size |
| Married-Couple | 14 (51.8%) | 4.07 |
| Single Male/Father | 0 (0.0%) | - |
| Single Female/Mother | 7 (25.9%) | 3.14 |
| Non-family | 6 (22.2%) | 2.00 |
| Total Households | 27 (100.0%) | 3.37 |
Household Size by Marriage Status in Springlake
Out of a total of 27 households in Springlake, 21 (77.8%) are family households, while 6 (22.2%) are nonfamily households. The most numerous type of family households are 4-person households, comprising 9, and the most common type of nonfamily households are 2-person households, comprising 5.
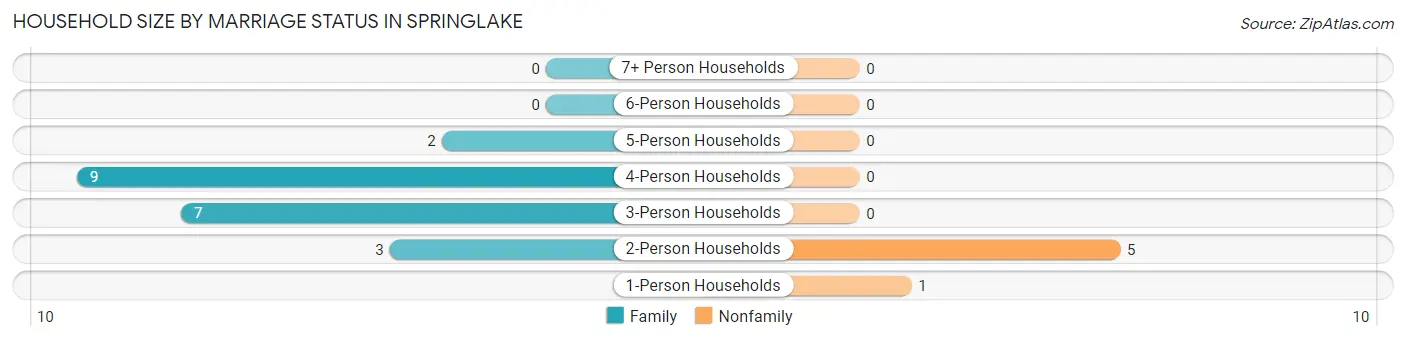
| Household Size | Family Households | Nonfamily Households |
| 1-Person Households | - | 1 (3.7%) |
| 2-Person Households | 3 (11.1%) | 5 (18.5%) |
| 3-Person Households | 7 (25.9%) | 0 (0.0%) |
| 4-Person Households | 9 (33.3%) | 0 (0.0%) |
| 5-Person Households | 2 (7.4%) | 0 (0.0%) |
| 6-Person Households | 0 (0.0%) | 0 (0.0%) |
| 7+ Person Households | 0 (0.0%) | 0 (0.0%) |
| Total | 21 (77.8%) | 6 (22.2%) |
Female Fertility in Springlake
Fertility by Age in Springlake
Average fertility rate in Springlake is 42.0 births per 1,000 women. Women in the age bracket of 35 to 50 years have the highest fertility rate with 56.0 births per 1,000 women. Women in the age bracket of 35 to 50 years acount for 100.0% of all women with births.
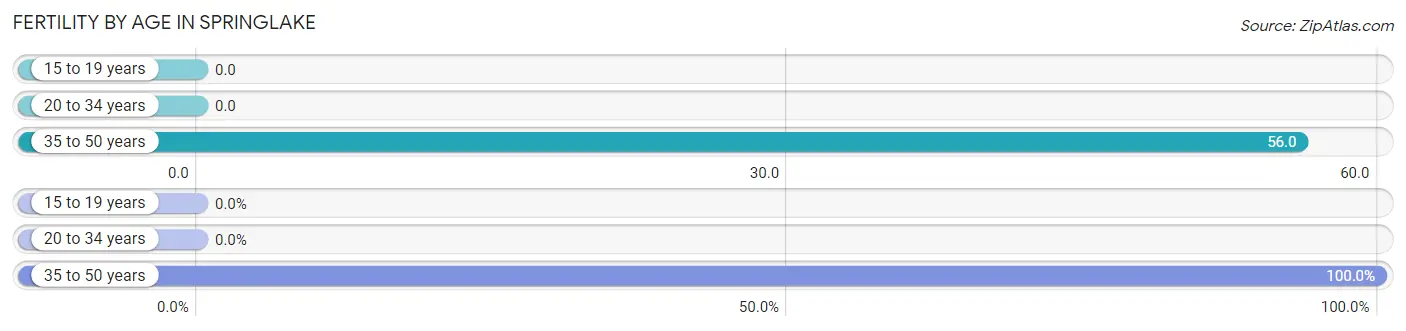
| Age Bracket | Women with Births | Births / 1,000 Women |
| 15 to 19 years | 0 (0.0%) | 0.0 |
| 20 to 34 years | 0 (0.0%) | 0.0 |
| 35 to 50 years | 1 (100.0%) | 56.0 |
| Total | 1 (100.0%) | 42.0 |
Fertility by Age by Marriage Status in Springlake
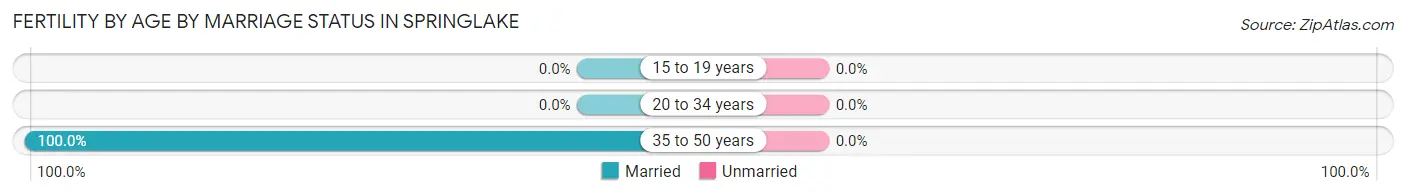
| Age Bracket | Married | Unmarried |
| 15 to 19 years | 0 (0.0%) | 0 (0.0%) |
| 20 to 34 years | 0 (0.0%) | 0 (0.0%) |
| 35 to 50 years | 1 (100.0%) | 0 (0.0%) |
| Total | 1 (100.0%) | 0 (0.0%) |
Fertility by Education in Springlake
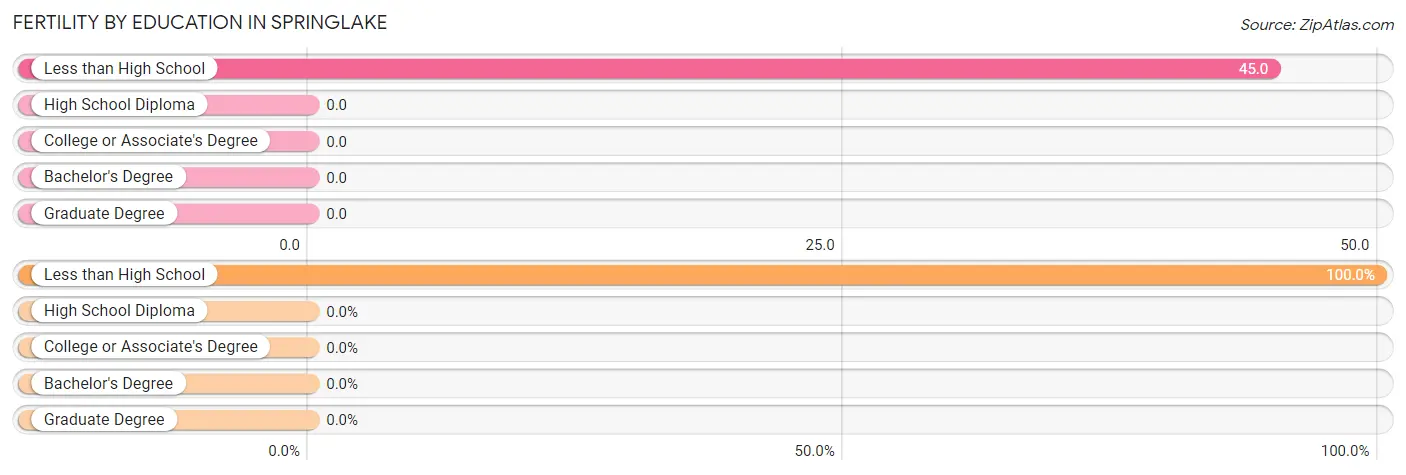
| Educational Attainment | Women with Births | Births / 1,000 Women |
| Less than High School | 1 (100.0%) | 45.0 |
| High School Diploma | 0 (0.0%) | 0.0 |
| College or Associate's Degree | 0 (0.0%) | 0.0 |
| Bachelor's Degree | 0 (0.0%) | 0.0 |
| Graduate Degree | 0 (0.0%) | 0.0 |
| Total | 1 (100.0%) | 42.0 |
Fertility by Education by Marriage Status in Springlake
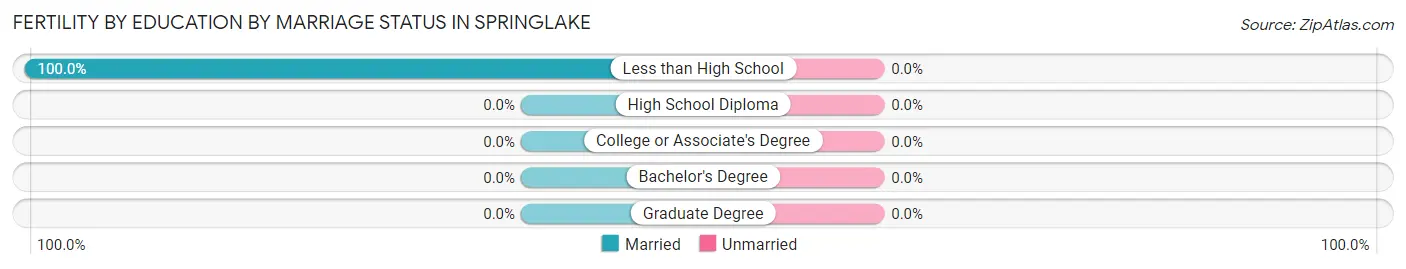
| Educational Attainment | Married | Unmarried |
| Less than High School | 1 (100.0%) | 0 (0.0%) |
| High School Diploma | 0 (0.0%) | 0 (0.0%) |
| College or Associate's Degree | 0 (0.0%) | 0 (0.0%) |
| Bachelor's Degree | 0 (0.0%) | 0 (0.0%) |
| Graduate Degree | 0 (0.0%) | 0 (0.0%) |
| Total | 1 (100.0%) | 0 (0.0%) |
Employment Characteristics in Springlake
Employment by Class of Employer in Springlake
Among the 42 employed individuals in Springlake, private company employees (30 | 71.4%), self-employed (not incorporated) (7 | 16.7%), and not-for-profit organizations (4 | 9.5%) make up the most common classes of employment.
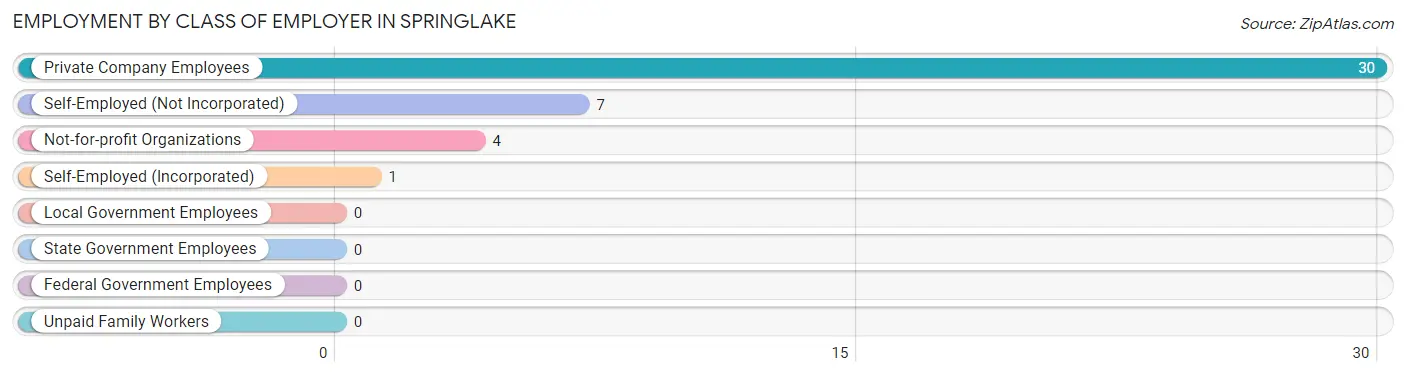
| Employer Class | # Employees | % Employees |
| Private Company Employees | 30 | 71.4% |
| Self-Employed (Incorporated) | 1 | 2.4% |
| Self-Employed (Not Incorporated) | 7 | 16.7% |
| Not-for-profit Organizations | 4 | 9.5% |
| Local Government Employees | 0 | 0.0% |
| State Government Employees | 0 | 0.0% |
| Federal Government Employees | 0 | 0.0% |
| Unpaid Family Workers | 0 | 0.0% |
| Total | 42 | 100.0% |
Employment Status by Age in Springlake
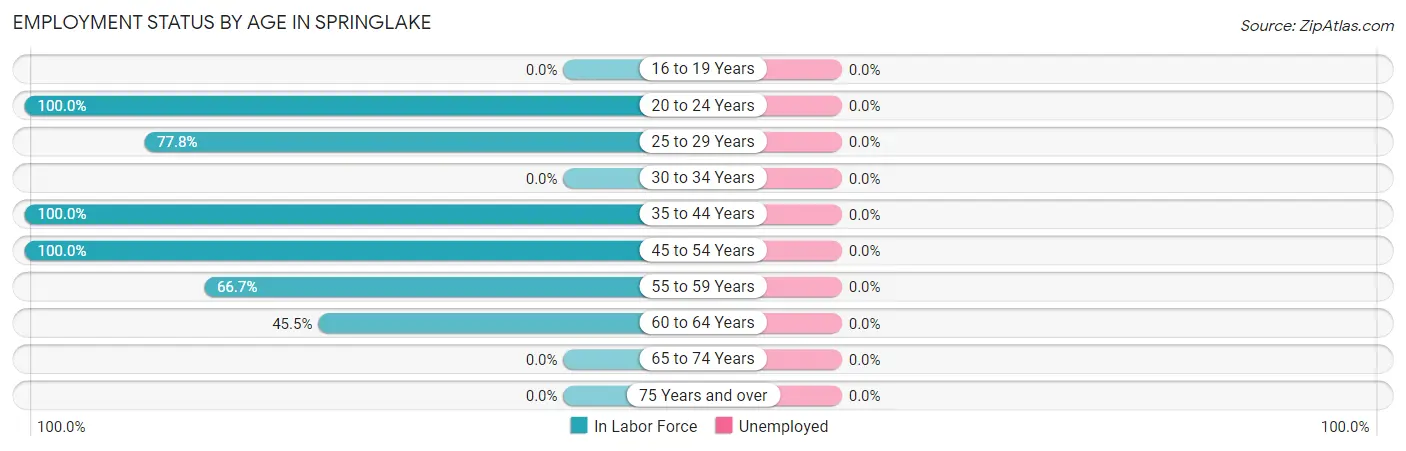
| Age Bracket | In Labor Force | Unemployed |
| 16 to 19 Years | 0 (0.0%) | 0 (0.0%) |
| 20 to 24 Years | 8 (100.0%) | 0 (0.0%) |
| 25 to 29 Years | 7 (77.8%) | 0 (0.0%) |
| 30 to 34 Years | 0 (0.0%) | 0 (0.0%) |
| 35 to 44 Years | 1 (100.0%) | 0 (0.0%) |
| 45 to 54 Years | 19 (100.0%) | 0 (0.0%) |
| 55 to 59 Years | 2 (66.7%) | 0 (0.0%) |
| 60 to 64 Years | 5 (45.5%) | 0 (0.0%) |
| 65 to 74 Years | 0 (0.0%) | 0 (0.0%) |
| 75 Years and over | 0 (0.0%) | 0 (0.0%) |
| Total | 42 (59.2%) | 0 (0.0%) |
Employment Status by Educational Attainment in Springlake
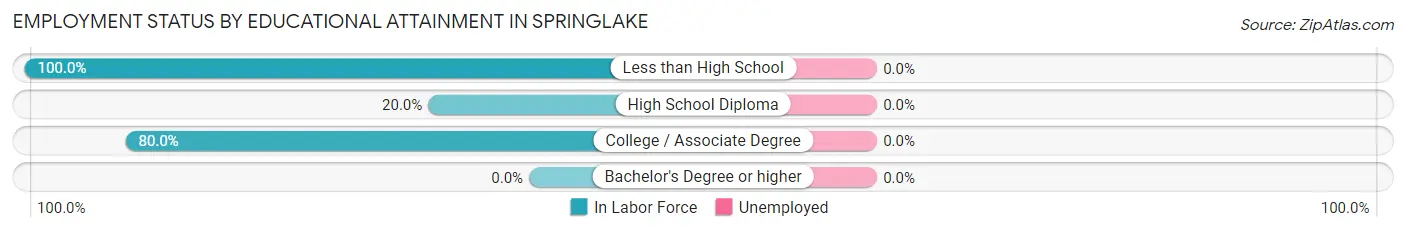
| Educational Attainment | In Labor Force | Unemployed |
| Less than High School | 28 (100.0%) | 0 (0.0%) |
| High School Diploma | 2 (20.0%) | 0 (0.0%) |
| College / Associate Degree | 4 (80.0%) | 0 (0.0%) |
| Bachelor's Degree or higher | 0 (0.0%) | 0 (0.0%) |
| Total | 34 (79.1%) | 0 (0.0%) |
Employment Occupations by Sex in Springlake
Management, Business, Science and Arts Occupations
The most common Management, Business, Science and Arts occupations in Springlake are , and Management (7 | 16.7%).
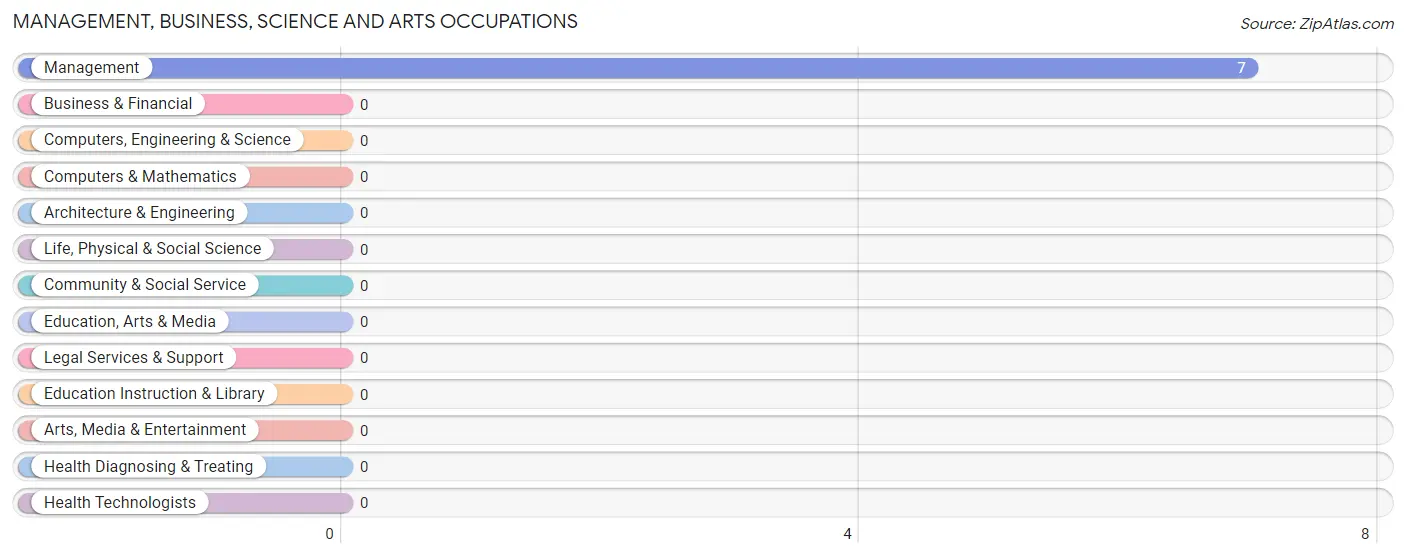
Management, Business, Science and Arts Occupations by Sex
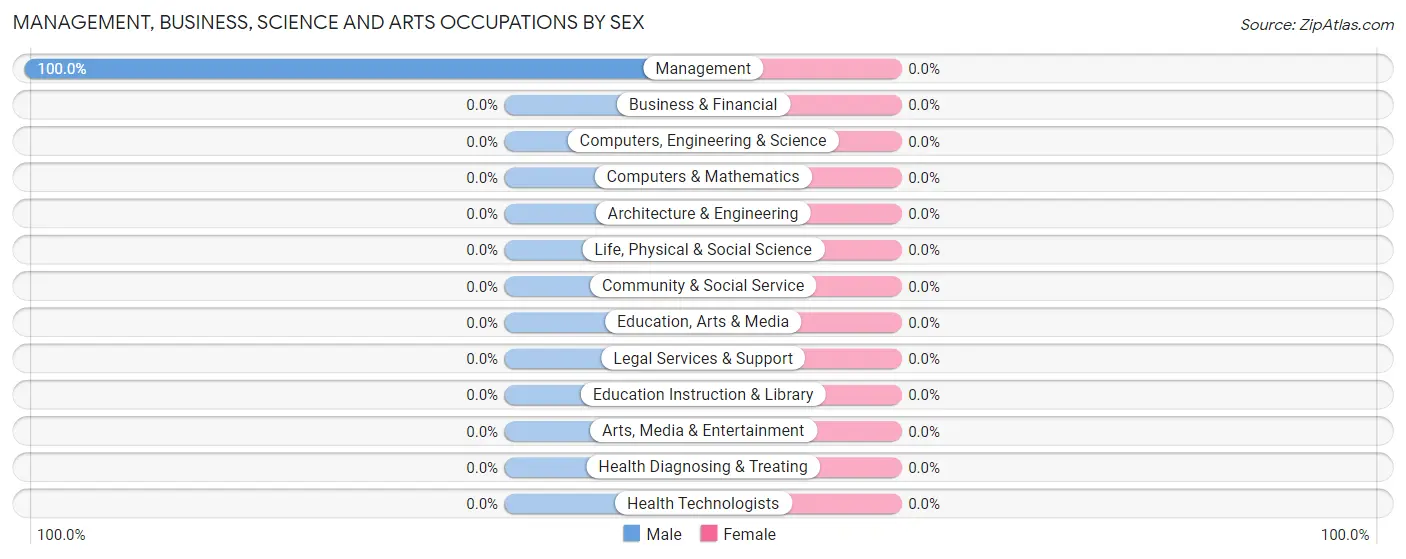
| Occupation | Male | Female |
| Management | 7 (100.0%) | 0 (0.0%) |
| Business & Financial | 0 (0.0%) | 0 (0.0%) |
| Computers, Engineering & Science | 0 (0.0%) | 0 (0.0%) |
| Computers & Mathematics | 0 (0.0%) | 0 (0.0%) |
| Architecture & Engineering | 0 (0.0%) | 0 (0.0%) |
| Life, Physical & Social Science | 0 (0.0%) | 0 (0.0%) |
| Community & Social Service | 0 (0.0%) | 0 (0.0%) |
| Education, Arts & Media | 0 (0.0%) | 0 (0.0%) |
| Legal Services & Support | 0 (0.0%) | 0 (0.0%) |
| Education Instruction & Library | 0 (0.0%) | 0 (0.0%) |
| Arts, Media & Entertainment | 0 (0.0%) | 0 (0.0%) |
| Health Diagnosing & Treating | 0 (0.0%) | 0 (0.0%) |
| Health Technologists | 0 (0.0%) | 0 (0.0%) |
| Total (Category) | 7 (100.0%) | 0 (0.0%) |
| Total (Overall) | 23 (54.8%) | 19 (45.2%) |
Services Occupations
The most common Services occupations in Springlake are Healthcare Support (10 | 23.8%), Personal Care & Service (7 | 16.7%), and Food Preparation & Serving (3 | 7.1%).
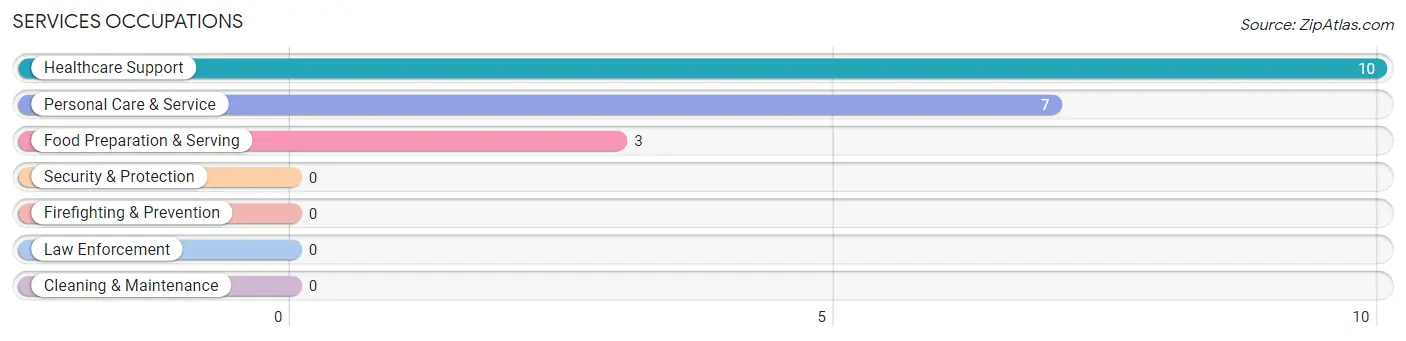
Services Occupations by Sex
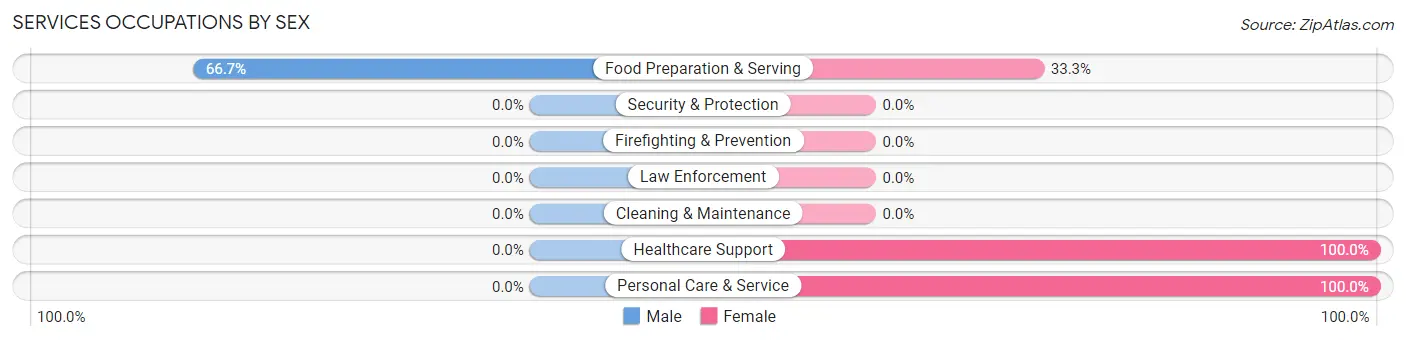
| Occupation | Male | Female |
| Healthcare Support | 0 (0.0%) | 10 (100.0%) |
| Security & Protection | 0 (0.0%) | 0 (0.0%) |
| Firefighting & Prevention | 0 (0.0%) | 0 (0.0%) |
| Law Enforcement | 0 (0.0%) | 0 (0.0%) |
| Food Preparation & Serving | 2 (66.7%) | 1 (33.3%) |
| Cleaning & Maintenance | 0 (0.0%) | 0 (0.0%) |
| Personal Care & Service | 0 (0.0%) | 7 (100.0%) |
| Total (Category) | 2 (10.0%) | 18 (90.0%) |
| Total (Overall) | 23 (54.8%) | 19 (45.2%) |
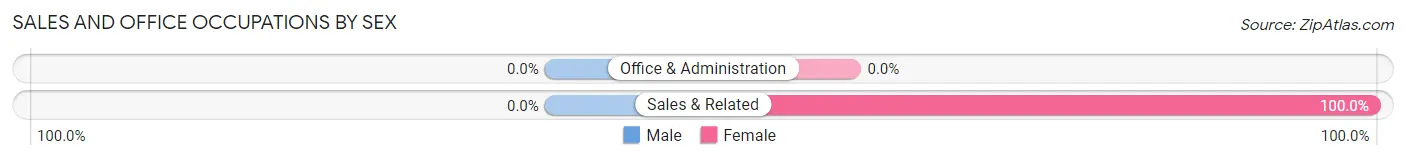
Sales and Office Occupations
The most common Sales and Office occupations in Springlake are , and Sales & Related (1 | 2.4%).
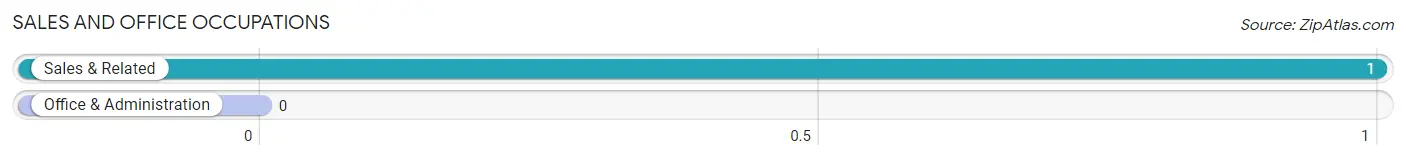
Sales and Office Occupations by Sex
| Occupation | Male | Female |
| Sales & Related | 0 (0.0%) | 1 (100.0%) |
| Office & Administration | 0 (0.0%) | 0 (0.0%) |
| Total (Category) | 0 (0.0%) | 1 (100.0%) |
| Total (Overall) | 23 (54.8%) | 19 (45.2%) |
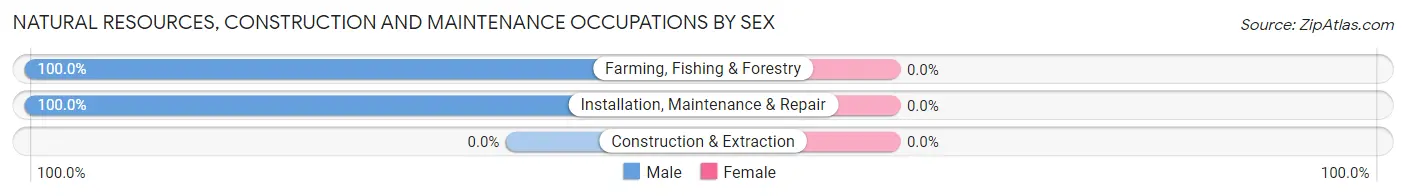
Natural Resources, Construction and Maintenance Occupations
The most common Natural Resources, Construction and Maintenance occupations in Springlake are Installation, Maintenance & Repair (8 | 19.1%), and Farming, Fishing & Forestry (6 | 14.3%).
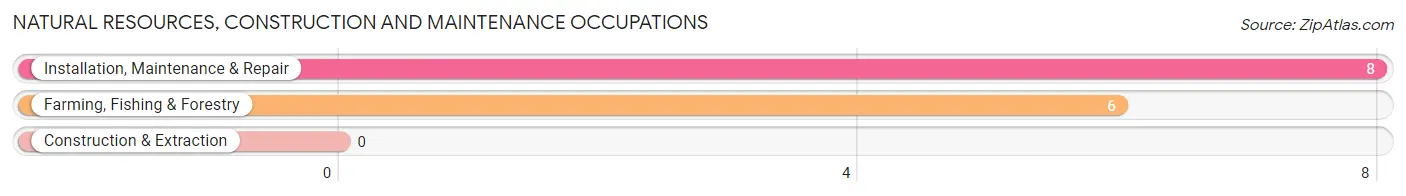
Natural Resources, Construction and Maintenance Occupations by Sex
| Occupation | Male | Female |
| Farming, Fishing & Forestry | 6 (100.0%) | 0 (0.0%) |
| Construction & Extraction | 0 (0.0%) | 0 (0.0%) |
| Installation, Maintenance & Repair | 8 (100.0%) | 0 (0.0%) |
| Total (Category) | 14 (100.0%) | 0 (0.0%) |
| Total (Overall) | 23 (54.8%) | 19 (45.2%) |
Production, Transportation and Moving Occupations
Production, Transportation and Moving Occupations by Sex
| Occupation | Male | Female |
| Production | 0 (0.0%) | 0 (0.0%) |
| Transportation | 0 (0.0%) | 0 (0.0%) |
| Material Moving | 0 (0.0%) | 0 (0.0%) |
| Total (Category) | 0 (0.0%) | 0 (0.0%) |
| Total (Overall) | 23 (54.8%) | 19 (45.2%) |
Employment Industries by Sex in Springlake
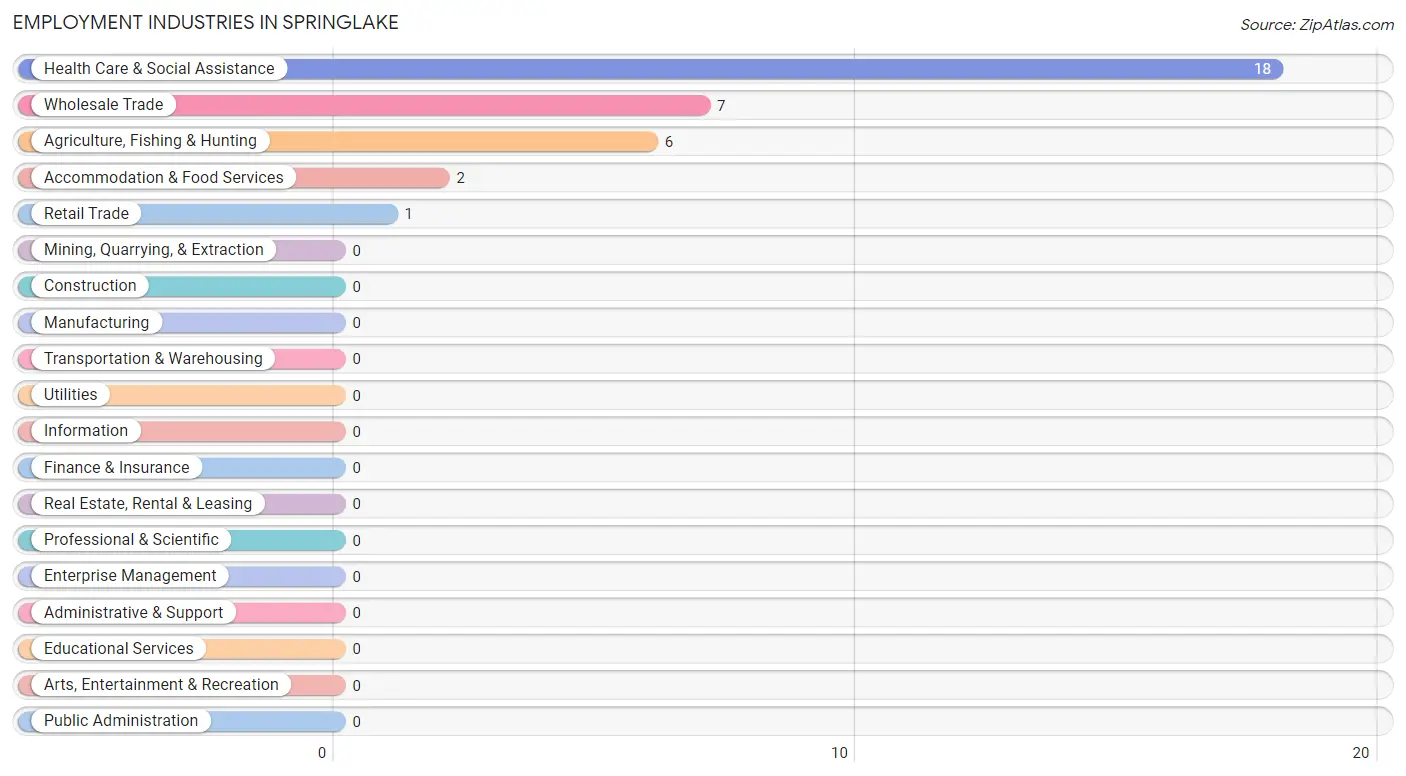
Employment Industries in Springlake
The major employment industries in Springlake include Health Care & Social Assistance (18 | 42.9%), Wholesale Trade (7 | 16.7%), Agriculture, Fishing & Hunting (6 | 14.3%), Accommodation & Food Services (2 | 4.8%), and Retail Trade (1 | 2.4%).
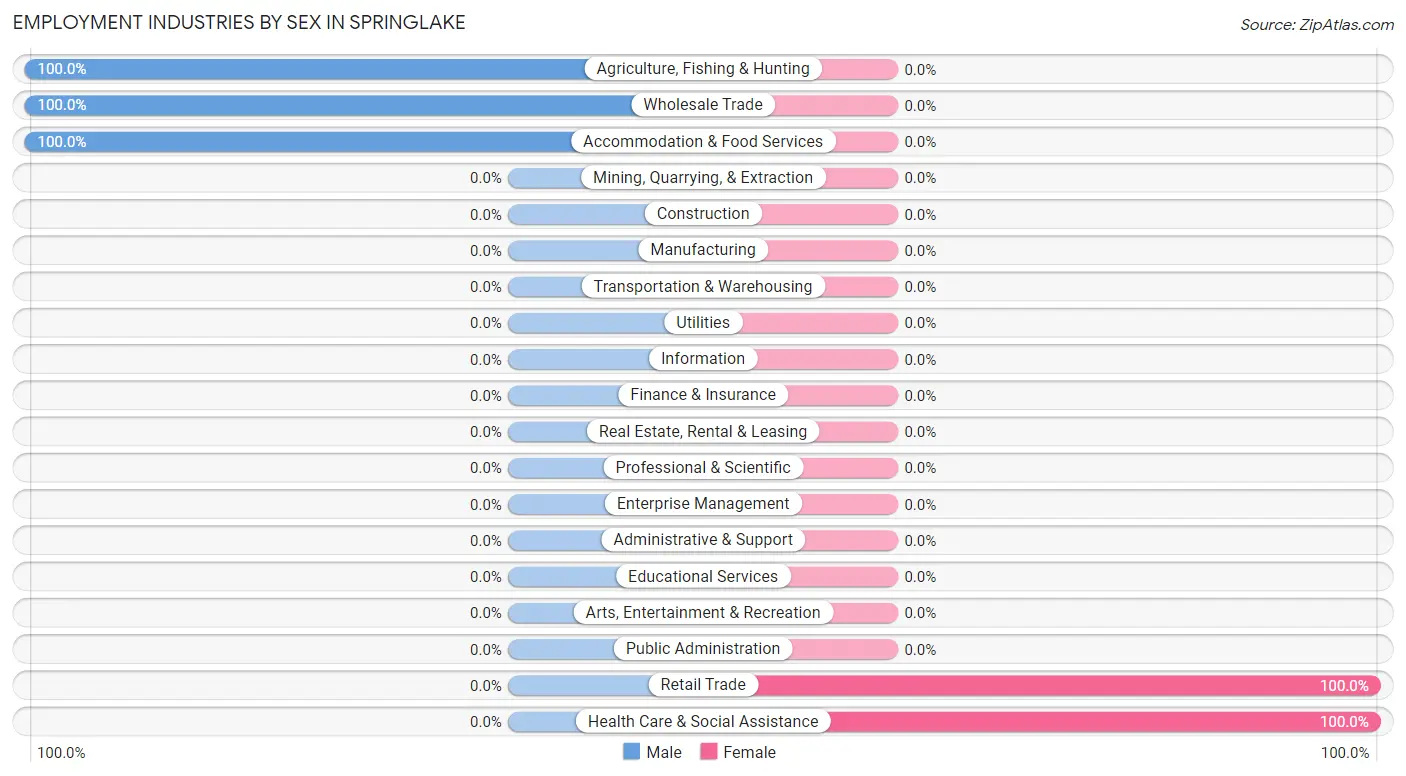
Employment Industries by Sex in Springlake
The Springlake industries that see more men than women are Agriculture, Fishing & Hunting (100.0%), Wholesale Trade (100.0%), and Accommodation & Food Services (100.0%), whereas the industries that tend to have a higher number of women are Retail Trade (100.0%), and Health Care & Social Assistance (100.0%).
| Industry | Male | Female |
| Agriculture, Fishing & Hunting | 6 (100.0%) | 0 (0.0%) |
| Mining, Quarrying, & Extraction | 0 (0.0%) | 0 (0.0%) |
| Construction | 0 (0.0%) | 0 (0.0%) |
| Manufacturing | 0 (0.0%) | 0 (0.0%) |
| Wholesale Trade | 7 (100.0%) | 0 (0.0%) |
| Retail Trade | 0 (0.0%) | 1 (100.0%) |
| Transportation & Warehousing | 0 (0.0%) | 0 (0.0%) |
| Utilities | 0 (0.0%) | 0 (0.0%) |
| Information | 0 (0.0%) | 0 (0.0%) |
| Finance & Insurance | 0 (0.0%) | 0 (0.0%) |
| Real Estate, Rental & Leasing | 0 (0.0%) | 0 (0.0%) |
| Professional & Scientific | 0 (0.0%) | 0 (0.0%) |
| Enterprise Management | 0 (0.0%) | 0 (0.0%) |
| Administrative & Support | 0 (0.0%) | 0 (0.0%) |
| Educational Services | 0 (0.0%) | 0 (0.0%) |
| Health Care & Social Assistance | 0 (0.0%) | 18 (100.0%) |
| Arts, Entertainment & Recreation | 0 (0.0%) | 0 (0.0%) |
| Accommodation & Food Services | 2 (100.0%) | 0 (0.0%) |
| Public Administration | 0 (0.0%) | 0 (0.0%) |
| Total | 23 (54.8%) | 19 (45.2%) |
Education in Springlake
School Enrollment in Springlake
The most common levels of schooling among the 24 students in Springlake are elementary school (18 | 75.0%), high school (4 | 16.7%), and middle school (2 | 8.3%).
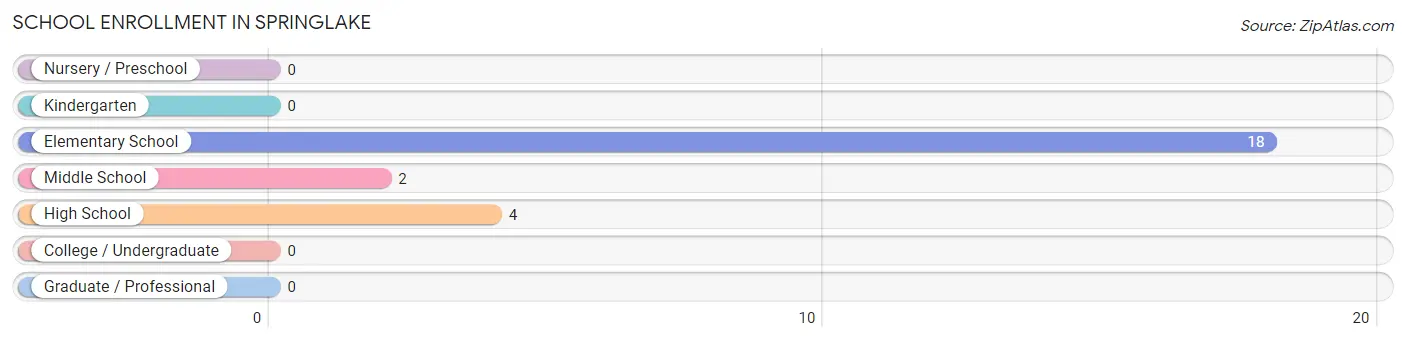
| School Level | # Students | % Students |
| Nursery / Preschool | 0 | 0.0% |
| Kindergarten | 0 | 0.0% |
| Elementary School | 18 | 75.0% |
| Middle School | 2 | 8.3% |
| High School | 4 | 16.7% |
| College / Undergraduate | 0 | 0.0% |
| Graduate / Professional | 0 | 0.0% |
| Total | 24 | 100.0% |
School Enrollment by Age by Funding Source in Springlake
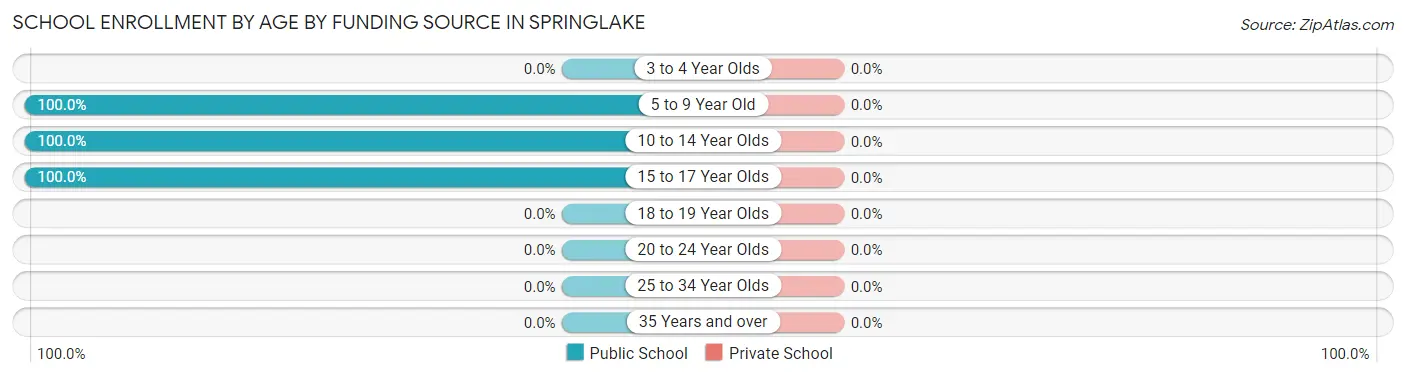
| Age Bracket | Public School | Private School |
| 3 to 4 Year Olds | 0 (0.0%) | 0 (0.0%) |
| 5 to 9 Year Old | 18 (100.0%) | 0 (0.0%) |
| 10 to 14 Year Olds | 2 (100.0%) | 0 (0.0%) |
| 15 to 17 Year Olds | 4 (100.0%) | 0 (0.0%) |
| 18 to 19 Year Olds | 0 (0.0%) | 0 (0.0%) |
| 20 to 24 Year Olds | 0 (0.0%) | 0 (0.0%) |
| 25 to 34 Year Olds | 0 (0.0%) | 0 (0.0%) |
| 35 Years and over | 0 (0.0%) | 0 (0.0%) |
| Total | 24 (100.0%) | 0 (0.0%) |
Educational Attainment by Field of Study in Springlake
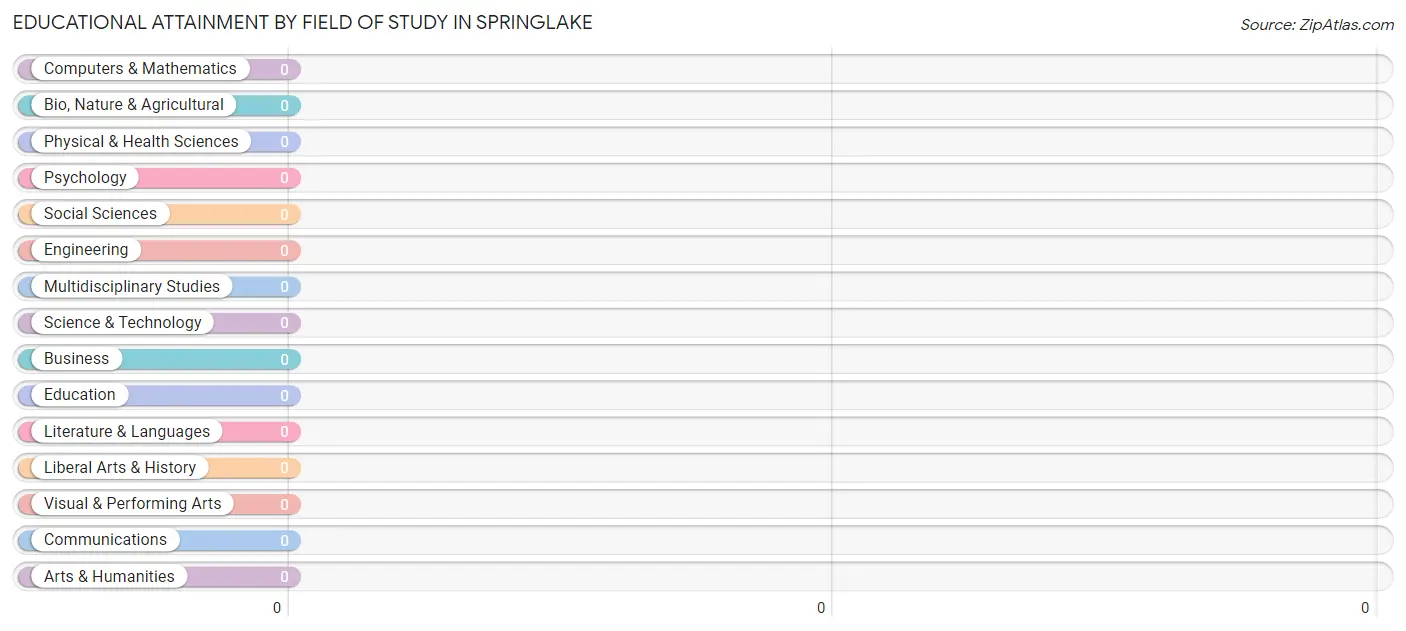
| Field of Study | # Graduates | % Graduates |
| Computers & Mathematics | 0 | 0.0% |
| Bio, Nature & Agricultural | 0 | 0.0% |
| Physical & Health Sciences | 0 | 0.0% |
| Psychology | 0 | 0.0% |
| Social Sciences | 0 | 0.0% |
| Engineering | 0 | 0.0% |
| Multidisciplinary Studies | 0 | 0.0% |
| Science & Technology | 0 | 0.0% |
| Business | 0 | 0.0% |
| Education | 0 | 0.0% |
| Literature & Languages | 0 | 0.0% |
| Liberal Arts & History | 0 | 0.0% |
| Visual & Performing Arts | 0 | 0.0% |
| Communications | 0 | 0.0% |
| Arts & Humanities | 0 | 0.0% |
| Total | 0 | 0.0% |
Transportation & Commute in Springlake
Vehicle Availability by Sex in Springlake
The most prevalent vehicle ownership categories in Springlake are males with 3 vehicles (14, accounting for 60.9%) and females with 3 vehicles (8, making up 73.7%).
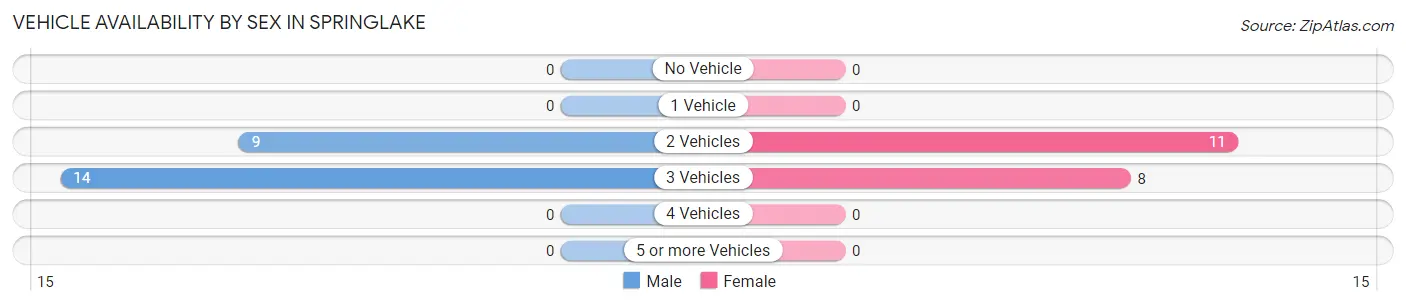
| Vehicles Available | Male | Female |
| No Vehicle | 0 (0.0%) | 0 (0.0%) |
| 1 Vehicle | 0 (0.0%) | 0 (0.0%) |
| 2 Vehicles | 9 (39.1%) | 11 (57.9%) |
| 3 Vehicles | 14 (60.9%) | 8 (42.1%) |
| 4 Vehicles | 0 (0.0%) | 0 (0.0%) |
| 5 or more Vehicles | 0 (0.0%) | 0 (0.0%) |
| Total | 23 (100.0%) | 19 (100.0%) |
Commute Time in Springlake
The most frequently occuring commute durations in Springlake are 15 to 19 minutes (18 commuters, 51.4%), less than 5 minutes (10 commuters, 28.6%), and 10 to 14 minutes (5 commuters, 14.3%).
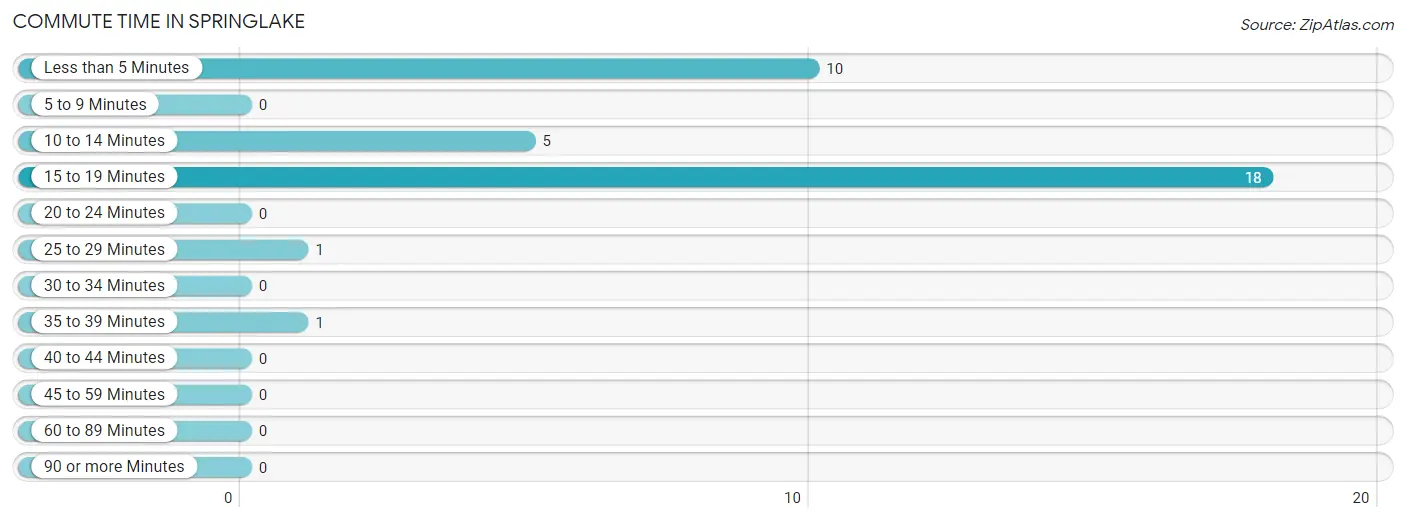
| Commute Time | # Commuters | % Commuters |
| Less than 5 Minutes | 10 | 28.6% |
| 5 to 9 Minutes | 0 | 0.0% |
| 10 to 14 Minutes | 5 | 14.3% |
| 15 to 19 Minutes | 18 | 51.4% |
| 20 to 24 Minutes | 0 | 0.0% |
| 25 to 29 Minutes | 1 | 2.9% |
| 30 to 34 Minutes | 0 | 0.0% |
| 35 to 39 Minutes | 1 | 2.9% |
| 40 to 44 Minutes | 0 | 0.0% |
| 45 to 59 Minutes | 0 | 0.0% |
| 60 to 89 Minutes | 0 | 0.0% |
| 90 or more Minutes | 0 | 0.0% |
Commute Time by Sex in Springlake
The most common commute times in Springlake are less than 5 minutes (10 commuters, 43.5%) for males and 15 to 19 minutes (10 commuters, 83.3%) for females.
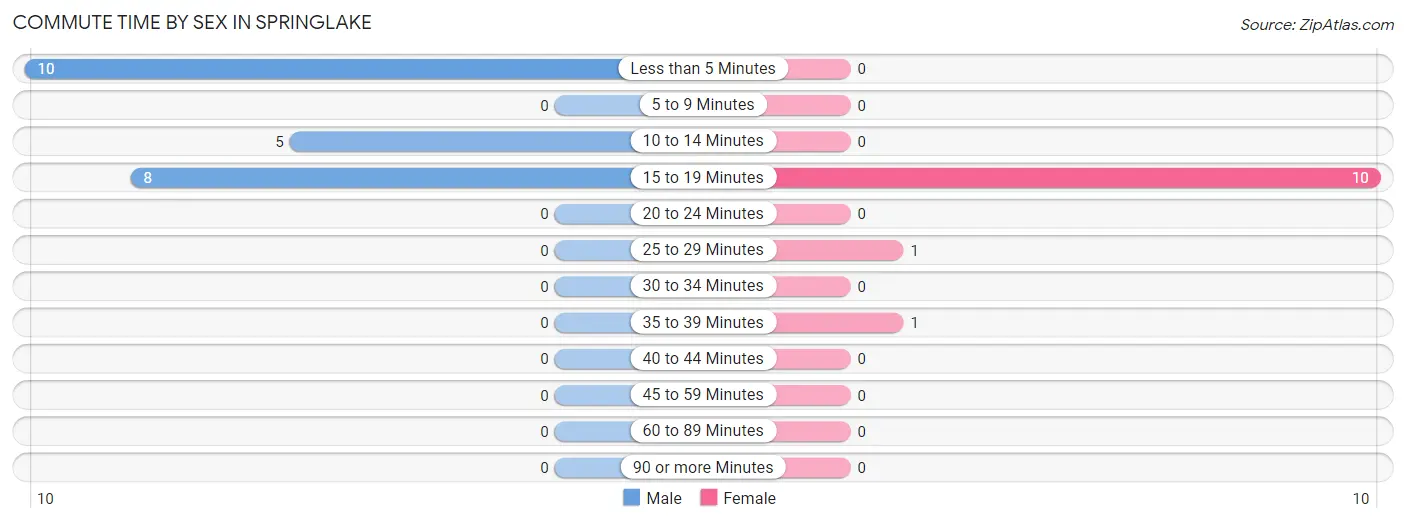
| Commute Time | Male | Female |
| Less than 5 Minutes | 10 (43.5%) | 0 (0.0%) |
| 5 to 9 Minutes | 0 (0.0%) | 0 (0.0%) |
| 10 to 14 Minutes | 5 (21.7%) | 0 (0.0%) |
| 15 to 19 Minutes | 8 (34.8%) | 10 (83.3%) |
| 20 to 24 Minutes | 0 (0.0%) | 0 (0.0%) |
| 25 to 29 Minutes | 0 (0.0%) | 1 (8.3%) |
| 30 to 34 Minutes | 0 (0.0%) | 0 (0.0%) |
| 35 to 39 Minutes | 0 (0.0%) | 1 (8.3%) |
| 40 to 44 Minutes | 0 (0.0%) | 0 (0.0%) |
| 45 to 59 Minutes | 0 (0.0%) | 0 (0.0%) |
| 60 to 89 Minutes | 0 (0.0%) | 0 (0.0%) |
| 90 or more Minutes | 0 (0.0%) | 0 (0.0%) |
Time of Departure to Work by Sex in Springlake
The most frequent times of departure to work in Springlake are 7:30 AM to 7:59 AM (9, 39.1%) for males and 8:30 AM to 8:59 AM (10, 83.3%) for females.
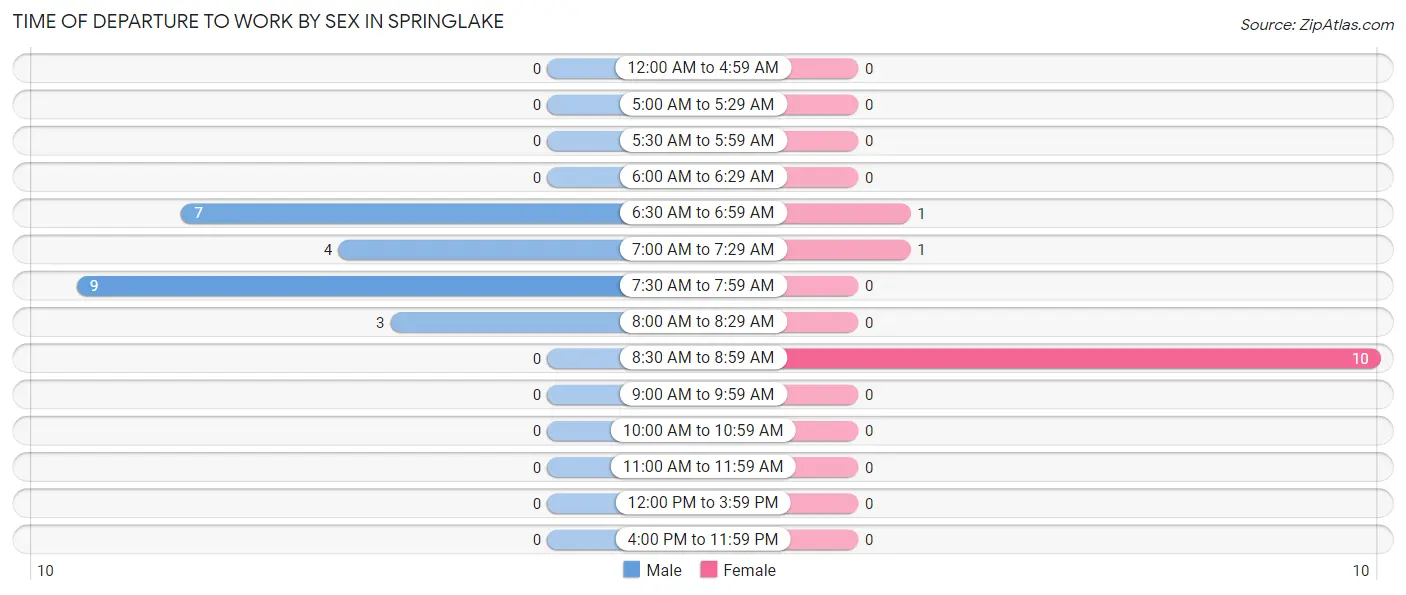
| Time of Departure | Male | Female |
| 12:00 AM to 4:59 AM | 0 (0.0%) | 0 (0.0%) |
| 5:00 AM to 5:29 AM | 0 (0.0%) | 0 (0.0%) |
| 5:30 AM to 5:59 AM | 0 (0.0%) | 0 (0.0%) |
| 6:00 AM to 6:29 AM | 0 (0.0%) | 0 (0.0%) |
| 6:30 AM to 6:59 AM | 7 (30.4%) | 1 (8.3%) |
| 7:00 AM to 7:29 AM | 4 (17.4%) | 1 (8.3%) |
| 7:30 AM to 7:59 AM | 9 (39.1%) | 0 (0.0%) |
| 8:00 AM to 8:29 AM | 3 (13.0%) | 0 (0.0%) |
| 8:30 AM to 8:59 AM | 0 (0.0%) | 10 (83.3%) |
| 9:00 AM to 9:59 AM | 0 (0.0%) | 0 (0.0%) |
| 10:00 AM to 10:59 AM | 0 (0.0%) | 0 (0.0%) |
| 11:00 AM to 11:59 AM | 0 (0.0%) | 0 (0.0%) |
| 12:00 PM to 3:59 PM | 0 (0.0%) | 0 (0.0%) |
| 4:00 PM to 11:59 PM | 0 (0.0%) | 0 (0.0%) |
| Total | 23 (100.0%) | 12 (100.0%) |
Housing Occupancy in Springlake
Occupancy by Ownership in Springlake
Of the total 27 dwellings in Springlake, owner-occupied units account for 25 (92.6%), while renter-occupied units make up 2 (7.4%).
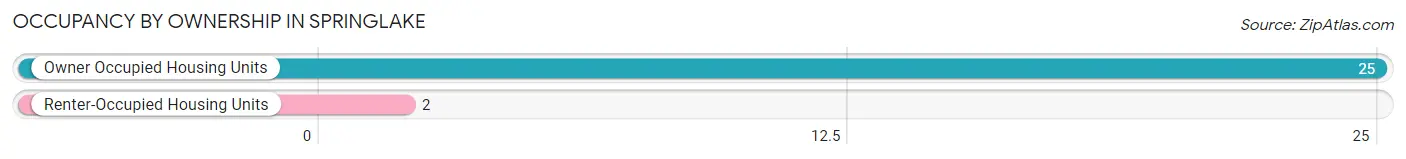
| Occupancy | # Housing Units | % Housing Units |
| Owner Occupied Housing Units | 25 | 92.6% |
| Renter-Occupied Housing Units | 2 | 7.4% |
| Total Occupied Housing Units | 27 | 100.0% |
Occupancy by Household Size in Springlake
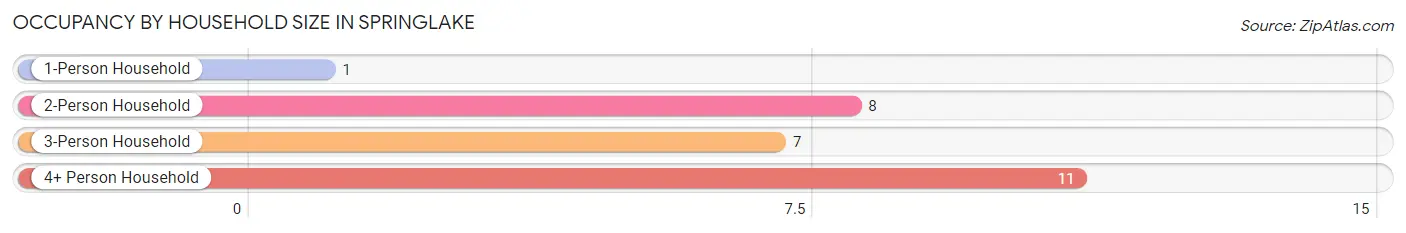
| Household Size | # Housing Units | % Housing Units |
| 1-Person Household | 1 | 3.7% |
| 2-Person Household | 8 | 29.6% |
| 3-Person Household | 7 | 25.9% |
| 4+ Person Household | 11 | 40.7% |
| Total Housing Units | 27 | 100.0% |
Occupancy by Ownership by Household Size in Springlake
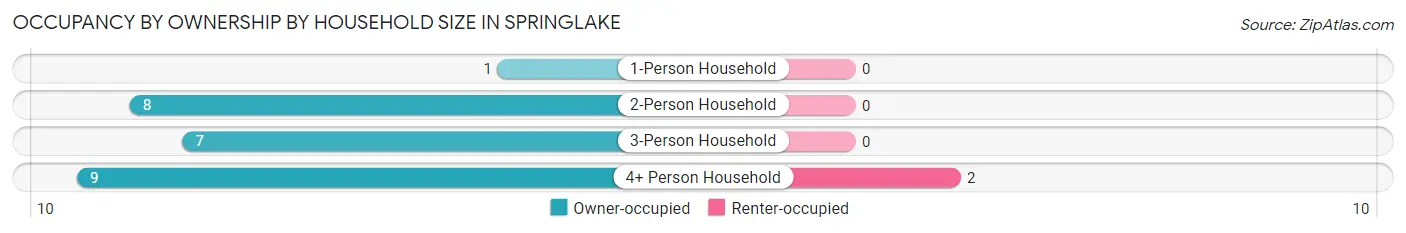
| Household Size | Owner-occupied | Renter-occupied |
| 1-Person Household | 1 (100.0%) | 0 (0.0%) |
| 2-Person Household | 8 (100.0%) | 0 (0.0%) |
| 3-Person Household | 7 (100.0%) | 0 (0.0%) |
| 4+ Person Household | 9 (81.8%) | 2 (18.2%) |
| Total Housing Units | 25 (92.6%) | 2 (7.4%) |
Occupancy by Educational Attainment in Springlake
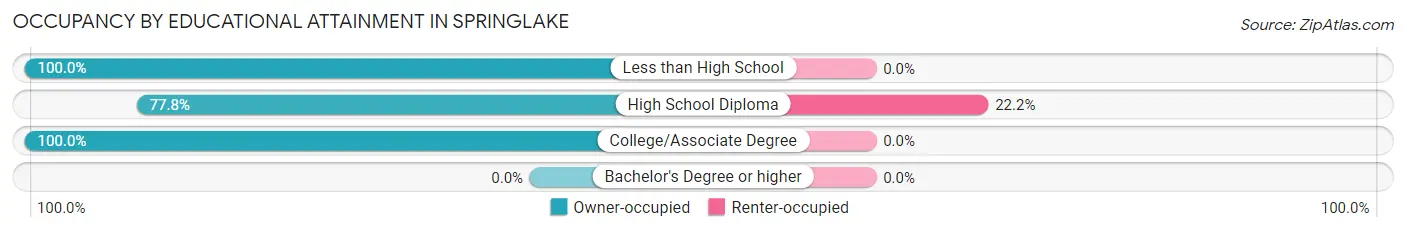
| Household Size | Owner-occupied | Renter-occupied |
| Less than High School | 17 (100.0%) | 0 (0.0%) |
| High School Diploma | 7 (77.8%) | 2 (22.2%) |
| College/Associate Degree | 1 (100.0%) | 0 (0.0%) |
| Bachelor's Degree or higher | 0 (0.0%) | 0 (0.0%) |
Occupancy by Age of Householder in Springlake
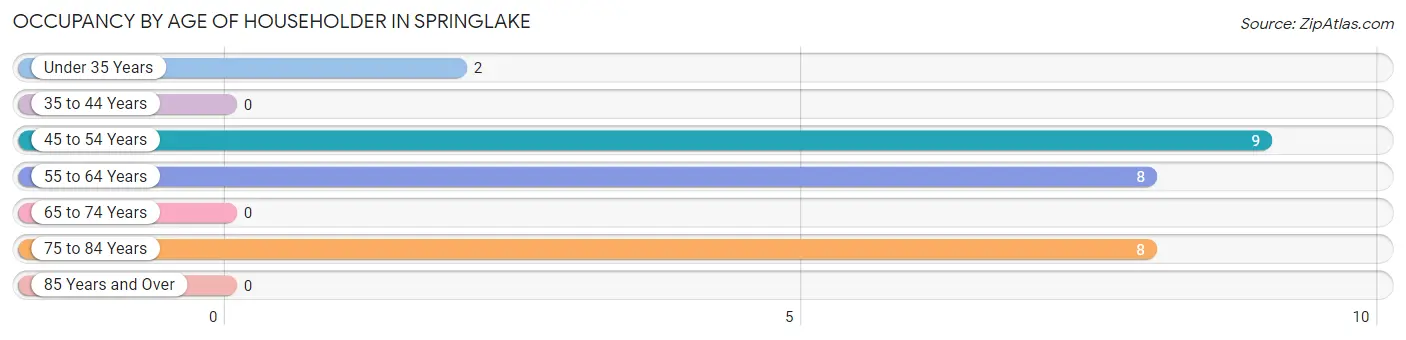
| Age Bracket | # Households | % Households |
| Under 35 Years | 2 | 7.4% |
| 35 to 44 Years | 0 | 0.0% |
| 45 to 54 Years | 9 | 33.3% |
| 55 to 64 Years | 8 | 29.6% |
| 65 to 74 Years | 0 | 0.0% |
| 75 to 84 Years | 8 | 29.6% |
| 85 Years and Over | 0 | 0.0% |
| Total | 27 | 100.0% |
Housing Finances in Springlake
Median Income by Occupancy in Springlake
| Occupancy Type | # Households | Median Income |
| Owner-Occupied | 25 (92.6%) | $0 |
| Renter-Occupied | 2 (7.4%) | $0 |
| Average | 27 (100.0%) | $0 |
Occupancy by Householder Income Bracket in Springlake
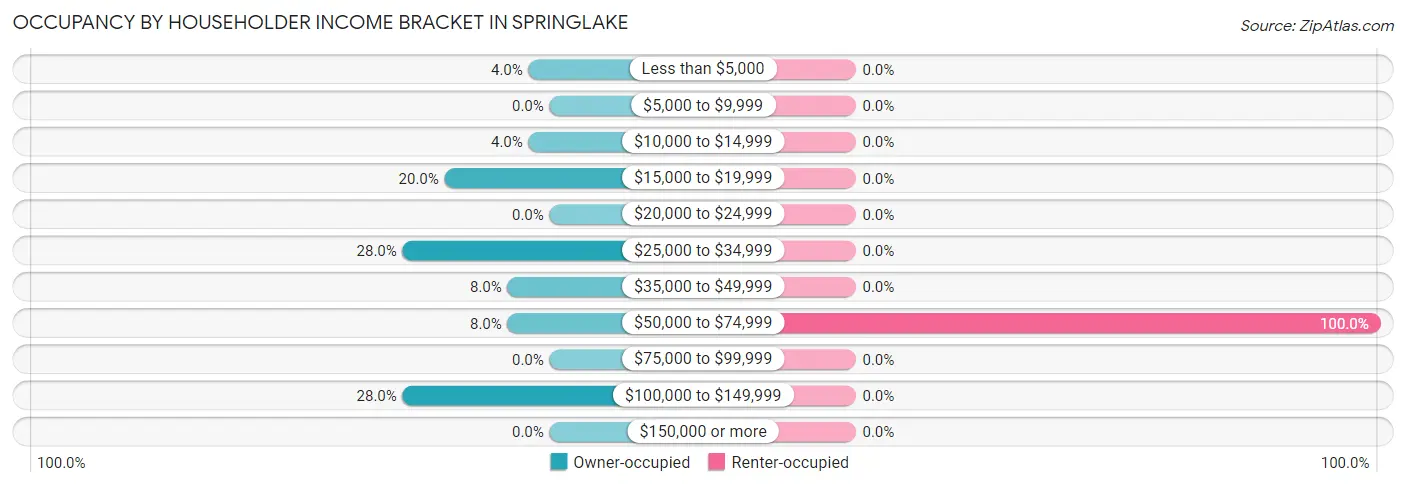
| Income Bracket | Owner-occupied | Renter-occupied |
| Less than $5,000 | 1 (4.0%) | 0 (0.0%) |
| $5,000 to $9,999 | 0 (0.0%) | 0 (0.0%) |
| $10,000 to $14,999 | 1 (4.0%) | 0 (0.0%) |
| $15,000 to $19,999 | 5 (20.0%) | 0 (0.0%) |
| $20,000 to $24,999 | 0 (0.0%) | 0 (0.0%) |
| $25,000 to $34,999 | 7 (28.0%) | 0 (0.0%) |
| $35,000 to $49,999 | 2 (8.0%) | 0 (0.0%) |
| $50,000 to $74,999 | 2 (8.0%) | 2 (100.0%) |
| $75,000 to $99,999 | 0 (0.0%) | 0 (0.0%) |
| $100,000 to $149,999 | 7 (28.0%) | 0 (0.0%) |
| $150,000 or more | 0 (0.0%) | 0 (0.0%) |
| Total | 25 (100.0%) | 2 (100.0%) |
Monthly Housing Cost Tiers in Springlake
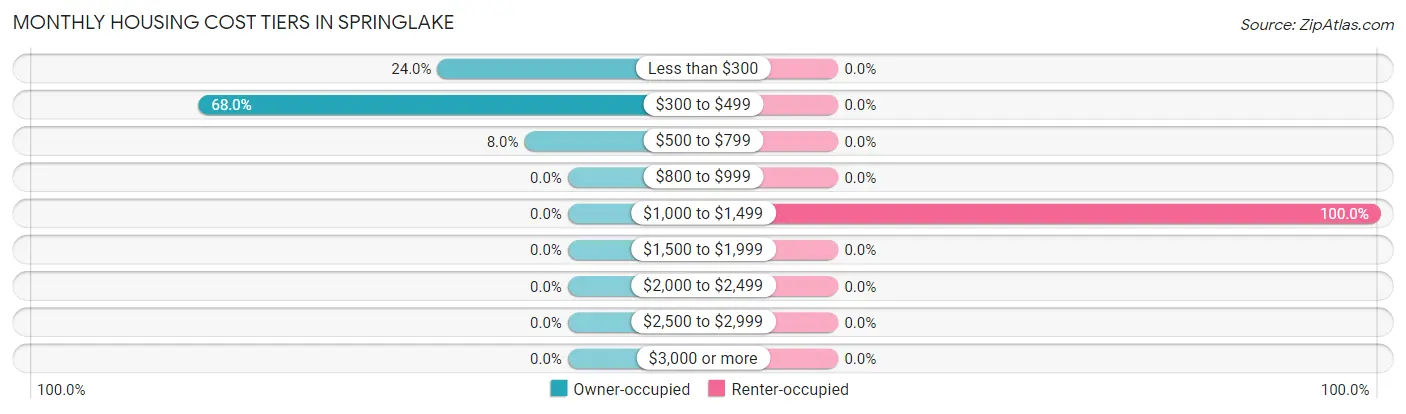
| Monthly Cost | Owner-occupied | Renter-occupied |
| Less than $300 | 6 (24.0%) | 0 (0.0%) |
| $300 to $499 | 17 (68.0%) | 0 (0.0%) |
| $500 to $799 | 2 (8.0%) | 0 (0.0%) |
| $800 to $999 | 0 (0.0%) | 0 (0.0%) |
| $1,000 to $1,499 | 0 (0.0%) | 2 (100.0%) |
| $1,500 to $1,999 | 0 (0.0%) | 0 (0.0%) |
| $2,000 to $2,499 | 0 (0.0%) | 0 (0.0%) |
| $2,500 to $2,999 | 0 (0.0%) | 0 (0.0%) |
| $3,000 or more | 0 (0.0%) | 0 (0.0%) |
| Total | 25 (100.0%) | 2 (100.0%) |
Physical Housing Characteristics in Springlake
Housing Structures in Springlake
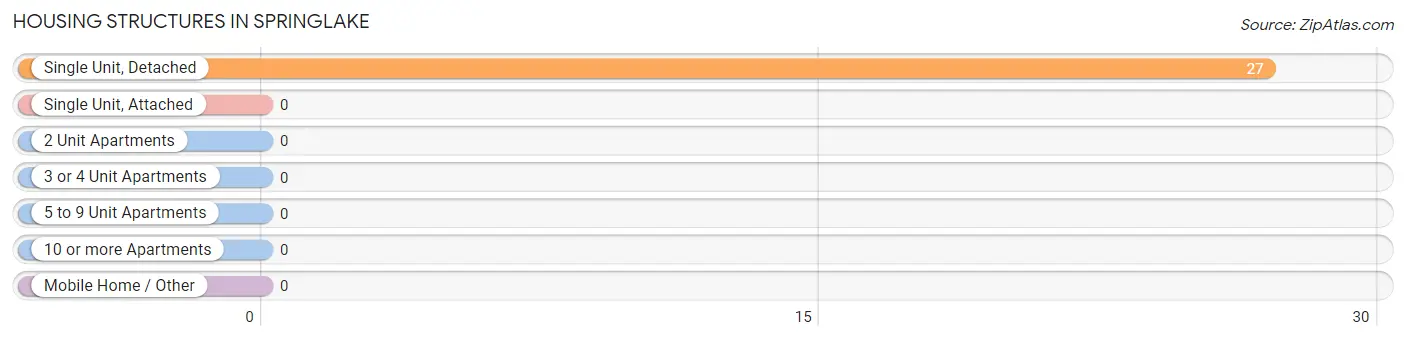
| Structure Type | # Housing Units | % Housing Units |
| Single Unit, Detached | 27 | 100.0% |
| Single Unit, Attached | 0 | 0.0% |
| 2 Unit Apartments | 0 | 0.0% |
| 3 or 4 Unit Apartments | 0 | 0.0% |
| 5 to 9 Unit Apartments | 0 | 0.0% |
| 10 or more Apartments | 0 | 0.0% |
| Mobile Home / Other | 0 | 0.0% |
| Total | 27 | 100.0% |
Housing Structures by Occupancy in Springlake
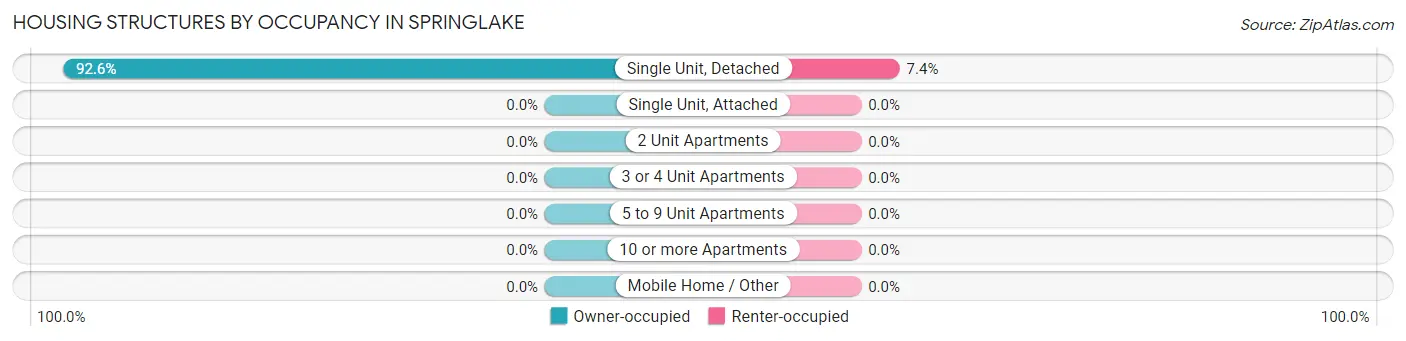
| Structure Type | Owner-occupied | Renter-occupied |
| Single Unit, Detached | 25 (92.6%) | 2 (7.4%) |
| Single Unit, Attached | 0 (0.0%) | 0 (0.0%) |
| 2 Unit Apartments | 0 (0.0%) | 0 (0.0%) |
| 3 or 4 Unit Apartments | 0 (0.0%) | 0 (0.0%) |
| 5 to 9 Unit Apartments | 0 (0.0%) | 0 (0.0%) |
| 10 or more Apartments | 0 (0.0%) | 0 (0.0%) |
| Mobile Home / Other | 0 (0.0%) | 0 (0.0%) |
| Total | 25 (92.6%) | 2 (7.4%) |
Housing Structures by Number of Rooms in Springlake
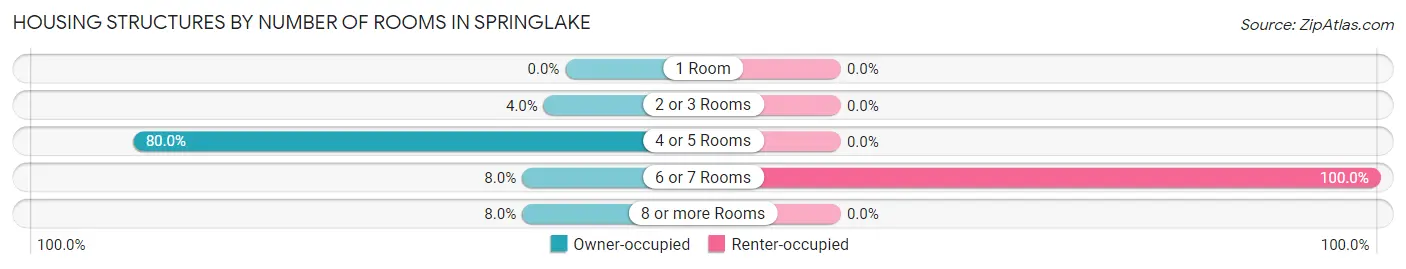
| Number of Rooms | Owner-occupied | Renter-occupied |
| 1 Room | 0 (0.0%) | 0 (0.0%) |
| 2 or 3 Rooms | 1 (4.0%) | 0 (0.0%) |
| 4 or 5 Rooms | 20 (80.0%) | 0 (0.0%) |
| 6 or 7 Rooms | 2 (8.0%) | 2 (100.0%) |
| 8 or more Rooms | 2 (8.0%) | 0 (0.0%) |
| Total | 25 (100.0%) | 2 (100.0%) |
Housing Structure by Heating Type in Springlake
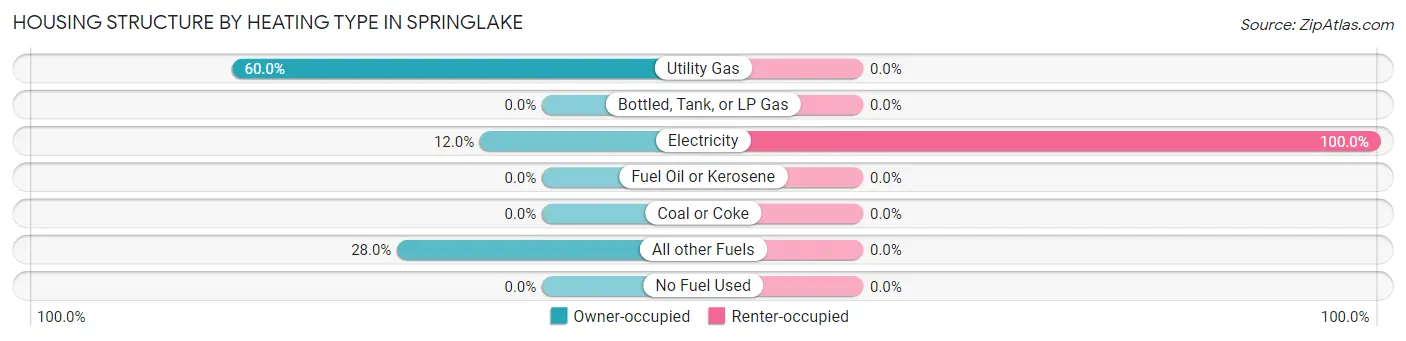
| Heating Type | Owner-occupied | Renter-occupied |
| Utility Gas | 15 (60.0%) | 0 (0.0%) |
| Bottled, Tank, or LP Gas | 0 (0.0%) | 0 (0.0%) |
| Electricity | 3 (12.0%) | 2 (100.0%) |
| Fuel Oil or Kerosene | 0 (0.0%) | 0 (0.0%) |
| Coal or Coke | 0 (0.0%) | 0 (0.0%) |
| All other Fuels | 7 (28.0%) | 0 (0.0%) |
| No Fuel Used | 0 (0.0%) | 0 (0.0%) |
| Total | 25 (100.0%) | 2 (100.0%) |
Household Vehicle Usage in Springlake
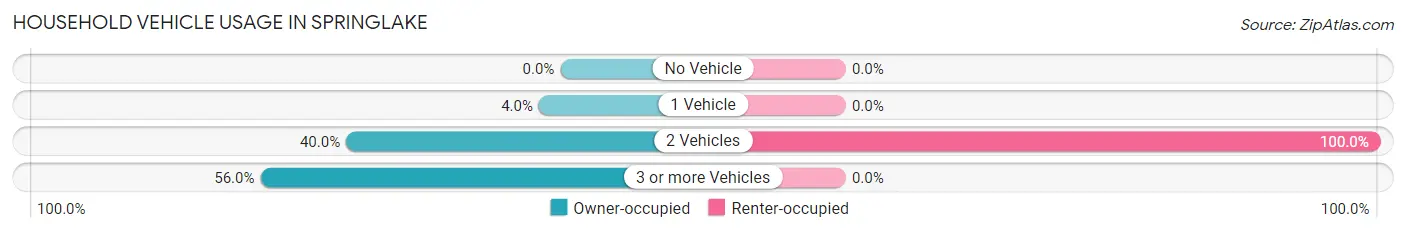
| Vehicles per Household | Owner-occupied | Renter-occupied |
| No Vehicle | 0 (0.0%) | 0 (0.0%) |
| 1 Vehicle | 1 (4.0%) | 0 (0.0%) |
| 2 Vehicles | 10 (40.0%) | 2 (100.0%) |
| 3 or more Vehicles | 14 (56.0%) | 0 (0.0%) |
| Total | 25 (100.0%) | 2 (100.0%) |
Real Estate & Mortgages in Springlake
Real Estate and Mortgage Overview in Springlake
| Characteristic | Without Mortgage | With Mortgage |
| Housing Units | 25 | 0 |
| Median Property Value | - | - |
| Median Household Income | - | - |
| Monthly Housing Costs | $336 | $0 |
| Real Estate Taxes | - | - |
Property Value by Mortgage Status in Springlake
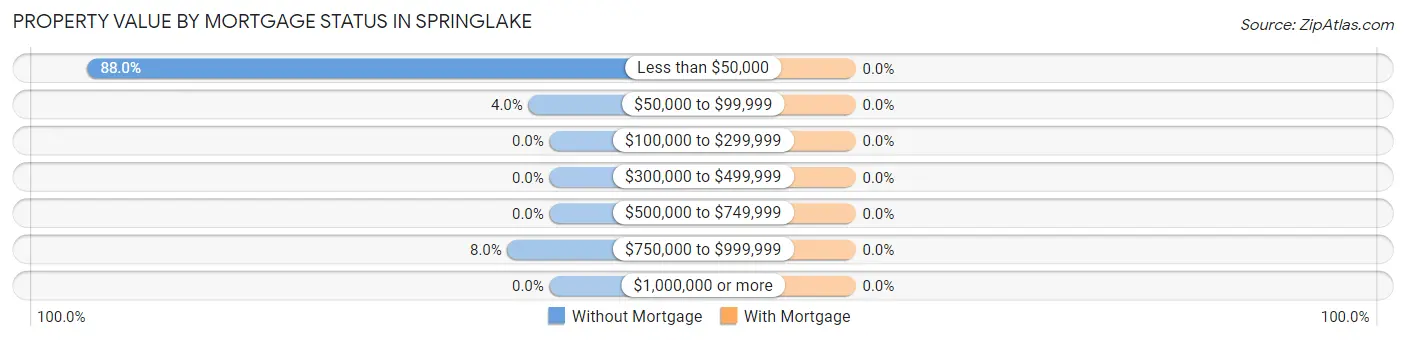
| Property Value | Without Mortgage | With Mortgage |
| Less than $50,000 | 22 (88.0%) | 0 (0.0%) |
| $50,000 to $99,999 | 1 (4.0%) | 0 (0.0%) |
| $100,000 to $299,999 | 0 (0.0%) | 0 (0.0%) |
| $300,000 to $499,999 | 0 (0.0%) | 0 (0.0%) |
| $500,000 to $749,999 | 0 (0.0%) | 0 (0.0%) |
| $750,000 to $999,999 | 2 (8.0%) | 0 (0.0%) |
| $1,000,000 or more | 0 (0.0%) | 0 (0.0%) |
| Total | 25 (100.0%) | 0 (0.0%) |
Household Income by Mortgage Status in Springlake
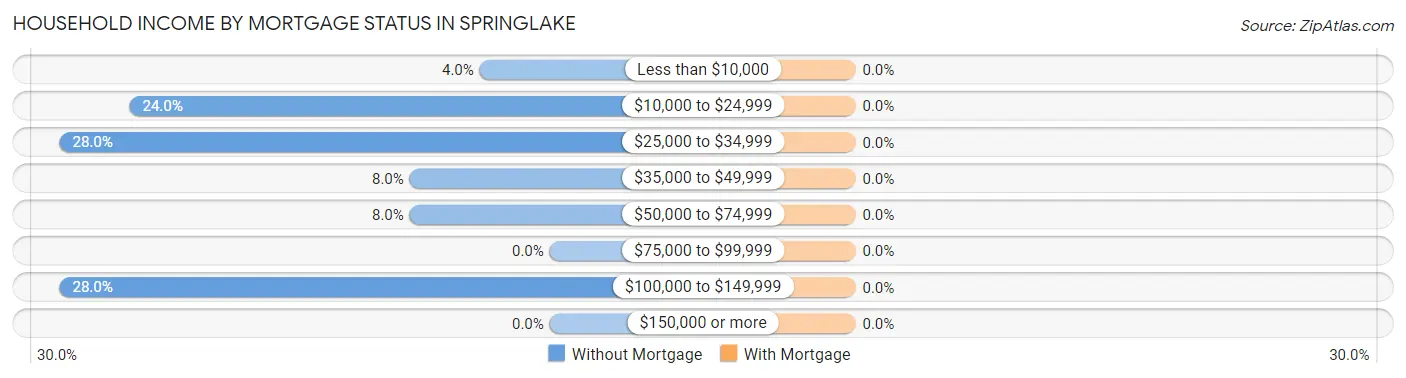
| Household Income | Without Mortgage | With Mortgage |
| Less than $10,000 | 1 (4.0%) | 0 (0.0%) |
| $10,000 to $24,999 | 6 (24.0%) | 0 (0.0%) |
| $25,000 to $34,999 | 7 (28.0%) | 0 (0.0%) |
| $35,000 to $49,999 | 2 (8.0%) | 0 (0.0%) |
| $50,000 to $74,999 | 2 (8.0%) | 0 (0.0%) |
| $75,000 to $99,999 | 0 (0.0%) | 0 (0.0%) |
| $100,000 to $149,999 | 7 (28.0%) | 0 (0.0%) |
| $150,000 or more | 0 (0.0%) | 0 (0.0%) |
| Total | 25 (100.0%) | 0 (0.0%) |
Property Value to Household Income Ratio in Springlake
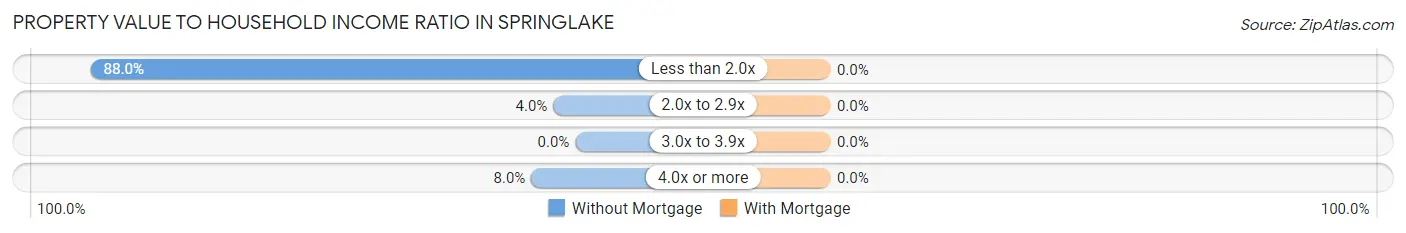
| Value-to-Income Ratio | Without Mortgage | With Mortgage |
| Less than 2.0x | 22 (88.0%) | 0 (0.0%) |
| 2.0x to 2.9x | 1 (4.0%) | 0 (0.0%) |
| 3.0x to 3.9x | 0 (0.0%) | 0 (0.0%) |
| 4.0x or more | 2 (8.0%) | 0 (0.0%) |
| Total | 25 (100.0%) | 0 (0.0%) |
Real Estate Taxes by Mortgage Status in Springlake
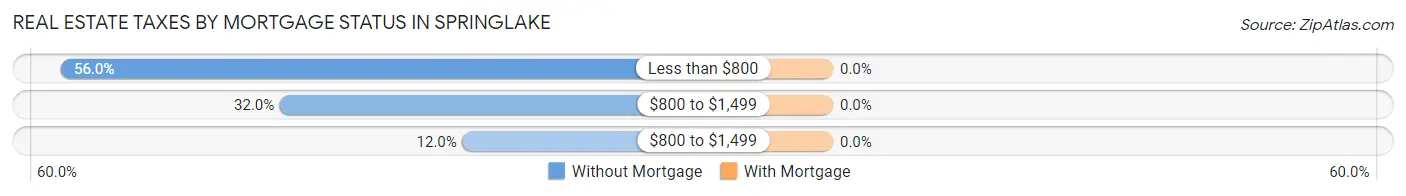
| Property Taxes | Without Mortgage | With Mortgage |
| Less than $800 | 14 (56.0%) | 0 (0.0%) |
| $800 to $1,499 | 8 (32.0%) | 0 (0.0%) |
| $800 to $1,499 | 3 (12.0%) | 0 (0.0%) |
| Total | 25 (100.0%) | 0 (0.0%) |
Health & Disability in Springlake
Health Insurance Coverage by Age in Springlake
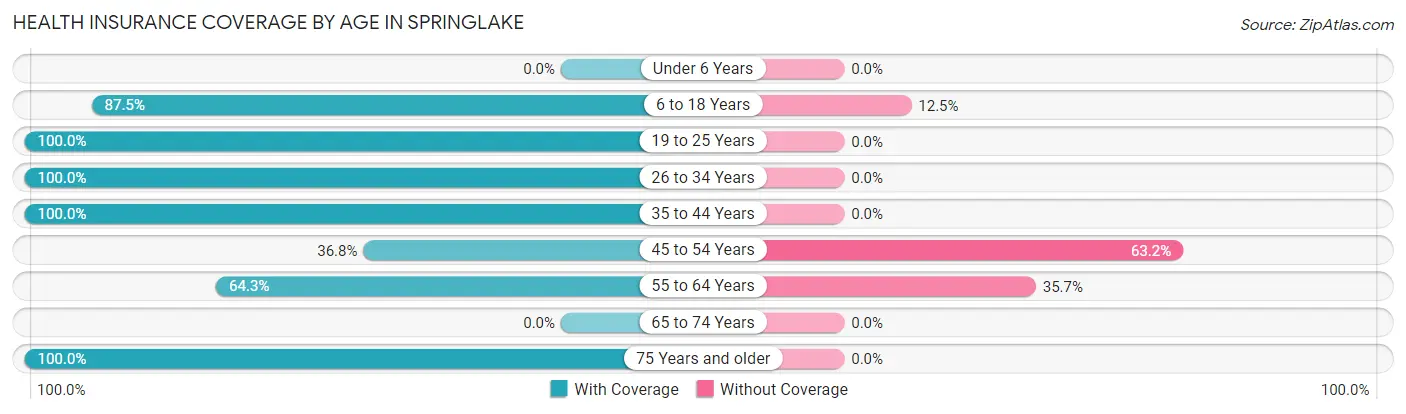
| Age Bracket | With Coverage | Without Coverage |
| Under 6 Years | 0 (0.0%) | 0 (0.0%) |
| 6 to 18 Years | 21 (87.5%) | 3 (12.5%) |
| 19 to 25 Years | 8 (100.0%) | 0 (0.0%) |
| 26 to 34 Years | 9 (100.0%) | 0 (0.0%) |
| 35 to 44 Years | 1 (100.0%) | 0 (0.0%) |
| 45 to 54 Years | 7 (36.8%) | 12 (63.2%) |
| 55 to 64 Years | 9 (64.3%) | 5 (35.7%) |
| 65 to 74 Years | 0 (0.0%) | 0 (0.0%) |
| 75 Years and older | 16 (100.0%) | 0 (0.0%) |
| Total | 71 (78.0%) | 20 (22.0%) |
Health Insurance Coverage by Citizenship Status in Springlake
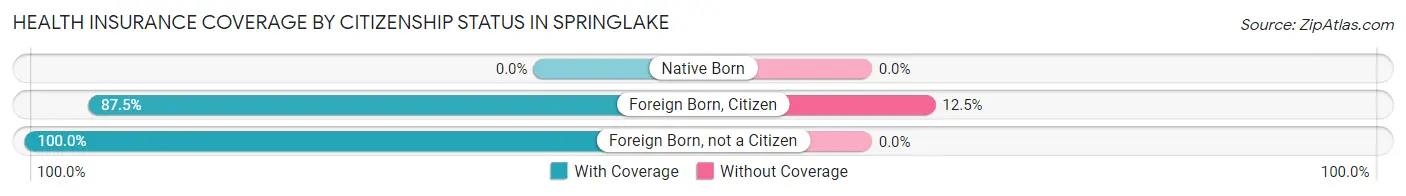
| Citizenship Status | With Coverage | Without Coverage |
| Native Born | 0 (0.0%) | 0 (0.0%) |
| Foreign Born, Citizen | 21 (87.5%) | 3 (12.5%) |
| Foreign Born, not a Citizen | 8 (100.0%) | 0 (0.0%) |
Health Insurance Coverage by Household Income in Springlake
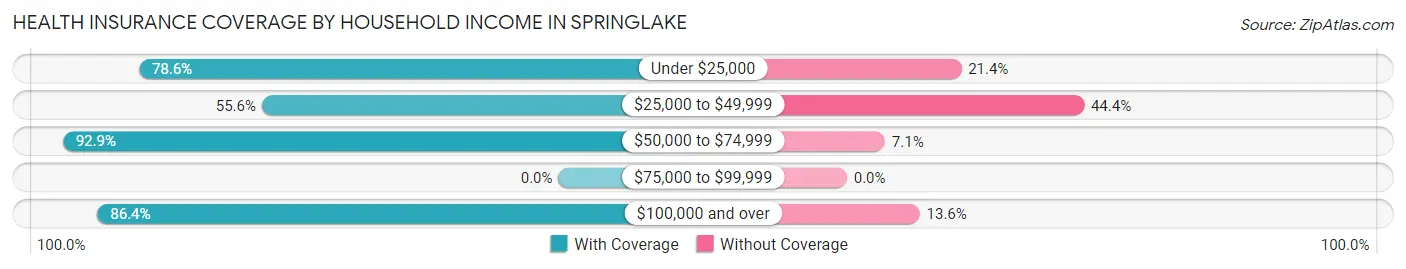
| Household Income | With Coverage | Without Coverage |
| Under $25,000 | 11 (78.6%) | 3 (21.4%) |
| $25,000 to $49,999 | 15 (55.6%) | 12 (44.4%) |
| $50,000 to $74,999 | 26 (92.9%) | 2 (7.1%) |
| $75,000 to $99,999 | 0 (0.0%) | 0 (0.0%) |
| $100,000 and over | 19 (86.4%) | 3 (13.6%) |
Public vs Private Health Insurance Coverage by Age in Springlake
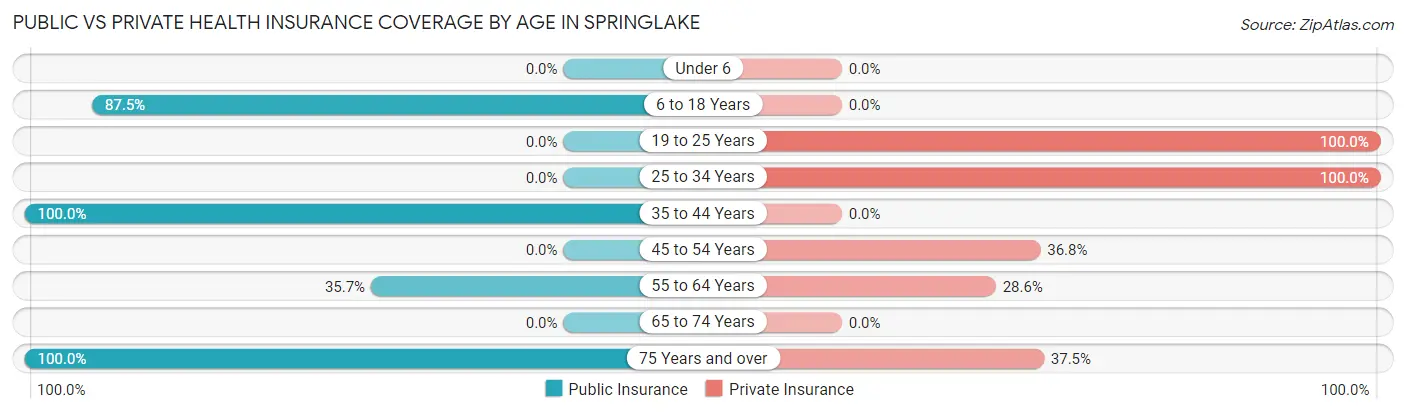
| Age Bracket | Public Insurance | Private Insurance |
| Under 6 | 0 (0.0%) | 0 (0.0%) |
| 6 to 18 Years | 21 (87.5%) | 0 (0.0%) |
| 19 to 25 Years | 0 (0.0%) | 8 (100.0%) |
| 25 to 34 Years | 0 (0.0%) | 9 (100.0%) |
| 35 to 44 Years | 1 (100.0%) | 0 (0.0%) |
| 45 to 54 Years | 0 (0.0%) | 7 (36.8%) |
| 55 to 64 Years | 5 (35.7%) | 4 (28.6%) |
| 65 to 74 Years | 0 (0.0%) | 0 (0.0%) |
| 75 Years and over | 16 (100.0%) | 6 (37.5%) |
| Total | 43 (47.2%) | 34 (37.4%) |
Disability Status by Sex by Age in Springlake
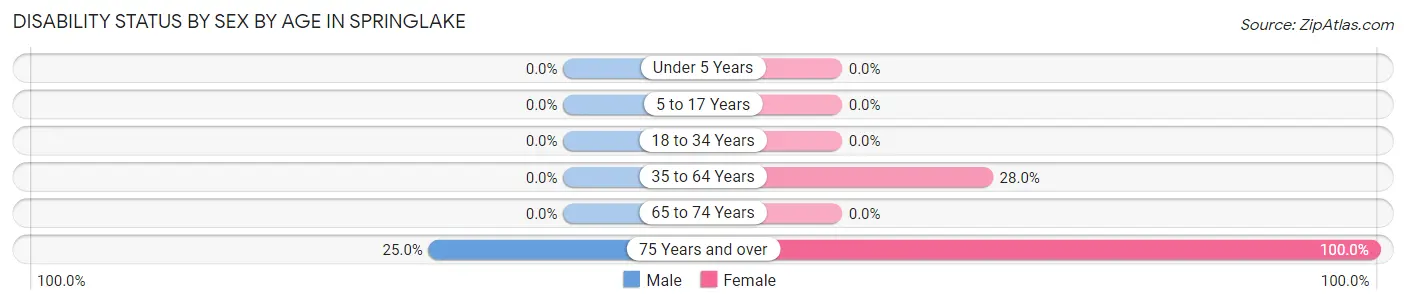
| Age Bracket | Male | Female |
| Under 5 Years | 0 (0.0%) | 0 (0.0%) |
| 5 to 17 Years | 0 (0.0%) | 0 (0.0%) |
| 18 to 34 Years | 0 (0.0%) | 0 (0.0%) |
| 35 to 64 Years | 0 (0.0%) | 7 (28.0%) |
| 65 to 74 Years | 0 (0.0%) | 0 (0.0%) |
| 75 Years and over | 2 (25.0%) | 8 (100.0%) |
Disability Class by Sex by Age in Springlake
Disability Class: Hearing Difficulty
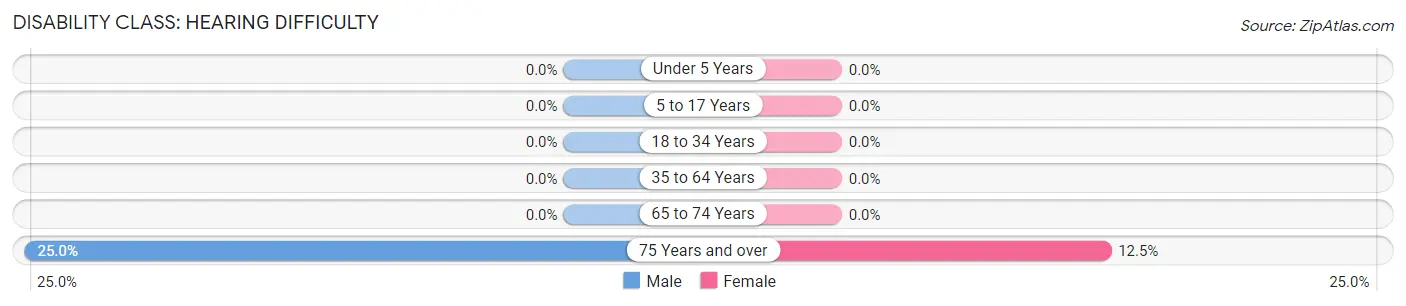
| Age Bracket | Male | Female |
| Under 5 Years | 0 (0.0%) | 0 (0.0%) |
| 5 to 17 Years | 0 (0.0%) | 0 (0.0%) |
| 18 to 34 Years | 0 (0.0%) | 0 (0.0%) |
| 35 to 64 Years | 0 (0.0%) | 0 (0.0%) |
| 65 to 74 Years | 0 (0.0%) | 0 (0.0%) |
| 75 Years and over | 2 (25.0%) | 1 (12.5%) |
Disability Class: Vision Difficulty
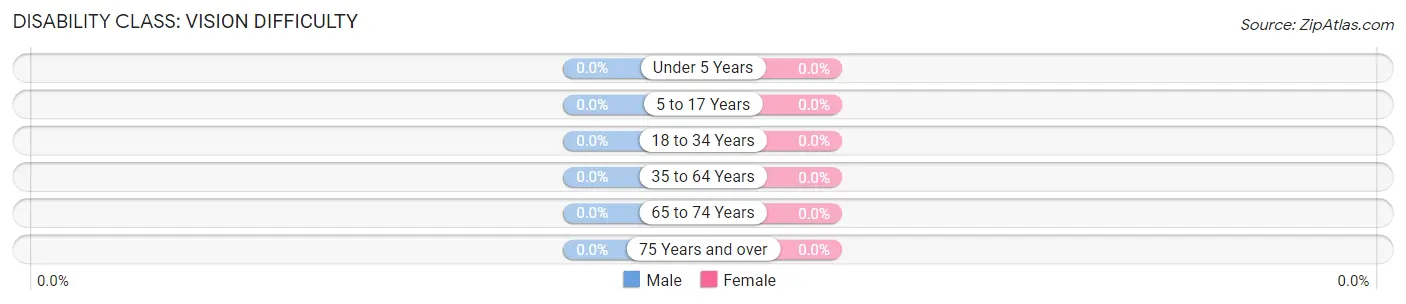
| Age Bracket | Male | Female |
| Under 5 Years | 0 (0.0%) | 0 (0.0%) |
| 5 to 17 Years | 0 (0.0%) | 0 (0.0%) |
| 18 to 34 Years | 0 (0.0%) | 0 (0.0%) |
| 35 to 64 Years | 0 (0.0%) | 0 (0.0%) |
| 65 to 74 Years | 0 (0.0%) | 0 (0.0%) |
| 75 Years and over | 0 (0.0%) | 0 (0.0%) |
Disability Class: Cognitive Difficulty
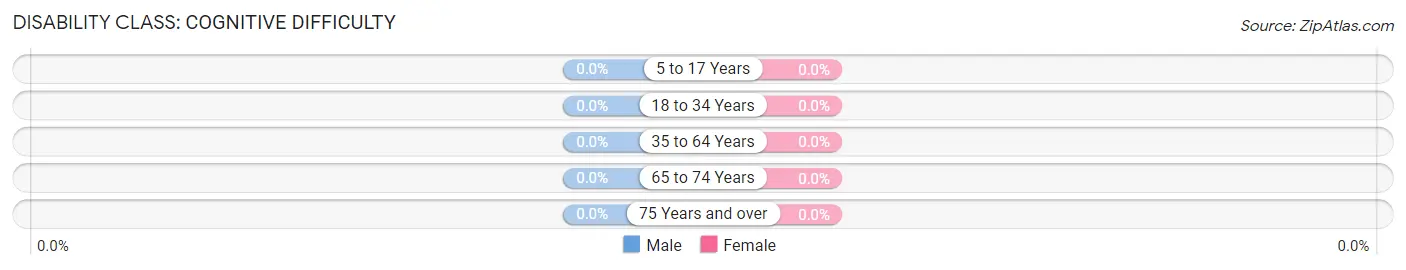
| Age Bracket | Male | Female |
| 5 to 17 Years | 0 (0.0%) | 0 (0.0%) |
| 18 to 34 Years | 0 (0.0%) | 0 (0.0%) |
| 35 to 64 Years | 0 (0.0%) | 0 (0.0%) |
| 65 to 74 Years | 0 (0.0%) | 0 (0.0%) |
| 75 Years and over | 0 (0.0%) | 0 (0.0%) |
Disability Class: Ambulatory Difficulty
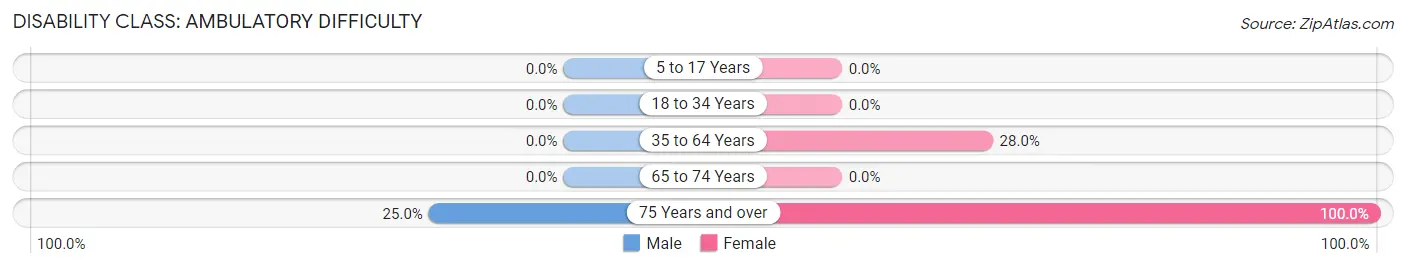
| Age Bracket | Male | Female |
| 5 to 17 Years | 0 (0.0%) | 0 (0.0%) |
| 18 to 34 Years | 0 (0.0%) | 0 (0.0%) |
| 35 to 64 Years | 0 (0.0%) | 7 (28.0%) |
| 65 to 74 Years | 0 (0.0%) | 0 (0.0%) |
| 75 Years and over | 2 (25.0%) | 8 (100.0%) |
Disability Class: Self-Care Difficulty
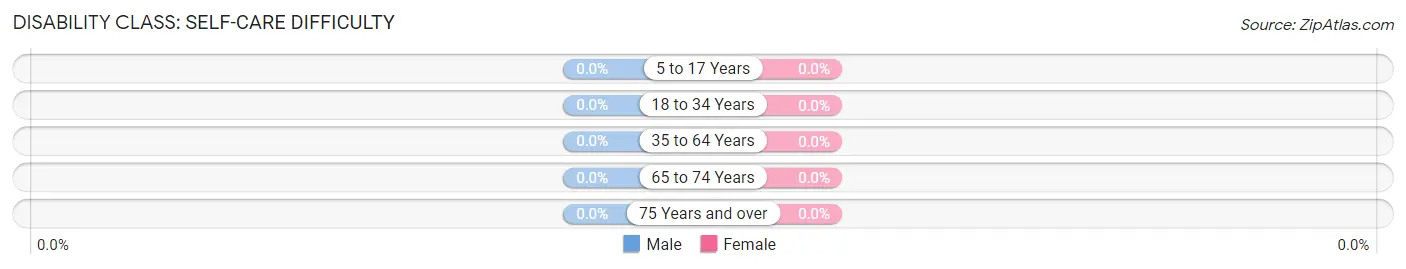
| Age Bracket | Male | Female |
| 5 to 17 Years | 0 (0.0%) | 0 (0.0%) |
| 18 to 34 Years | 0 (0.0%) | 0 (0.0%) |
| 35 to 64 Years | 0 (0.0%) | 0 (0.0%) |
| 65 to 74 Years | 0 (0.0%) | 0 (0.0%) |
| 75 Years and over | 0 (0.0%) | 0 (0.0%) |
Technology Access in Springlake
Computing Device Access in Springlake
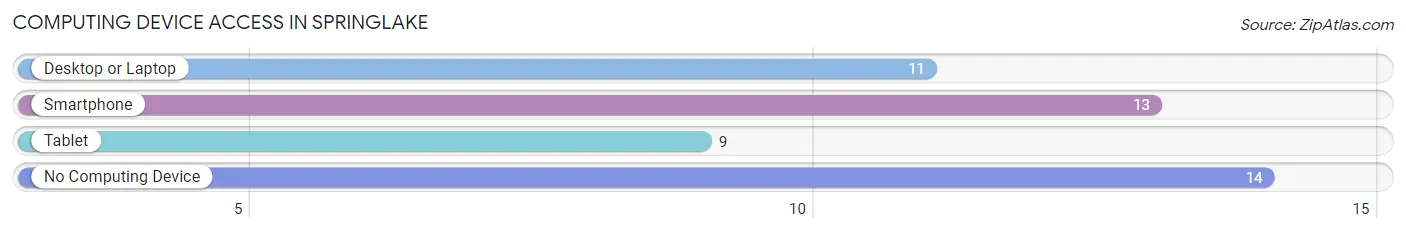
| Device Type | # Households | % Households |
| Desktop or Laptop | 11 | 40.7% |
| Smartphone | 13 | 48.1% |
| Tablet | 9 | 33.3% |
| No Computing Device | 14 | 51.8% |
| Total | 27 | 100.0% |
Internet Access in Springlake
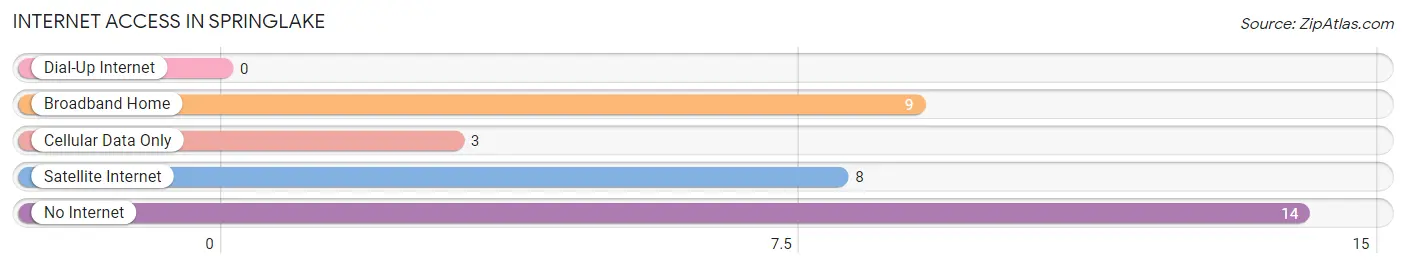
| Internet Type | # Households | % Households |
| Dial-Up Internet | 0 | 0.0% |
| Broadband Home | 9 | 33.3% |
| Cellular Data Only | 3 | 11.1% |
| Satellite Internet | 8 | 29.6% |
| No Internet | 14 | 51.8% |
| Total | 27 | 100.0% |
Springlake Summary
History
The small town of Springlake, Texas is located in Lamb County, Texas, and is part of the Lubbock Metropolitan Statistical Area. The town was founded in the late 1800s by a group of settlers who were looking for a place to settle and start a new life. The town was originally called “Spring Lake” due to the abundance of natural springs in the area. The town was officially incorporated in 1909 and the name was changed to Springlake.
The town was originally a farming community, with cotton being the main crop. The town also had a few small businesses, such as a general store, a blacksmith shop, and a few other small businesses. The town grew slowly over the years, but it was not until the 1950s that the town began to experience a population boom. This was due to the discovery of oil in the area, which brought in a large influx of people looking for work.
The town continued to grow throughout the 1960s and 1970s, and by the 1980s, the population had reached over 1,000 people. The town has continued to grow since then, and as of the 2010 census, the population was 1,845.
Geography
Springlake is located in the South Plains region of Texas, and is situated in the northwest corner of Lamb County. The town is located about 25 miles east of Lubbock, and is about 10 miles south of the New Mexico border. The town is situated on the edge of the Llano Estacado, a large plateau that stretches across the Texas Panhandle.
The town is located in a semi-arid climate, with hot summers and mild winters. The average annual temperature is around 68 degrees Fahrenheit, and the average annual precipitation is around 18 inches.
Economy
The economy of Springlake is largely based on agriculture and oil production. The town is home to several large cotton farms, as well as several smaller farms that produce a variety of crops. The town is also home to several oil and gas production companies, which have been a major source of employment for the town since the 1950s.
The town is also home to several small businesses, such as restaurants, retail stores, and other services. The town is also home to a few manufacturing companies, which produce a variety of products, such as furniture and clothing.
Demographics
As of the 2010 census, the population of Springlake was 1,845 people. The racial makeup of the town was 79.3% White, 0.2% African American, 0.2% Native American, 0.2% Asian, 0.1% Pacific Islander, 18.7% from other races, and 1.4% from two or more races. Hispanic or Latino of any race were 33.2% of the population.
The median income for a household in the town was $31,250, and the median income for a family was $37,500. The per capita income for the town was $15,845. About 18.2% of the population was below the poverty line.
Common Questions
What is Per Capita Income in Springlake?
Per Capita income in Springlake is $16,912.
What is Inequality or Gini Index in Springlake?
Inequality or Gini Index in Springlake is 0.41.
What is the Total Population of Springlake?
Total Population of Springlake is 91.
What is the Total Male Population of Springlake?
Total Male Population of Springlake is 43.
What is the Total Female Population of Springlake?
Total Female Population of Springlake is 48.
What is the Ratio of Males per 100 Females in Springlake?
There are 89.58 Males per 100 Females in Springlake.
What is the Ratio of Females per 100 Males in Springlake?
There are 111.63 Females per 100 Males in Springlake.
What is the Median Population Age in Springlake?
Median Population Age in Springlake is 45.4 Years.
What is the Average Family Size in Springlake
Average Family Size in Springlake is 3.8 People.
What is the Average Household Size in Springlake
Average Household Size in Springlake is 3.4 People.
How Large is the Labor Force in Springlake?
There are 42 People in the Labor Forcein in Springlake.
What is the Percentage of People in the Labor Force in Springlake?
59.2% of People are in the Labor Force in Springlake.