Zip Codes with the Highest Percentage of Population Employed in Security & Protection in Lenoir City, TN
RELATED REPORTS & OPTIONS
Security & Protection
Lenoir City
Compare Zip Codes
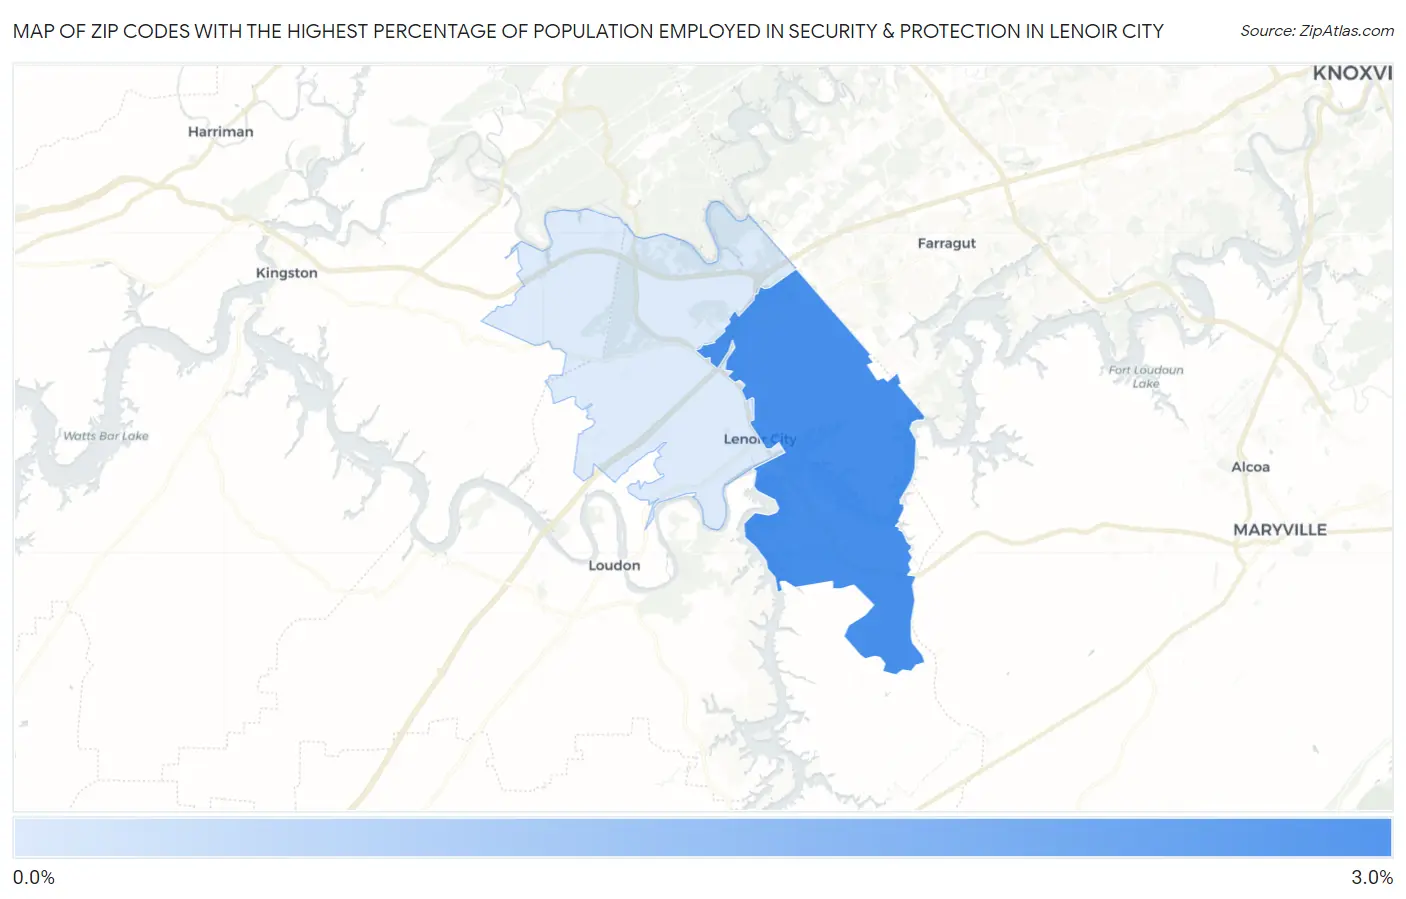
Map of Zip Codes with the Highest Percentage of Population Employed in Security & Protection in Lenoir City
0.83%
2.6%
Zip Codes with the Highest Percentage of Population Employed in Security & Protection in Lenoir City, TN
| Zip Code | % Employed | vs State | vs National | |
| 1. | 37772 | 2.6% | 2.1%(+0.508)#176 | 2.1%(+0.454)#8,993 |
| 2. | 37771 | 0.83% | 2.1%(-1.26)#421 | 2.1%(-1.31)#21,200 |
1
Common Questions
What are the Top Zip Codes with the Highest Percentage of Population Employed in Security & Protection in Lenoir City, TN?
Top Zip Codes with the Highest Percentage of Population Employed in Security & Protection in Lenoir City, TN are:
What zip code has the Highest Percentage of Population Employed in Security & Protection in Lenoir City, TN?
37772 has the Highest Percentage of Population Employed in Security & Protection in Lenoir City, TN with 2.6%.
What is the Percentage of Population Employed in Security & Protection in Lenoir City, TN?
Percentage of Population Employed in Security & Protection in Lenoir City is 1.2%.
What is the Percentage of Population Employed in Security & Protection in Tennessee?
Percentage of Population Employed in Security & Protection in Tennessee is 2.1%.
What is the Percentage of Population Employed in Security & Protection in the United States?
Percentage of Population Employed in Security & Protection in the United States is 2.1%.