Zip Codes with the Highest Percentage of Population Employed in Security & Protection in Cordova, TN
RELATED REPORTS & OPTIONS
Security & Protection
Cordova
Compare Zip Codes
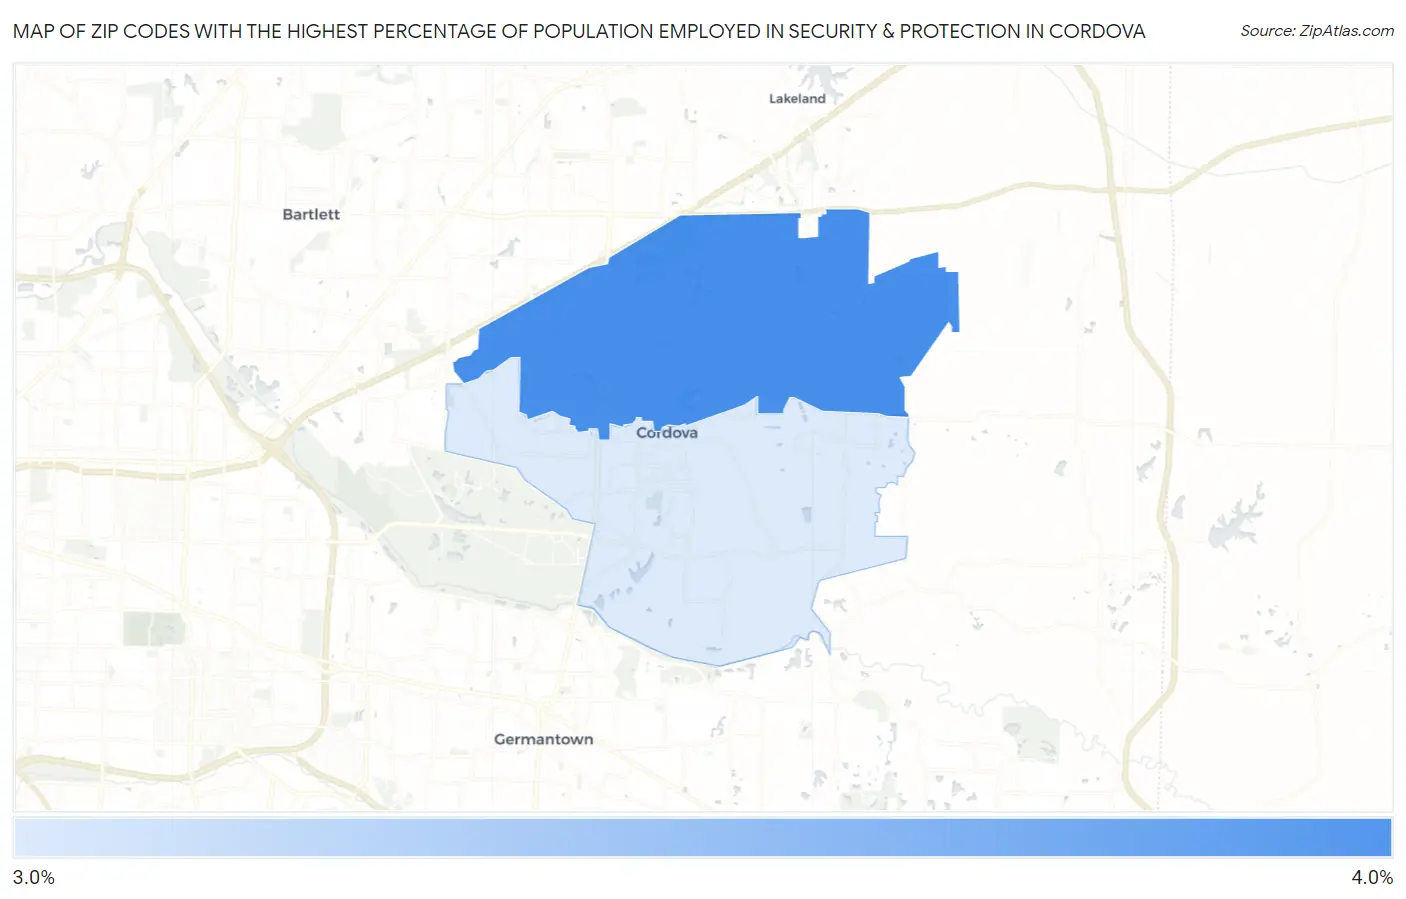
Map of Zip Codes with the Highest Percentage of Population Employed in Security & Protection in Cordova
3.3%
3.4%
Zip Codes with the Highest Percentage of Population Employed in Security & Protection in Cordova, TN
| Zip Code | % Employed | vs State | vs National | |
| 1. | 38016 | 3.4% | 2.1%(+1.29)#116 | 2.1%(+1.23)#5,997 |
| 2. | 38018 | 3.3% | 2.1%(+1.24)#118 | 2.1%(+1.19)#6,141 |
1
Common Questions
What are the Top Zip Codes with the Highest Percentage of Population Employed in Security & Protection in Cordova, TN?
Top Zip Codes with the Highest Percentage of Population Employed in Security & Protection in Cordova, TN are:
What zip code has the Highest Percentage of Population Employed in Security & Protection in Cordova, TN?
38016 has the Highest Percentage of Population Employed in Security & Protection in Cordova, TN with 3.4%.
What is the Percentage of Population Employed in Security & Protection in Tennessee?
Percentage of Population Employed in Security & Protection in Tennessee is 2.1%.
What is the Percentage of Population Employed in Security & Protection in the United States?
Percentage of Population Employed in Security & Protection in the United States is 2.1%.