Zip Codes with the Highest Percentage of Population Employed in Security & Protection in Lebanon, TN
RELATED REPORTS & OPTIONS
Security & Protection
Lebanon
Compare Zip Codes
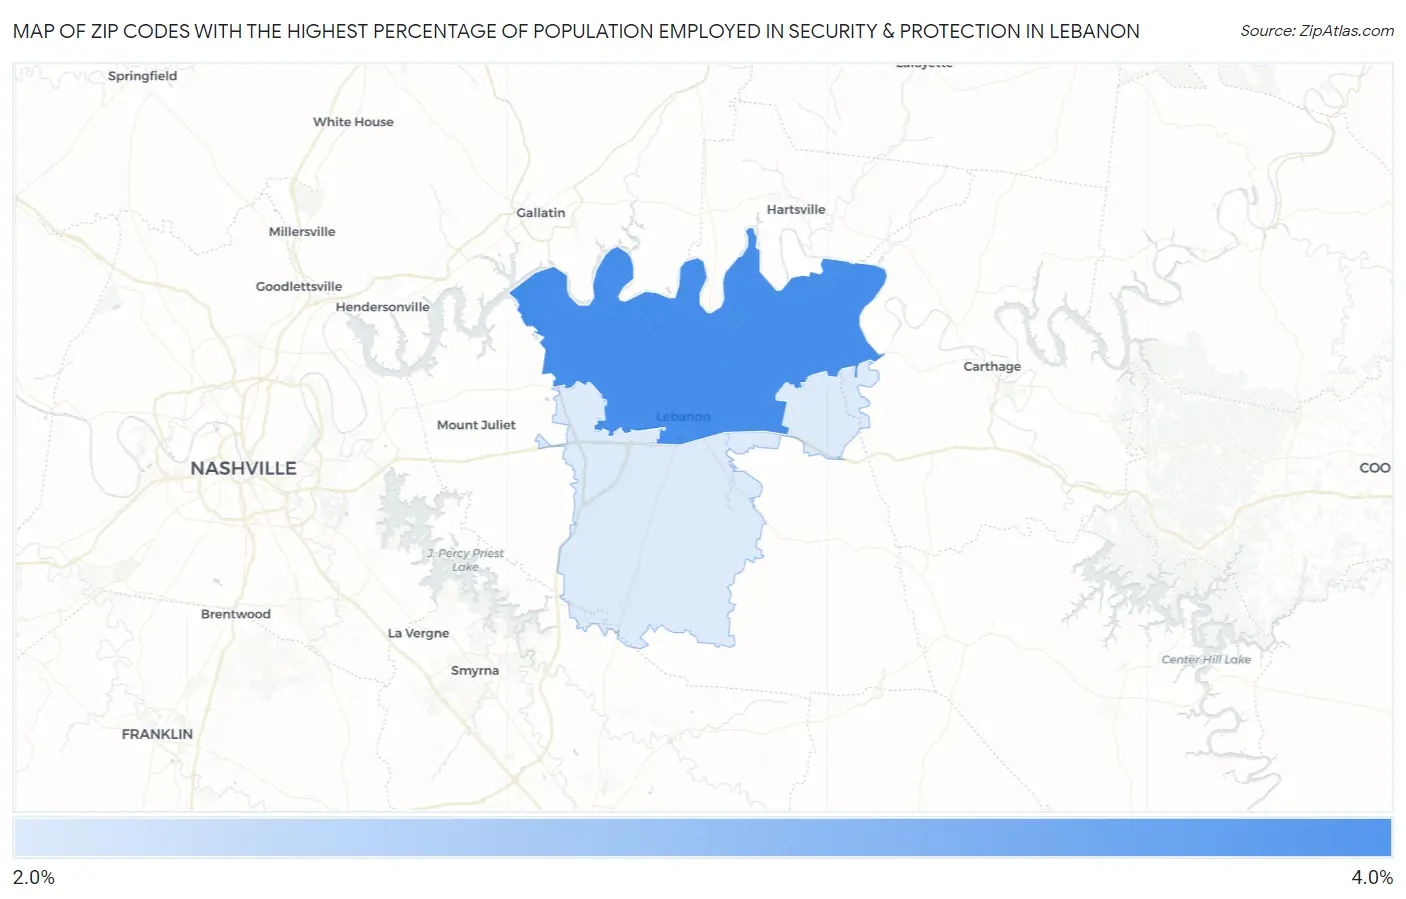
Map of Zip Codes with the Highest Percentage of Population Employed in Security & Protection in Lebanon
2.5%
3.6%
Zip Codes with the Highest Percentage of Population Employed in Security & Protection in Lebanon, TN
| Zip Code | % Employed | vs State | vs National | |
| 1. | 37087 | 3.6% | 2.1%(+1.53)#104 | 2.1%(+1.47)#5,356 |
| 2. | 37090 | 2.5% | 2.1%(+0.437)#188 | 2.1%(+0.382)#9,347 |
1
Common Questions
What are the Top Zip Codes with the Highest Percentage of Population Employed in Security & Protection in Lebanon, TN?
Top Zip Codes with the Highest Percentage of Population Employed in Security & Protection in Lebanon, TN are:
What zip code has the Highest Percentage of Population Employed in Security & Protection in Lebanon, TN?
37087 has the Highest Percentage of Population Employed in Security & Protection in Lebanon, TN with 3.6%.
What is the Percentage of Population Employed in Security & Protection in Lebanon, TN?
Percentage of Population Employed in Security & Protection in Lebanon is 3.9%.
What is the Percentage of Population Employed in Security & Protection in Tennessee?
Percentage of Population Employed in Security & Protection in Tennessee is 2.1%.
What is the Percentage of Population Employed in Security & Protection in the United States?
Percentage of Population Employed in Security & Protection in the United States is 2.1%.