Nolensville, TN Map & Demographics
Nolensville Map
Nolensville Overview
$51,612
PER CAPITA INCOME
$162,308
AVG FAMILY INCOME
$158,266
AVG HOUSEHOLD INCOME
33.8%
WAGE / INCOME GAP [ % ]
66.2¢/ $1
WAGE / INCOME GAP [ $ ]
0.32
INEQUALITY / GINI INDEX
14,444
TOTAL POPULATION
7,101
MALE POPULATION
7,343
FEMALE POPULATION
96.70
MALES / 100 FEMALES
103.41
FEMALES / 100 MALES
34.5
MEDIAN AGE
3.5
AVG FAMILY SIZE
3.4
AVG HOUSEHOLD SIZE
7,928
LABOR FORCE [ PEOPLE ]
75.4%
PERCENT IN LABOR FORCE
0.7%
UNEMPLOYMENT RATE
Nolensville Zip Codes
Nolensville Area Codes
Income in Nolensville
Income Overview in Nolensville
Per Capita Income in Nolensville is $51,612, while median incomes of families and households are $162,308 and $158,266 respectively.
| Characteristic | Number | Measure |
| Per Capita Income | 14,444 | $51,612 |
| Median Family Income | 3,898 | $162,308 |
| Mean Family Income | 3,898 | $180,340 |
| Median Household Income | 4,266 | $158,266 |
| Mean Household Income | 4,266 | $172,149 |
| Income Deficit | 3,898 | $0 |
| Wage / Income Gap (%) | 14,444 | 33.77% |
| Wage / Income Gap ($) | 14,444 | 66.23¢ per $1 |
| Gini / Inequality Index | 14,444 | 0.32 |
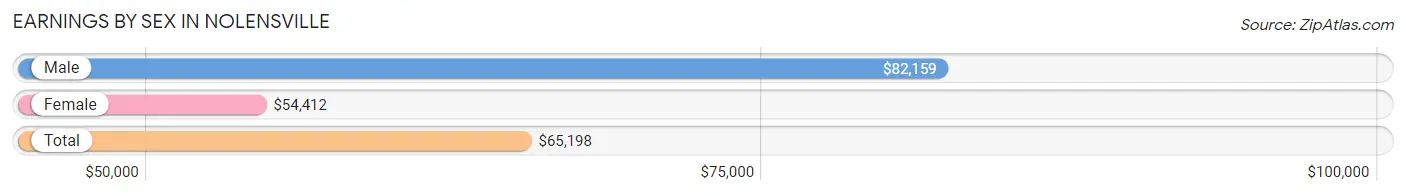
Earnings by Sex in Nolensville
Average Earnings in Nolensville are $65,198, $82,159 for men and $54,412 for women, a difference of 33.8%.
| Sex | Number | Average Earnings |
| Male | 4,489 (53.4%) | $82,159 |
| Female | 3,916 (46.6%) | $54,412 |
| Total | 8,405 (100.0%) | $65,198 |
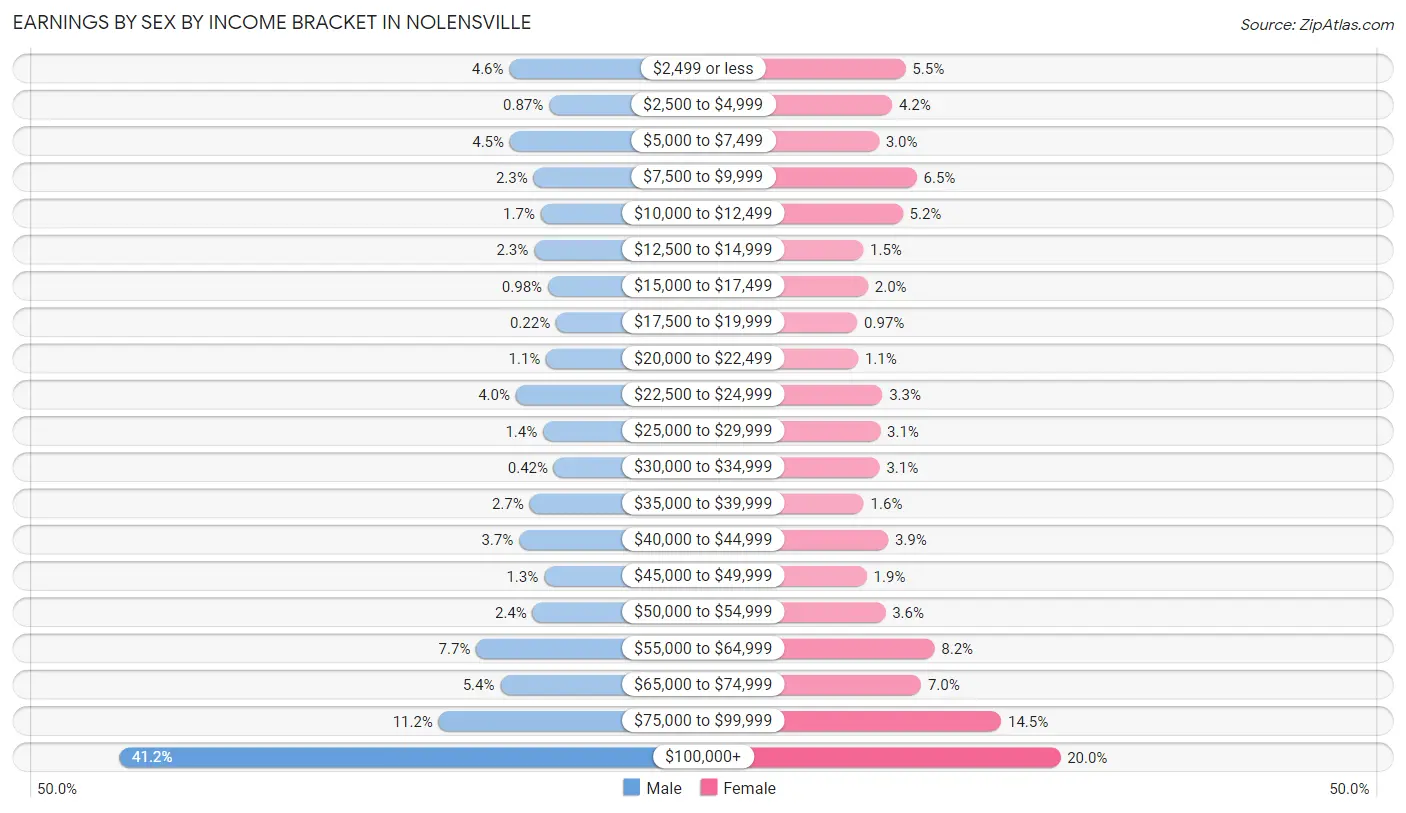
Earnings by Sex by Income Bracket in Nolensville
The most common earnings brackets in Nolensville are $100,000+ for men (1,847 | 41.1%) and $100,000+ for women (783 | 20.0%).
| Income | Male | Female |
| $2,499 or less | 206 (4.6%) | 215 (5.5%) |
| $2,500 to $4,999 | 39 (0.9%) | 166 (4.2%) |
| $5,000 to $7,499 | 204 (4.5%) | 117 (3.0%) |
| $7,500 to $9,999 | 104 (2.3%) | 256 (6.5%) |
| $10,000 to $12,499 | 74 (1.7%) | 205 (5.2%) |
| $12,500 to $14,999 | 102 (2.3%) | 60 (1.5%) |
| $15,000 to $17,499 | 44 (1.0%) | 77 (2.0%) |
| $17,500 to $19,999 | 10 (0.2%) | 38 (1.0%) |
| $20,000 to $22,499 | 51 (1.1%) | 41 (1.1%) |
| $22,500 to $24,999 | 179 (4.0%) | 130 (3.3%) |
| $25,000 to $29,999 | 64 (1.4%) | 122 (3.1%) |
| $30,000 to $34,999 | 19 (0.4%) | 120 (3.1%) |
| $35,000 to $39,999 | 121 (2.7%) | 62 (1.6%) |
| $40,000 to $44,999 | 165 (3.7%) | 151 (3.9%) |
| $45,000 to $49,999 | 60 (1.3%) | 73 (1.9%) |
| $50,000 to $54,999 | 108 (2.4%) | 141 (3.6%) |
| $55,000 to $64,999 | 345 (7.7%) | 321 (8.2%) |
| $65,000 to $74,999 | 244 (5.4%) | 272 (7.0%) |
| $75,000 to $99,999 | 503 (11.2%) | 566 (14.4%) |
| $100,000+ | 1,847 (41.1%) | 783 (20.0%) |
| Total | 4,489 (100.0%) | 3,916 (100.0%) |
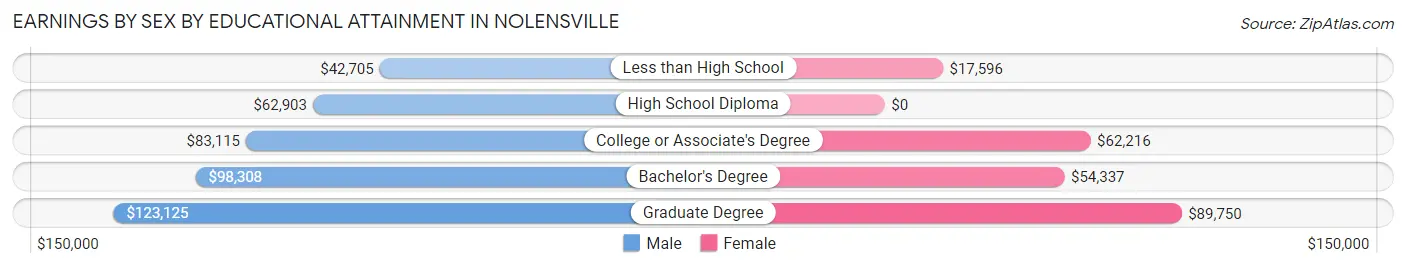
Earnings by Sex by Educational Attainment in Nolensville
Average earnings in Nolensville are $100,750 for men and $63,042 for women, a difference of 37.4%. Men with an educational attainment of graduate degree enjoy the highest average annual earnings of $123,125, while those with less than high school education earn the least with $42,705. Women with an educational attainment of graduate degree earn the most with the average annual earnings of $89,750, while those with less than high school education have the smallest earnings of $17,596.
| Educational Attainment | Male Income | Female Income |
| Less than High School | $42,705 | $17,596 |
| High School Diploma | $62,903 | $0 |
| College or Associate's Degree | $83,115 | $62,216 |
| Bachelor's Degree | $98,308 | $54,337 |
| Graduate Degree | $123,125 | $89,750 |
| Total | $100,750 | $63,042 |
Family Income in Nolensville
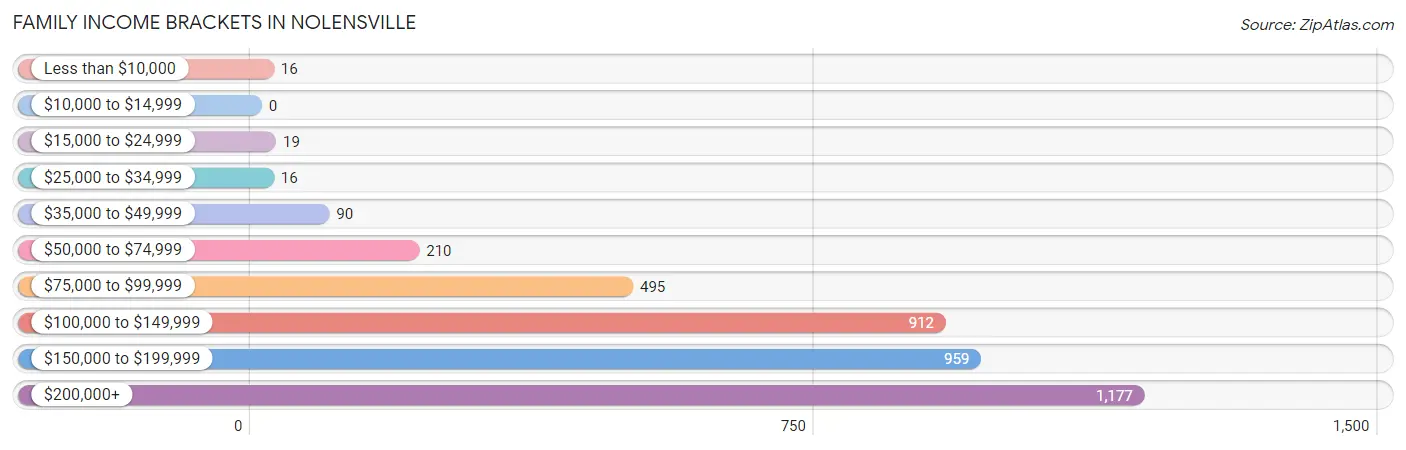
Family Income Brackets in Nolensville
According to the Nolensville family income data, there are 1,177 families falling into the $200,000+ income range, which is the most common income bracket and makes up 30.2% of all families.
| Income Bracket | # Families | % Families |
| Less than $10,000 | 16 | 0.4% |
| $10,000 to $14,999 | 0 | 0.0% |
| $15,000 to $24,999 | 19 | 0.5% |
| $25,000 to $34,999 | 16 | 0.4% |
| $35,000 to $49,999 | 90 | 2.3% |
| $50,000 to $74,999 | 210 | 5.4% |
| $75,000 to $99,999 | 495 | 12.7% |
| $100,000 to $149,999 | 912 | 23.4% |
| $150,000 to $199,999 | 959 | 24.6% |
| $200,000+ | 1,177 | 30.2% |
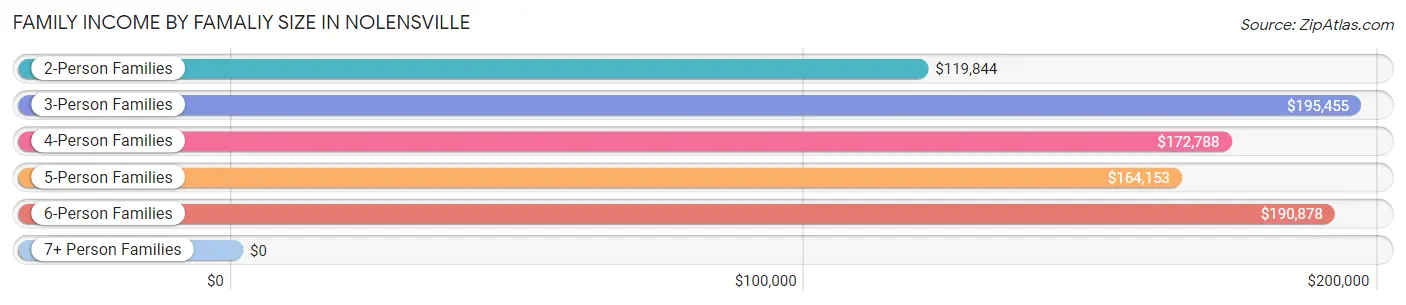
Family Income by Famaliy Size in Nolensville
3-person families (956 | 24.5%) account for the highest median family income in Nolensville with $195,455 per family, while 3-person families (956 | 24.5%) have the highest median income of $65,152 per family member.
| Income Bracket | # Families | Median Income |
| 2-Person Families | 951 (24.4%) | $119,844 |
| 3-Person Families | 956 (24.5%) | $195,455 |
| 4-Person Families | 1,303 (33.4%) | $172,788 |
| 5-Person Families | 558 (14.3%) | $164,153 |
| 6-Person Families | 72 (1.8%) | $190,878 |
| 7+ Person Families | 58 (1.5%) | $0 |
| Total | 3,898 (100.0%) | $162,308 |
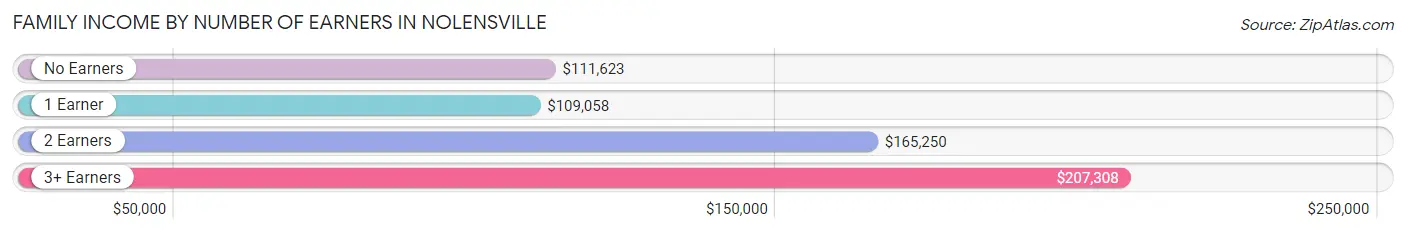
Family Income by Number of Earners in Nolensville
The median family income in Nolensville is $162,308, with families comprising 3+ earners (870) having the highest median family income of $207,308, while families with 1 earner (838) have the lowest median family income of $109,058, accounting for 22.3% and 21.5% of families, respectively.
| Number of Earners | # Families | Median Income |
| No Earners | 200 (5.1%) | $111,623 |
| 1 Earner | 838 (21.5%) | $109,058 |
| 2 Earners | 1,990 (51.0%) | $165,250 |
| 3+ Earners | 870 (22.3%) | $207,308 |
| Total | 3,898 (100.0%) | $162,308 |
Household Income in Nolensville
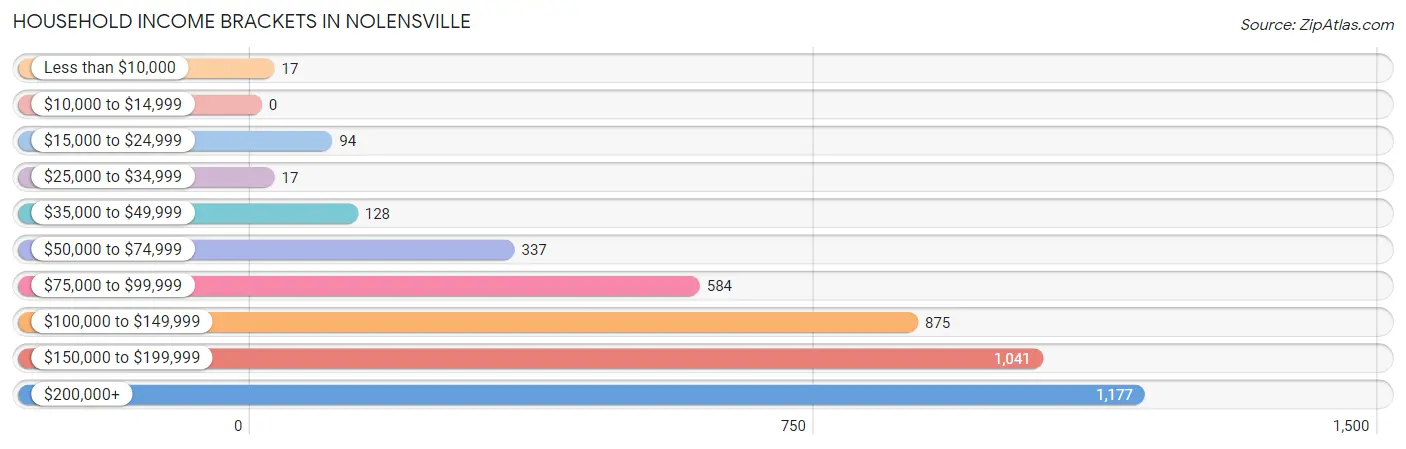
Household Income Brackets in Nolensville
With 1,177 households falling in the category, the $200,000+ income range is the most frequent in Nolensville, accounting for 27.6% of all households.
| Income Bracket | # Households | % Households |
| Less than $10,000 | 17 | 0.4% |
| $10,000 to $14,999 | 0 | 0.0% |
| $15,000 to $24,999 | 94 | 2.2% |
| $25,000 to $34,999 | 17 | 0.4% |
| $35,000 to $49,999 | 128 | 3.0% |
| $50,000 to $74,999 | 337 | 7.9% |
| $75,000 to $99,999 | 584 | 13.7% |
| $100,000 to $149,999 | 875 | 20.5% |
| $150,000 to $199,999 | 1,041 | 24.4% |
| $200,000+ | 1,177 | 27.6% |
Household Income by Householder Age in Nolensville
The median household income in Nolensville is $158,266, with the highest median household income of $166,331 found in the 45 to 64 years age bracket for the primary householder. A total of 2,232 households (52.3%) fall into this category.
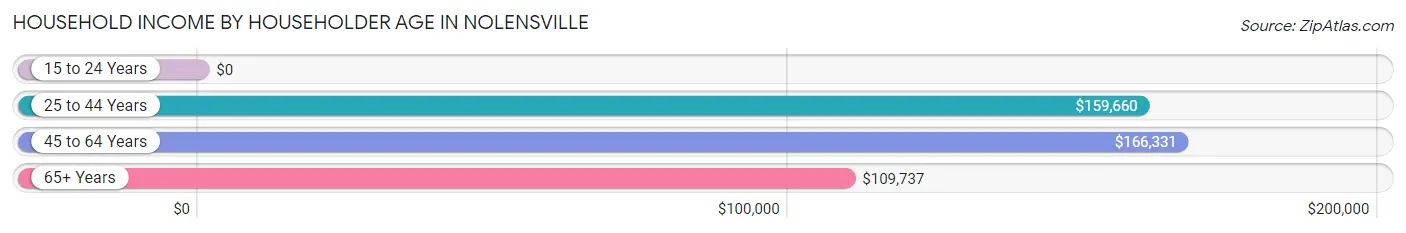
| Income Bracket | # Households | Median Income |
| 15 to 24 Years | 0 (0.0%) | $0 |
| 25 to 44 Years | 1,628 (38.2%) | $159,660 |
| 45 to 64 Years | 2,232 (52.3%) | $166,331 |
| 65+ Years | 406 (9.5%) | $109,737 |
| Total | 4,266 (100.0%) | $158,266 |
Poverty in Nolensville
Income Below Poverty by Sex and Age in Nolensville
With 0.5% poverty level for males and 2.6% for females among the residents of Nolensville, 75 year old and over males and 75 year old and over females are the most vulnerable to poverty, with 15 males (29.4%) and 19 females (12.3%) in their respective age groups living below the poverty level.
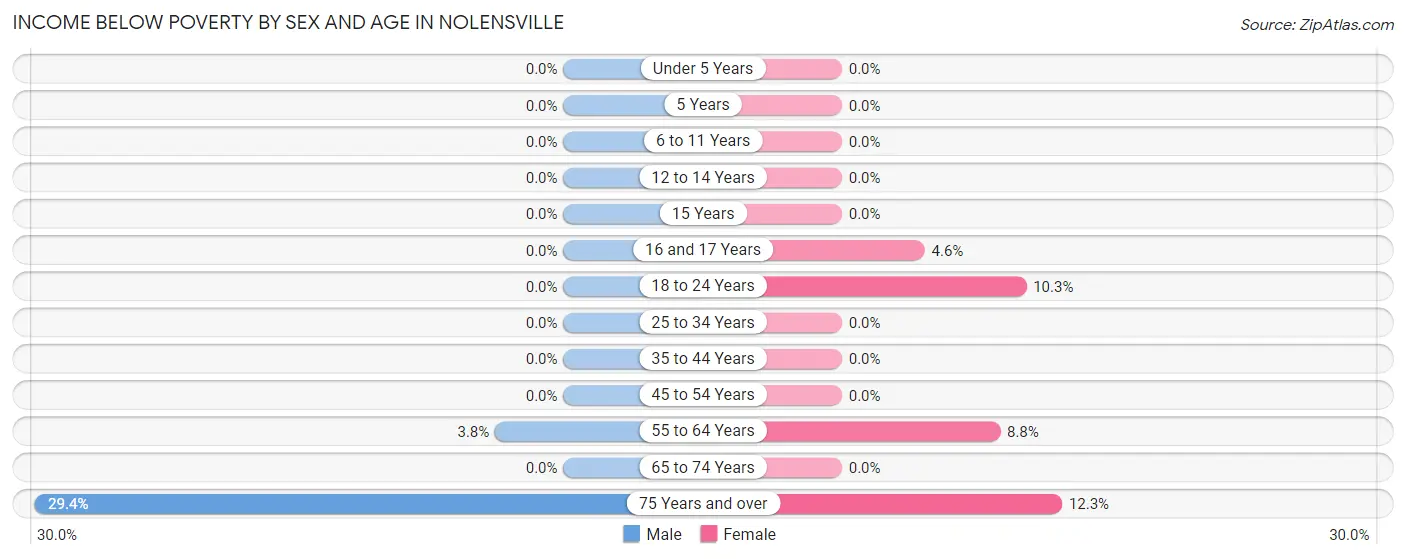
| Age Bracket | Male | Female |
| Under 5 Years | 0 (0.0%) | 0 (0.0%) |
| 5 Years | 0 (0.0%) | 0 (0.0%) |
| 6 to 11 Years | 0 (0.0%) | 0 (0.0%) |
| 12 to 14 Years | 0 (0.0%) | 0 (0.0%) |
| 15 Years | 0 (0.0%) | 0 (0.0%) |
| 16 and 17 Years | 0 (0.0%) | 10 (4.6%) |
| 18 to 24 Years | 0 (0.0%) | 87 (10.3%) |
| 25 to 34 Years | 0 (0.0%) | 0 (0.0%) |
| 35 to 44 Years | 0 (0.0%) | 0 (0.0%) |
| 45 to 54 Years | 0 (0.0%) | 0 (0.0%) |
| 55 to 64 Years | 20 (3.8%) | 72 (8.8%) |
| 65 to 74 Years | 0 (0.0%) | 0 (0.0%) |
| 75 Years and over | 15 (29.4%) | 19 (12.3%) |
| Total | 35 (0.5%) | 188 (2.6%) |
Income Above Poverty by Sex and Age in Nolensville
According to the poverty statistics in Nolensville, males aged under 5 years and females aged under 5 years are the age groups that are most secure financially, with 100.0% of males and 100.0% of females in these age groups living above the poverty line.
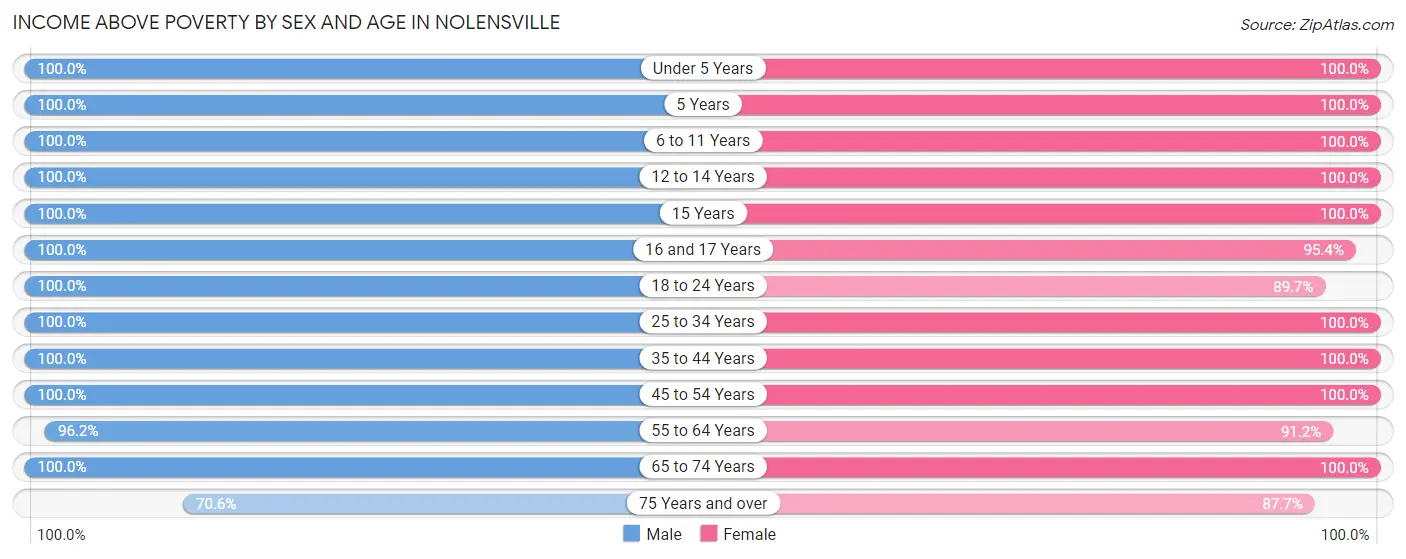
| Age Bracket | Male | Female |
| Under 5 Years | 554 (100.0%) | 638 (100.0%) |
| 5 Years | 125 (100.0%) | 135 (100.0%) |
| 6 to 11 Years | 729 (100.0%) | 742 (100.0%) |
| 12 to 14 Years | 442 (100.0%) | 356 (100.0%) |
| 15 Years | 74 (100.0%) | 79 (100.0%) |
| 16 and 17 Years | 339 (100.0%) | 207 (95.4%) |
| 18 to 24 Years | 737 (100.0%) | 760 (89.7%) |
| 25 to 34 Years | 591 (100.0%) | 753 (100.0%) |
| 35 to 44 Years | 1,028 (100.0%) | 1,021 (100.0%) |
| 45 to 54 Years | 1,572 (100.0%) | 1,274 (100.0%) |
| 55 to 64 Years | 507 (96.2%) | 745 (91.2%) |
| 65 to 74 Years | 295 (100.0%) | 291 (100.0%) |
| 75 Years and over | 36 (70.6%) | 136 (87.7%) |
| Total | 7,029 (99.5%) | 7,137 (97.4%) |
Income Below Poverty Among Married-Couple Families in Nolensville
The poverty statistics for married-couple families in Nolensville show that 1.0% or 35 of the total 3,421 families live below the poverty line. Families with no children have the highest poverty rate of 2.6%, comprising of 35 families. On the other hand, families with 1 or 2 children have the lowest poverty rate of 0.0%, which includes 0 families.
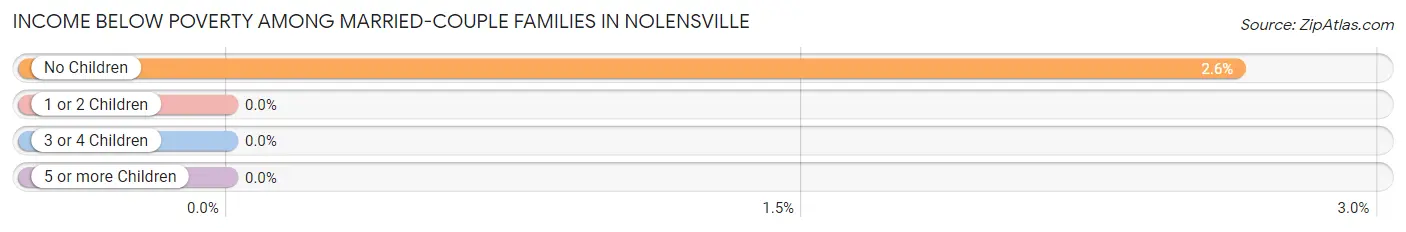
| Children | Above Poverty | Below Poverty |
| No Children | 1,298 (97.4%) | 35 (2.6%) |
| 1 or 2 Children | 1,671 (100.0%) | 0 (0.0%) |
| 3 or 4 Children | 359 (100.0%) | 0 (0.0%) |
| 5 or more Children | 58 (100.0%) | 0 (0.0%) |
| Total | 3,386 (99.0%) | 35 (1.0%) |
Income Below Poverty Among Single-Parent Households in Nolensville
| Children | Single Father | Single Mother |
| No Children | 0 (0.0%) | 0 (0.0%) |
| 1 or 2 Children | 0 (0.0%) | 0 (0.0%) |
| 3 or 4 Children | 0 (0.0%) | 0 (0.0%) |
| 5 or more Children | 0 (0.0%) | 0 (0.0%) |
| Total | 0 (0.0%) | 0 (0.0%) |
Income Below Poverty Among Married-Couple vs Single-Parent Households in Nolensville
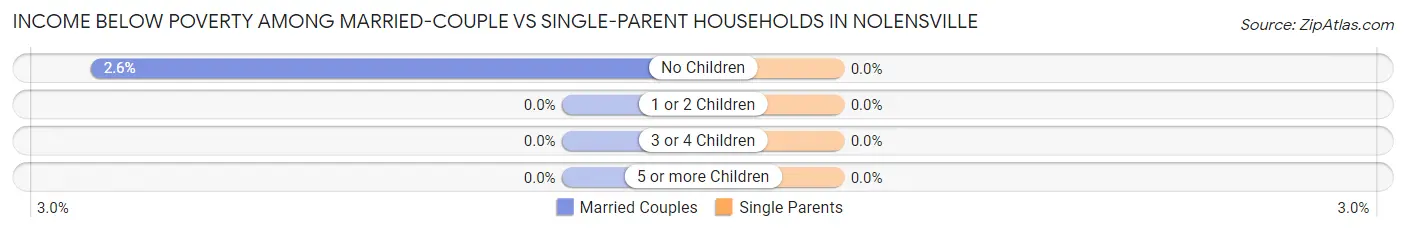
| Children | Married-Couple Families | Single-Parent Households |
| No Children | 35 (2.6%) | 0 (0.0%) |
| 1 or 2 Children | 0 (0.0%) | 0 (0.0%) |
| 3 or 4 Children | 0 (0.0%) | 0 (0.0%) |
| 5 or more Children | 0 (0.0%) | 0 (0.0%) |
| Total | 35 (1.0%) | 0 (0.0%) |
Race in Nolensville
The most populous races in Nolensville are White / Caucasian (12,314 | 85.3%), Two or more Races (968 | 6.7%), and Hispanic or Latino (813 | 5.6%).
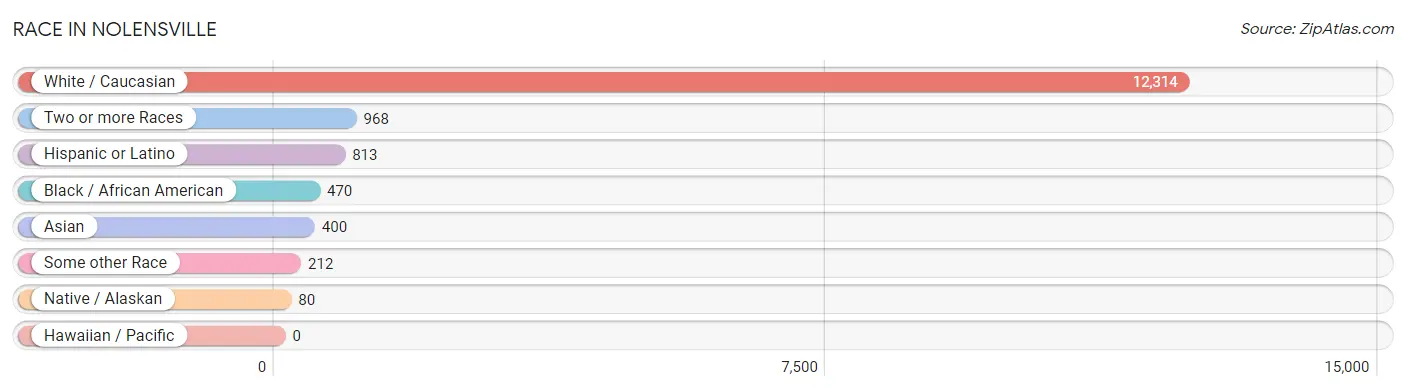
| Race | # Population | % Population |
| Asian | 400 | 2.8% |
| Black / African American | 470 | 3.3% |
| Hawaiian / Pacific | 0 | 0.0% |
| Hispanic or Latino | 813 | 5.6% |
| Native / Alaskan | 80 | 0.5% |
| White / Caucasian | 12,314 | 85.3% |
| Two or more Races | 968 | 6.7% |
| Some other Race | 212 | 1.5% |
| Total | 14,444 | 100.0% |
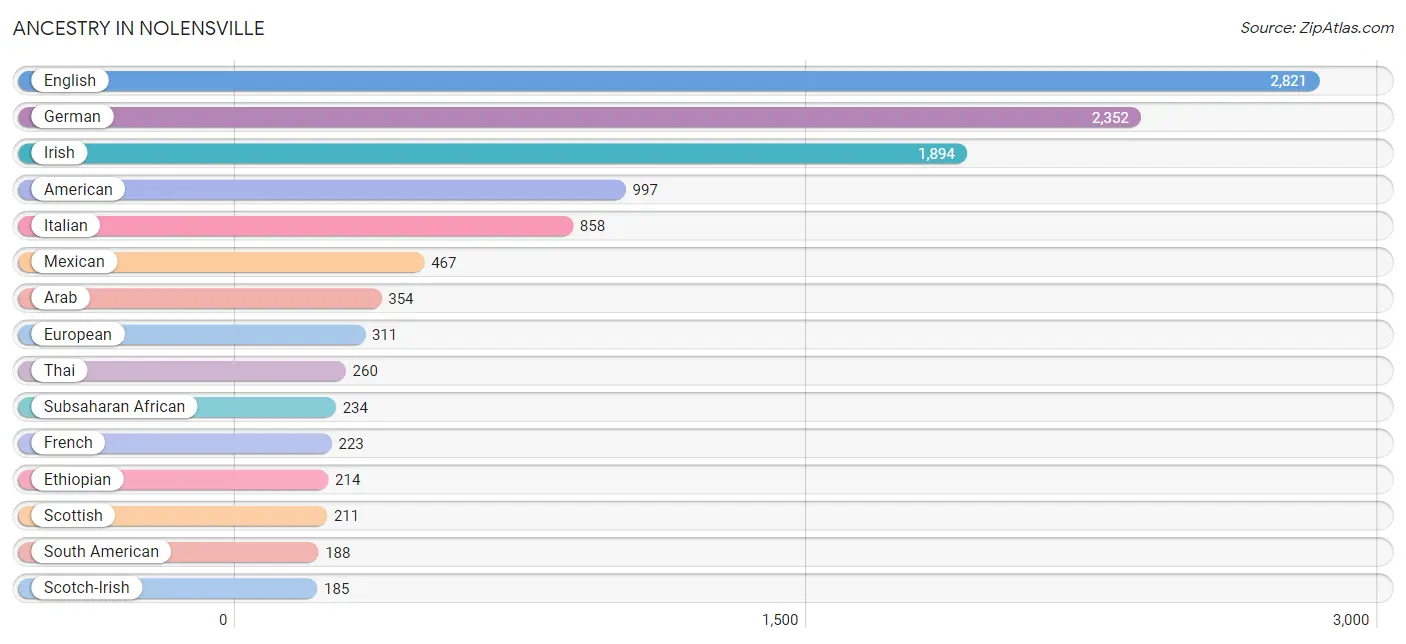
Ancestry in Nolensville
The most populous ancestries reported in Nolensville are English (2,821 | 19.5%), German (2,352 | 16.3%), Irish (1,894 | 13.1%), American (997 | 6.9%), and Italian (858 | 5.9%), together accounting for 61.8% of all Nolensville residents.
| Ancestry | # Population | % Population |
| African | 10 | 0.1% |
| American | 997 | 6.9% |
| Arab | 354 | 2.5% |
| Australian | 35 | 0.2% |
| Bhutanese | 21 | 0.2% |
| Brazilian | 55 | 0.4% |
| British | 110 | 0.8% |
| Canadian | 62 | 0.4% |
| Central American | 53 | 0.4% |
| Cherokee | 47 | 0.3% |
| Chilean | 80 | 0.5% |
| Chippewa | 21 | 0.2% |
| Colombian | 74 | 0.5% |
| Costa Rican | 19 | 0.1% |
| Croatian | 47 | 0.3% |
| Czech | 31 | 0.2% |
| Czechoslovakian | 25 | 0.2% |
| Danish | 98 | 0.7% |
| Dutch | 50 | 0.4% |
| Eastern European | 156 | 1.1% |
| Egyptian | 80 | 0.5% |
| English | 2,821 | 19.5% |
| Ethiopian | 214 | 1.5% |
| European | 311 | 2.1% |
| French | 223 | 1.5% |
| French Canadian | 39 | 0.3% |
| German | 2,352 | 16.3% |
| Ghanaian | 10 | 0.1% |
| Indian (Asian) | 114 | 0.8% |
| Iranian | 13 | 0.1% |
| Iraqi | 97 | 0.7% |
| Irish | 1,894 | 13.1% |
| Italian | 858 | 5.9% |
| Korean | 36 | 0.3% |
| Lebanese | 44 | 0.3% |
| Lithuanian | 12 | 0.1% |
| Malaysian | 75 | 0.5% |
| Mexican | 467 | 3.2% |
| Norwegian | 172 | 1.2% |
| Panamanian | 34 | 0.2% |
| Polish | 147 | 1.0% |
| Puerto Rican | 46 | 0.3% |
| Russian | 34 | 0.2% |
| Scandinavian | 37 | 0.3% |
| Scotch-Irish | 185 | 1.3% |
| Scottish | 211 | 1.5% |
| South American | 188 | 1.3% |
| South American Indian | 80 | 0.5% |
| Spaniard | 59 | 0.4% |
| Sri Lankan | 59 | 0.4% |
| Subsaharan African | 234 | 1.6% |
| Swedish | 70 | 0.5% |
| Swiss | 29 | 0.2% |
| Thai | 260 | 1.8% |
| Ukrainian | 11 | 0.1% |
| Venezuelan | 34 | 0.2% |
| Welsh | 70 | 0.5% | View All 57 Rows |
Immigrants in Nolensville
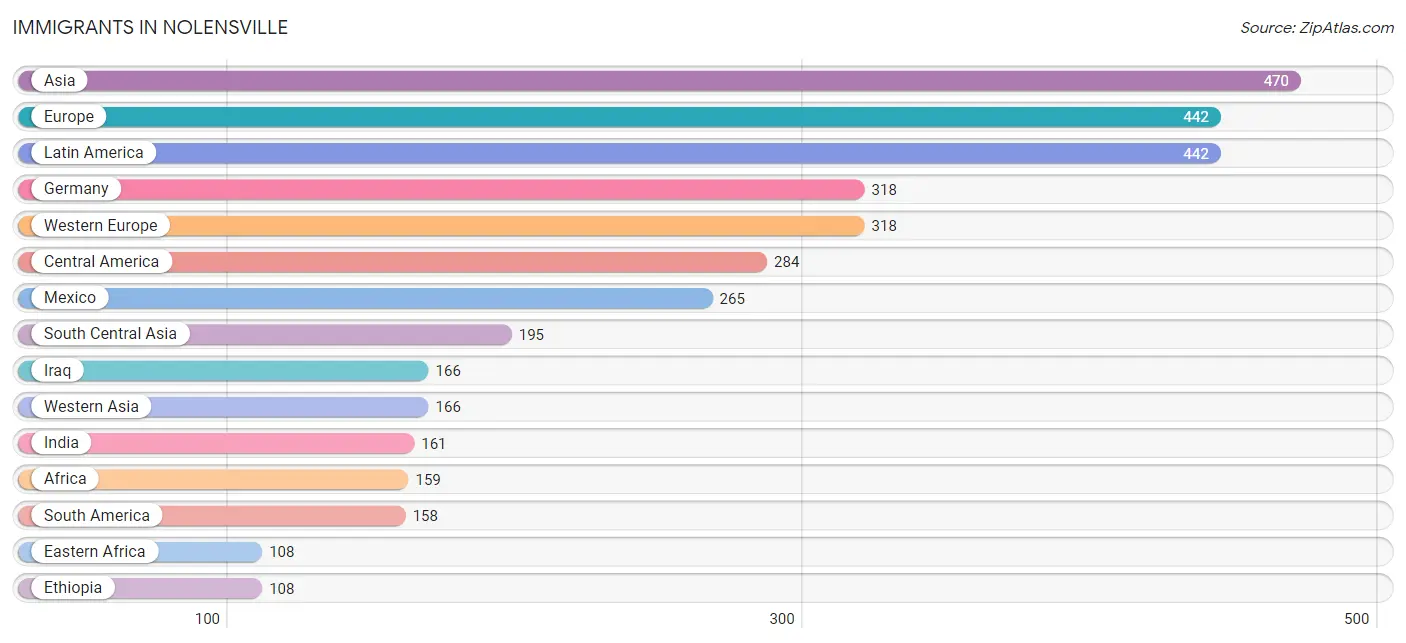
The most numerous immigrant groups reported in Nolensville came from Asia (470 | 3.3%), Europe (442 | 3.1%), Latin America (442 | 3.1%), Germany (318 | 2.2%), and Western Europe (318 | 2.2%), together accounting for 13.8% of all Nolensville residents.
| Immigration Origin | # Population | % Population |
| Africa | 159 | 1.1% |
| Asia | 470 | 3.3% |
| Australia | 15 | 0.1% |
| Brazil | 55 | 0.4% |
| Canada | 95 | 0.7% |
| Central America | 284 | 2.0% |
| Chile | 30 | 0.2% |
| China | 87 | 0.6% |
| Colombia | 47 | 0.3% |
| Costa Rica | 19 | 0.1% |
| Eastern Africa | 108 | 0.7% |
| Eastern Asia | 87 | 0.6% |
| Eastern Europe | 93 | 0.6% |
| Egypt | 41 | 0.3% |
| England | 8 | 0.1% |
| Ethiopia | 108 | 0.7% |
| Europe | 442 | 3.1% |
| Germany | 318 | 2.2% |
| Ghana | 10 | 0.1% |
| India | 161 | 1.1% |
| Iran | 34 | 0.2% |
| Iraq | 166 | 1.1% |
| Laos | 22 | 0.2% |
| Latin America | 442 | 3.1% |
| Mexico | 265 | 1.8% |
| Moldova | 59 | 0.4% |
| Northern Africa | 41 | 0.3% |
| Northern Europe | 8 | 0.1% |
| Oceania | 15 | 0.1% |
| Russia | 34 | 0.2% |
| South America | 158 | 1.1% |
| South Central Asia | 195 | 1.3% |
| South Eastern Asia | 22 | 0.2% |
| Southern Europe | 23 | 0.2% |
| Spain | 23 | 0.2% |
| Venezuela | 26 | 0.2% |
| Western Africa | 10 | 0.1% |
| Western Asia | 166 | 1.1% |
| Western Europe | 318 | 2.2% | View All 39 Rows |
Sex and Age in Nolensville
Sex and Age in Nolensville
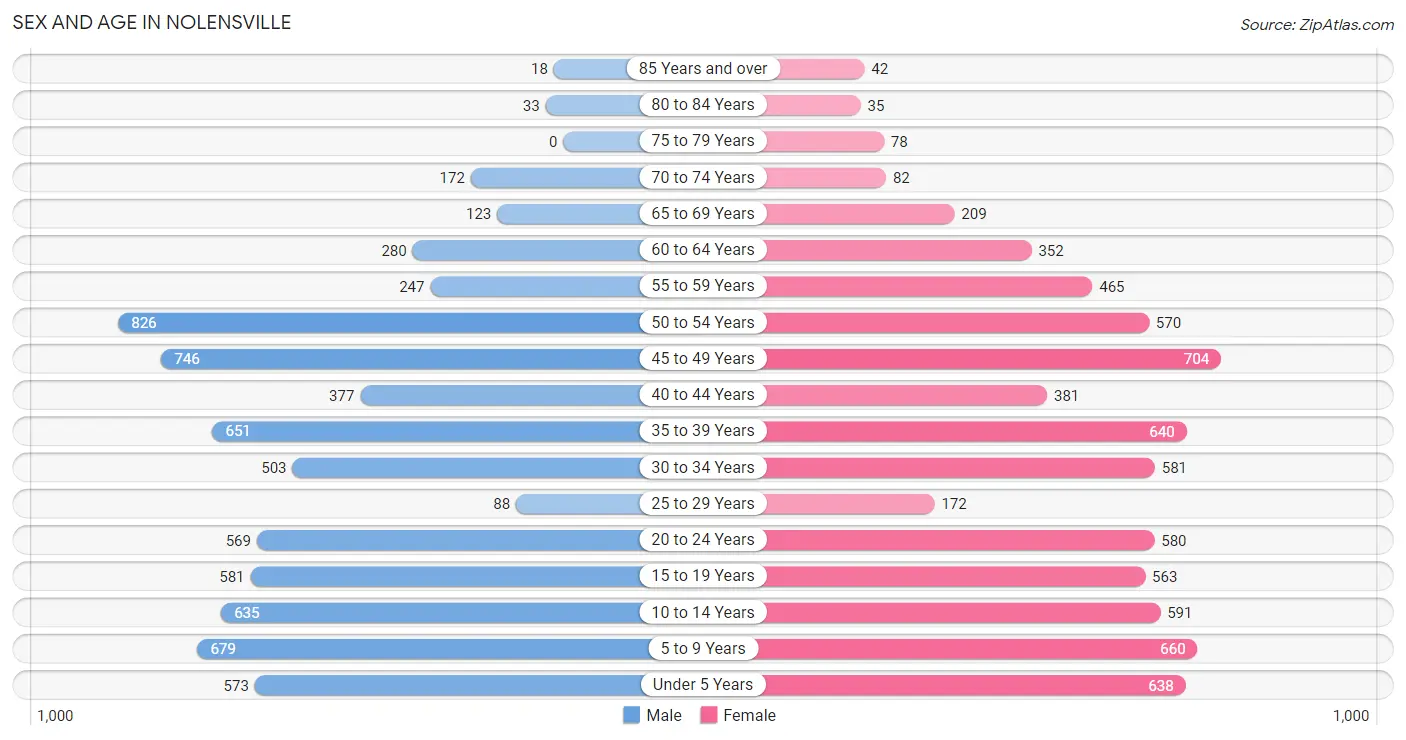
The most populous age groups in Nolensville are 50 to 54 Years (826 | 11.6%) for men and 45 to 49 Years (704 | 9.6%) for women.
| Age Bracket | Male | Female |
| Under 5 Years | 573 (8.1%) | 638 (8.7%) |
| 5 to 9 Years | 679 (9.6%) | 660 (9.0%) |
| 10 to 14 Years | 635 (8.9%) | 591 (8.1%) |
| 15 to 19 Years | 581 (8.2%) | 563 (7.7%) |
| 20 to 24 Years | 569 (8.0%) | 580 (7.9%) |
| 25 to 29 Years | 88 (1.2%) | 172 (2.3%) |
| 30 to 34 Years | 503 (7.1%) | 581 (7.9%) |
| 35 to 39 Years | 651 (9.2%) | 640 (8.7%) |
| 40 to 44 Years | 377 (5.3%) | 381 (5.2%) |
| 45 to 49 Years | 746 (10.5%) | 704 (9.6%) |
| 50 to 54 Years | 826 (11.6%) | 570 (7.8%) |
| 55 to 59 Years | 247 (3.5%) | 465 (6.3%) |
| 60 to 64 Years | 280 (3.9%) | 352 (4.8%) |
| 65 to 69 Years | 123 (1.7%) | 209 (2.9%) |
| 70 to 74 Years | 172 (2.4%) | 82 (1.1%) |
| 75 to 79 Years | 0 (0.0%) | 78 (1.1%) |
| 80 to 84 Years | 33 (0.5%) | 35 (0.5%) |
| 85 Years and over | 18 (0.3%) | 42 (0.6%) |
| Total | 7,101 (100.0%) | 7,343 (100.0%) |
Families and Households in Nolensville
Median Family Size in Nolensville
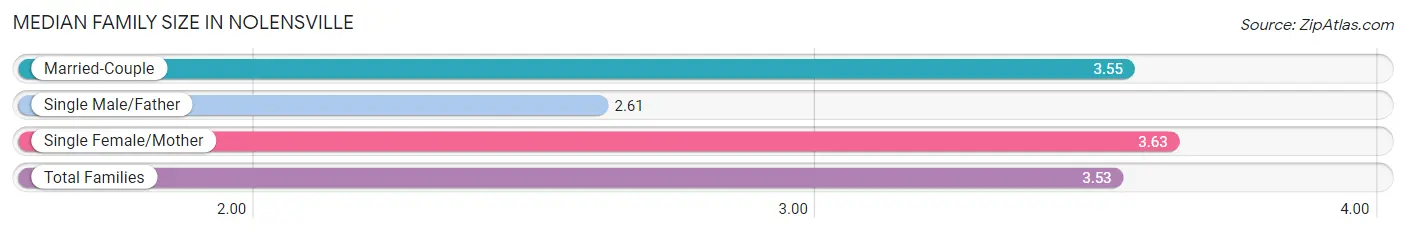
The median family size in Nolensville is 3.53 persons per family, with single female/mother families (344 | 8.8%) accounting for the largest median family size of 3.63 persons per family. On the other hand, single male/father families (133 | 3.4%) represent the smallest median family size with 2.61 persons per family.
| Family Type | # Families | Family Size |
| Married-Couple | 3,421 (87.8%) | 3.55 |
| Single Male/Father | 133 (3.4%) | 2.61 |
| Single Female/Mother | 344 (8.8%) | 3.63 |
| Total Families | 3,898 (100.0%) | 3.53 |
Median Household Size in Nolensville
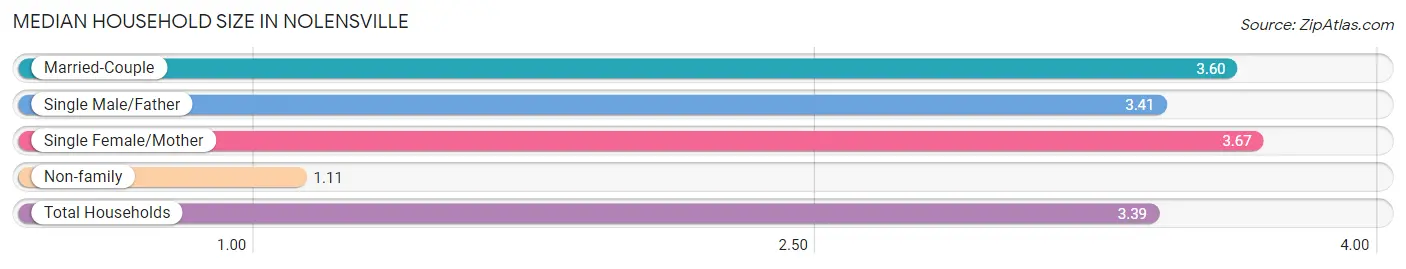
The median household size in Nolensville is 3.39 persons per household, with single female/mother households (344 | 8.1%) accounting for the largest median household size of 3.67 persons per household. non-family households (368 | 8.6%) represent the smallest median household size with 1.11 persons per household.
| Household Type | # Households | Household Size |
| Married-Couple | 3,421 (80.2%) | 3.60 |
| Single Male/Father | 133 (3.1%) | 3.41 |
| Single Female/Mother | 344 (8.1%) | 3.67 |
| Non-family | 368 (8.6%) | 1.11 |
| Total Households | 4,266 (100.0%) | 3.39 |
Household Size by Marriage Status in Nolensville
Out of a total of 4,266 households in Nolensville, 3,898 (91.4%) are family households, while 368 (8.6%) are nonfamily households. The most numerous type of family households are 4-person households, comprising 1,233, and the most common type of nonfamily households are 1-person households, comprising 353.
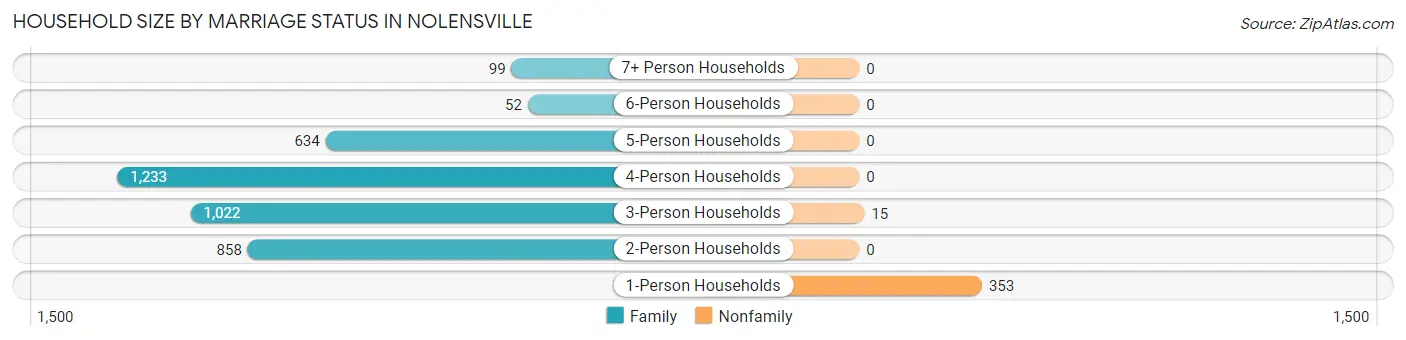
| Household Size | Family Households | Nonfamily Households |
| 1-Person Households | - | 353 (8.3%) |
| 2-Person Households | 858 (20.1%) | 0 (0.0%) |
| 3-Person Households | 1,022 (24.0%) | 15 (0.4%) |
| 4-Person Households | 1,233 (28.9%) | 0 (0.0%) |
| 5-Person Households | 634 (14.9%) | 0 (0.0%) |
| 6-Person Households | 52 (1.2%) | 0 (0.0%) |
| 7+ Person Households | 99 (2.3%) | 0 (0.0%) |
| Total | 3,898 (91.4%) | 368 (8.6%) |
Female Fertility in Nolensville
Fertility by Age in Nolensville
Average fertility rate in Nolensville is 56.0 births per 1,000 women. Women in the age bracket of 20 to 34 years have the highest fertility rate with 88.0 births per 1,000 women. Women in the age bracket of 20 to 34 years acount for 56.2% of all women with births.
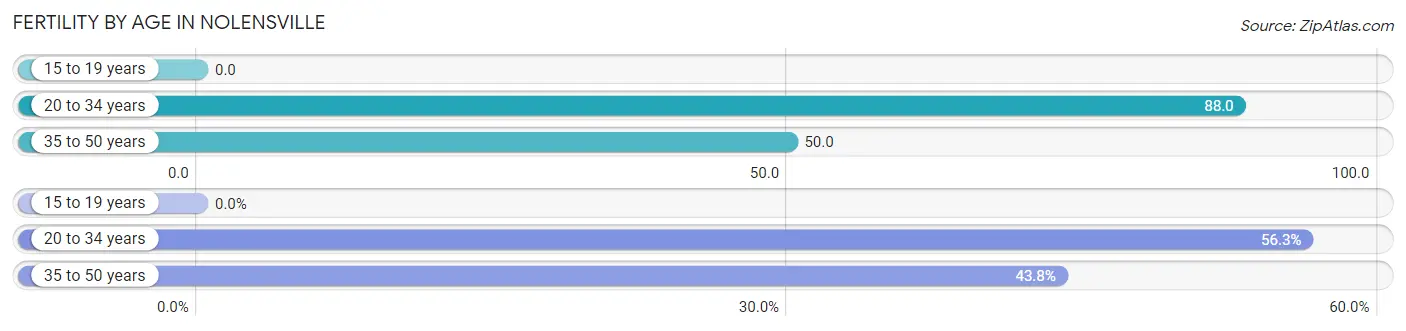
| Age Bracket | Women with Births | Births / 1,000 Women |
| 15 to 19 years | 0 (0.0%) | 0.0 |
| 20 to 34 years | 117 (56.2%) | 88.0 |
| 35 to 50 years | 91 (43.8%) | 50.0 |
| Total | 208 (100.0%) | 56.0 |
Fertility by Age by Marriage Status in Nolensville
90.4% of women with births (208) in Nolensville are married. The highest percentage of unmarried women with births falls into 20 to 34 years age bracket with 17.1% of them unmarried at the time of birth, while the lowest percentage of unmarried women with births belong to 35 to 50 years age bracket with 0.0% of them unmarried.
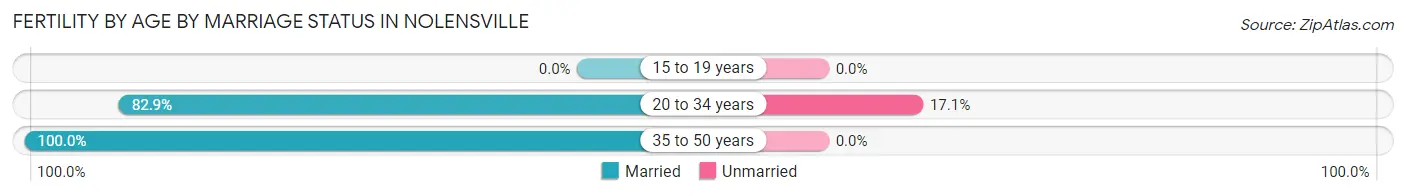
| Age Bracket | Married | Unmarried |
| 15 to 19 years | 0 (0.0%) | 0 (0.0%) |
| 20 to 34 years | 97 (82.9%) | 20 (17.1%) |
| 35 to 50 years | 91 (100.0%) | 0 (0.0%) |
| Total | 188 (90.4%) | 20 (9.6%) |
Fertility by Education in Nolensville
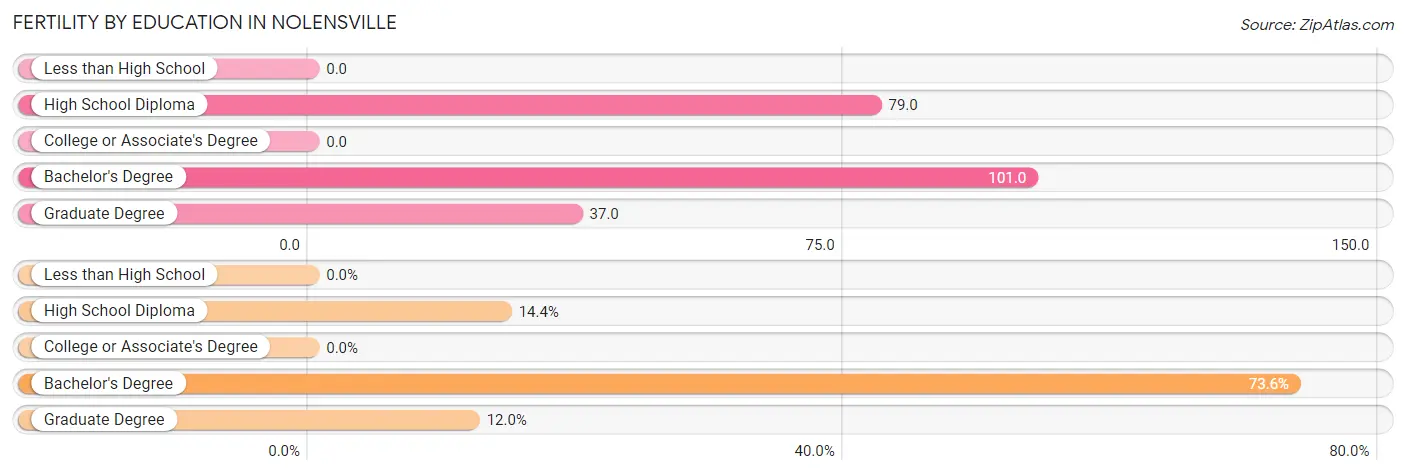
| Educational Attainment | Women with Births | Births / 1,000 Women |
| Less than High School | 0 (0.0%) | 0.0 |
| High School Diploma | 30 (14.4%) | 79.0 |
| College or Associate's Degree | 0 (0.0%) | 0.0 |
| Bachelor's Degree | 153 (73.6%) | 101.0 |
| Graduate Degree | 25 (12.0%) | 37.0 |
| Total | 208 (100.0%) | 56.0 |
Fertility by Education by Marriage Status in Nolensville
9.6% of women with births in Nolensville are unmarried. Women with the educational attainment of bachelor's degree are most likely to be married with 100.0% of them married at childbirth, while women with the educational attainment of high school diploma are least likely to be married with 66.7% of them unmarried at childbirth.
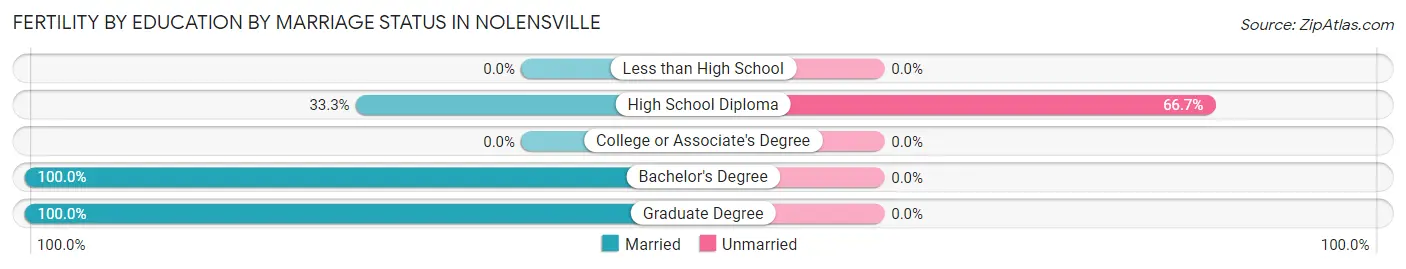
| Educational Attainment | Married | Unmarried |
| Less than High School | 0 (0.0%) | 0 (0.0%) |
| High School Diploma | 10 (33.3%) | 20 (66.7%) |
| College or Associate's Degree | 0 (0.0%) | 0 (0.0%) |
| Bachelor's Degree | 153 (100.0%) | 0 (0.0%) |
| Graduate Degree | 25 (100.0%) | 0 (0.0%) |
| Total | 188 (90.4%) | 20 (9.6%) |
Employment Characteristics in Nolensville
Employment by Class of Employer in Nolensville
Among the 7,835 employed individuals in Nolensville, private company employees (5,292 | 67.5%), local government employees (726 | 9.3%), and self-employed (not incorporated) (552 | 7.0%) make up the most common classes of employment.
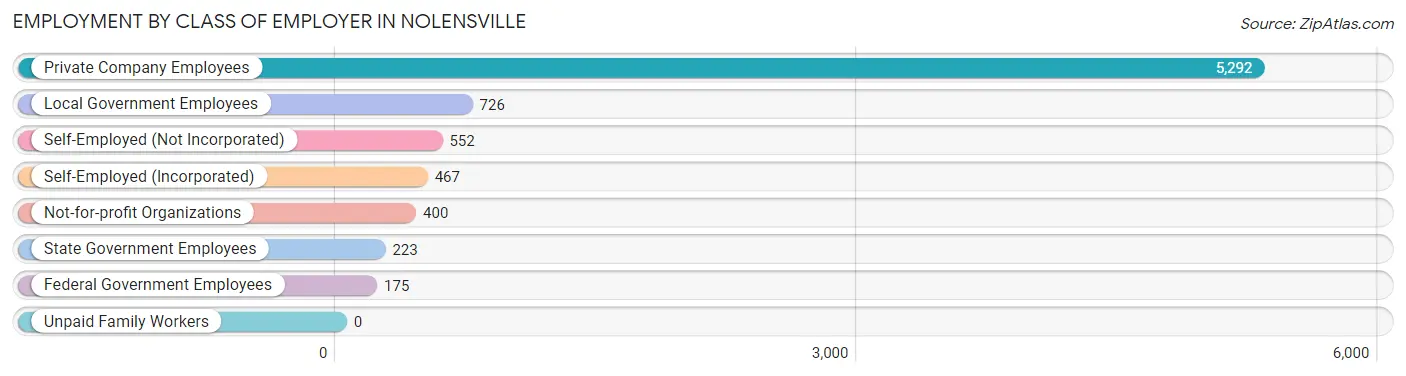
| Employer Class | # Employees | % Employees |
| Private Company Employees | 5,292 | 67.5% |
| Self-Employed (Incorporated) | 467 | 6.0% |
| Self-Employed (Not Incorporated) | 552 | 7.0% |
| Not-for-profit Organizations | 400 | 5.1% |
| Local Government Employees | 726 | 9.3% |
| State Government Employees | 223 | 2.9% |
| Federal Government Employees | 175 | 2.2% |
| Unpaid Family Workers | 0 | 0.0% |
| Total | 7,835 | 100.0% |
Employment Status by Age in Nolensville
According to the labor force statistics for Nolensville, out of the total population over 16 years of age (10,515), 75.4% or 7,928 individuals are in the labor force, with 0.7% or 55 of them unemployed. The age group with the highest labor force participation rate is 25 to 29 years, with 100.0% or 260 individuals in the labor force. Within the labor force, the 16 to 19 years age range has the highest percentage of unemployed individuals, with 5.5% or 22 of them being unemployed.
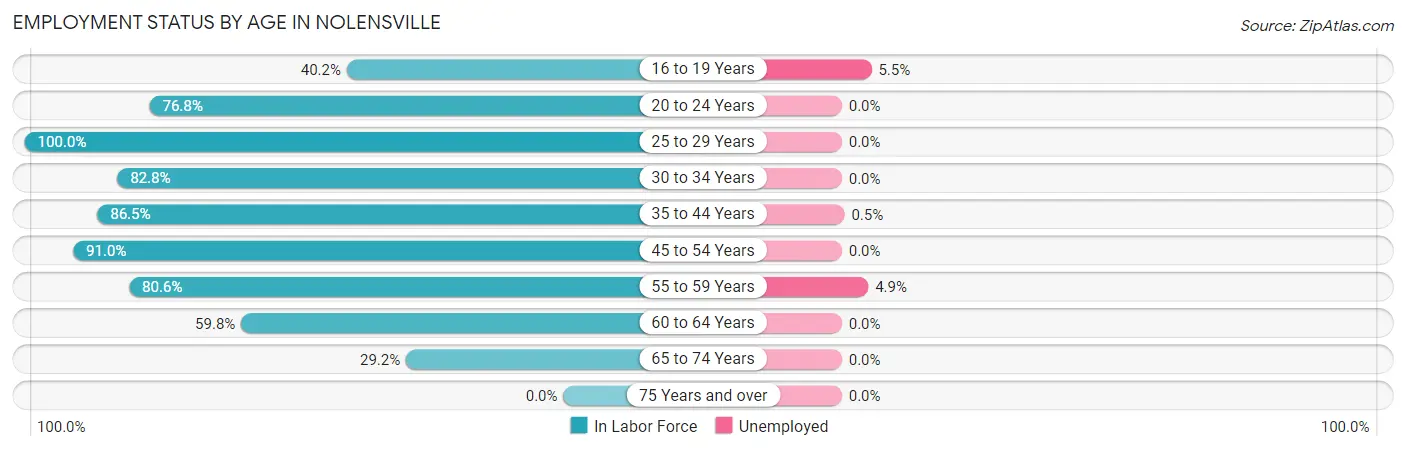
| Age Bracket | In Labor Force | Unemployed |
| 16 to 19 Years | 398 (40.2%) | 22 (5.5%) |
| 20 to 24 Years | 882 (76.8%) | 0 (0.0%) |
| 25 to 29 Years | 260 (100.0%) | 0 (0.0%) |
| 30 to 34 Years | 898 (82.8%) | 0 (0.0%) |
| 35 to 44 Years | 1,772 (86.5%) | 9 (0.5%) |
| 45 to 54 Years | 2,590 (91.0%) | 0 (0.0%) |
| 55 to 59 Years | 574 (80.6%) | 28 (4.9%) |
| 60 to 64 Years | 378 (59.8%) | 0 (0.0%) |
| 65 to 74 Years | 171 (29.2%) | 0 (0.0%) |
| 75 Years and over | 0 (0.0%) | 0 (0.0%) |
| Total | 7,928 (75.4%) | 55 (0.7%) |
Employment Status by Educational Attainment in Nolensville
According to labor force statistics for Nolensville, 85.4% of individuals (6,476) out of the total population between 25 and 64 years of age (7,583) are in the labor force, with 0.6% or 39 of them being unemployed. The group with the highest labor force participation rate are those with the educational attainment of less than high school, with 93.8% or 225 individuals in the labor force. Within the labor force, individuals with college / associate degree education have the highest percentage of unemployment, with 1.0% or 9 of them being unemployed.
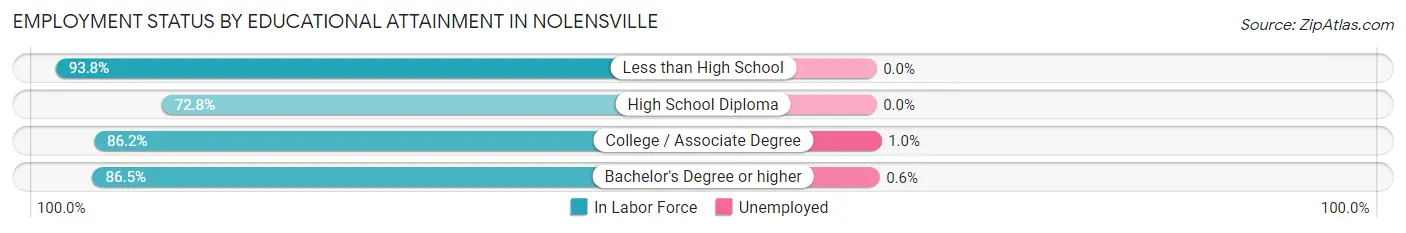
| Educational Attainment | In Labor Force | Unemployed |
| Less than High School | 225 (93.8%) | 0 (0.0%) |
| High School Diploma | 542 (72.8%) | 0 (0.0%) |
| College / Associate Degree | 879 (86.2%) | 10 (1.0%) |
| Bachelor's Degree or higher | 4,826 (86.5%) | 33 (0.6%) |
| Total | 6,476 (85.4%) | 45 (0.6%) |
Employment Occupations by Sex in Nolensville
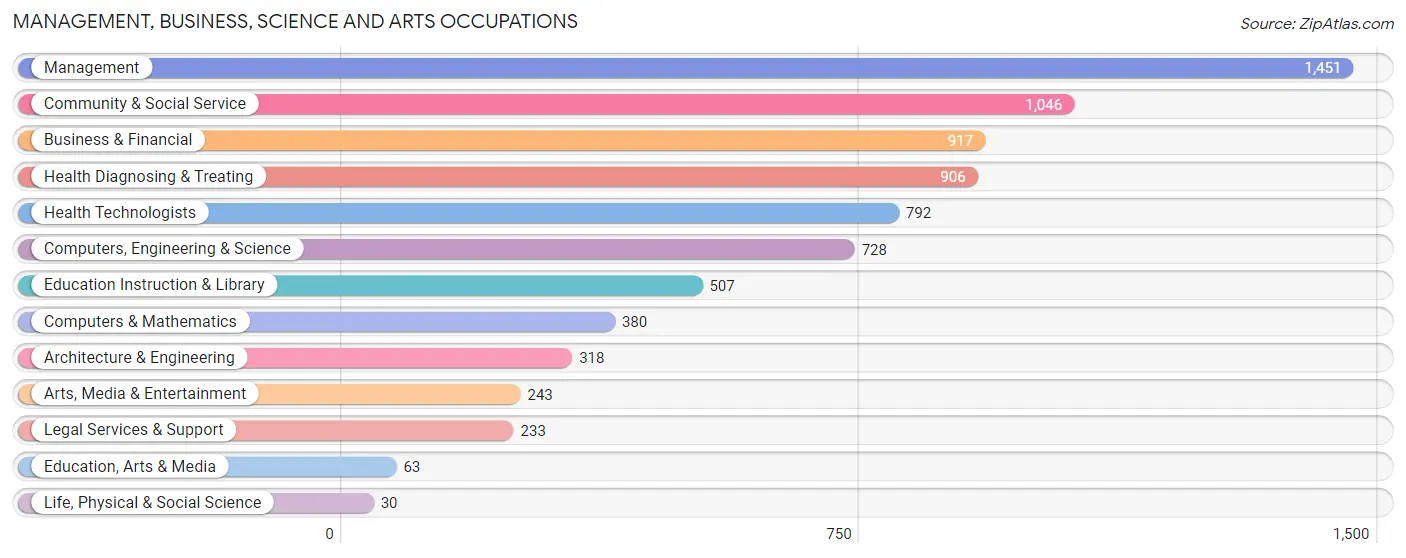
Management, Business, Science and Arts Occupations
The most common Management, Business, Science and Arts occupations in Nolensville are Management (1,451 | 18.4%), Community & Social Service (1,046 | 13.3%), Business & Financial (917 | 11.7%), Health Diagnosing & Treating (906 | 11.5%), and Health Technologists (792 | 10.1%).
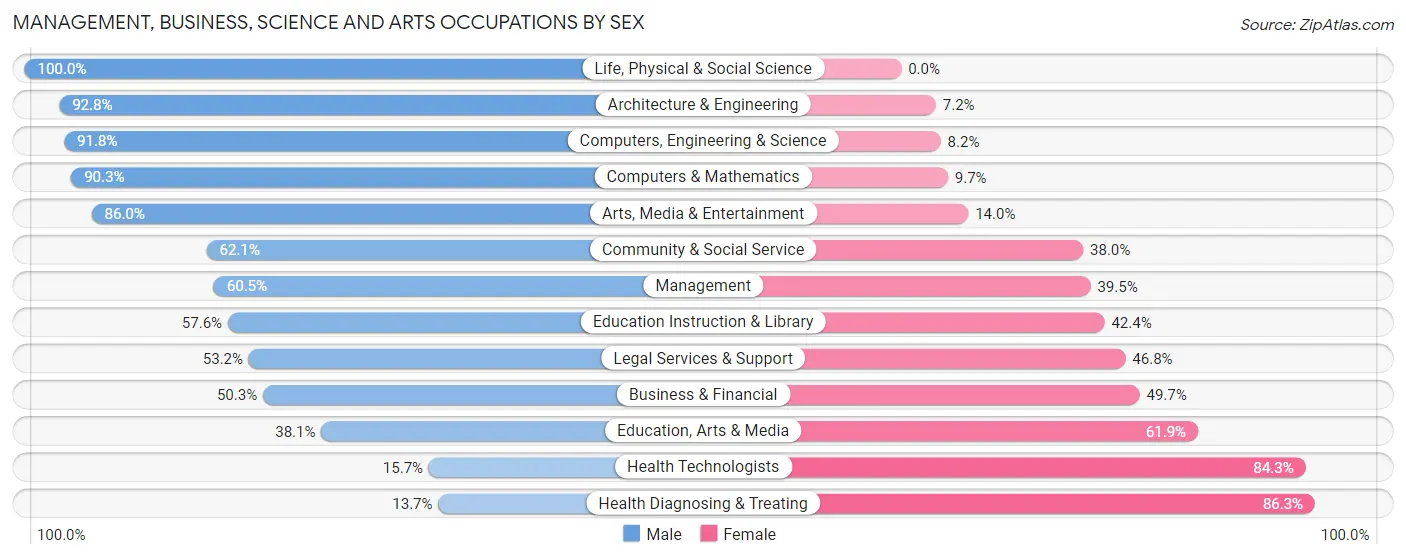
Management, Business, Science and Arts Occupations by Sex
Within the Management, Business, Science and Arts occupations in Nolensville, the most male-oriented occupations are Life, Physical & Social Science (100.0%), Architecture & Engineering (92.8%), and Computers, Engineering & Science (91.8%), while the most female-oriented occupations are Health Diagnosing & Treating (86.3%), Health Technologists (84.3%), and Education, Arts & Media (61.9%).
| Occupation | Male | Female |
| Management | 878 (60.5%) | 573 (39.5%) |
| Business & Financial | 461 (50.3%) | 456 (49.7%) |
| Computers, Engineering & Science | 668 (91.8%) | 60 (8.2%) |
| Computers & Mathematics | 343 (90.3%) | 37 (9.7%) |
| Architecture & Engineering | 295 (92.8%) | 23 (7.2%) |
| Life, Physical & Social Science | 30 (100.0%) | 0 (0.0%) |
| Community & Social Service | 649 (62.1%) | 397 (38.0%) |
| Education, Arts & Media | 24 (38.1%) | 39 (61.9%) |
| Legal Services & Support | 124 (53.2%) | 109 (46.8%) |
| Education Instruction & Library | 292 (57.6%) | 215 (42.4%) |
| Arts, Media & Entertainment | 209 (86.0%) | 34 (14.0%) |
| Health Diagnosing & Treating | 124 (13.7%) | 782 (86.3%) |
| Health Technologists | 124 (15.7%) | 668 (84.3%) |
| Total (Category) | 2,780 (55.1%) | 2,268 (44.9%) |
| Total (Overall) | 4,346 (55.2%) | 3,520 (44.8%) |
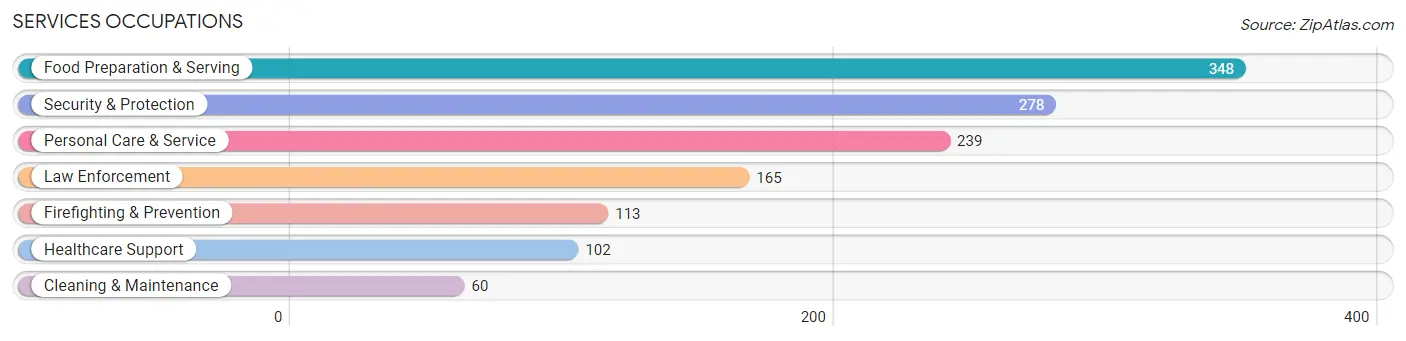
Services Occupations
The most common Services occupations in Nolensville are Food Preparation & Serving (348 | 4.4%), Security & Protection (278 | 3.5%), Personal Care & Service (239 | 3.0%), Law Enforcement (165 | 2.1%), and Firefighting & Prevention (113 | 1.4%).
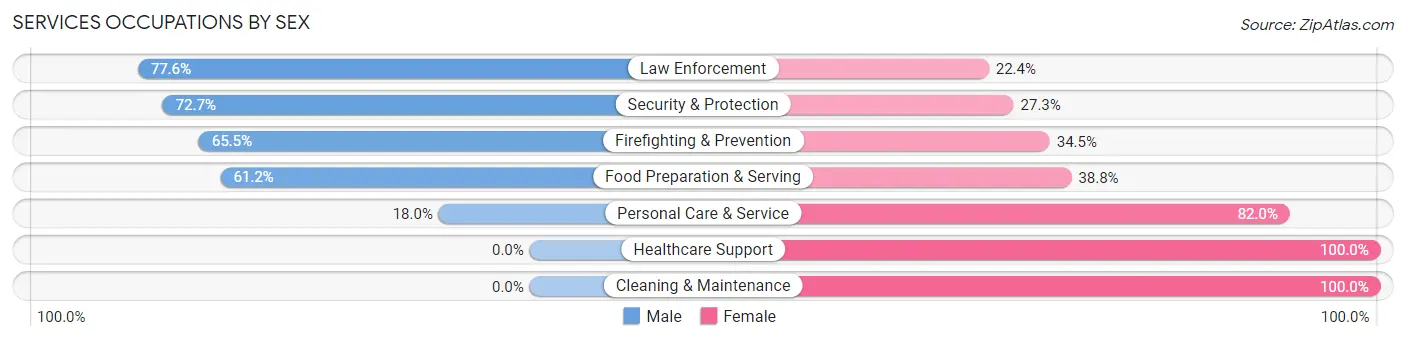
Services Occupations by Sex
Within the Services occupations in Nolensville, the most male-oriented occupations are Law Enforcement (77.6%), Security & Protection (72.7%), and Firefighting & Prevention (65.5%), while the most female-oriented occupations are Healthcare Support (100.0%), Cleaning & Maintenance (100.0%), and Personal Care & Service (82.0%).
| Occupation | Male | Female |
| Healthcare Support | 0 (0.0%) | 102 (100.0%) |
| Security & Protection | 202 (72.7%) | 76 (27.3%) |
| Firefighting & Prevention | 74 (65.5%) | 39 (34.5%) |
| Law Enforcement | 128 (77.6%) | 37 (22.4%) |
| Food Preparation & Serving | 213 (61.2%) | 135 (38.8%) |
| Cleaning & Maintenance | 0 (0.0%) | 60 (100.0%) |
| Personal Care & Service | 43 (18.0%) | 196 (82.0%) |
| Total (Category) | 458 (44.6%) | 569 (55.4%) |
| Total (Overall) | 4,346 (55.2%) | 3,520 (44.8%) |
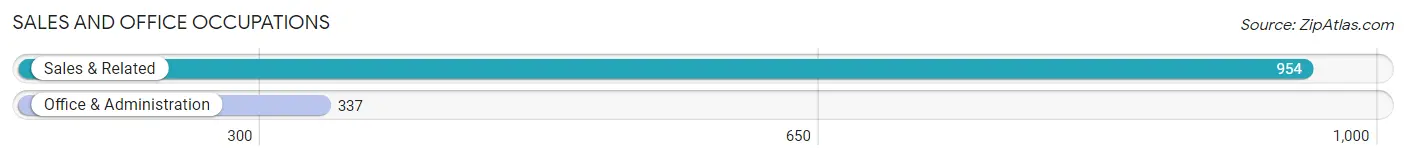
Sales and Office Occupations
The most common Sales and Office occupations in Nolensville are Sales & Related (954 | 12.1%), and Office & Administration (337 | 4.3%).
Sales and Office Occupations by Sex
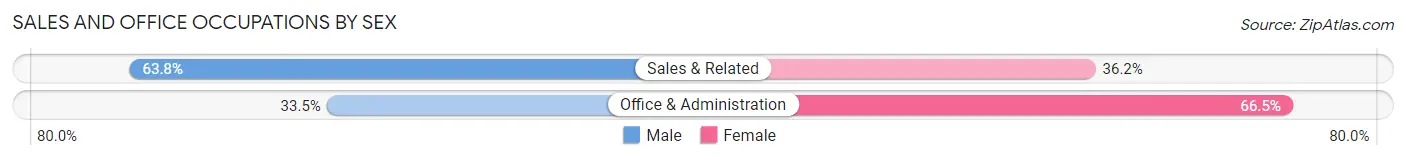
| Occupation | Male | Female |
| Sales & Related | 609 (63.8%) | 345 (36.2%) |
| Office & Administration | 113 (33.5%) | 224 (66.5%) |
| Total (Category) | 722 (55.9%) | 569 (44.1%) |
| Total (Overall) | 4,346 (55.2%) | 3,520 (44.8%) |
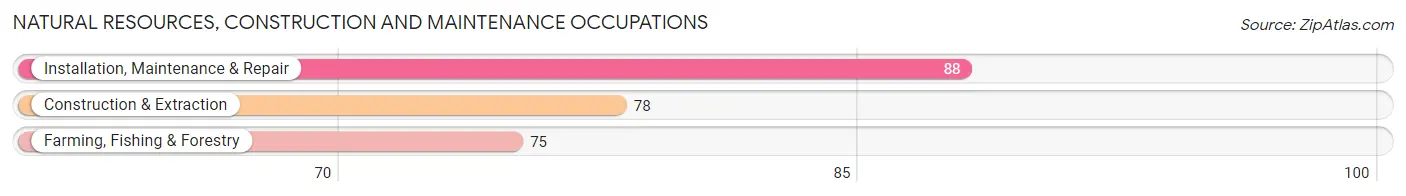
Natural Resources, Construction and Maintenance Occupations
The most common Natural Resources, Construction and Maintenance occupations in Nolensville are Installation, Maintenance & Repair (88 | 1.1%), Construction & Extraction (78 | 1.0%), and Farming, Fishing & Forestry (75 | 0.9%).
Natural Resources, Construction and Maintenance Occupations by Sex
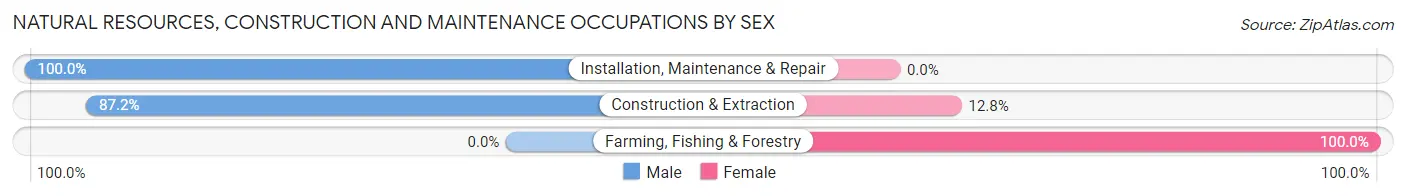
| Occupation | Male | Female |
| Farming, Fishing & Forestry | 0 (0.0%) | 75 (100.0%) |
| Construction & Extraction | 68 (87.2%) | 10 (12.8%) |
| Installation, Maintenance & Repair | 88 (100.0%) | 0 (0.0%) |
| Total (Category) | 156 (64.7%) | 85 (35.3%) |
| Total (Overall) | 4,346 (55.2%) | 3,520 (44.8%) |
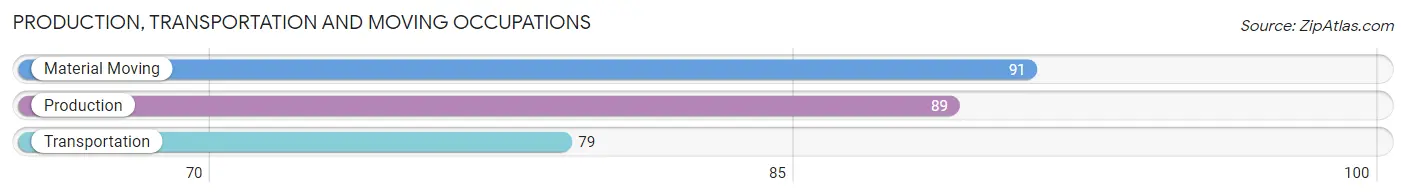
Production, Transportation and Moving Occupations
The most common Production, Transportation and Moving occupations in Nolensville are Material Moving (91 | 1.2%), Production (89 | 1.1%), and Transportation (79 | 1.0%).
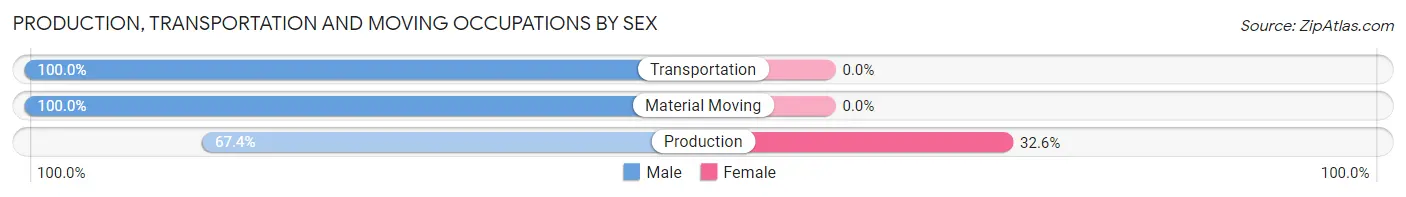
Production, Transportation and Moving Occupations by Sex
| Occupation | Male | Female |
| Production | 60 (67.4%) | 29 (32.6%) |
| Transportation | 79 (100.0%) | 0 (0.0%) |
| Material Moving | 91 (100.0%) | 0 (0.0%) |
| Total (Category) | 230 (88.8%) | 29 (11.2%) |
| Total (Overall) | 4,346 (55.2%) | 3,520 (44.8%) |
Employment Industries by Sex in Nolensville
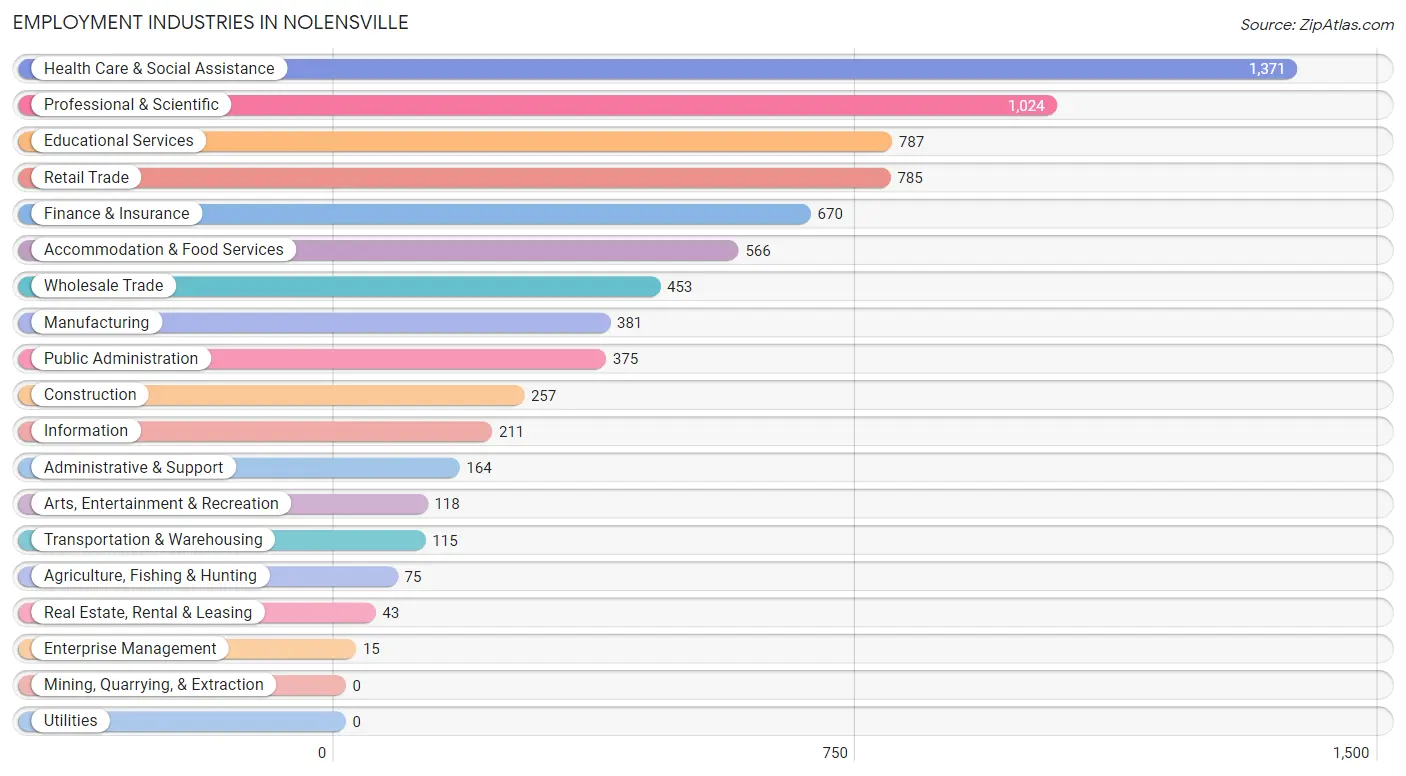
Employment Industries in Nolensville
The major employment industries in Nolensville include Health Care & Social Assistance (1,371 | 17.4%), Professional & Scientific (1,024 | 13.0%), Educational Services (787 | 10.0%), Retail Trade (785 | 10.0%), and Finance & Insurance (670 | 8.5%).
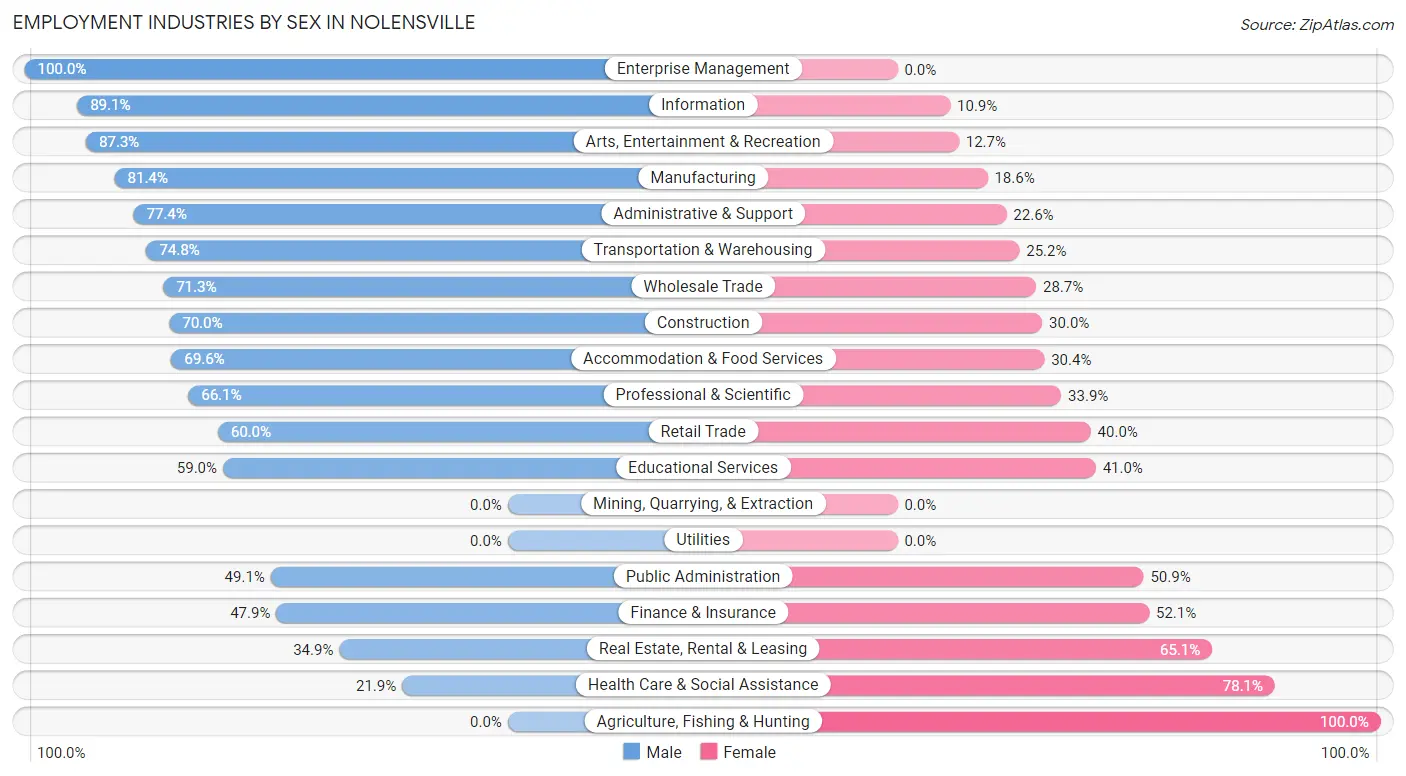
Employment Industries by Sex in Nolensville
The Nolensville industries that see more men than women are Enterprise Management (100.0%), Information (89.1%), and Arts, Entertainment & Recreation (87.3%), whereas the industries that tend to have a higher number of women are Agriculture, Fishing & Hunting (100.0%), Health Care & Social Assistance (78.1%), and Real Estate, Rental & Leasing (65.1%).
| Industry | Male | Female |
| Agriculture, Fishing & Hunting | 0 (0.0%) | 75 (100.0%) |
| Mining, Quarrying, & Extraction | 0 (0.0%) | 0 (0.0%) |
| Construction | 180 (70.0%) | 77 (30.0%) |
| Manufacturing | 310 (81.4%) | 71 (18.6%) |
| Wholesale Trade | 323 (71.3%) | 130 (28.7%) |
| Retail Trade | 471 (60.0%) | 314 (40.0%) |
| Transportation & Warehousing | 86 (74.8%) | 29 (25.2%) |
| Utilities | 0 (0.0%) | 0 (0.0%) |
| Information | 188 (89.1%) | 23 (10.9%) |
| Finance & Insurance | 321 (47.9%) | 349 (52.1%) |
| Real Estate, Rental & Leasing | 15 (34.9%) | 28 (65.1%) |
| Professional & Scientific | 677 (66.1%) | 347 (33.9%) |
| Enterprise Management | 15 (100.0%) | 0 (0.0%) |
| Administrative & Support | 127 (77.4%) | 37 (22.6%) |
| Educational Services | 464 (59.0%) | 323 (41.0%) |
| Health Care & Social Assistance | 300 (21.9%) | 1,071 (78.1%) |
| Arts, Entertainment & Recreation | 103 (87.3%) | 15 (12.7%) |
| Accommodation & Food Services | 394 (69.6%) | 172 (30.4%) |
| Public Administration | 184 (49.1%) | 191 (50.9%) |
| Total | 4,346 (55.2%) | 3,520 (44.8%) |
Education in Nolensville
School Enrollment in Nolensville
The most common levels of schooling among the 4,734 students in Nolensville are middle school (1,015 | 21.4%), high school (1,006 | 21.2%), and elementary school (989 | 20.9%).
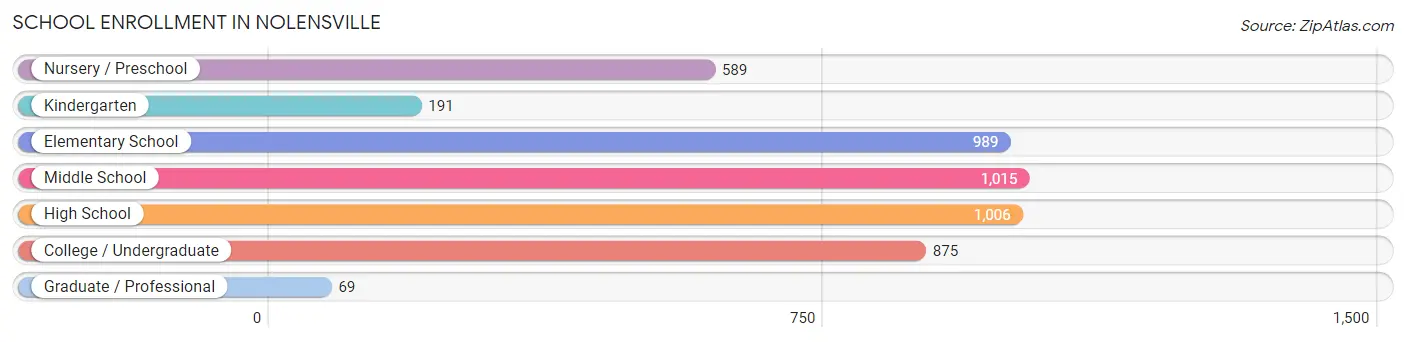
| School Level | # Students | % Students |
| Nursery / Preschool | 589 | 12.4% |
| Kindergarten | 191 | 4.0% |
| Elementary School | 989 | 20.9% |
| Middle School | 1,015 | 21.4% |
| High School | 1,006 | 21.2% |
| College / Undergraduate | 875 | 18.5% |
| Graduate / Professional | 69 | 1.5% |
| Total | 4,734 | 100.0% |
School Enrollment by Age by Funding Source in Nolensville
Out of a total of 4,734 students who are enrolled in schools in Nolensville, 847 (17.9%) attend a private institution, while the remaining 3,887 (82.1%) are enrolled in public schools. The age group of 25 to 34 year olds has the highest likelihood of being enrolled in private schools, with 30 (58.8% in the age bracket) enrolled. Conversely, the age group of 35 years and over has the lowest likelihood of being enrolled in a private school, with 157 (100.0% in the age bracket) attending a public institution.
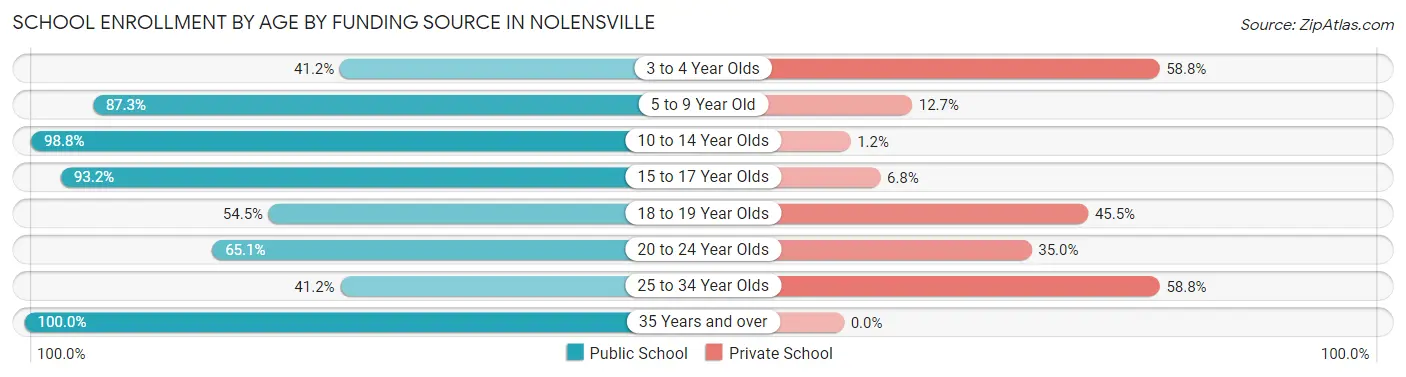
| Age Bracket | Public School | Private School |
| 3 to 4 Year Olds | 167 (41.2%) | 238 (58.8%) |
| 5 to 9 Year Old | 1,135 (87.3%) | 165 (12.7%) |
| 10 to 14 Year Olds | 1,211 (98.8%) | 15 (1.2%) |
| 15 to 17 Year Olds | 661 (93.2%) | 48 (6.8%) |
| 18 to 19 Year Olds | 224 (54.5%) | 187 (45.5%) |
| 20 to 24 Year Olds | 309 (65.0%) | 166 (34.9%) |
| 25 to 34 Year Olds | 21 (41.2%) | 30 (58.8%) |
| 35 Years and over | 157 (100.0%) | 0 (0.0%) |
| Total | 3,887 (82.1%) | 847 (17.9%) |
Educational Attainment by Field of Study in Nolensville
Business (1,201 | 18.9%), science & technology (824 | 13.0%), education (666 | 10.5%), communications (573 | 9.0%), and engineering (515 | 8.1%) are the most common fields of study among 6,342 individuals in Nolensville who have obtained a bachelor's degree or higher.
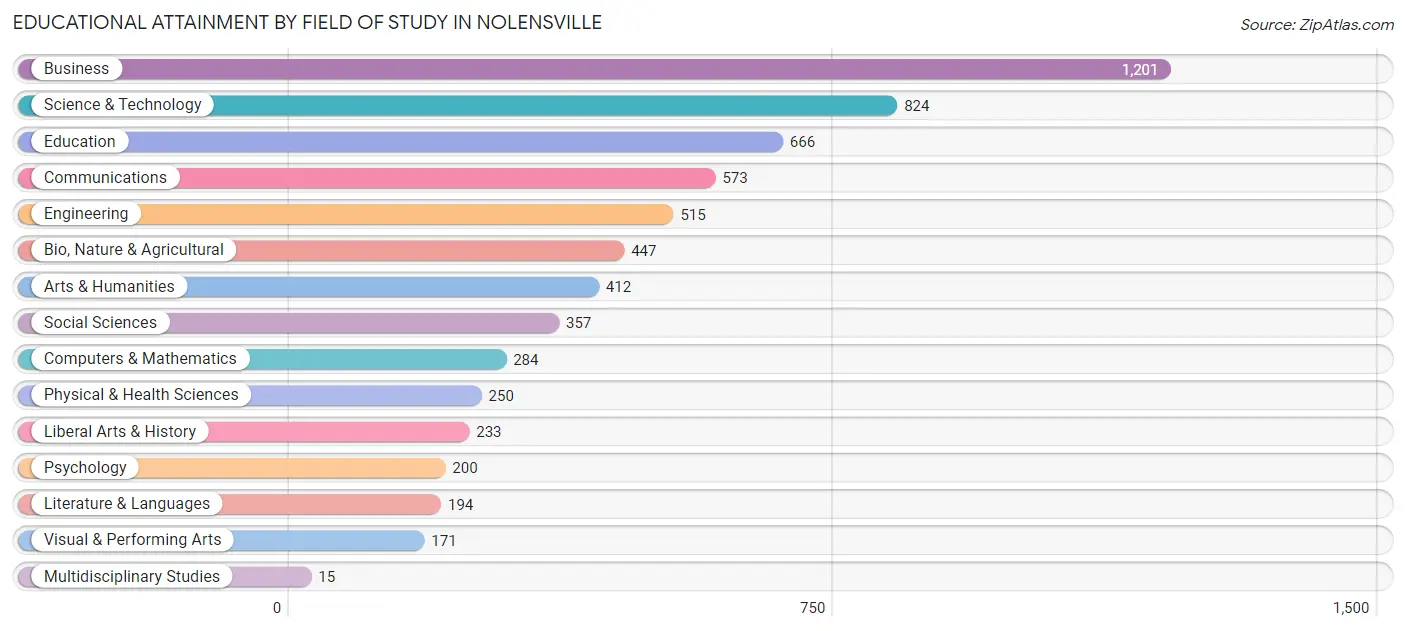
| Field of Study | # Graduates | % Graduates |
| Computers & Mathematics | 284 | 4.5% |
| Bio, Nature & Agricultural | 447 | 7.0% |
| Physical & Health Sciences | 250 | 3.9% |
| Psychology | 200 | 3.2% |
| Social Sciences | 357 | 5.6% |
| Engineering | 515 | 8.1% |
| Multidisciplinary Studies | 15 | 0.2% |
| Science & Technology | 824 | 13.0% |
| Business | 1,201 | 18.9% |
| Education | 666 | 10.5% |
| Literature & Languages | 194 | 3.1% |
| Liberal Arts & History | 233 | 3.7% |
| Visual & Performing Arts | 171 | 2.7% |
| Communications | 573 | 9.0% |
| Arts & Humanities | 412 | 6.5% |
| Total | 6,342 | 100.0% |
Transportation & Commute in Nolensville
Vehicle Availability by Sex in Nolensville
The most prevalent vehicle ownership categories in Nolensville are males with 2 vehicles (2,055, accounting for 47.6%) and females with 2 vehicles (1,719, making up 58.4%).
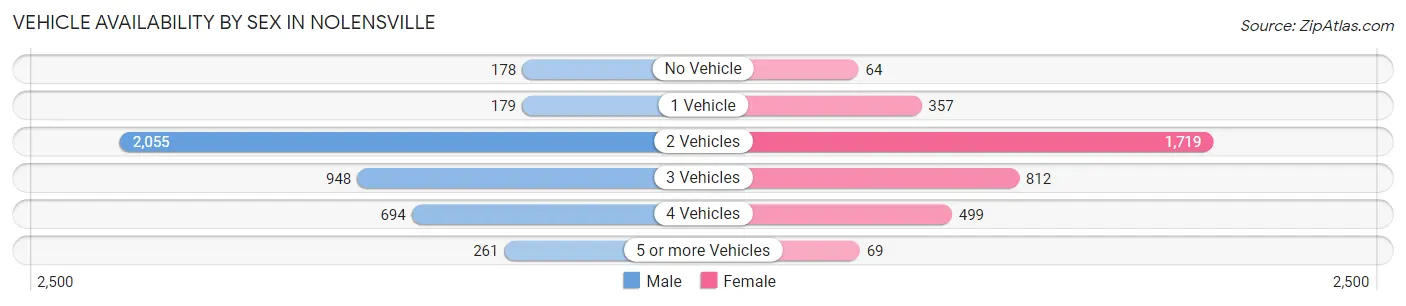
| Vehicles Available | Male | Female |
| No Vehicle | 178 (4.1%) | 64 (1.8%) |
| 1 Vehicle | 179 (4.2%) | 357 (10.1%) |
| 2 Vehicles | 2,055 (47.6%) | 1,719 (48.8%) |
| 3 Vehicles | 948 (22.0%) | 812 (23.1%) |
| 4 Vehicles | 694 (16.1%) | 499 (14.2%) |
| 5 or more Vehicles | 261 (6.0%) | 69 (2.0%) |
| Total | 4,315 (100.0%) | 3,520 (100.0%) |
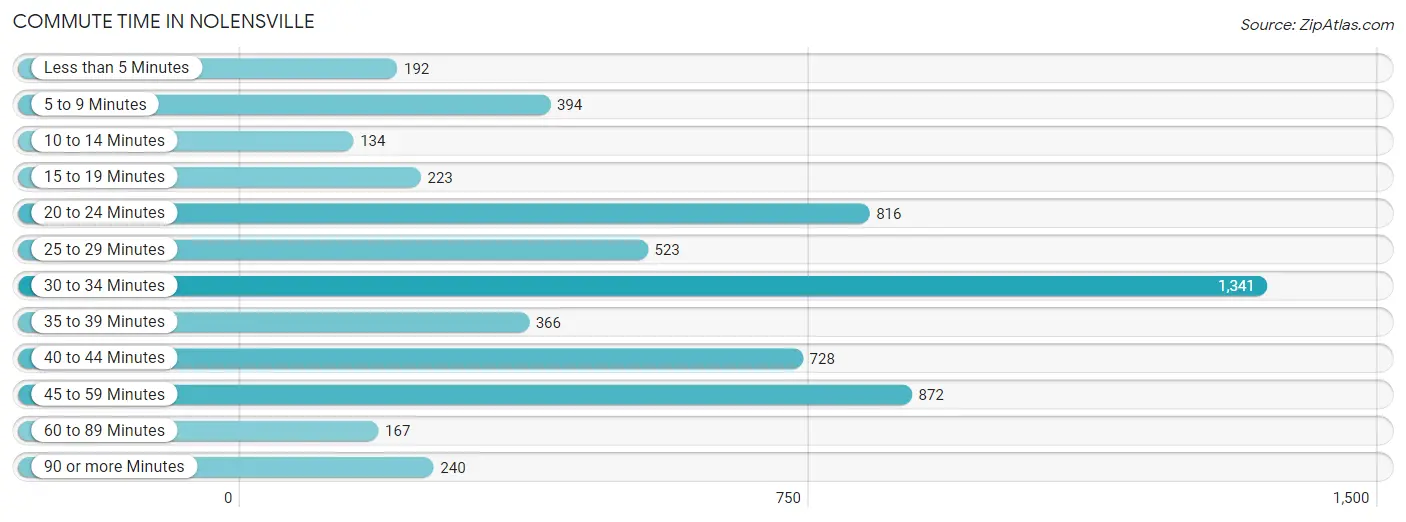
Commute Time in Nolensville
The most frequently occuring commute durations in Nolensville are 30 to 34 minutes (1,341 commuters, 22.4%), 45 to 59 minutes (872 commuters, 14.5%), and 20 to 24 minutes (816 commuters, 13.6%).
| Commute Time | # Commuters | % Commuters |
| Less than 5 Minutes | 192 | 3.2% |
| 5 to 9 Minutes | 394 | 6.6% |
| 10 to 14 Minutes | 134 | 2.2% |
| 15 to 19 Minutes | 223 | 3.7% |
| 20 to 24 Minutes | 816 | 13.6% |
| 25 to 29 Minutes | 523 | 8.7% |
| 30 to 34 Minutes | 1,341 | 22.4% |
| 35 to 39 Minutes | 366 | 6.1% |
| 40 to 44 Minutes | 728 | 12.1% |
| 45 to 59 Minutes | 872 | 14.5% |
| 60 to 89 Minutes | 167 | 2.8% |
| 90 or more Minutes | 240 | 4.0% |
Commute Time by Sex in Nolensville
The most common commute times in Nolensville are 30 to 34 minutes (888 commuters, 26.8%) for males and 40 to 44 minutes (581 commuters, 21.7%) for females.
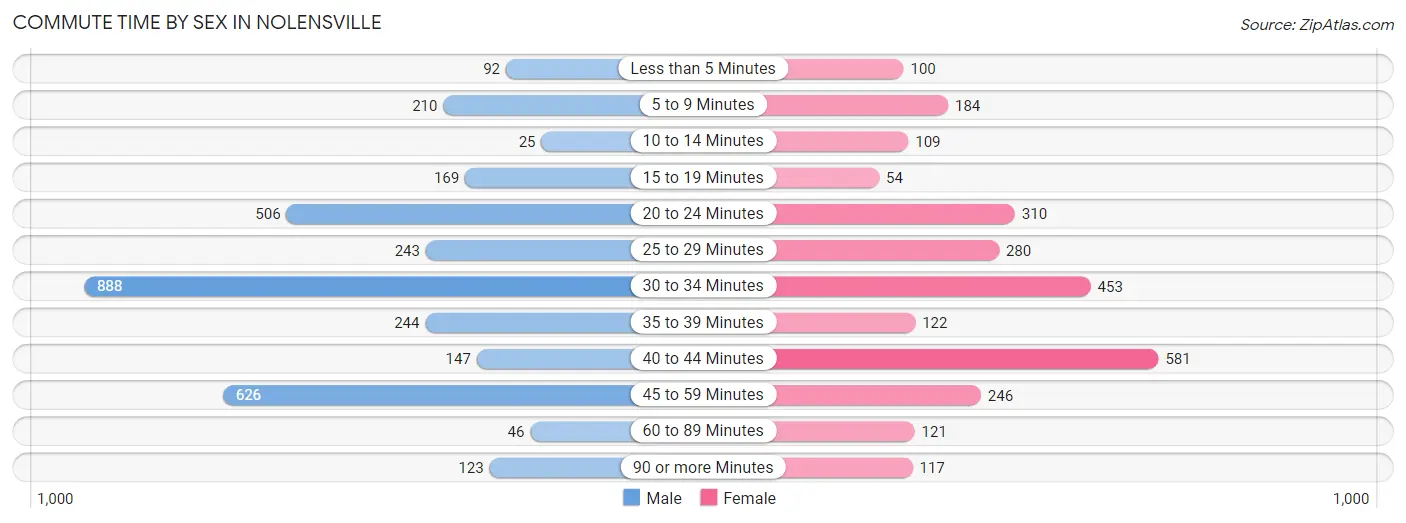
| Commute Time | Male | Female |
| Less than 5 Minutes | 92 (2.8%) | 100 (3.7%) |
| 5 to 9 Minutes | 210 (6.3%) | 184 (6.9%) |
| 10 to 14 Minutes | 25 (0.7%) | 109 (4.1%) |
| 15 to 19 Minutes | 169 (5.1%) | 54 (2.0%) |
| 20 to 24 Minutes | 506 (15.2%) | 310 (11.6%) |
| 25 to 29 Minutes | 243 (7.3%) | 280 (10.5%) |
| 30 to 34 Minutes | 888 (26.8%) | 453 (16.9%) |
| 35 to 39 Minutes | 244 (7.3%) | 122 (4.6%) |
| 40 to 44 Minutes | 147 (4.4%) | 581 (21.7%) |
| 45 to 59 Minutes | 626 (18.9%) | 246 (9.2%) |
| 60 to 89 Minutes | 46 (1.4%) | 121 (4.5%) |
| 90 or more Minutes | 123 (3.7%) | 117 (4.4%) |
Time of Departure to Work by Sex in Nolensville
The most frequent times of departure to work in Nolensville are 7:00 AM to 7:29 AM (611, 18.4%) for males and 7:30 AM to 7:59 AM (439, 16.4%) for females.
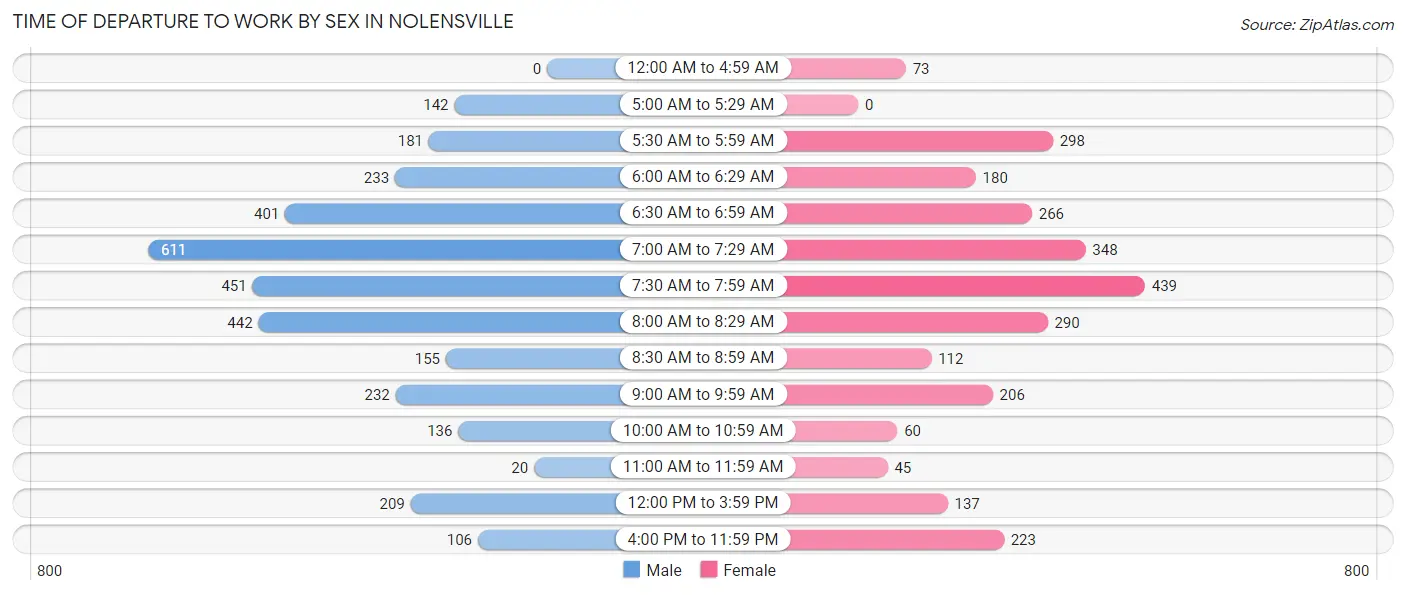
| Time of Departure | Male | Female |
| 12:00 AM to 4:59 AM | 0 (0.0%) | 73 (2.7%) |
| 5:00 AM to 5:29 AM | 142 (4.3%) | 0 (0.0%) |
| 5:30 AM to 5:59 AM | 181 (5.4%) | 298 (11.1%) |
| 6:00 AM to 6:29 AM | 233 (7.0%) | 180 (6.7%) |
| 6:30 AM to 6:59 AM | 401 (12.1%) | 266 (9.9%) |
| 7:00 AM to 7:29 AM | 611 (18.4%) | 348 (13.0%) |
| 7:30 AM to 7:59 AM | 451 (13.6%) | 439 (16.4%) |
| 8:00 AM to 8:29 AM | 442 (13.3%) | 290 (10.8%) |
| 8:30 AM to 8:59 AM | 155 (4.7%) | 112 (4.2%) |
| 9:00 AM to 9:59 AM | 232 (7.0%) | 206 (7.7%) |
| 10:00 AM to 10:59 AM | 136 (4.1%) | 60 (2.2%) |
| 11:00 AM to 11:59 AM | 20 (0.6%) | 45 (1.7%) |
| 12:00 PM to 3:59 PM | 209 (6.3%) | 137 (5.1%) |
| 4:00 PM to 11:59 PM | 106 (3.2%) | 223 (8.3%) |
| Total | 3,319 (100.0%) | 2,677 (100.0%) |
Housing Occupancy in Nolensville
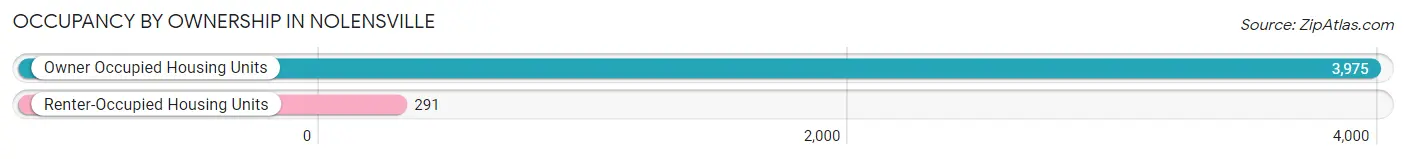
Occupancy by Ownership in Nolensville
Of the total 4,266 dwellings in Nolensville, owner-occupied units account for 3,975 (93.2%), while renter-occupied units make up 291 (6.8%).
| Occupancy | # Housing Units | % Housing Units |
| Owner Occupied Housing Units | 3,975 | 93.2% |
| Renter-Occupied Housing Units | 291 | 6.8% |
| Total Occupied Housing Units | 4,266 | 100.0% |
Occupancy by Household Size in Nolensville
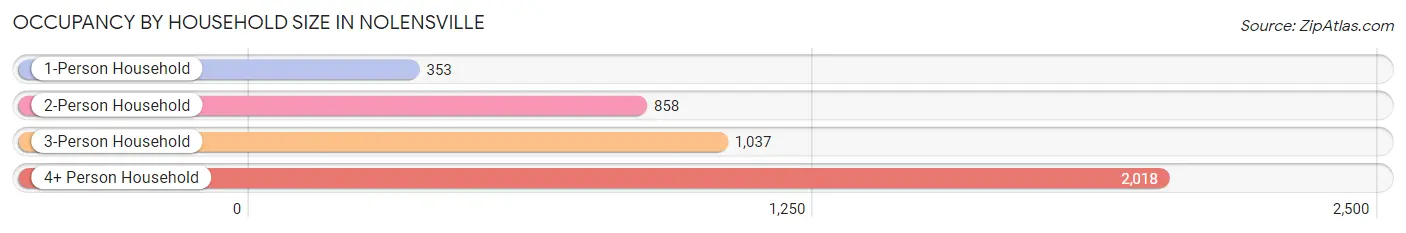
| Household Size | # Housing Units | % Housing Units |
| 1-Person Household | 353 | 8.3% |
| 2-Person Household | 858 | 20.1% |
| 3-Person Household | 1,037 | 24.3% |
| 4+ Person Household | 2,018 | 47.3% |
| Total Housing Units | 4,266 | 100.0% |
Occupancy by Ownership by Household Size in Nolensville
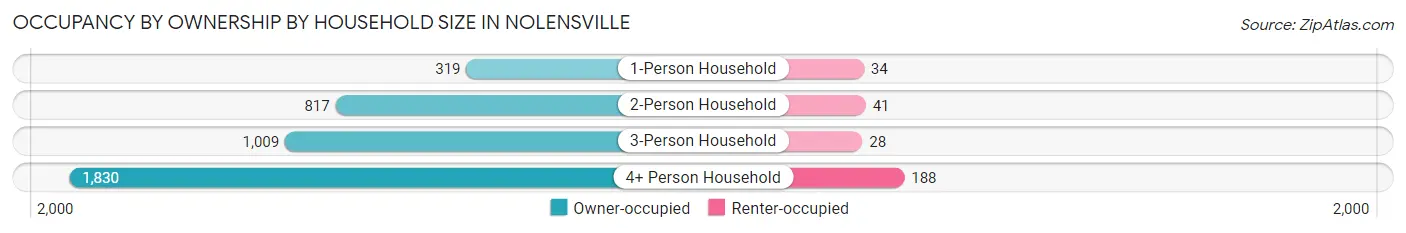
| Household Size | Owner-occupied | Renter-occupied |
| 1-Person Household | 319 (90.4%) | 34 (9.6%) |
| 2-Person Household | 817 (95.2%) | 41 (4.8%) |
| 3-Person Household | 1,009 (97.3%) | 28 (2.7%) |
| 4+ Person Household | 1,830 (90.7%) | 188 (9.3%) |
| Total Housing Units | 3,975 (93.2%) | 291 (6.8%) |
Occupancy by Educational Attainment in Nolensville
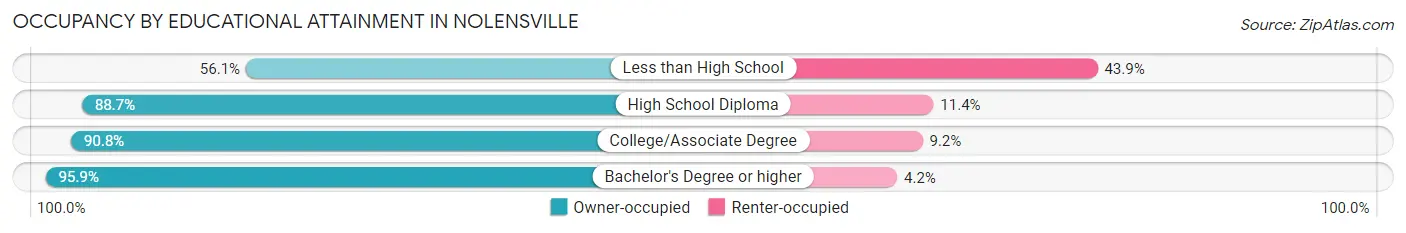
| Household Size | Owner-occupied | Renter-occupied |
| Less than High School | 78 (56.1%) | 61 (43.9%) |
| High School Diploma | 367 (88.6%) | 47 (11.4%) |
| College/Associate Degree | 524 (90.8%) | 53 (9.2%) |
| Bachelor's Degree or higher | 3,006 (95.9%) | 130 (4.2%) |
Occupancy by Age of Householder in Nolensville
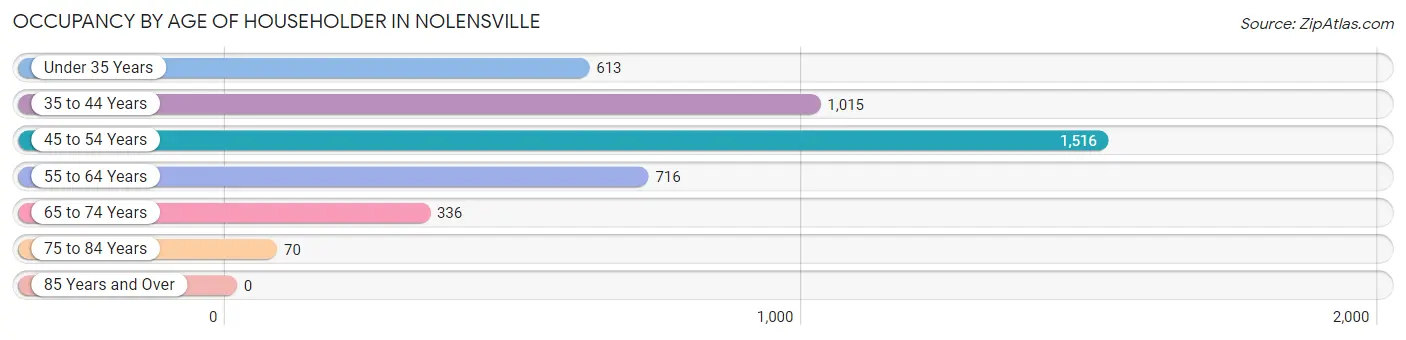
| Age Bracket | # Households | % Households |
| Under 35 Years | 613 | 14.4% |
| 35 to 44 Years | 1,015 | 23.8% |
| 45 to 54 Years | 1,516 | 35.5% |
| 55 to 64 Years | 716 | 16.8% |
| 65 to 74 Years | 336 | 7.9% |
| 75 to 84 Years | 70 | 1.6% |
| 85 Years and Over | 0 | 0.0% |
| Total | 4,266 | 100.0% |
Housing Finances in Nolensville
Median Income by Occupancy in Nolensville
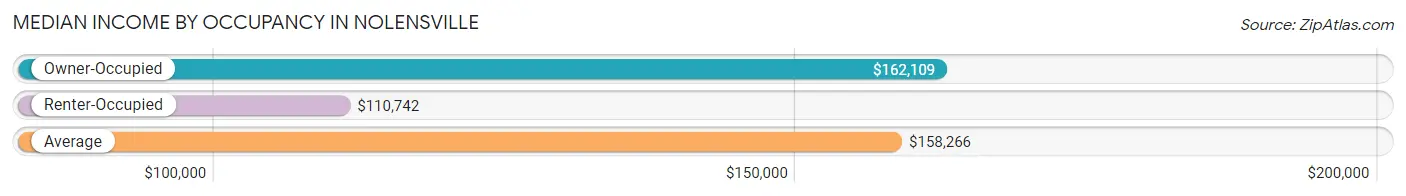
| Occupancy Type | # Households | Median Income |
| Owner-Occupied | 3,975 (93.2%) | $162,109 |
| Renter-Occupied | 291 (6.8%) | $110,742 |
| Average | 4,266 (100.0%) | $158,266 |
Occupancy by Householder Income Bracket in Nolensville
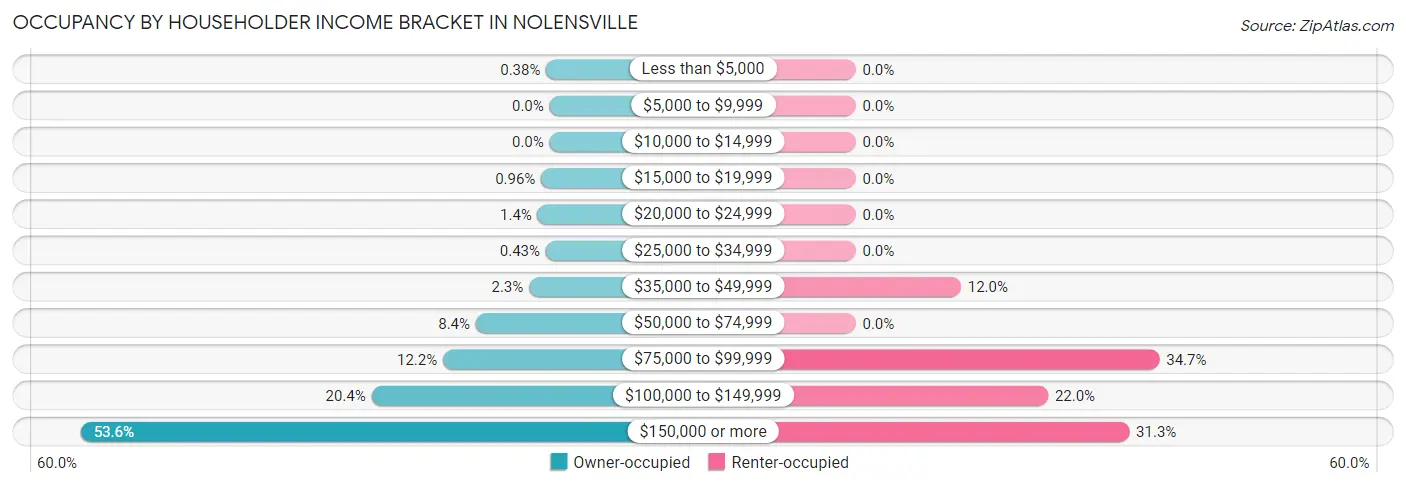
| Income Bracket | Owner-occupied | Renter-occupied |
| Less than $5,000 | 15 (0.4%) | 0 (0.0%) |
| $5,000 to $9,999 | 0 (0.0%) | 0 (0.0%) |
| $10,000 to $14,999 | 0 (0.0%) | 0 (0.0%) |
| $15,000 to $19,999 | 38 (1.0%) | 0 (0.0%) |
| $20,000 to $24,999 | 54 (1.4%) | 0 (0.0%) |
| $25,000 to $34,999 | 17 (0.4%) | 0 (0.0%) |
| $35,000 to $49,999 | 93 (2.3%) | 35 (12.0%) |
| $50,000 to $74,999 | 335 (8.4%) | 0 (0.0%) |
| $75,000 to $99,999 | 484 (12.2%) | 101 (34.7%) |
| $100,000 to $149,999 | 809 (20.3%) | 64 (22.0%) |
| $150,000 or more | 2,130 (53.6%) | 91 (31.3%) |
| Total | 3,975 (100.0%) | 291 (100.0%) |
Monthly Housing Cost Tiers in Nolensville
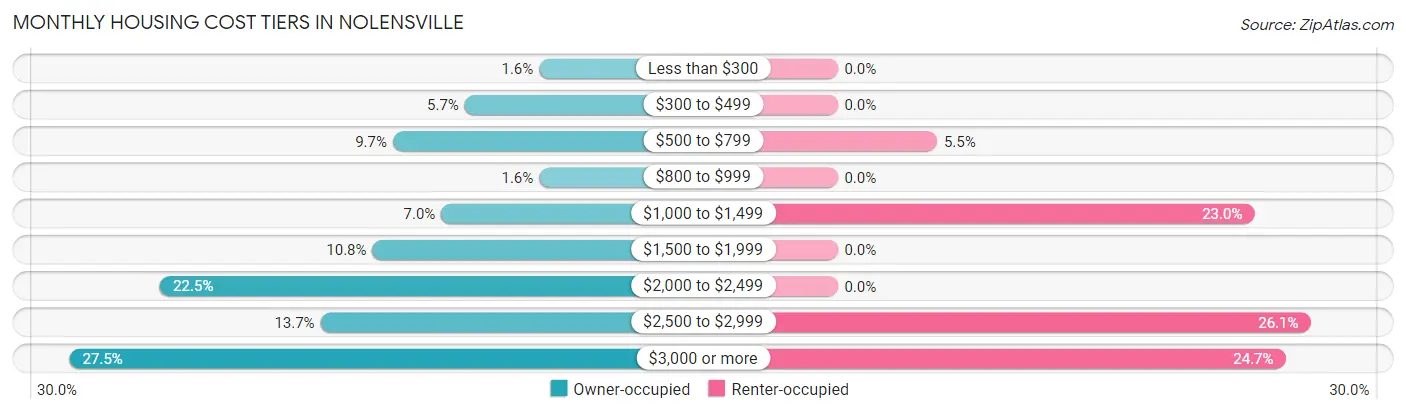
| Monthly Cost | Owner-occupied | Renter-occupied |
| Less than $300 | 63 (1.6%) | 0 (0.0%) |
| $300 to $499 | 226 (5.7%) | 0 (0.0%) |
| $500 to $799 | 384 (9.7%) | 16 (5.5%) |
| $800 to $999 | 63 (1.6%) | 0 (0.0%) |
| $1,000 to $1,499 | 278 (7.0%) | 67 (23.0%) |
| $1,500 to $1,999 | 429 (10.8%) | 0 (0.0%) |
| $2,000 to $2,499 | 895 (22.5%) | 0 (0.0%) |
| $2,500 to $2,999 | 543 (13.7%) | 76 (26.1%) |
| $3,000 or more | 1,094 (27.5%) | 72 (24.7%) |
| Total | 3,975 (100.0%) | 291 (100.0%) |
Physical Housing Characteristics in Nolensville
Housing Structures in Nolensville
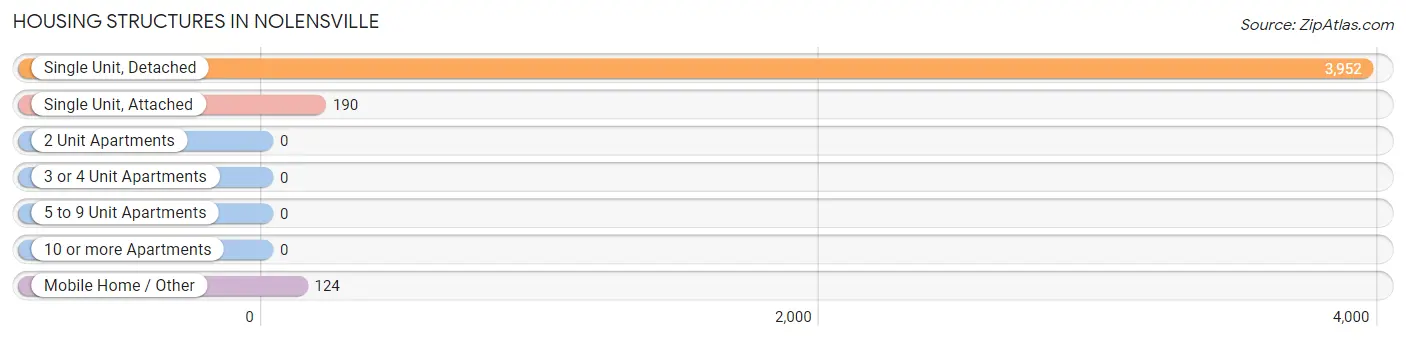
| Structure Type | # Housing Units | % Housing Units |
| Single Unit, Detached | 3,952 | 92.6% |
| Single Unit, Attached | 190 | 4.4% |
| 2 Unit Apartments | 0 | 0.0% |
| 3 or 4 Unit Apartments | 0 | 0.0% |
| 5 to 9 Unit Apartments | 0 | 0.0% |
| 10 or more Apartments | 0 | 0.0% |
| Mobile Home / Other | 124 | 2.9% |
| Total | 4,266 | 100.0% |
Housing Structures by Occupancy in Nolensville
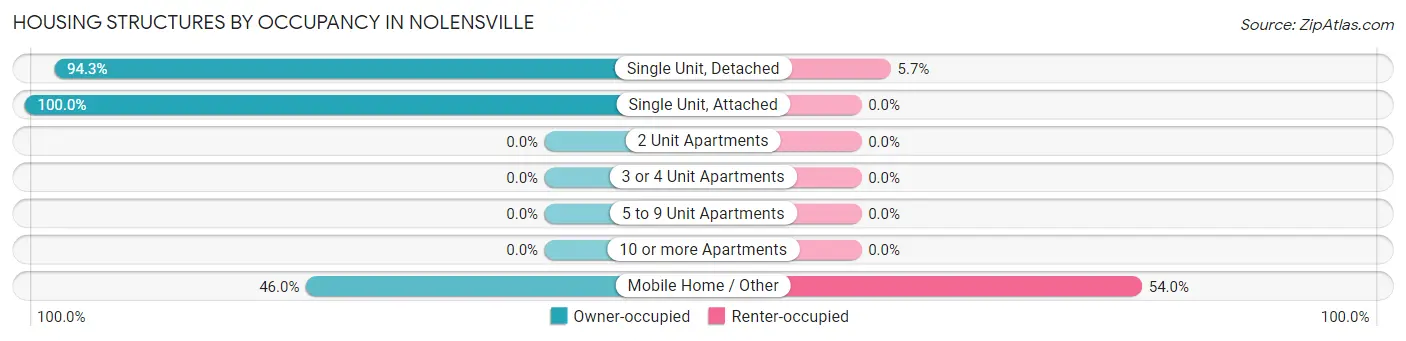
| Structure Type | Owner-occupied | Renter-occupied |
| Single Unit, Detached | 3,728 (94.3%) | 224 (5.7%) |
| Single Unit, Attached | 190 (100.0%) | 0 (0.0%) |
| 2 Unit Apartments | 0 (0.0%) | 0 (0.0%) |
| 3 or 4 Unit Apartments | 0 (0.0%) | 0 (0.0%) |
| 5 to 9 Unit Apartments | 0 (0.0%) | 0 (0.0%) |
| 10 or more Apartments | 0 (0.0%) | 0 (0.0%) |
| Mobile Home / Other | 57 (46.0%) | 67 (54.0%) |
| Total | 3,975 (93.2%) | 291 (6.8%) |
Housing Structures by Number of Rooms in Nolensville
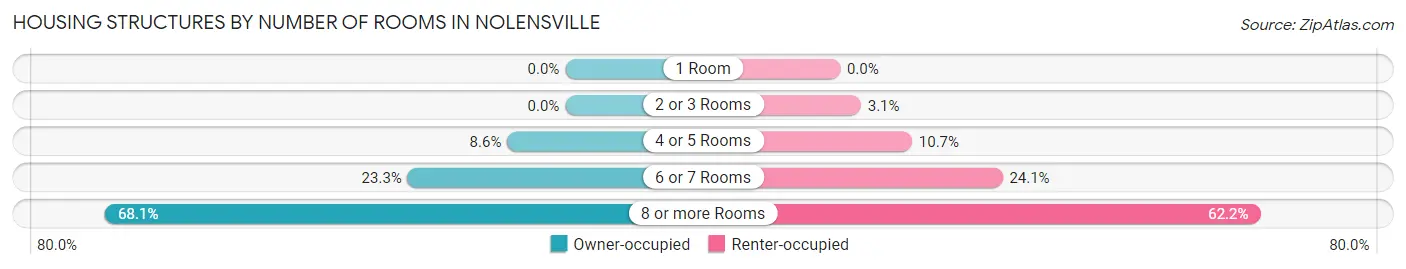
| Number of Rooms | Owner-occupied | Renter-occupied |
| 1 Room | 0 (0.0%) | 0 (0.0%) |
| 2 or 3 Rooms | 0 (0.0%) | 9 (3.1%) |
| 4 or 5 Rooms | 341 (8.6%) | 31 (10.6%) |
| 6 or 7 Rooms | 927 (23.3%) | 70 (24.0%) |
| 8 or more Rooms | 2,707 (68.1%) | 181 (62.2%) |
| Total | 3,975 (100.0%) | 291 (100.0%) |
Housing Structure by Heating Type in Nolensville
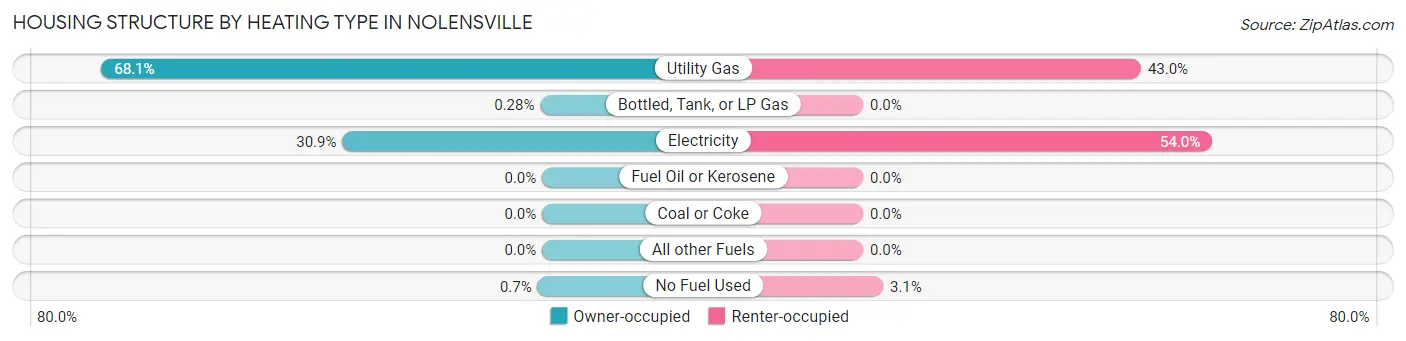
| Heating Type | Owner-occupied | Renter-occupied |
| Utility Gas | 2,708 (68.1%) | 125 (43.0%) |
| Bottled, Tank, or LP Gas | 11 (0.3%) | 0 (0.0%) |
| Electricity | 1,228 (30.9%) | 157 (53.9%) |
| Fuel Oil or Kerosene | 0 (0.0%) | 0 (0.0%) |
| Coal or Coke | 0 (0.0%) | 0 (0.0%) |
| All other Fuels | 0 (0.0%) | 0 (0.0%) |
| No Fuel Used | 28 (0.7%) | 9 (3.1%) |
| Total | 3,975 (100.0%) | 291 (100.0%) |
Household Vehicle Usage in Nolensville
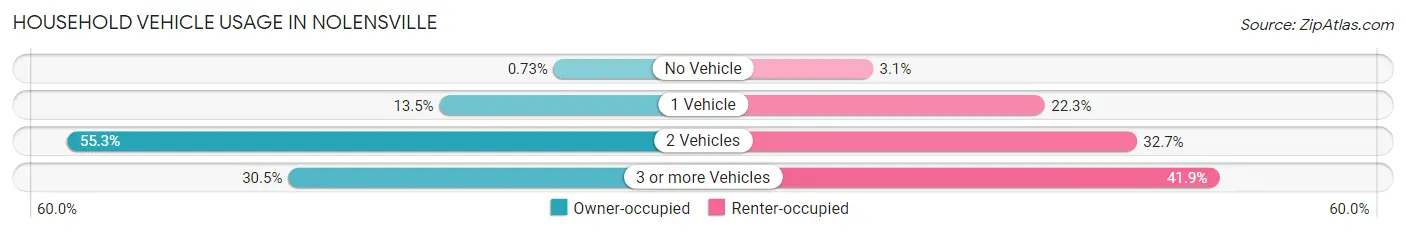
| Vehicles per Household | Owner-occupied | Renter-occupied |
| No Vehicle | 29 (0.7%) | 9 (3.1%) |
| 1 Vehicle | 538 (13.5%) | 65 (22.3%) |
| 2 Vehicles | 2,197 (55.3%) | 95 (32.7%) |
| 3 or more Vehicles | 1,211 (30.5%) | 122 (41.9%) |
| Total | 3,975 (100.0%) | 291 (100.0%) |
Real Estate & Mortgages in Nolensville
Real Estate and Mortgage Overview in Nolensville
| Characteristic | Without Mortgage | With Mortgage |
| Housing Units | 712 | 3,263 |
| Median Property Value | $521,200 | $610,800 |
| Median Household Income | $109,262 | $1,938 |
| Monthly Housing Costs | $583 | $1,094 |
| Real Estate Taxes | $2,356 | $75 |
Property Value by Mortgage Status in Nolensville
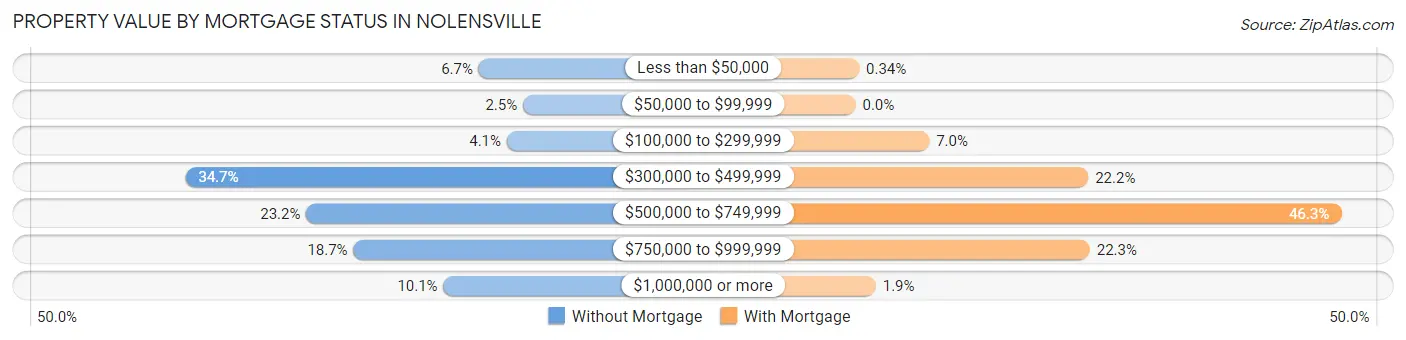
| Property Value | Without Mortgage | With Mortgage |
| Less than $50,000 | 48 (6.7%) | 11 (0.3%) |
| $50,000 to $99,999 | 18 (2.5%) | 0 (0.0%) |
| $100,000 to $299,999 | 29 (4.1%) | 229 (7.0%) |
| $300,000 to $499,999 | 247 (34.7%) | 723 (22.2%) |
| $500,000 to $749,999 | 165 (23.2%) | 1,509 (46.3%) |
| $750,000 to $999,999 | 133 (18.7%) | 728 (22.3%) |
| $1,000,000 or more | 72 (10.1%) | 63 (1.9%) |
| Total | 712 (100.0%) | 3,263 (100.0%) |
Household Income by Mortgage Status in Nolensville
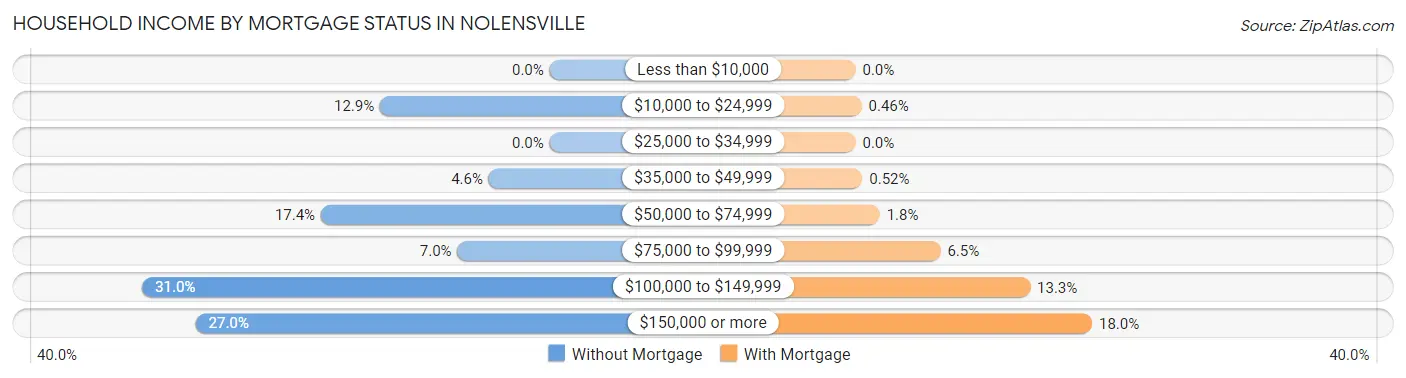
| Household Income | Without Mortgage | With Mortgage |
| Less than $10,000 | 0 (0.0%) | 0 (0.0%) |
| $10,000 to $24,999 | 92 (12.9%) | 15 (0.5%) |
| $25,000 to $34,999 | 0 (0.0%) | 0 (0.0%) |
| $35,000 to $49,999 | 33 (4.6%) | 17 (0.5%) |
| $50,000 to $74,999 | 124 (17.4%) | 60 (1.8%) |
| $75,000 to $99,999 | 50 (7.0%) | 211 (6.5%) |
| $100,000 to $149,999 | 221 (31.0%) | 434 (13.3%) |
| $150,000 or more | 192 (27.0%) | 588 (18.0%) |
| Total | 712 (100.0%) | 3,263 (100.0%) |
Property Value to Household Income Ratio in Nolensville
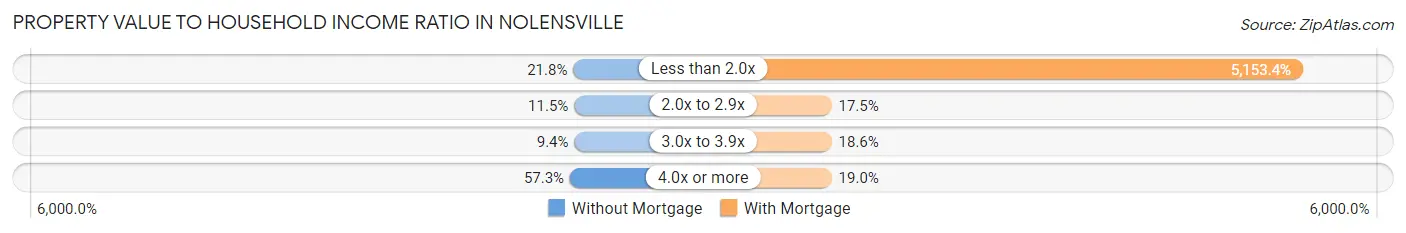
| Value-to-Income Ratio | Without Mortgage | With Mortgage |
| Less than 2.0x | 155 (21.8%) | 168,155 (5,153.4%) |
| 2.0x to 2.9x | 82 (11.5%) | 571 (17.5%) |
| 3.0x to 3.9x | 67 (9.4%) | 607 (18.6%) |
| 4.0x or more | 408 (57.3%) | 619 (19.0%) |
| Total | 712 (100.0%) | 3,263 (100.0%) |
Real Estate Taxes by Mortgage Status in Nolensville
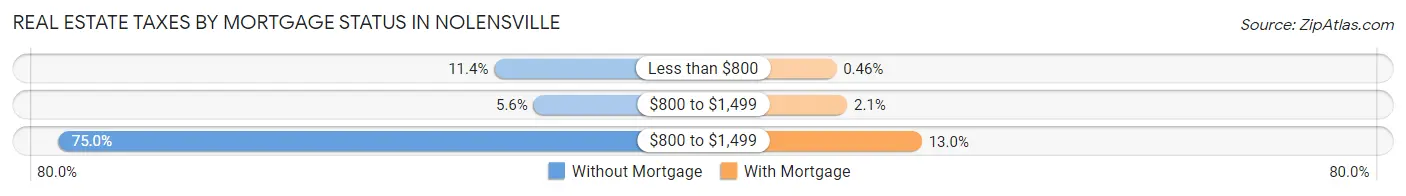
| Property Taxes | Without Mortgage | With Mortgage |
| Less than $800 | 81 (11.4%) | 15 (0.5%) |
| $800 to $1,499 | 40 (5.6%) | 67 (2.1%) |
| $800 to $1,499 | 534 (75.0%) | 423 (13.0%) |
| Total | 712 (100.0%) | 3,263 (100.0%) |
Health & Disability in Nolensville
Health Insurance Coverage by Age in Nolensville
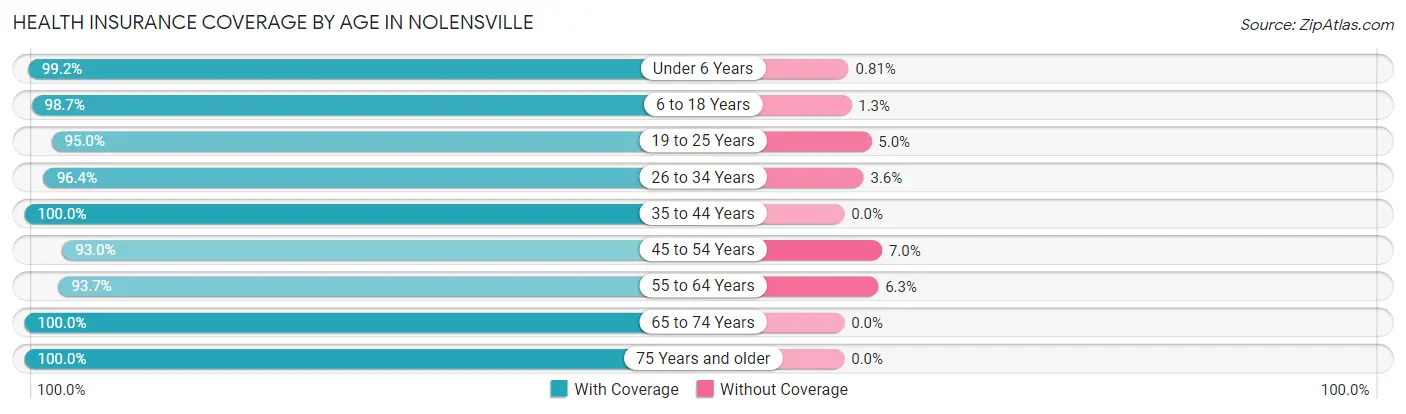
| Age Bracket | With Coverage | Without Coverage |
| Under 6 Years | 1,477 (99.2%) | 12 (0.8%) |
| 6 to 18 Years | 3,110 (98.7%) | 41 (1.3%) |
| 19 to 25 Years | 1,357 (95.0%) | 72 (5.0%) |
| 26 to 34 Years | 1,296 (96.4%) | 48 (3.6%) |
| 35 to 44 Years | 2,049 (100.0%) | 0 (0.0%) |
| 45 to 54 Years | 2,646 (93.0%) | 200 (7.0%) |
| 55 to 64 Years | 1,259 (93.7%) | 85 (6.3%) |
| 65 to 74 Years | 586 (100.0%) | 0 (0.0%) |
| 75 Years and older | 206 (100.0%) | 0 (0.0%) |
| Total | 13,986 (96.8%) | 458 (3.2%) |
Health Insurance Coverage by Citizenship Status in Nolensville
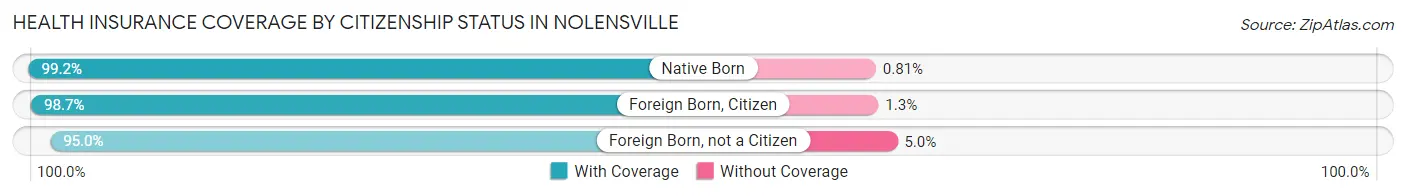
| Citizenship Status | With Coverage | Without Coverage |
| Native Born | 1,477 (99.2%) | 12 (0.8%) |
| Foreign Born, Citizen | 3,110 (98.7%) | 41 (1.3%) |
| Foreign Born, not a Citizen | 1,357 (95.0%) | 72 (5.0%) |
Health Insurance Coverage by Household Income in Nolensville
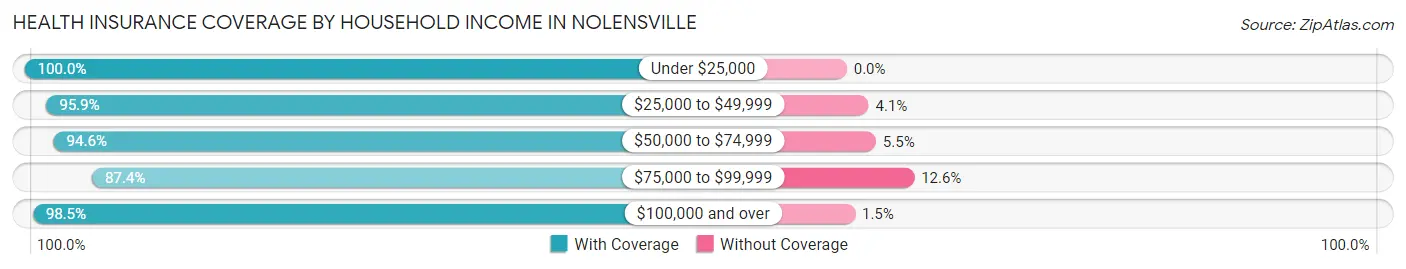
| Household Income | With Coverage | Without Coverage |
| Under $25,000 | 146 (100.0%) | 0 (0.0%) |
| $25,000 to $49,999 | 376 (95.9%) | 16 (4.1%) |
| $50,000 to $74,999 | 902 (94.6%) | 52 (5.4%) |
| $75,000 to $99,999 | 1,501 (87.4%) | 217 (12.6%) |
| $100,000 and over | 11,061 (98.5%) | 173 (1.5%) |
Public vs Private Health Insurance Coverage by Age in Nolensville
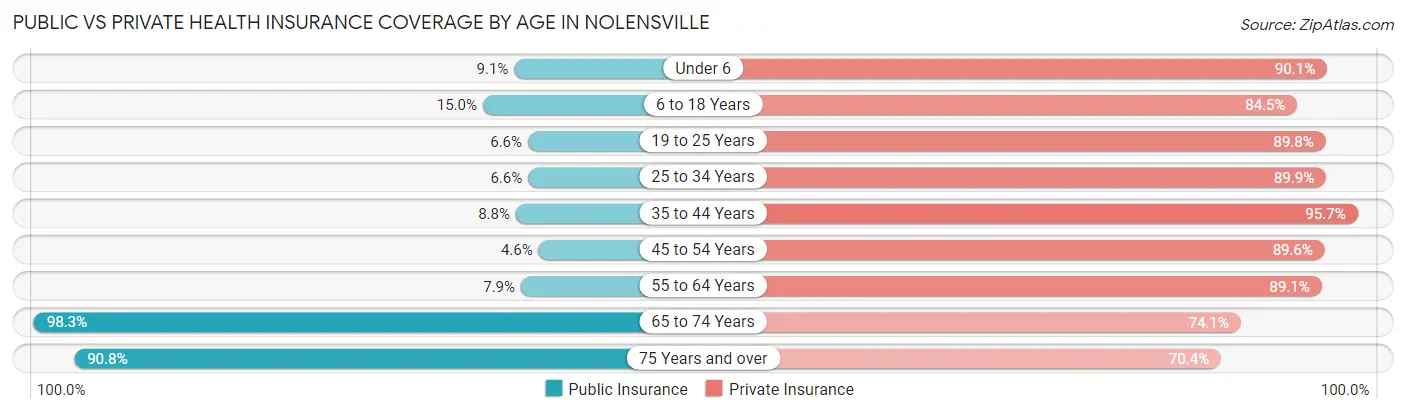
| Age Bracket | Public Insurance | Private Insurance |
| Under 6 | 136 (9.1%) | 1,341 (90.1%) |
| 6 to 18 Years | 471 (14.9%) | 2,664 (84.5%) |
| 19 to 25 Years | 94 (6.6%) | 1,283 (89.8%) |
| 25 to 34 Years | 88 (6.6%) | 1,208 (89.9%) |
| 35 to 44 Years | 181 (8.8%) | 1,961 (95.7%) |
| 45 to 54 Years | 131 (4.6%) | 2,551 (89.6%) |
| 55 to 64 Years | 106 (7.9%) | 1,197 (89.1%) |
| 65 to 74 Years | 576 (98.3%) | 434 (74.1%) |
| 75 Years and over | 187 (90.8%) | 145 (70.4%) |
| Total | 1,970 (13.6%) | 12,784 (88.5%) |
Disability Status by Sex by Age in Nolensville
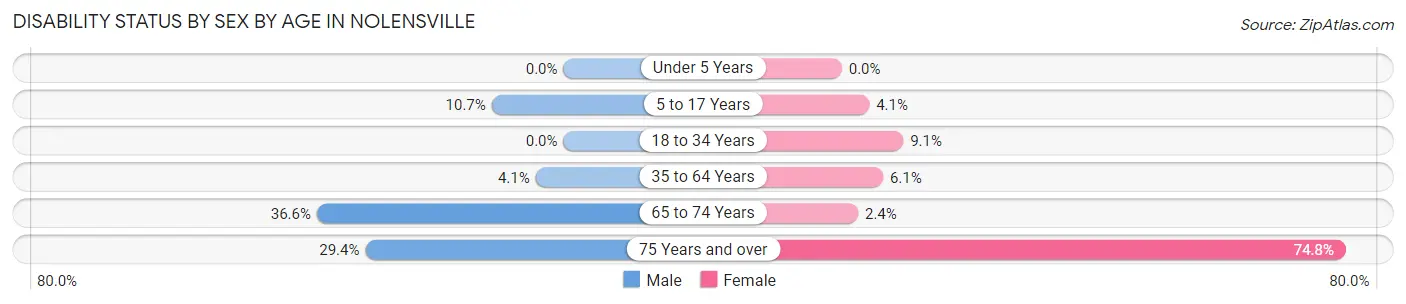
| Age Bracket | Male | Female |
| Under 5 Years | 0 (0.0%) | 0 (0.0%) |
| 5 to 17 Years | 184 (10.6%) | 63 (4.1%) |
| 18 to 34 Years | 0 (0.0%) | 146 (9.1%) |
| 35 to 64 Years | 129 (4.1%) | 190 (6.1%) |
| 65 to 74 Years | 108 (36.6%) | 7 (2.4%) |
| 75 Years and over | 15 (29.4%) | 116 (74.8%) |
Disability Class by Sex by Age in Nolensville
Disability Class: Hearing Difficulty
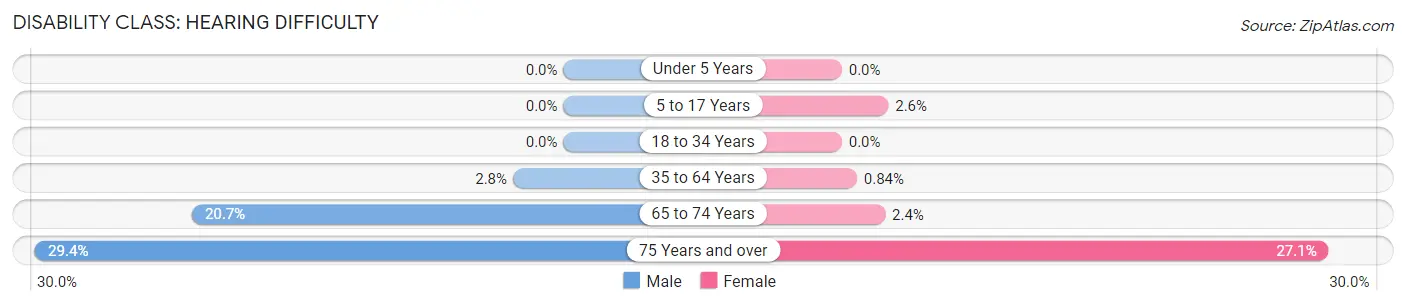
| Age Bracket | Male | Female |
| Under 5 Years | 0 (0.0%) | 0 (0.0%) |
| 5 to 17 Years | 0 (0.0%) | 40 (2.6%) |
| 18 to 34 Years | 0 (0.0%) | 0 (0.0%) |
| 35 to 64 Years | 88 (2.8%) | 26 (0.8%) |
| 65 to 74 Years | 61 (20.7%) | 7 (2.4%) |
| 75 Years and over | 15 (29.4%) | 42 (27.1%) |
Disability Class: Vision Difficulty
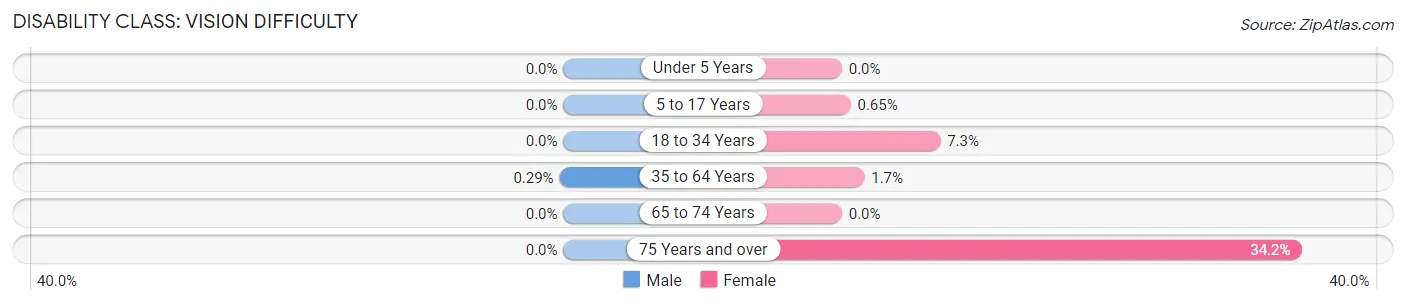
| Age Bracket | Male | Female |
| Under 5 Years | 0 (0.0%) | 0 (0.0%) |
| 5 to 17 Years | 0 (0.0%) | 10 (0.6%) |
| 18 to 34 Years | 0 (0.0%) | 117 (7.3%) |
| 35 to 64 Years | 9 (0.3%) | 52 (1.7%) |
| 65 to 74 Years | 0 (0.0%) | 0 (0.0%) |
| 75 Years and over | 0 (0.0%) | 53 (34.2%) |
Disability Class: Cognitive Difficulty
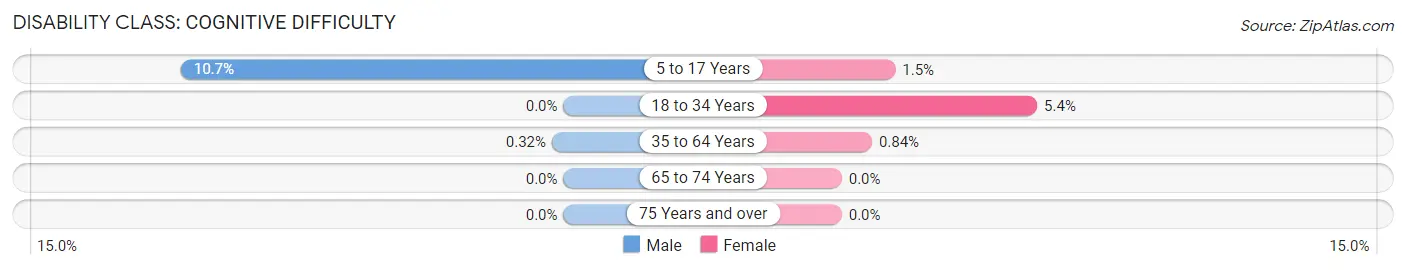
| Age Bracket | Male | Female |
| 5 to 17 Years | 184 (10.6%) | 23 (1.5%) |
| 18 to 34 Years | 0 (0.0%) | 87 (5.4%) |
| 35 to 64 Years | 10 (0.3%) | 26 (0.8%) |
| 65 to 74 Years | 0 (0.0%) | 0 (0.0%) |
| 75 Years and over | 0 (0.0%) | 0 (0.0%) |
Disability Class: Ambulatory Difficulty
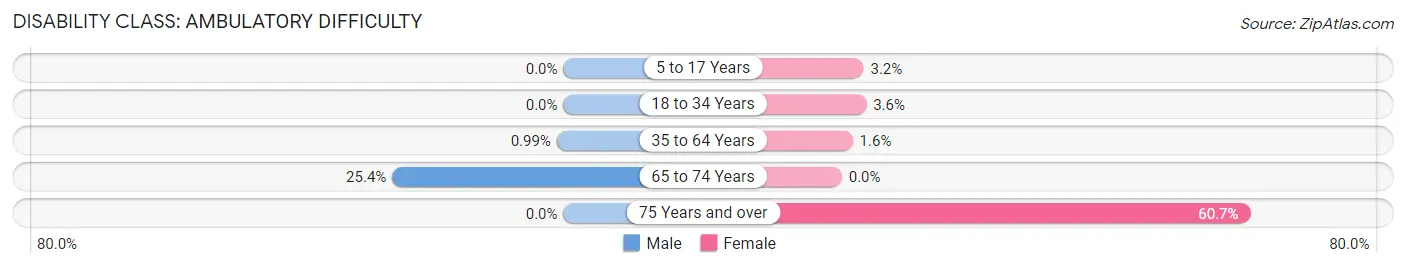
| Age Bracket | Male | Female |
| 5 to 17 Years | 0 (0.0%) | 50 (3.2%) |
| 18 to 34 Years | 0 (0.0%) | 58 (3.6%) |
| 35 to 64 Years | 31 (1.0%) | 50 (1.6%) |
| 65 to 74 Years | 75 (25.4%) | 0 (0.0%) |
| 75 Years and over | 0 (0.0%) | 94 (60.7%) |
Disability Class: Self-Care Difficulty
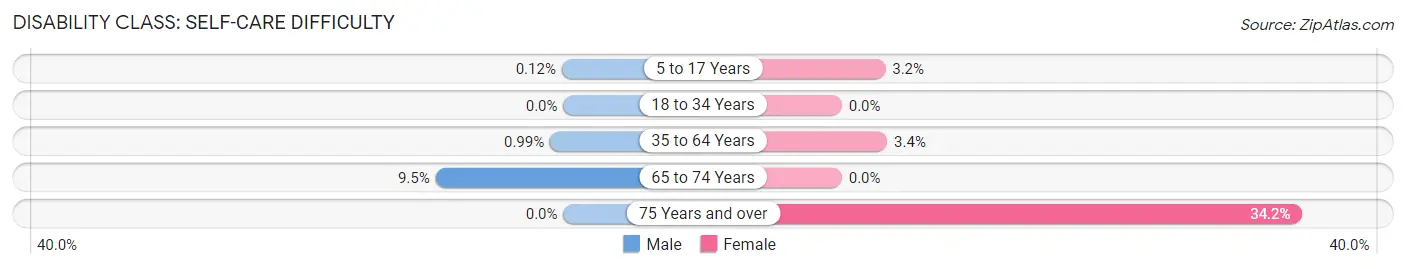
| Age Bracket | Male | Female |
| 5 to 17 Years | 2 (0.1%) | 50 (3.2%) |
| 18 to 34 Years | 0 (0.0%) | 0 (0.0%) |
| 35 to 64 Years | 31 (1.0%) | 105 (3.4%) |
| 65 to 74 Years | 28 (9.5%) | 0 (0.0%) |
| 75 Years and over | 0 (0.0%) | 53 (34.2%) |
Technology Access in Nolensville
Computing Device Access in Nolensville
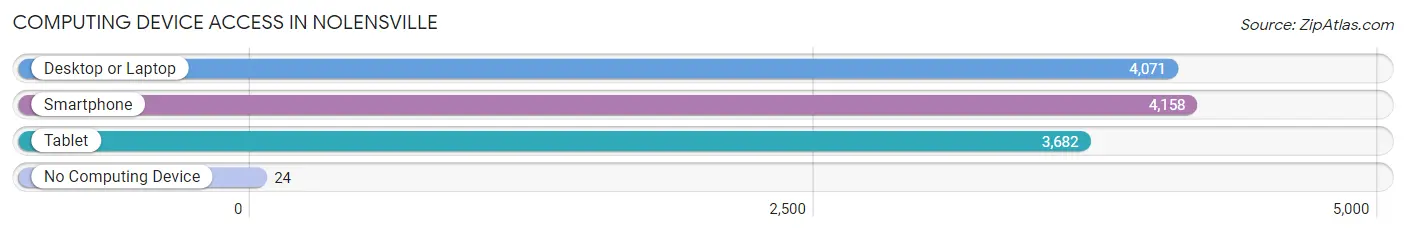
| Device Type | # Households | % Households |
| Desktop or Laptop | 4,071 | 95.4% |
| Smartphone | 4,158 | 97.5% |
| Tablet | 3,682 | 86.3% |
| No Computing Device | 24 | 0.6% |
| Total | 4,266 | 100.0% |
Internet Access in Nolensville
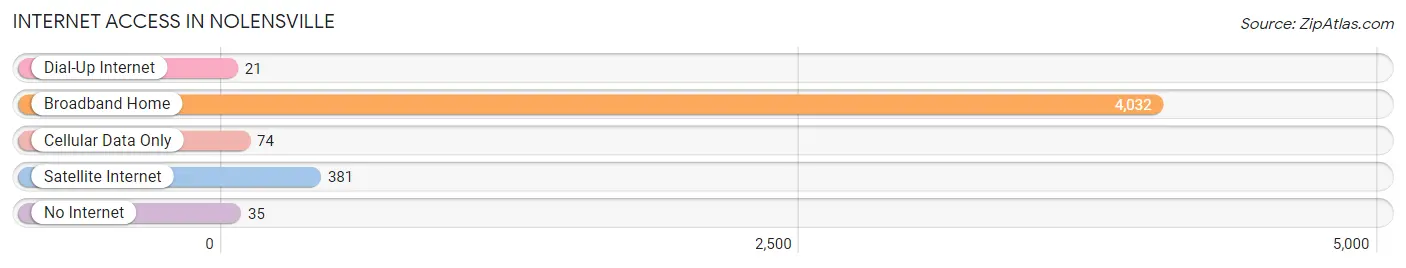
| Internet Type | # Households | % Households |
| Dial-Up Internet | 21 | 0.5% |
| Broadband Home | 4,032 | 94.5% |
| Cellular Data Only | 74 | 1.7% |
| Satellite Internet | 381 | 8.9% |
| No Internet | 35 | 0.8% |
| Total | 4,266 | 100.0% |
Nolensville Summary
Nolensville is a town located in Williamson County, Tennessee, United States. It is part of the Nashville metropolitan area and is located about 20 miles south of downtown Nashville. The population was 5,861 at the 2010 census, up from 1,981 at the 2000 census.
History
Nolensville was founded in 1797 by William Nolen, a Revolutionary War veteran. He purchased the land from the government and built a log cabin on the site. The town was originally known as Nolen's Mill, but was later changed to Nolensville. The town was incorporated in 1839 and was the first incorporated town in Williamson County.
The town was a major stop on the stagecoach route between Nashville and Chattanooga. It was also a major stop on the railroad line between Nashville and Chattanooga. The railroad line was built in the late 1800s and was a major factor in the growth of the town.
Geography
Nolensville is located in central Williamson County at 35°59'25" North, 86°41'17" West (35.990, -86.688). It is bordered to the north by the city of Brentwood, to the east by the city of Franklin, to the south by the town of Arrington, and to the west by the town of Thompson's Station.
According to the United States Census Bureau, the town has a total area of 8.2 square miles (21.2 km2), all land.
Economy
Nolensville is a small town with a diverse economy. The town is home to several small businesses, including restaurants, retail stores, and professional services. The town is also home to several large employers, including Nissan North America, which has a manufacturing plant in the town.
Nolensville is also home to several large employers in the healthcare industry, including Vanderbilt University Medical Center, Williamson Medical Center, and TriStar Centennial Medical Center.
Demographics
As of the census of 2000, there were 1,981 people, 717 households, and 590 families residing in the town. The population density was 241.3 people per square mile (93.2/km2). There were 745 housing units at an average density of 91.2 per square mile (35.2/km2). The racial makeup of the town was 94.2% White, 2.2% African American, 0.2% Native American, 0.7% Asian, 0.1% Pacific Islander, 1.2% from other races, and 1.6% from two or more races. Hispanic or Latino of any race were 3.2% of the population.
There were 717 households, out of which 41.2% had children under the age of 18 living with them, 68.2% were married couples living together, 8.2% had a female householder with no husband present, and 20.3% were non-families. 16.2% of all households were made up of individuals, and 5.2% had someone living alone who was 65 years of age or older. The average household size was 2.77 and the average family size was 3.12.
In the town, the population was spread out, with 28.7% under the age of 18, 6.2% from 18 to 24, 33.2% from 25 to 44, 22.7% from 45 to 64, and 9.2% who were 65 years of age or older. The median age was 36 years. For every 100 females, there were 97.2 males. For every 100 females age 18 and over, there were 94.2 males.
The median income for a household in the town was $62,917, and the median income for a family was $68,750. Males had a median income of $45,000 versus $30,000 for females. The per capita income for the town was $25,945. About 2.2% of families and 3.2% of the population were below the poverty line, including 3.3% of those under age 18 and 4.2% of those age 65 or over.
Common Questions
What is Per Capita Income in Nolensville?
Per Capita income in Nolensville is $51,612.
What is the Median Family Income in Nolensville?
Median Family Income in Nolensville is $162,308.
What is the Median Household income in Nolensville?
Median Household Income in Nolensville is $158,266.
What is Income or Wage Gap in Nolensville?
Income or Wage Gap in Nolensville is 33.8%.
Women in Nolensville earn 66.2 cents for every dollar earned by a man.
What is Inequality or Gini Index in Nolensville?
Inequality or Gini Index in Nolensville is 0.32.
What is the Total Population of Nolensville?
Total Population of Nolensville is 14,444.
What is the Total Male Population of Nolensville?
Total Male Population of Nolensville is 7,101.
What is the Total Female Population of Nolensville?
Total Female Population of Nolensville is 7,343.
What is the Ratio of Males per 100 Females in Nolensville?
There are 96.70 Males per 100 Females in Nolensville.
What is the Ratio of Females per 100 Males in Nolensville?
There are 103.41 Females per 100 Males in Nolensville.
What is the Median Population Age in Nolensville?
Median Population Age in Nolensville is 34.5 Years.
What is the Average Family Size in Nolensville
Average Family Size in Nolensville is 3.5 People.
What is the Average Household Size in Nolensville
Average Household Size in Nolensville is 3.4 People.
How Large is the Labor Force in Nolensville?
There are 7,928 People in the Labor Forcein in Nolensville.
What is the Percentage of People in the Labor Force in Nolensville?
75.4% of People are in the Labor Force in Nolensville.
What is the Unemployment Rate in Nolensville?
Unemployment Rate in Nolensville is 0.7%.