Whiteville, TN Map & Demographics
Whiteville Map
Whiteville Overview
$7,520
PER CAPITA INCOME
$47,311
AVG FAMILY INCOME
$46,138
AVG HOUSEHOLD INCOME
14.5%
WAGE / INCOME GAP [ % ]
85.5¢/ $1
WAGE / INCOME GAP [ $ ]
0.37
INEQUALITY / GINI INDEX
4,734
TOTAL POPULATION
4,068
MALE POPULATION
666
FEMALE POPULATION
610.81
MALES / 100 FEMALES
16.37
FEMALES / 100 MALES
39.4
MEDIAN AGE
3.0
AVG FAMILY SIZE
2.4
AVG HOUSEHOLD SIZE
549
LABOR FORCE [ PEOPLE ]
12.3%
PERCENT IN LABOR FORCE
11.7%
UNEMPLOYMENT RATE
Whiteville Zip Codes
Income in Whiteville
Income Overview in Whiteville
Per Capita Income in Whiteville is $7,520, while median incomes of families and households are $47,311 and $46,138 respectively.
| Characteristic | Number | Measure |
| Per Capita Income | 4,734 | $7,520 |
| Median Family Income | 344 | $47,311 |
| Mean Family Income | 344 | $57,338 |
| Median Household Income | 539 | $46,138 |
| Mean Household Income | 539 | $50,553 |
| Income Deficit | 344 | $0 |
| Wage / Income Gap (%) | 4,734 | 14.52% |
| Wage / Income Gap ($) | 4,734 | 85.48¢ per $1 |
| Gini / Inequality Index | 4,734 | 0.37 |
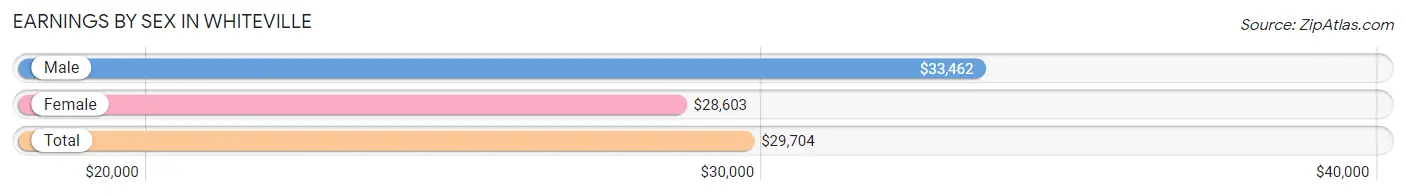
Earnings by Sex in Whiteville
Average Earnings in Whiteville are $29,704, $33,462 for men and $28,603 for women, a difference of 14.5%.
| Sex | Number | Average Earnings |
| Male | 526 (64.2%) | $33,462 |
| Female | 293 (35.8%) | $28,603 |
| Total | 819 (100.0%) | $29,704 |
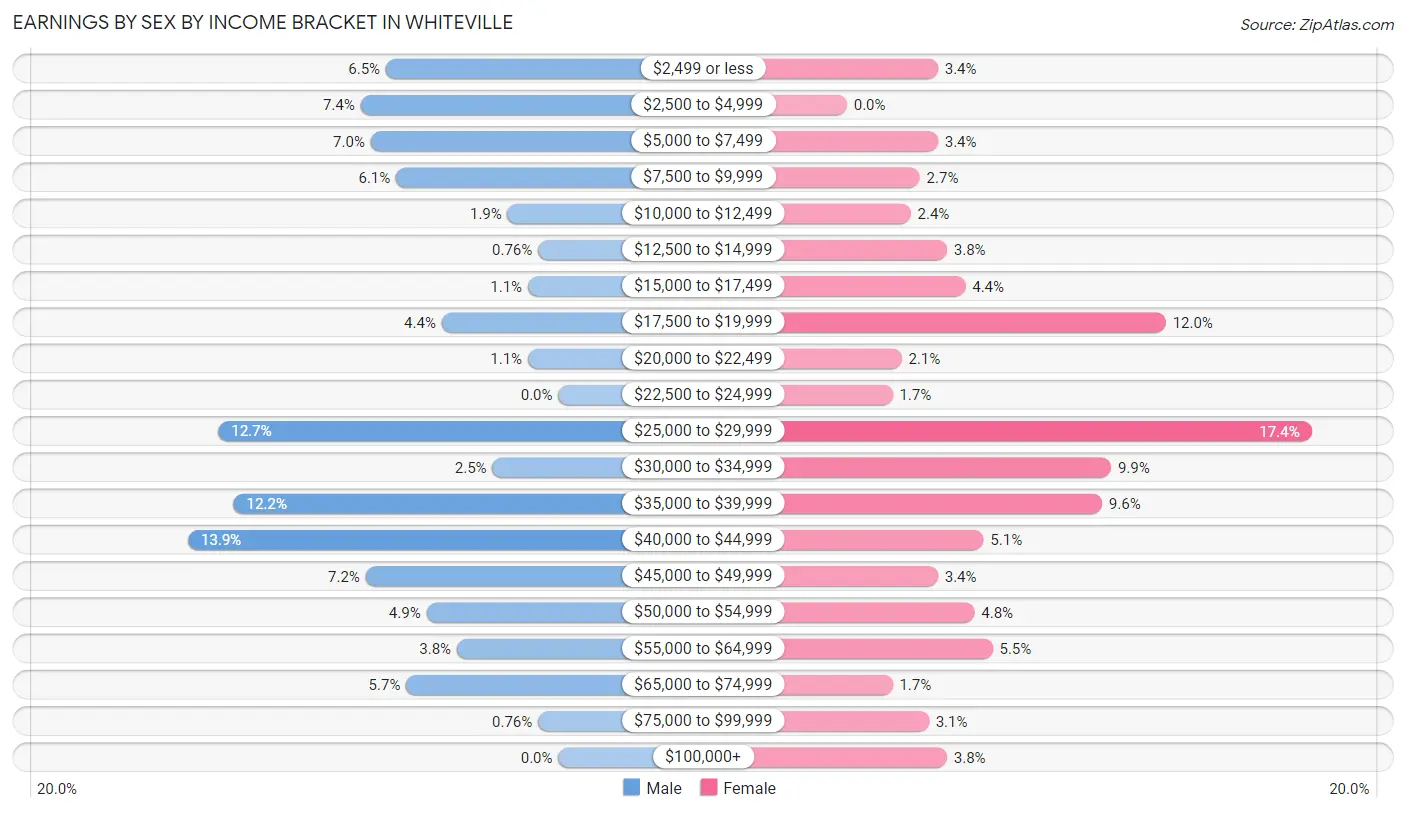
Earnings by Sex by Income Bracket in Whiteville
The most common earnings brackets in Whiteville are $40,000 to $44,999 for men (73 | 13.9%) and $25,000 to $29,999 for women (51 | 17.4%).
| Income | Male | Female |
| $2,499 or less | 34 (6.5%) | 10 (3.4%) |
| $2,500 to $4,999 | 39 (7.4%) | 0 (0.0%) |
| $5,000 to $7,499 | 37 (7.0%) | 10 (3.4%) |
| $7,500 to $9,999 | 32 (6.1%) | 8 (2.7%) |
| $10,000 to $12,499 | 10 (1.9%) | 7 (2.4%) |
| $12,500 to $14,999 | 4 (0.8%) | 11 (3.7%) |
| $15,000 to $17,499 | 6 (1.1%) | 13 (4.4%) |
| $17,500 to $19,999 | 23 (4.4%) | 35 (11.9%) |
| $20,000 to $22,499 | 6 (1.1%) | 6 (2.1%) |
| $22,500 to $24,999 | 0 (0.0%) | 5 (1.7%) |
| $25,000 to $29,999 | 67 (12.7%) | 51 (17.4%) |
| $30,000 to $34,999 | 13 (2.5%) | 29 (9.9%) |
| $35,000 to $39,999 | 64 (12.2%) | 28 (9.6%) |
| $40,000 to $44,999 | 73 (13.9%) | 15 (5.1%) |
| $45,000 to $49,999 | 38 (7.2%) | 10 (3.4%) |
| $50,000 to $54,999 | 26 (4.9%) | 14 (4.8%) |
| $55,000 to $64,999 | 20 (3.8%) | 16 (5.5%) |
| $65,000 to $74,999 | 30 (5.7%) | 5 (1.7%) |
| $75,000 to $99,999 | 4 (0.8%) | 9 (3.1%) |
| $100,000+ | 0 (0.0%) | 11 (3.7%) |
| Total | 526 (100.0%) | 293 (100.0%) |
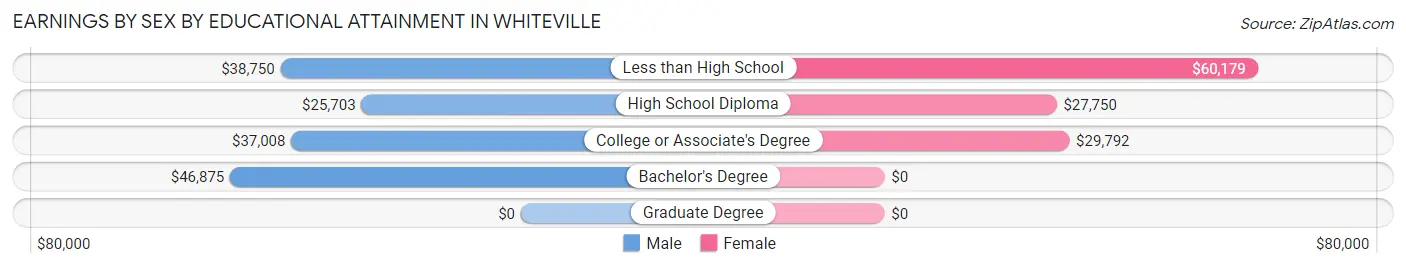
Earnings by Sex by Educational Attainment in Whiteville
Average earnings in Whiteville are $33,750 for men and $32,500 for women, a difference of 3.7%. Men with an educational attainment of bachelor's degree enjoy the highest average annual earnings of $46,875, while those with high school diploma education earn the least with $25,703. Women with an educational attainment of less than high school earn the most with the average annual earnings of $60,179, while those with high school diploma education have the smallest earnings of $27,750.
| Educational Attainment | Male Income | Female Income |
| Less than High School | $38,750 | $60,179 |
| High School Diploma | $25,703 | $27,750 |
| College or Associate's Degree | $37,008 | $29,792 |
| Bachelor's Degree | $46,875 | $0 |
| Graduate Degree | - | - |
| Total | $33,750 | $32,500 |
Family Income in Whiteville
Family Income Brackets in Whiteville
According to the Whiteville family income data, there are 95 families falling into the $35,000 to $49,999 income range, which is the most common income bracket and makes up 27.6% of all families.
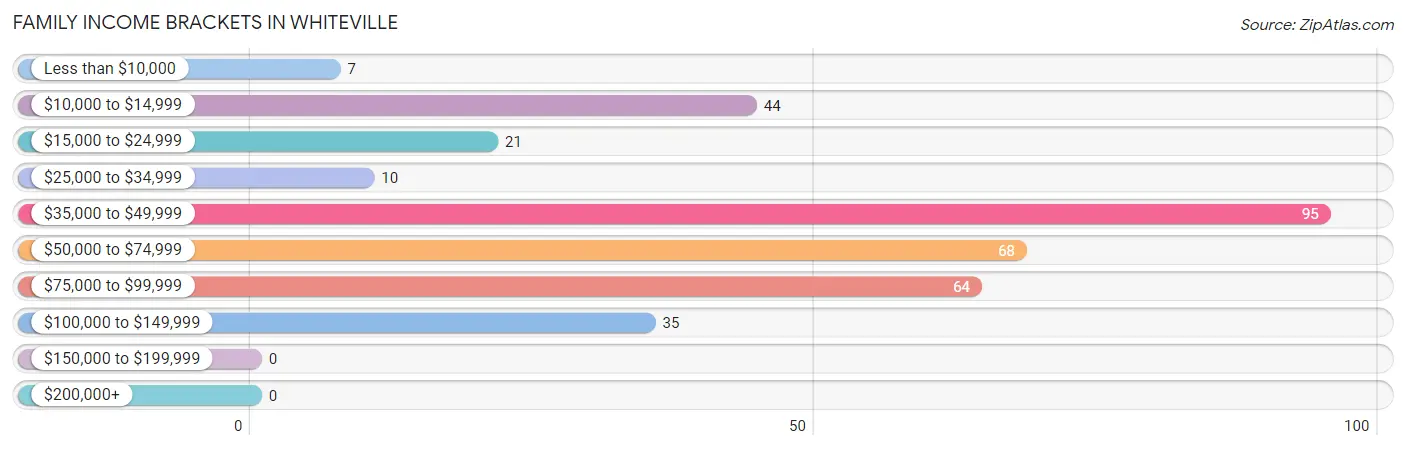
| Income Bracket | # Families | % Families |
| Less than $10,000 | 7 | 2.0% |
| $10,000 to $14,999 | 44 | 12.8% |
| $15,000 to $24,999 | 21 | 6.1% |
| $25,000 to $34,999 | 10 | 2.9% |
| $35,000 to $49,999 | 95 | 27.6% |
| $50,000 to $74,999 | 68 | 19.8% |
| $75,000 to $99,999 | 64 | 18.6% |
| $100,000 to $149,999 | 35 | 10.2% |
| $150,000 to $199,999 | 0 | 0.0% |
| $200,000+ | 0 | 0.0% |
Family Income by Famaliy Size in Whiteville
4-person families (56 | 16.3%) account for the highest median family income in Whiteville with $72,188 per family, while 2-person families (204 | 59.3%) have the highest median income of $23,356 per family member.
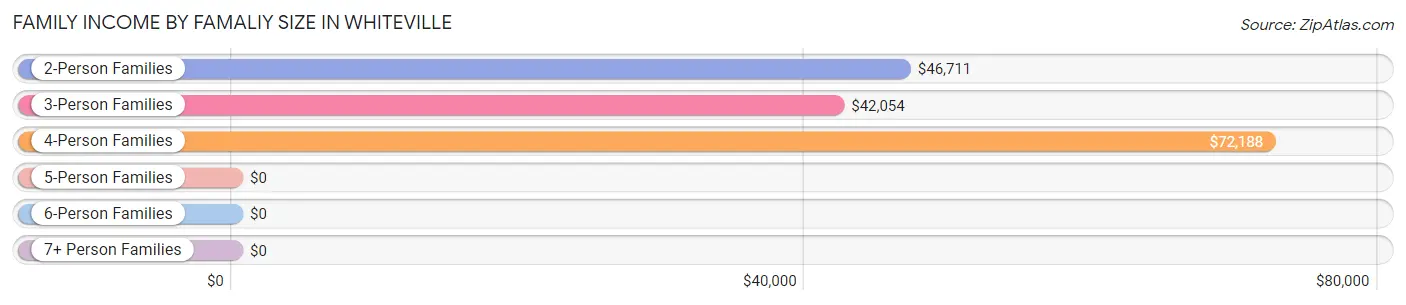
| Income Bracket | # Families | Median Income |
| 2-Person Families | 204 (59.3%) | $46,711 |
| 3-Person Families | 49 (14.2%) | $42,054 |
| 4-Person Families | 56 (16.3%) | $72,188 |
| 5-Person Families | 31 (9.0%) | $0 |
| 6-Person Families | 0 (0.0%) | $0 |
| 7+ Person Families | 4 (1.2%) | $0 |
| Total | 344 (100.0%) | $47,311 |
Family Income by Number of Earners in Whiteville
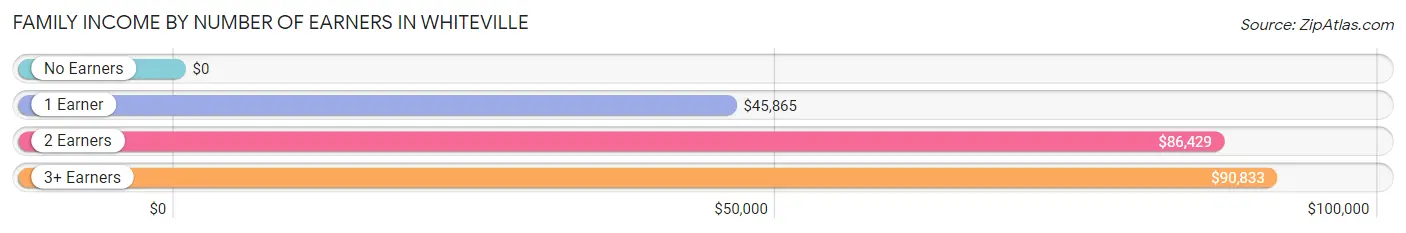
| Number of Earners | # Families | Median Income |
| No Earners | 88 (25.6%) | $0 |
| 1 Earner | 132 (38.4%) | $45,865 |
| 2 Earners | 110 (32.0%) | $86,429 |
| 3+ Earners | 14 (4.1%) | $90,833 |
| Total | 344 (100.0%) | $47,311 |
Household Income in Whiteville
Household Income Brackets in Whiteville
With 108 households falling in the category, the $50,000 to $74,999 income range is the most frequent in Whiteville, accounting for 20.0% of all households.
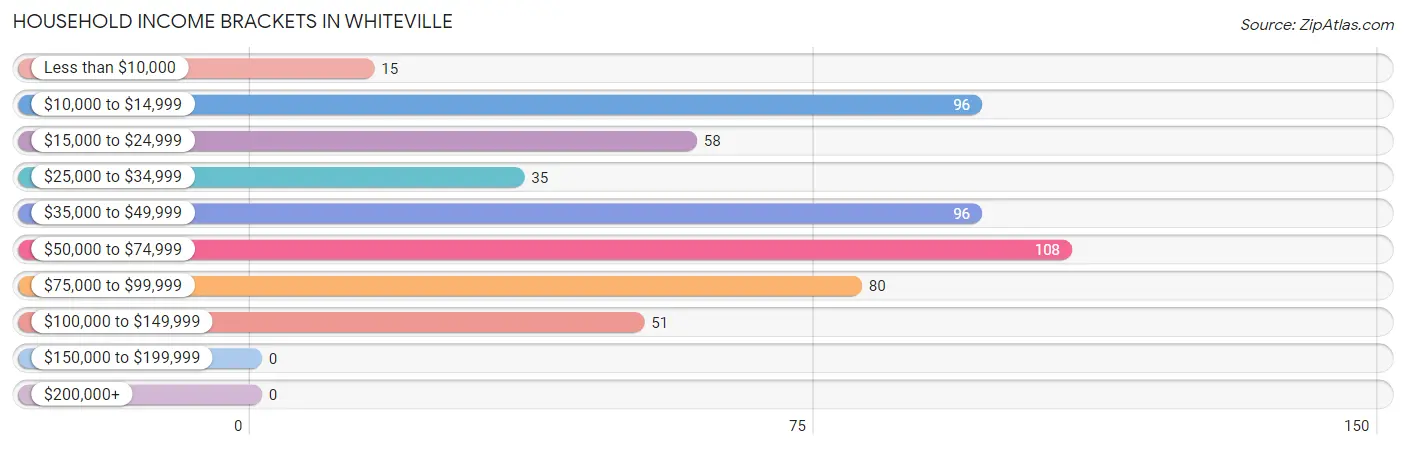
| Income Bracket | # Households | % Households |
| Less than $10,000 | 15 | 2.8% |
| $10,000 to $14,999 | 96 | 17.8% |
| $15,000 to $24,999 | 58 | 10.8% |
| $25,000 to $34,999 | 35 | 6.5% |
| $35,000 to $49,999 | 96 | 17.8% |
| $50,000 to $74,999 | 108 | 20.0% |
| $75,000 to $99,999 | 80 | 14.8% |
| $100,000 to $149,999 | 51 | 9.5% |
| $150,000 to $199,999 | 0 | 0.0% |
| $200,000+ | 0 | 0.0% |
Household Income by Householder Age in Whiteville
The median household income in Whiteville is $46,138, with the highest median household income of $52,750 found in the 15 to 24 years age bracket for the primary householder. A total of 35 households (6.5%) fall into this category. Meanwhile, the 65+ years age bracket for the primary householder has the lowest median household income of $0, with 174 households (32.3%) in this group.
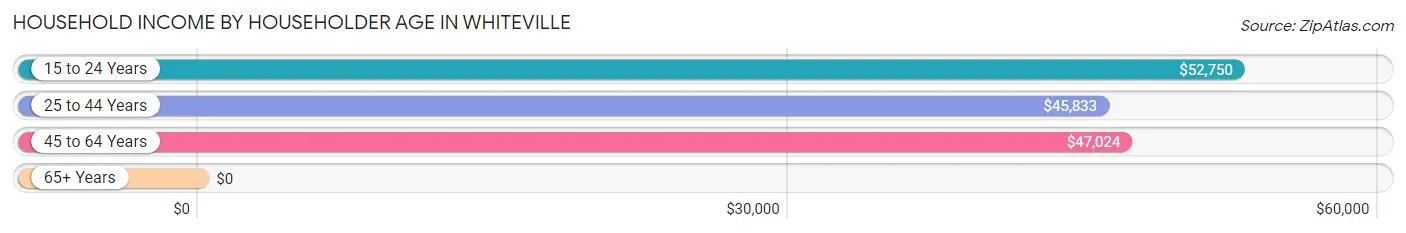
| Income Bracket | # Households | Median Income |
| 15 to 24 Years | 35 (6.5%) | $52,750 |
| 25 to 44 Years | 126 (23.4%) | $45,833 |
| 45 to 64 Years | 204 (37.9%) | $47,024 |
| 65+ Years | 174 (32.3%) | $0 |
| Total | 539 (100.0%) | $46,138 |
Poverty in Whiteville
Income Below Poverty by Sex and Age in Whiteville
With 17.0% poverty level for males and 26.3% for females among the residents of Whiteville, 5 year old males and 5 year old females are the most vulnerable to poverty, with 4 males (100.0%) and 1 females (100.0%) in their respective age groups living below the poverty level.
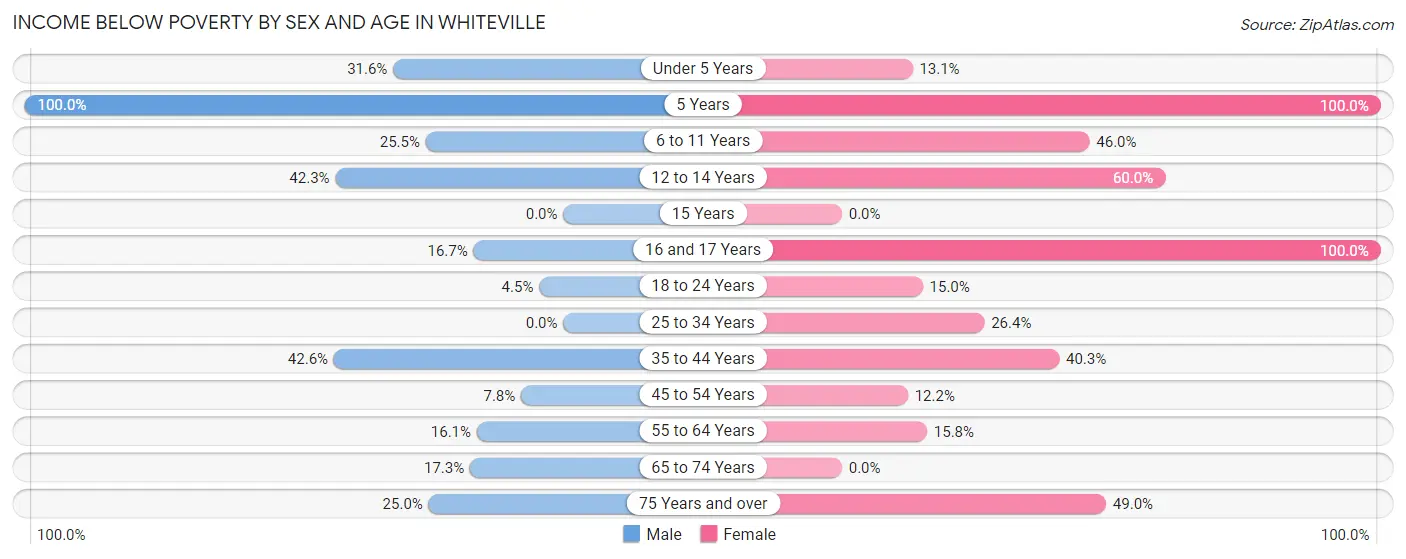
| Age Bracket | Male | Female |
| Under 5 Years | 6 (31.6%) | 8 (13.1%) |
| 5 Years | 4 (100.0%) | 1 (100.0%) |
| 6 to 11 Years | 12 (25.5%) | 34 (46.0%) |
| 12 to 14 Years | 11 (42.3%) | 18 (60.0%) |
| 15 Years | 0 (0.0%) | 0 (0.0%) |
| 16 and 17 Years | 3 (16.7%) | 8 (100.0%) |
| 18 to 24 Years | 3 (4.5%) | 15 (15.0%) |
| 25 to 34 Years | 0 (0.0%) | 23 (26.4%) |
| 35 to 44 Years | 23 (42.6%) | 25 (40.3%) |
| 45 to 54 Years | 4 (7.8%) | 6 (12.2%) |
| 55 to 64 Years | 13 (16.1%) | 12 (15.8%) |
| 65 to 74 Years | 22 (17.3%) | 0 (0.0%) |
| 75 Years and over | 3 (25.0%) | 25 (49.0%) |
| Total | 104 (17.0%) | 175 (26.3%) |
Income Above Poverty by Sex and Age in Whiteville
According to the poverty statistics in Whiteville, males aged 15 years and females aged 15 years are the age groups that are most secure financially, with 100.0% of males and 100.0% of females in these age groups living above the poverty line.
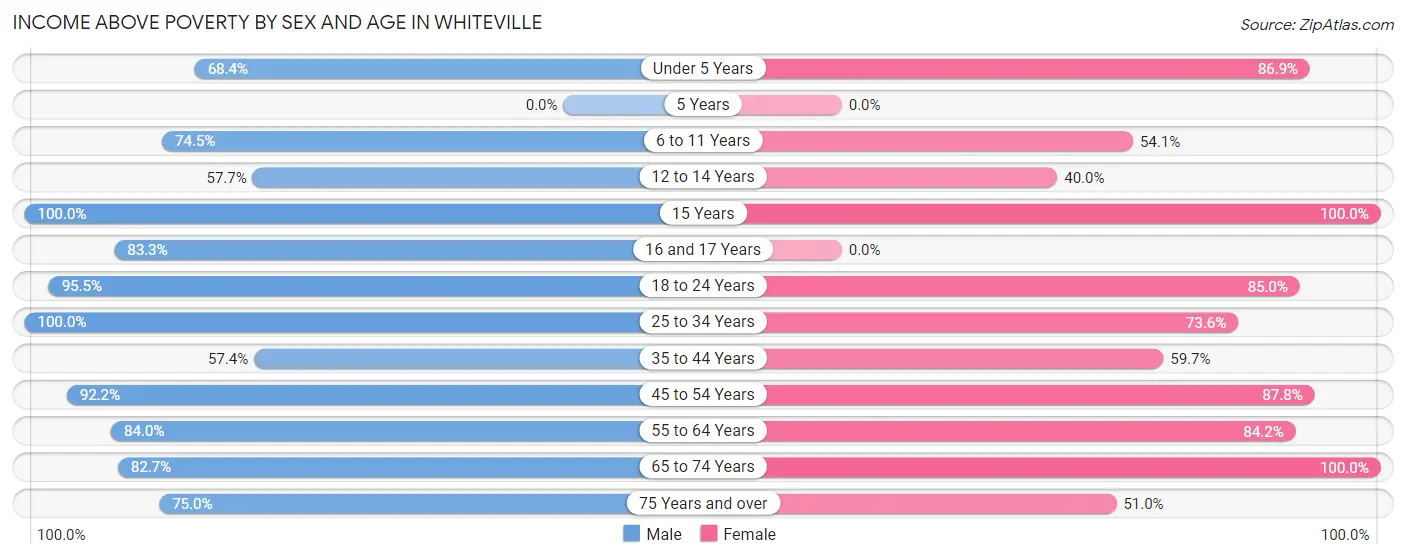
| Age Bracket | Male | Female |
| Under 5 Years | 13 (68.4%) | 53 (86.9%) |
| 5 Years | 0 (0.0%) | 0 (0.0%) |
| 6 to 11 Years | 35 (74.5%) | 40 (54.0%) |
| 12 to 14 Years | 15 (57.7%) | 12 (40.0%) |
| 15 Years | 1 (100.0%) | 4 (100.0%) |
| 16 and 17 Years | 15 (83.3%) | 0 (0.0%) |
| 18 to 24 Years | 64 (95.5%) | 85 (85.0%) |
| 25 to 34 Years | 105 (100.0%) | 64 (73.6%) |
| 35 to 44 Years | 31 (57.4%) | 37 (59.7%) |
| 45 to 54 Years | 47 (92.2%) | 43 (87.8%) |
| 55 to 64 Years | 68 (84.0%) | 64 (84.2%) |
| 65 to 74 Years | 105 (82.7%) | 63 (100.0%) |
| 75 Years and over | 9 (75.0%) | 26 (51.0%) |
| Total | 508 (83.0%) | 491 (73.7%) |
Income Below Poverty Among Married-Couple Families in Whiteville
The poverty statistics for married-couple families in Whiteville show that 5.0% or 11 of the total 221 families live below the poverty line. Families with no children have the highest poverty rate of 7.0%, comprising of 11 families. On the other hand, families with 1 or 2 children have the lowest poverty rate of 0.0%, which includes 0 families.
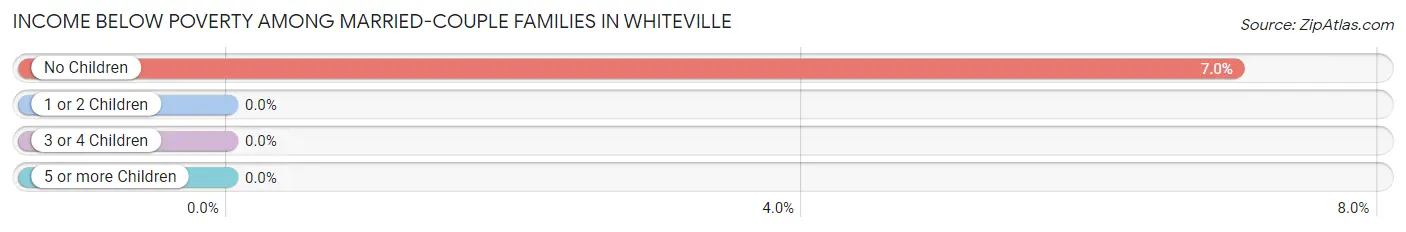
| Children | Above Poverty | Below Poverty |
| No Children | 146 (93.0%) | 11 (7.0%) |
| 1 or 2 Children | 53 (100.0%) | 0 (0.0%) |
| 3 or 4 Children | 11 (100.0%) | 0 (0.0%) |
| 5 or more Children | 0 (0.0%) | 0 (0.0%) |
| Total | 210 (95.0%) | 11 (5.0%) |
Income Below Poverty Among Single-Parent Households in Whiteville
According to the poverty data in Whiteville, 63.0% or 34 single-father households and 40.6% or 28 single-mother households are living below the poverty line. Among single-father households, those with 1 or 2 children have the highest poverty rate, with 23 households (69.7%) experiencing poverty. Likewise, among single-mother households, those with 3 or 4 children have the highest poverty rate, with 10 households (100.0%) falling below the poverty line.
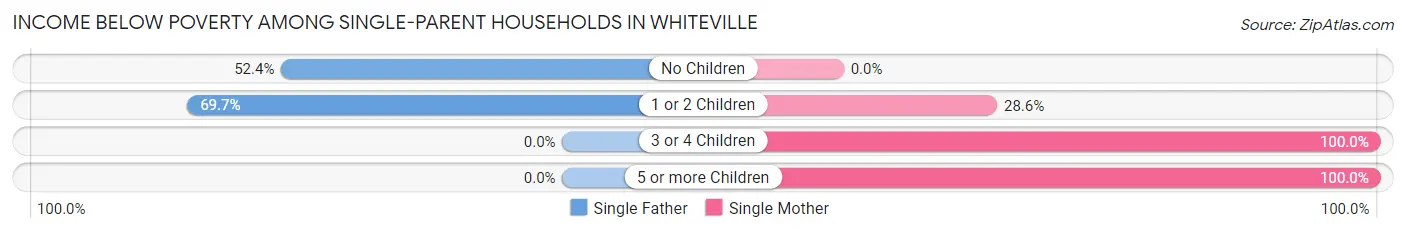
| Children | Single Father | Single Mother |
| No Children | 11 (52.4%) | 0 (0.0%) |
| 1 or 2 Children | 23 (69.7%) | 14 (28.6%) |
| 3 or 4 Children | 0 (0.0%) | 10 (100.0%) |
| 5 or more Children | 0 (0.0%) | 4 (100.0%) |
| Total | 34 (63.0%) | 28 (40.6%) |
Income Below Poverty Among Married-Couple vs Single-Parent Households in Whiteville
The poverty data for Whiteville shows that 11 of the married-couple family households (5.0%) and 62 of the single-parent households (50.4%) are living below the poverty level. Within the married-couple family households, those with no children have the highest poverty rate, with 11 households (7.0%) falling below the poverty line. Among the single-parent households, those with 3 or 4 children have the highest poverty rate, with 10 household (100.0%) living below poverty.
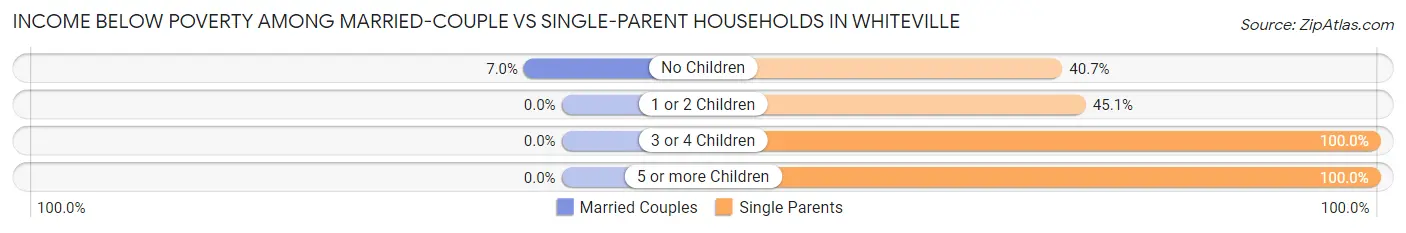
| Children | Married-Couple Families | Single-Parent Households |
| No Children | 11 (7.0%) | 11 (40.7%) |
| 1 or 2 Children | 0 (0.0%) | 37 (45.1%) |
| 3 or 4 Children | 0 (0.0%) | 10 (100.0%) |
| 5 or more Children | 0 (0.0%) | 4 (100.0%) |
| Total | 11 (5.0%) | 62 (50.4%) |
Race in Whiteville
The most populous races in Whiteville are Black / African American (2,266 | 47.9%), White / Caucasian (2,137 | 45.1%), and Hispanic or Latino (303 | 6.4%).
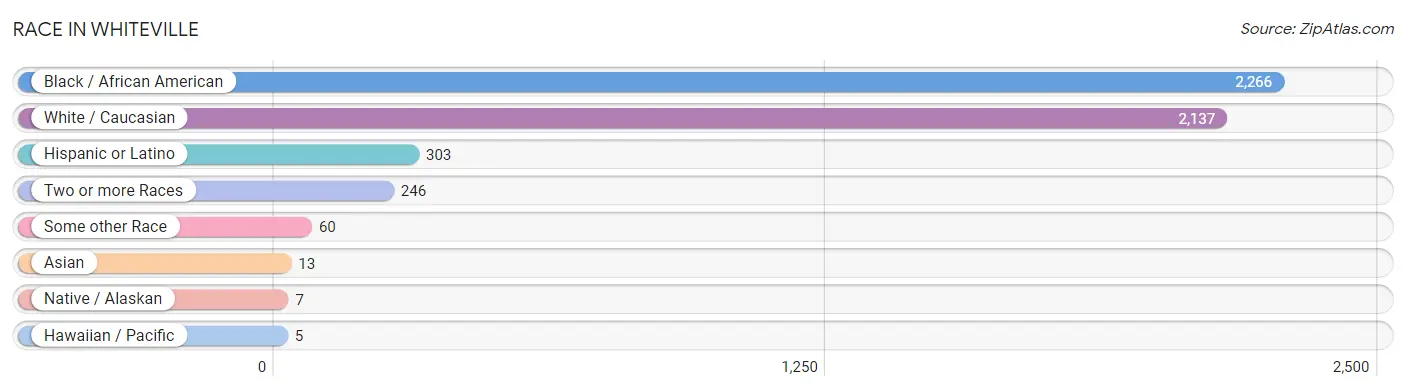
| Race | # Population | % Population |
| Asian | 13 | 0.3% |
| Black / African American | 2,266 | 47.9% |
| Hawaiian / Pacific | 5 | 0.1% |
| Hispanic or Latino | 303 | 6.4% |
| Native / Alaskan | 7 | 0.2% |
| White / Caucasian | 2,137 | 45.1% |
| Two or more Races | 246 | 5.2% |
| Some other Race | 60 | 1.3% |
| Total | 4,734 | 100.0% |
Ancestry in Whiteville
The most populous ancestries reported in Whiteville are Irish (390 | 8.2%), German (335 | 7.1%), American (312 | 6.6%), Mexican (211 | 4.5%), and English (202 | 4.3%), together accounting for 30.6% of all Whiteville residents.
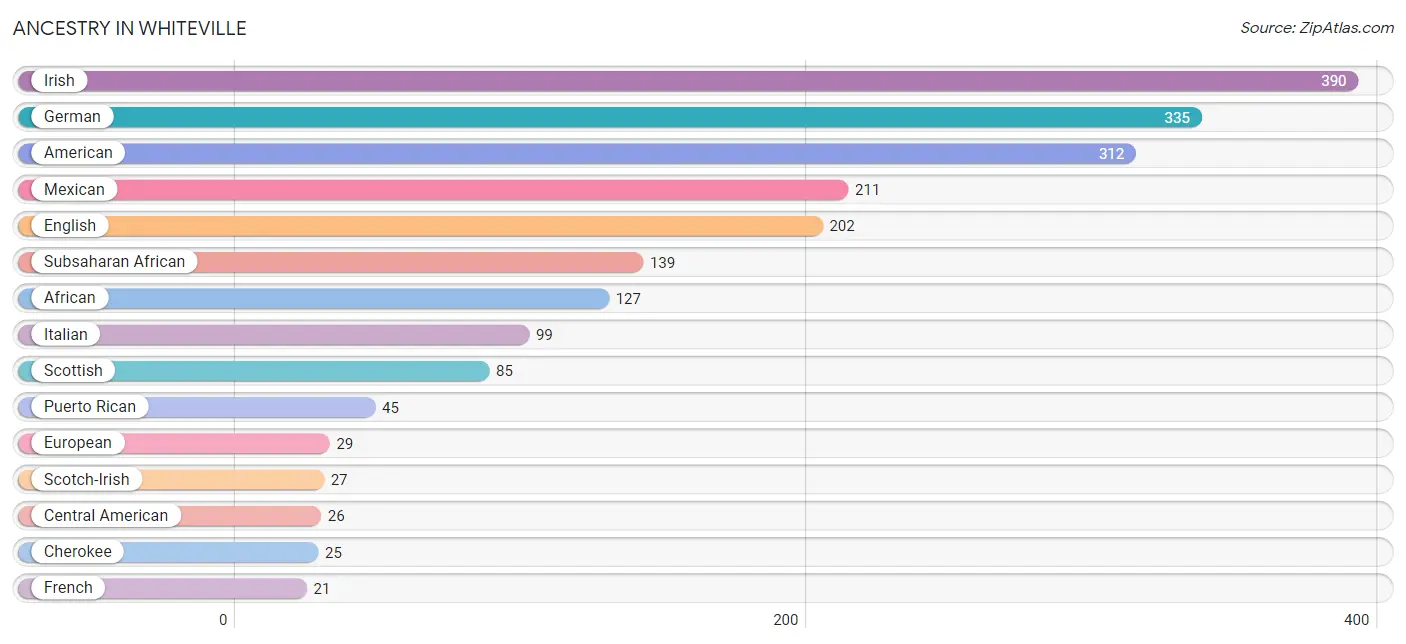
| Ancestry | # Population | % Population |
| African | 127 | 2.7% |
| American | 312 | 6.6% |
| Apache | 6 | 0.1% |
| Arab | 7 | 0.2% |
| Central American | 26 | 0.5% |
| Cherokee | 25 | 0.5% |
| Colombian | 14 | 0.3% |
| Danish | 8 | 0.2% |
| Egyptian | 7 | 0.2% |
| English | 202 | 4.3% |
| European | 29 | 0.6% |
| French | 21 | 0.4% |
| German | 335 | 7.1% |
| Greek | 6 | 0.1% |
| Guatemalan | 13 | 0.3% |
| Haitian | 16 | 0.3% |
| Icelander | 6 | 0.1% |
| Indian (Asian) | 6 | 0.1% |
| Irish | 390 | 8.2% |
| Italian | 99 | 2.1% |
| Jamaican | 6 | 0.1% |
| Malaysian | 7 | 0.2% |
| Mexican | 211 | 4.5% |
| Nigerian | 12 | 0.3% |
| Puerto Rican | 45 | 0.9% |
| Russian | 14 | 0.3% |
| Scotch-Irish | 27 | 0.6% |
| Scottish | 85 | 1.8% |
| South American | 14 | 0.3% |
| Spanish | 7 | 0.2% |
| Subsaharan African | 139 | 2.9% |
| Swedish | 7 | 0.2% |
| Welsh | 18 | 0.4% | View All 33 Rows |
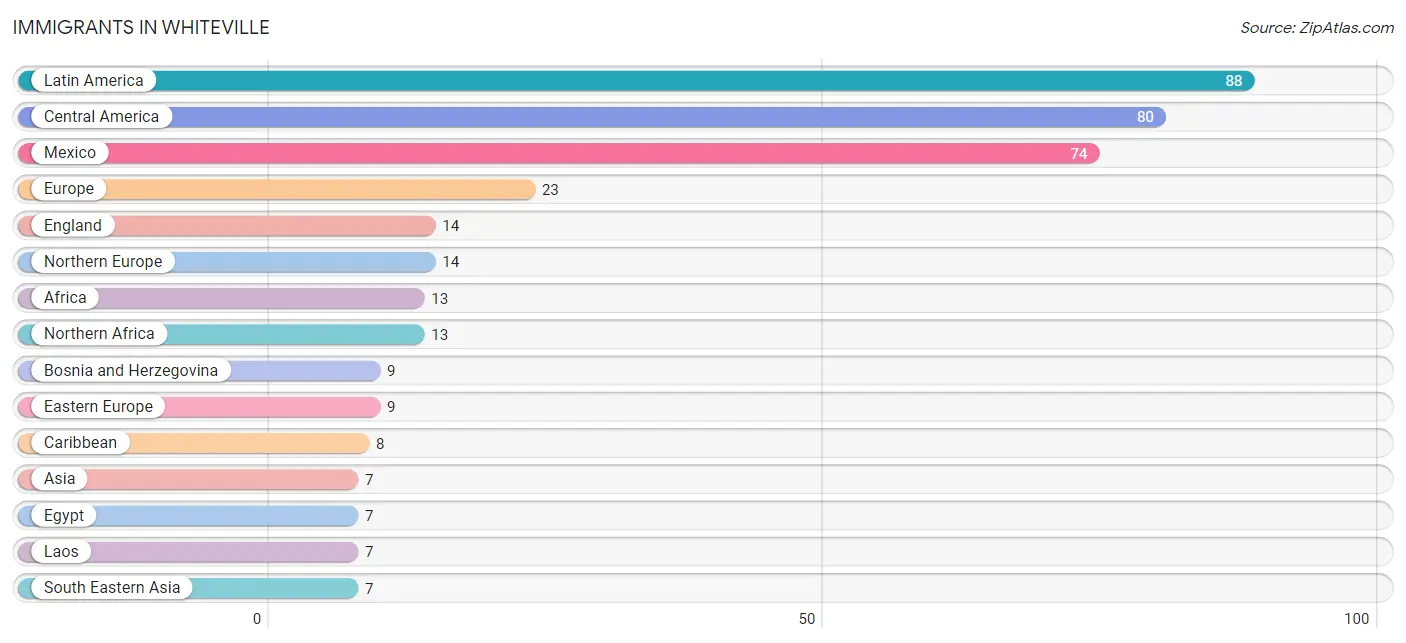
Immigrants in Whiteville
The most numerous immigrant groups reported in Whiteville came from Latin America (88 | 1.9%), Central America (80 | 1.7%), Mexico (74 | 1.6%), Europe (23 | 0.5%), and England (14 | 0.3%), together accounting for 5.9% of all Whiteville residents.
| Immigration Origin | # Population | % Population |
| Africa | 13 | 0.3% |
| Asia | 7 | 0.2% |
| Bosnia and Herzegovina | 9 | 0.2% |
| Caribbean | 8 | 0.2% |
| Central America | 80 | 1.7% |
| Eastern Europe | 9 | 0.2% |
| Egypt | 7 | 0.2% |
| England | 14 | 0.3% |
| Europe | 23 | 0.5% |
| Guatemala | 6 | 0.1% |
| Laos | 7 | 0.2% |
| Latin America | 88 | 1.9% |
| Mexico | 74 | 1.6% |
| Northern Africa | 13 | 0.3% |
| Northern Europe | 14 | 0.3% |
| South Eastern Asia | 7 | 0.2% |
| Sudan | 6 | 0.1% | View All 17 Rows |
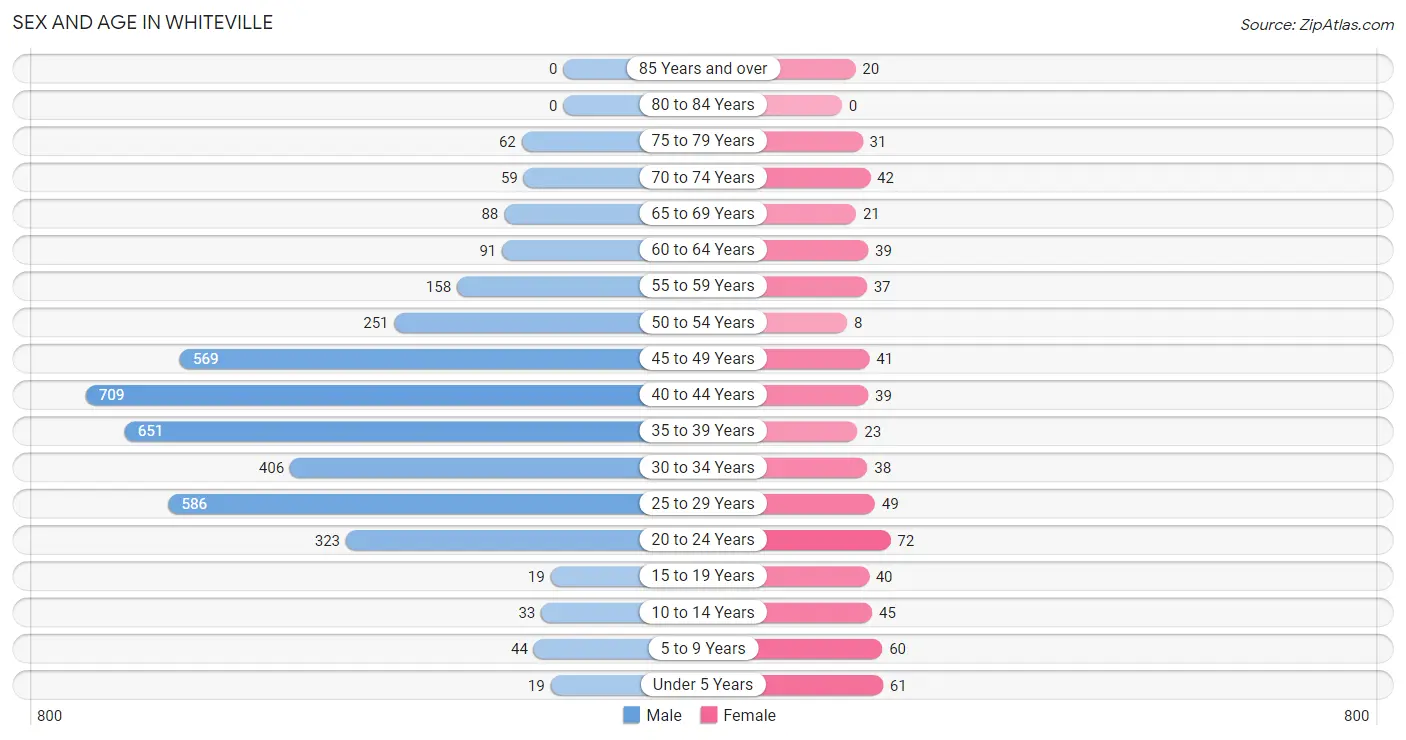
Sex and Age in Whiteville
Sex and Age in Whiteville
The most populous age groups in Whiteville are 40 to 44 Years (709 | 17.4%) for men and 20 to 24 Years (72 | 10.8%) for women.
| Age Bracket | Male | Female |
| Under 5 Years | 19 (0.5%) | 61 (9.2%) |
| 5 to 9 Years | 44 (1.1%) | 60 (9.0%) |
| 10 to 14 Years | 33 (0.8%) | 45 (6.8%) |
| 15 to 19 Years | 19 (0.5%) | 40 (6.0%) |
| 20 to 24 Years | 323 (7.9%) | 72 (10.8%) |
| 25 to 29 Years | 586 (14.4%) | 49 (7.4%) |
| 30 to 34 Years | 406 (10.0%) | 38 (5.7%) |
| 35 to 39 Years | 651 (16.0%) | 23 (3.5%) |
| 40 to 44 Years | 709 (17.4%) | 39 (5.9%) |
| 45 to 49 Years | 569 (14.0%) | 41 (6.2%) |
| 50 to 54 Years | 251 (6.2%) | 8 (1.2%) |
| 55 to 59 Years | 158 (3.9%) | 37 (5.6%) |
| 60 to 64 Years | 91 (2.2%) | 39 (5.9%) |
| 65 to 69 Years | 88 (2.2%) | 21 (3.2%) |
| 70 to 74 Years | 59 (1.5%) | 42 (6.3%) |
| 75 to 79 Years | 62 (1.5%) | 31 (4.6%) |
| 80 to 84 Years | 0 (0.0%) | 0 (0.0%) |
| 85 Years and over | 0 (0.0%) | 20 (3.0%) |
| Total | 4,068 (100.0%) | 666 (100.0%) |
Families and Households in Whiteville
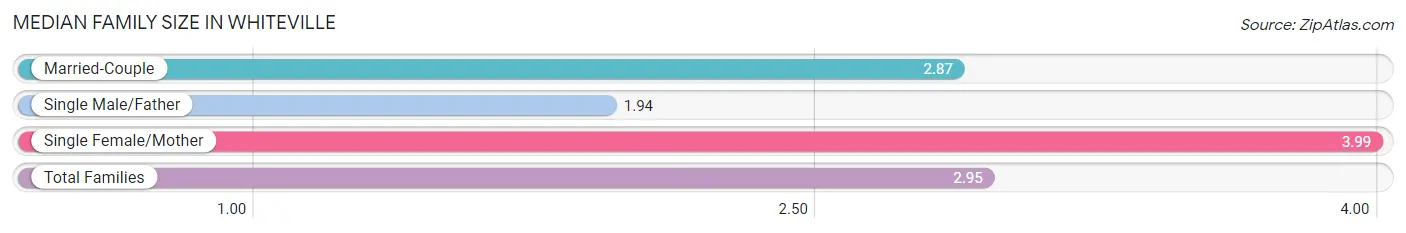
Median Family Size in Whiteville
The median family size in Whiteville is 2.95 persons per family, with single female/mother families (69 | 20.1%) accounting for the largest median family size of 3.99 persons per family. On the other hand, single male/father families (54 | 15.7%) represent the smallest median family size with 1.94 persons per family.
| Family Type | # Families | Family Size |
| Married-Couple | 221 (64.2%) | 2.87 |
| Single Male/Father | 54 (15.7%) | 1.94 |
| Single Female/Mother | 69 (20.1%) | 3.99 |
| Total Families | 344 (100.0%) | 2.95 |
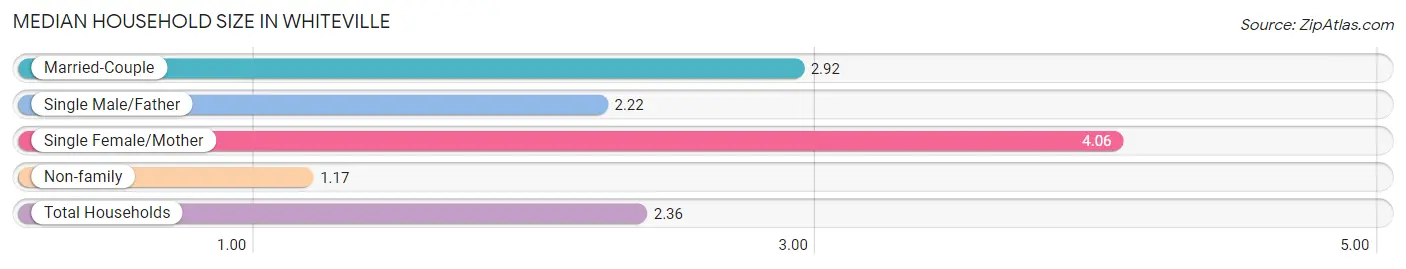
Median Household Size in Whiteville
The median household size in Whiteville is 2.36 persons per household, with single female/mother households (69 | 12.8%) accounting for the largest median household size of 4.06 persons per household. non-family households (195 | 36.2%) represent the smallest median household size with 1.17 persons per household.
| Household Type | # Households | Household Size |
| Married-Couple | 221 (41.0%) | 2.92 |
| Single Male/Father | 54 (10.0%) | 2.22 |
| Single Female/Mother | 69 (12.8%) | 4.06 |
| Non-family | 195 (36.2%) | 1.17 |
| Total Households | 539 (100.0%) | 2.36 |
Household Size by Marriage Status in Whiteville
Out of a total of 539 households in Whiteville, 344 (63.8%) are family households, while 195 (36.2%) are nonfamily households. The most numerous type of family households are 2-person households, comprising 176, and the most common type of nonfamily households are 1-person households, comprising 170.
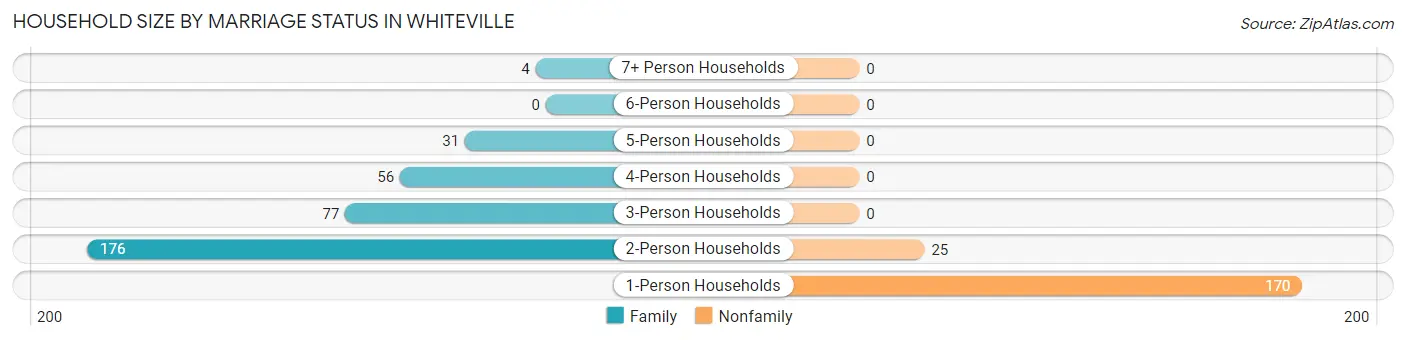
| Household Size | Family Households | Nonfamily Households |
| 1-Person Households | - | 170 (31.5%) |
| 2-Person Households | 176 (32.7%) | 25 (4.6%) |
| 3-Person Households | 77 (14.3%) | 0 (0.0%) |
| 4-Person Households | 56 (10.4%) | 0 (0.0%) |
| 5-Person Households | 31 (5.8%) | 0 (0.0%) |
| 6-Person Households | 0 (0.0%) | 0 (0.0%) |
| 7+ Person Households | 4 (0.7%) | 0 (0.0%) |
| Total | 344 (63.8%) | 195 (36.2%) |
Female Fertility in Whiteville
Fertility by Age in Whiteville
Average fertility rate in Whiteville is 78.0 births per 1,000 women. Women in the age bracket of 15 to 19 years have the highest fertility rate with 275.0 births per 1,000 women. Women in the age bracket of 20 to 34 years acount for 54.2% of all women with births.
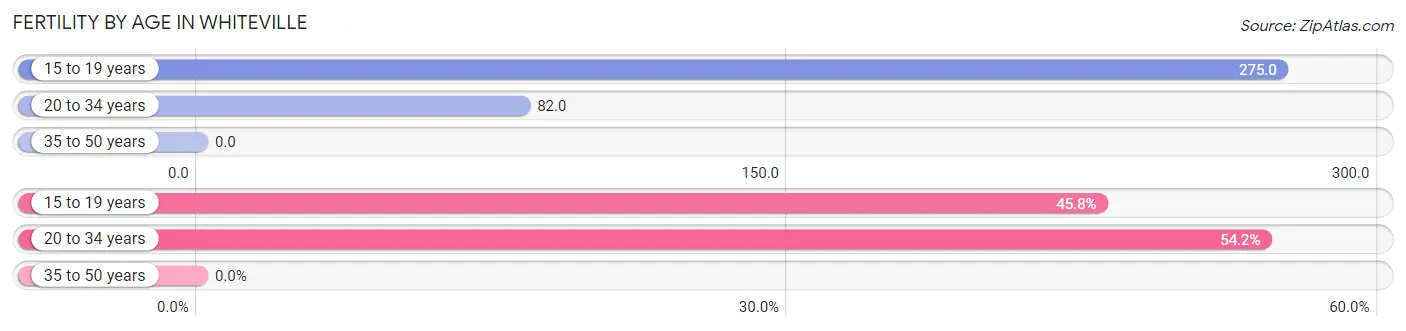
| Age Bracket | Women with Births | Births / 1,000 Women |
| 15 to 19 years | 11 (45.8%) | 275.0 |
| 20 to 34 years | 13 (54.2%) | 82.0 |
| 35 to 50 years | 0 (0.0%) | 0.0 |
| Total | 24 (100.0%) | 78.0 |
Fertility by Age by Marriage Status in Whiteville
12.5% of women with births (24) in Whiteville are married. The highest percentage of unmarried women with births falls into 15 to 19 years age bracket with 100.0% of them unmarried at the time of birth, while the lowest percentage of unmarried women with births belong to 20 to 34 years age bracket with 76.9% of them unmarried.
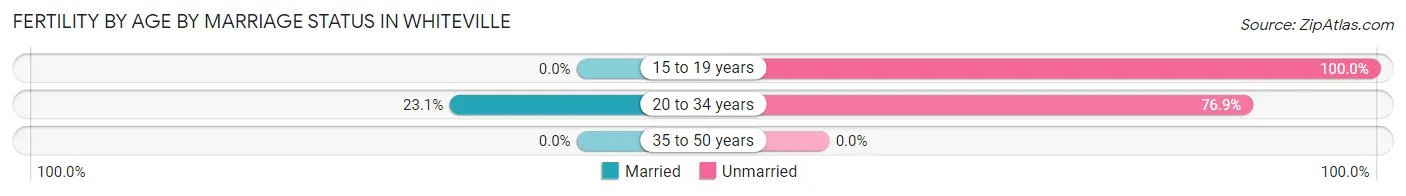
| Age Bracket | Married | Unmarried |
| 15 to 19 years | 0 (0.0%) | 11 (100.0%) |
| 20 to 34 years | 3 (23.1%) | 10 (76.9%) |
| 35 to 50 years | 0 (0.0%) | 0 (0.0%) |
| Total | 3 (12.5%) | 21 (87.5%) |
Fertility by Education in Whiteville
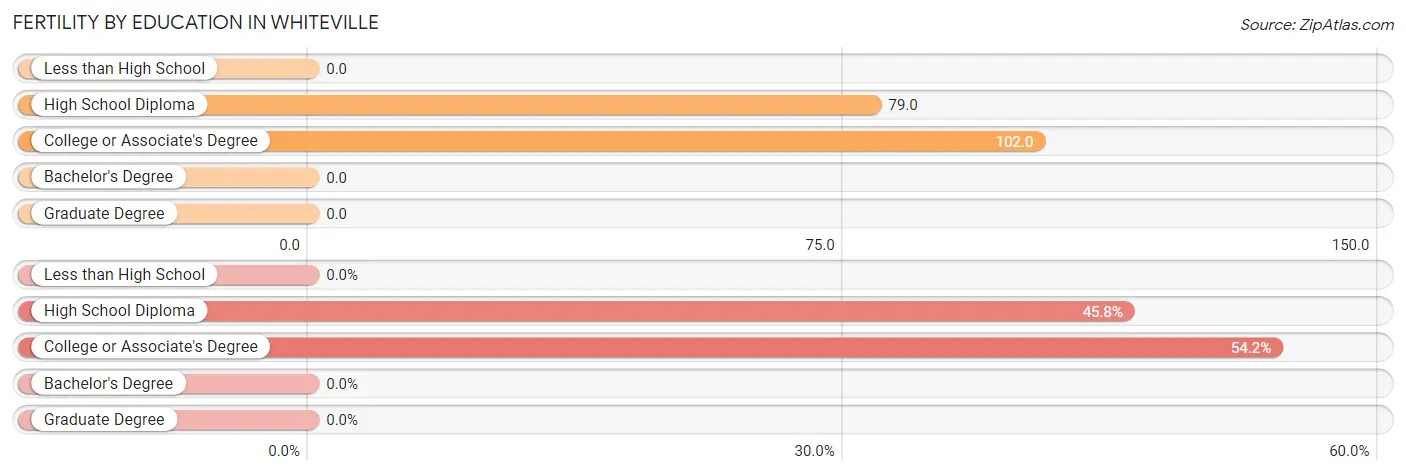
| Educational Attainment | Women with Births | Births / 1,000 Women |
| Less than High School | 0 (0.0%) | 0.0 |
| High School Diploma | 11 (45.8%) | 79.0 |
| College or Associate's Degree | 13 (54.2%) | 102.0 |
| Bachelor's Degree | 0 (0.0%) | 0.0 |
| Graduate Degree | 0 (0.0%) | 0.0 |
| Total | 24 (100.0%) | 78.0 |
Fertility by Education by Marriage Status in Whiteville
87.5% of women with births in Whiteville are unmarried. Women with the educational attainment of college or associate's degree are most likely to be married with 23.1% of them married at childbirth, while women with the educational attainment of high school diploma are least likely to be married with 100.0% of them unmarried at childbirth.
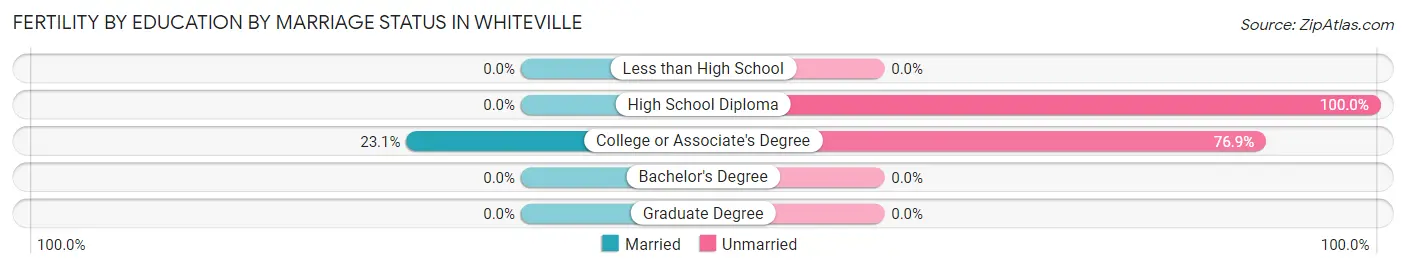
| Educational Attainment | Married | Unmarried |
| Less than High School | 0 (0.0%) | 0 (0.0%) |
| High School Diploma | 0 (0.0%) | 11 (100.0%) |
| College or Associate's Degree | 3 (23.1%) | 10 (76.9%) |
| Bachelor's Degree | 0 (0.0%) | 0 (0.0%) |
| Graduate Degree | 0 (0.0%) | 0 (0.0%) |
| Total | 3 (12.5%) | 21 (87.5%) |
Employment Characteristics in Whiteville
Employment by Class of Employer in Whiteville
Among the 481 employed individuals in Whiteville, private company employees (312 | 64.9%), state government employees (57 | 11.8%), and federal government employees (36 | 7.5%) make up the most common classes of employment.
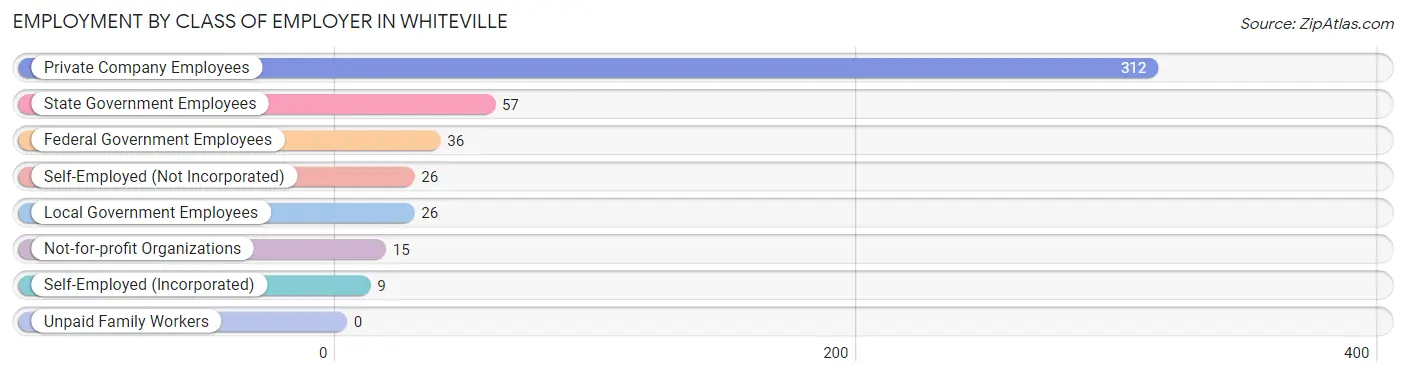
| Employer Class | # Employees | % Employees |
| Private Company Employees | 312 | 64.9% |
| Self-Employed (Incorporated) | 9 | 1.9% |
| Self-Employed (Not Incorporated) | 26 | 5.4% |
| Not-for-profit Organizations | 15 | 3.1% |
| Local Government Employees | 26 | 5.4% |
| State Government Employees | 57 | 11.8% |
| Federal Government Employees | 36 | 7.5% |
| Unpaid Family Workers | 0 | 0.0% |
| Total | 481 | 100.0% |
Employment Status by Age in Whiteville
According to the labor force statistics for Whiteville, out of the total population over 16 years of age (4,467), 12.3% or 549 individuals are in the labor force, with 11.7% or 64 of them unemployed. The age group with the highest labor force participation rate is 60 to 64 years, with 46.9% or 61 individuals in the labor force. Within the labor force, the 16 to 19 years age range has the highest percentage of unemployed individuals, with 95.0% or 19 of them being unemployed.
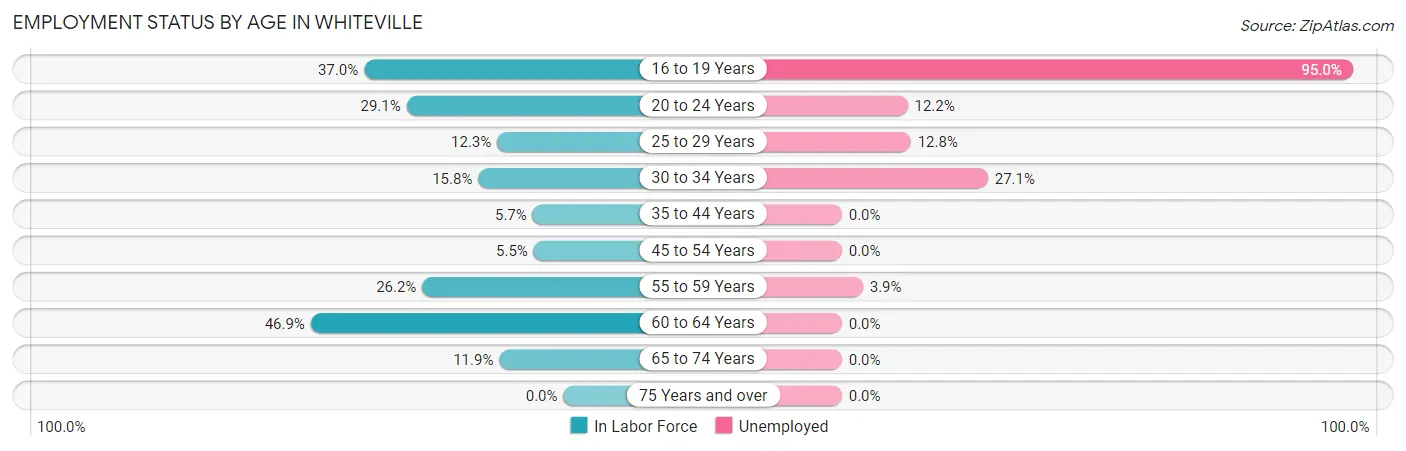
| Age Bracket | In Labor Force | Unemployed |
| 16 to 19 Years | 20 (37.0%) | 19 (95.0%) |
| 20 to 24 Years | 115 (29.1%) | 14 (12.2%) |
| 25 to 29 Years | 78 (12.3%) | 10 (12.8%) |
| 30 to 34 Years | 70 (15.8%) | 19 (27.1%) |
| 35 to 44 Years | 81 (5.7%) | 0 (0.0%) |
| 45 to 54 Years | 48 (5.5%) | 0 (0.0%) |
| 55 to 59 Years | 51 (26.2%) | 2 (3.9%) |
| 60 to 64 Years | 61 (46.9%) | 0 (0.0%) |
| 65 to 74 Years | 25 (11.9%) | 0 (0.0%) |
| 75 Years and over | 0 (0.0%) | 0 (0.0%) |
| Total | 549 (12.3%) | 64 (11.7%) |
Employment Status by Educational Attainment in Whiteville
According to labor force statistics for Whiteville, 10.5% of individuals (388) out of the total population between 25 and 64 years of age (3,695) are in the labor force, with 8.0% or 31 of them being unemployed. The group with the highest labor force participation rate are those with the educational attainment of bachelor's degree or higher, with 31.8% or 34 individuals in the labor force. Within the labor force, individuals with high school diploma education have the highest percentage of unemployment, with 16.9% or 31 of them being unemployed.
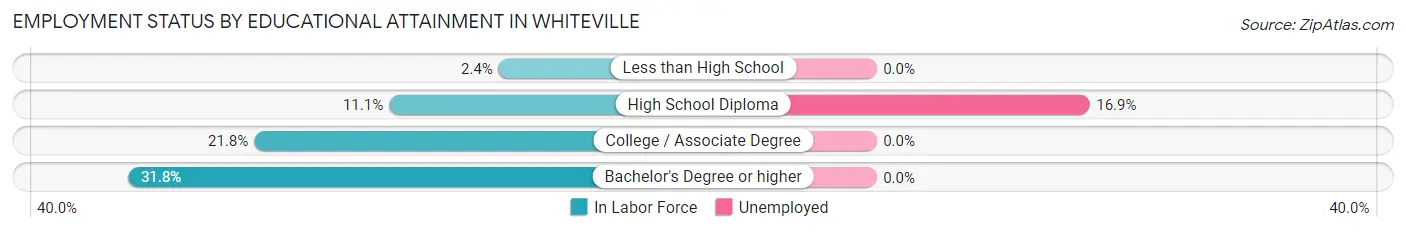
| Educational Attainment | In Labor Force | Unemployed |
| Less than High School | 31 (2.4%) | 0 (0.0%) |
| High School Diploma | 182 (11.1%) | 278 (16.9%) |
| College / Associate Degree | 141 (21.8%) | 0 (0.0%) |
| Bachelor's Degree or higher | 34 (31.8%) | 0 (0.0%) |
| Total | 388 (10.5%) | 296 (8.0%) |
Employment Occupations by Sex in Whiteville
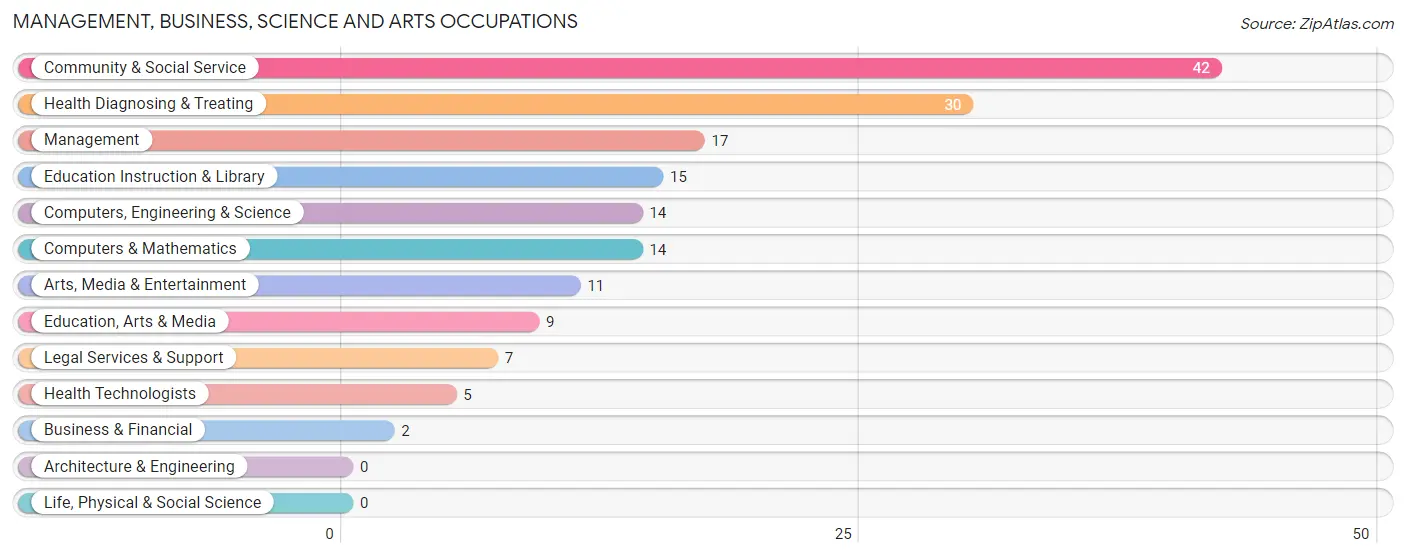
Management, Business, Science and Arts Occupations
The most common Management, Business, Science and Arts occupations in Whiteville are Community & Social Service (42 | 8.7%), Health Diagnosing & Treating (30 | 6.2%), Management (17 | 3.5%), Education Instruction & Library (15 | 3.1%), and Computers, Engineering & Science (14 | 2.9%).
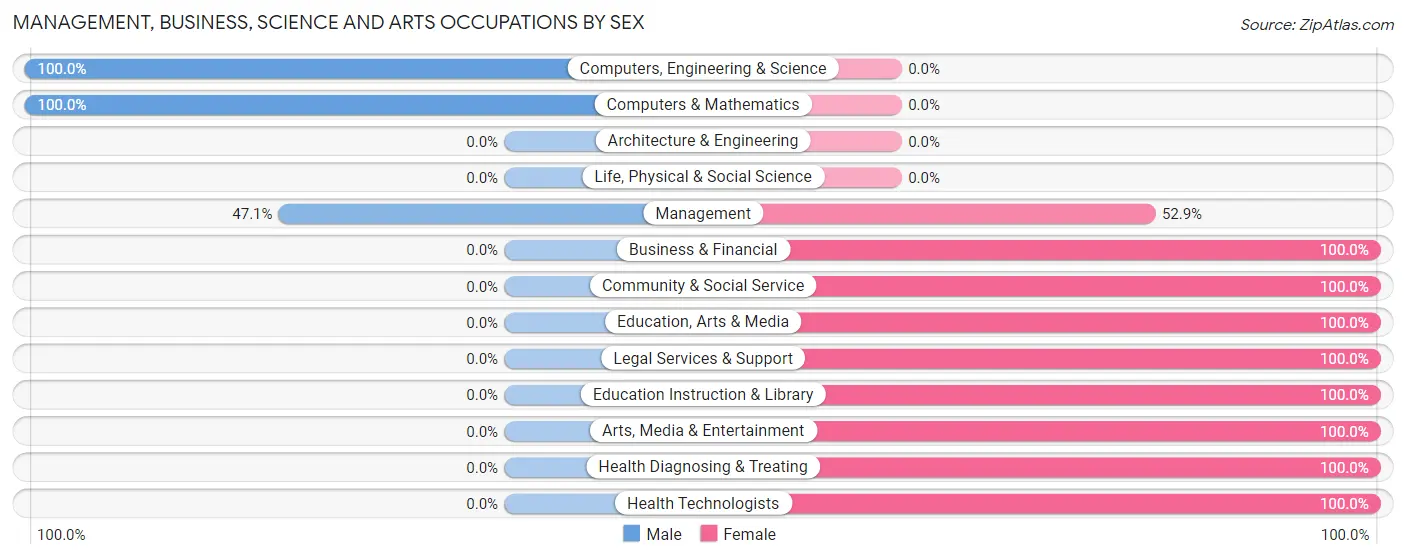
Management, Business, Science and Arts Occupations by Sex
Within the Management, Business, Science and Arts occupations in Whiteville, the most male-oriented occupations are Computers, Engineering & Science (100.0%), Computers & Mathematics (100.0%), and Management (47.1%), while the most female-oriented occupations are Business & Financial (100.0%), Community & Social Service (100.0%), and Education, Arts & Media (100.0%).
| Occupation | Male | Female |
| Management | 8 (47.1%) | 9 (52.9%) |
| Business & Financial | 0 (0.0%) | 2 (100.0%) |
| Computers, Engineering & Science | 14 (100.0%) | 0 (0.0%) |
| Computers & Mathematics | 14 (100.0%) | 0 (0.0%) |
| Architecture & Engineering | 0 (0.0%) | 0 (0.0%) |
| Life, Physical & Social Science | 0 (0.0%) | 0 (0.0%) |
| Community & Social Service | 0 (0.0%) | 42 (100.0%) |
| Education, Arts & Media | 0 (0.0%) | 9 (100.0%) |
| Legal Services & Support | 0 (0.0%) | 7 (100.0%) |
| Education Instruction & Library | 0 (0.0%) | 15 (100.0%) |
| Arts, Media & Entertainment | 0 (0.0%) | 11 (100.0%) |
| Health Diagnosing & Treating | 0 (0.0%) | 30 (100.0%) |
| Health Technologists | 0 (0.0%) | 5 (100.0%) |
| Total (Category) | 22 (20.9%) | 83 (79.0%) |
| Total (Overall) | 246 (50.7%) | 239 (49.3%) |
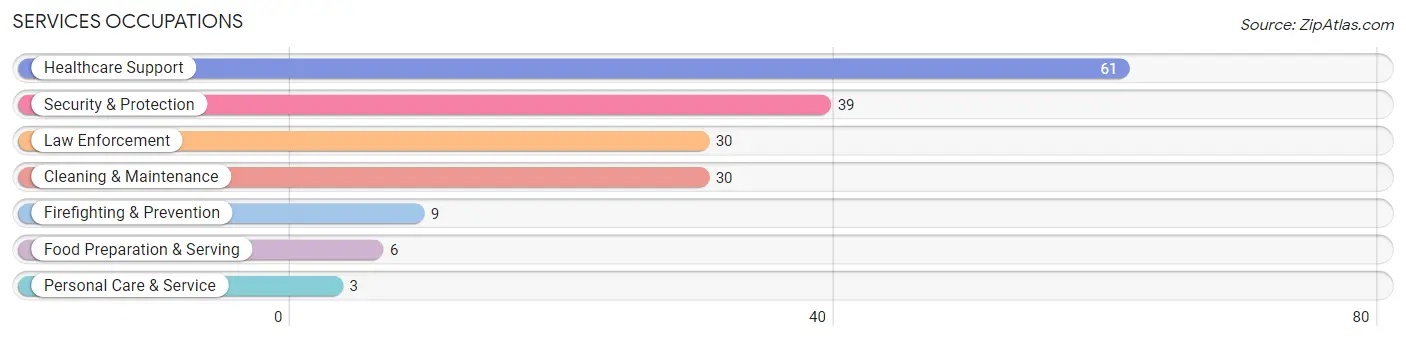
Services Occupations
The most common Services occupations in Whiteville are Healthcare Support (61 | 12.6%), Security & Protection (39 | 8.0%), Law Enforcement (30 | 6.2%), Cleaning & Maintenance (30 | 6.2%), and Firefighting & Prevention (9 | 1.9%).
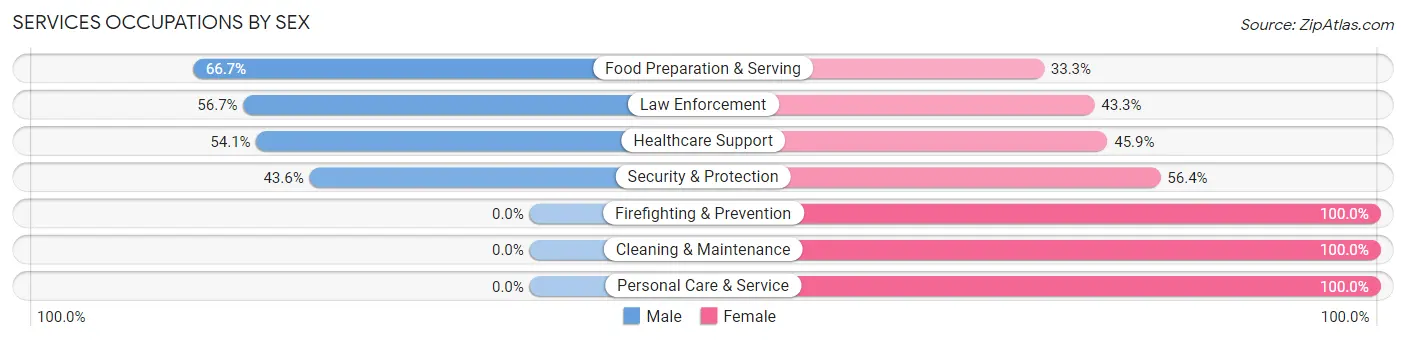
Services Occupations by Sex
Within the Services occupations in Whiteville, the most male-oriented occupations are Food Preparation & Serving (66.7%), Law Enforcement (56.7%), and Healthcare Support (54.1%), while the most female-oriented occupations are Firefighting & Prevention (100.0%), Cleaning & Maintenance (100.0%), and Personal Care & Service (100.0%).
| Occupation | Male | Female |
| Healthcare Support | 33 (54.1%) | 28 (45.9%) |
| Security & Protection | 17 (43.6%) | 22 (56.4%) |
| Firefighting & Prevention | 0 (0.0%) | 9 (100.0%) |
| Law Enforcement | 17 (56.7%) | 13 (43.3%) |
| Food Preparation & Serving | 4 (66.7%) | 2 (33.3%) |
| Cleaning & Maintenance | 0 (0.0%) | 30 (100.0%) |
| Personal Care & Service | 0 (0.0%) | 3 (100.0%) |
| Total (Category) | 54 (38.9%) | 85 (61.2%) |
| Total (Overall) | 246 (50.7%) | 239 (49.3%) |
Sales and Office Occupations
The most common Sales and Office occupations in Whiteville are Office & Administration (30 | 6.2%), and Sales & Related (16 | 3.3%).

Sales and Office Occupations by Sex
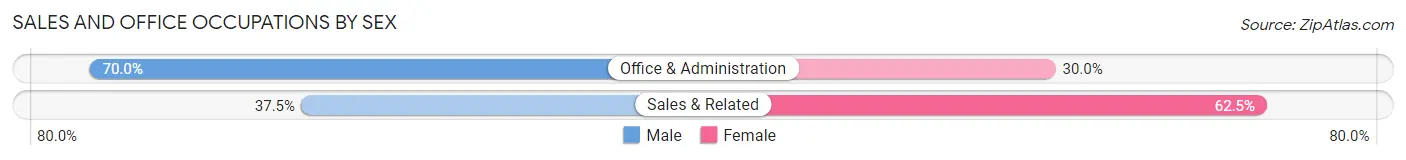
| Occupation | Male | Female |
| Sales & Related | 6 (37.5%) | 10 (62.5%) |
| Office & Administration | 21 (70.0%) | 9 (30.0%) |
| Total (Category) | 27 (58.7%) | 19 (41.3%) |
| Total (Overall) | 246 (50.7%) | 239 (49.3%) |
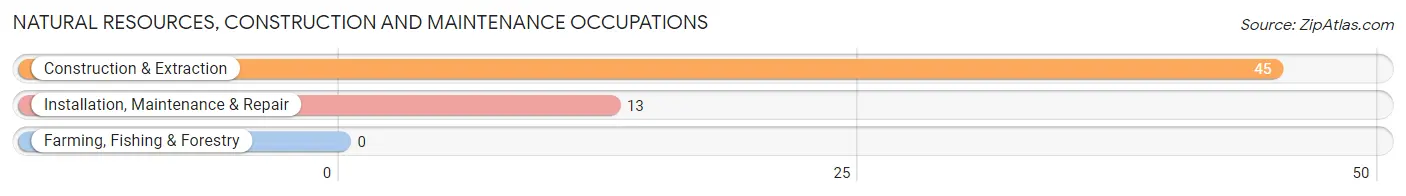
Natural Resources, Construction and Maintenance Occupations
The most common Natural Resources, Construction and Maintenance occupations in Whiteville are Construction & Extraction (45 | 9.3%), and Installation, Maintenance & Repair (13 | 2.7%).
Natural Resources, Construction and Maintenance Occupations by Sex
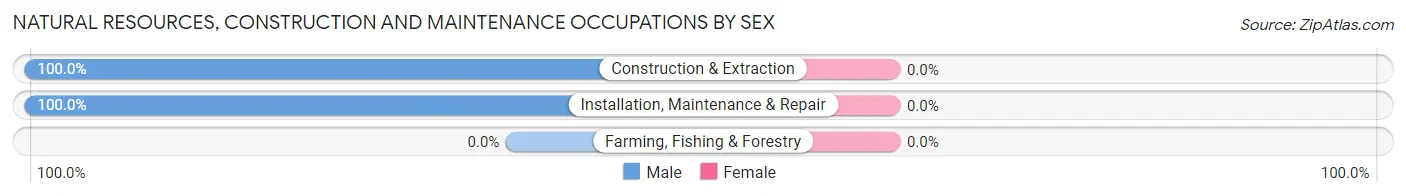
| Occupation | Male | Female |
| Farming, Fishing & Forestry | 0 (0.0%) | 0 (0.0%) |
| Construction & Extraction | 45 (100.0%) | 0 (0.0%) |
| Installation, Maintenance & Repair | 13 (100.0%) | 0 (0.0%) |
| Total (Category) | 58 (100.0%) | 0 (0.0%) |
| Total (Overall) | 246 (50.7%) | 239 (49.3%) |
Production, Transportation and Moving Occupations
The most common Production, Transportation and Moving occupations in Whiteville are Production (97 | 20.0%), Material Moving (26 | 5.4%), and Transportation (14 | 2.9%).
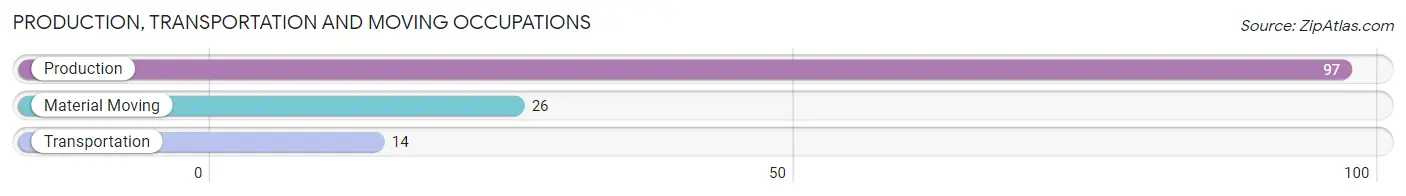
Production, Transportation and Moving Occupations by Sex
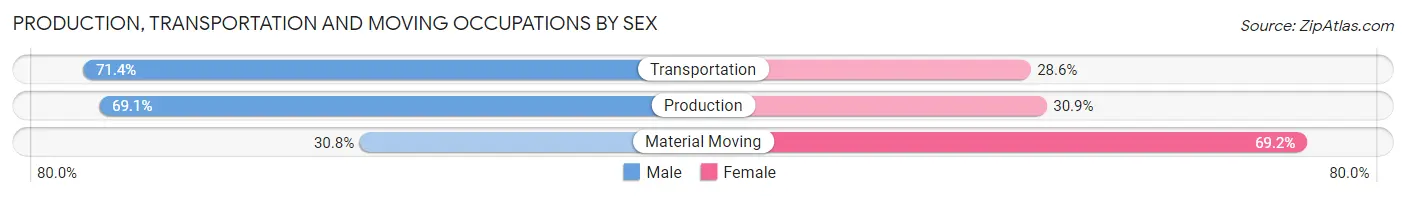
| Occupation | Male | Female |
| Production | 67 (69.1%) | 30 (30.9%) |
| Transportation | 10 (71.4%) | 4 (28.6%) |
| Material Moving | 8 (30.8%) | 18 (69.2%) |
| Total (Category) | 85 (62.0%) | 52 (38.0%) |
| Total (Overall) | 246 (50.7%) | 239 (49.3%) |
Employment Industries by Sex in Whiteville
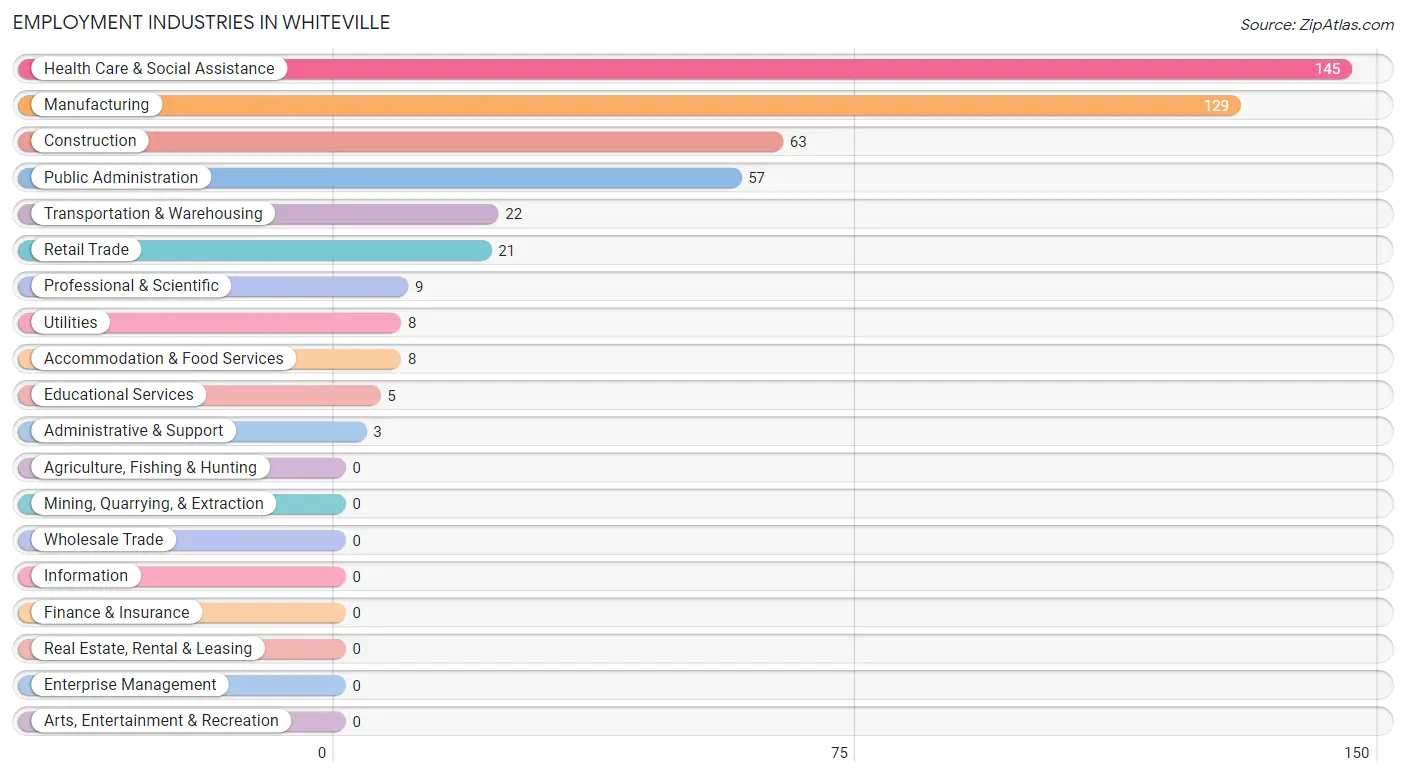
Employment Industries in Whiteville
The major employment industries in Whiteville include Health Care & Social Assistance (145 | 29.9%), Manufacturing (129 | 26.6%), Construction (63 | 13.0%), Public Administration (57 | 11.7%), and Transportation & Warehousing (22 | 4.5%).
Employment Industries by Sex in Whiteville
The Whiteville industries that see more men than women are Construction (100.0%), Utilities (100.0%), and Accommodation & Food Services (100.0%), whereas the industries that tend to have a higher number of women are Professional & Scientific (100.0%), Administrative & Support (100.0%), and Educational Services (100.0%).
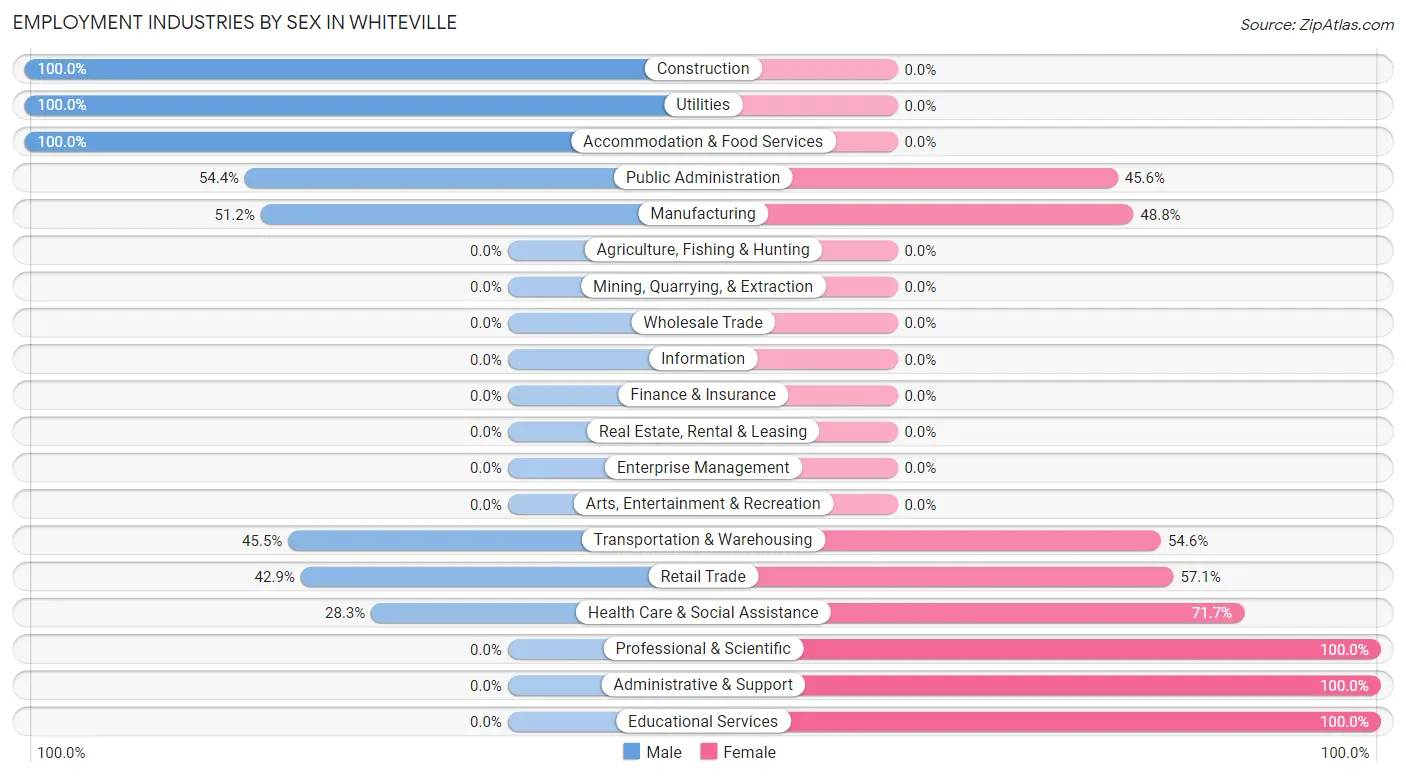
| Industry | Male | Female |
| Agriculture, Fishing & Hunting | 0 (0.0%) | 0 (0.0%) |
| Mining, Quarrying, & Extraction | 0 (0.0%) | 0 (0.0%) |
| Construction | 63 (100.0%) | 0 (0.0%) |
| Manufacturing | 66 (51.2%) | 63 (48.8%) |
| Wholesale Trade | 0 (0.0%) | 0 (0.0%) |
| Retail Trade | 9 (42.9%) | 12 (57.1%) |
| Transportation & Warehousing | 10 (45.5%) | 12 (54.5%) |
| Utilities | 8 (100.0%) | 0 (0.0%) |
| Information | 0 (0.0%) | 0 (0.0%) |
| Finance & Insurance | 0 (0.0%) | 0 (0.0%) |
| Real Estate, Rental & Leasing | 0 (0.0%) | 0 (0.0%) |
| Professional & Scientific | 0 (0.0%) | 9 (100.0%) |
| Enterprise Management | 0 (0.0%) | 0 (0.0%) |
| Administrative & Support | 0 (0.0%) | 3 (100.0%) |
| Educational Services | 0 (0.0%) | 5 (100.0%) |
| Health Care & Social Assistance | 41 (28.3%) | 104 (71.7%) |
| Arts, Entertainment & Recreation | 0 (0.0%) | 0 (0.0%) |
| Accommodation & Food Services | 8 (100.0%) | 0 (0.0%) |
| Public Administration | 31 (54.4%) | 26 (45.6%) |
| Total | 246 (50.7%) | 239 (49.3%) |
Education in Whiteville
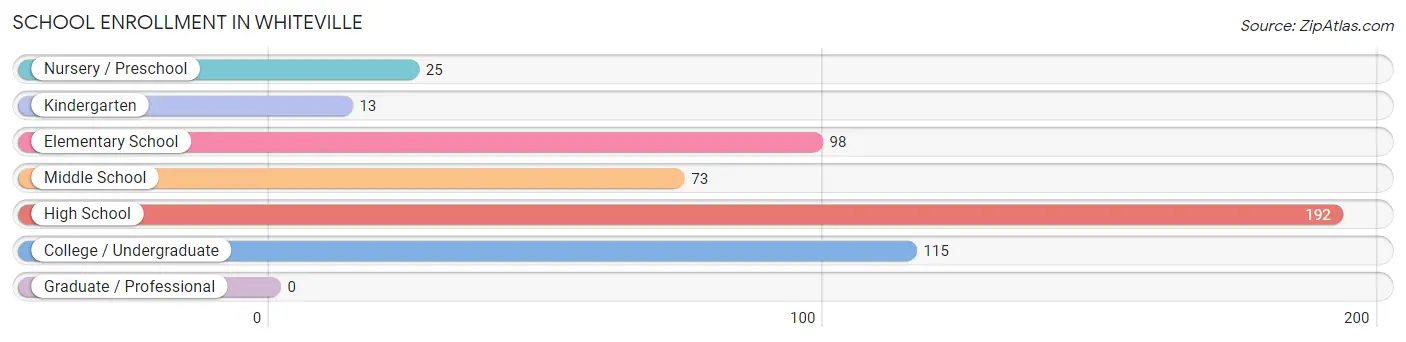
School Enrollment in Whiteville
The most common levels of schooling among the 516 students in Whiteville are high school (192 | 37.2%), college / undergraduate (115 | 22.3%), and elementary school (98 | 19.0%).
| School Level | # Students | % Students |
| Nursery / Preschool | 25 | 4.8% |
| Kindergarten | 13 | 2.5% |
| Elementary School | 98 | 19.0% |
| Middle School | 73 | 14.1% |
| High School | 192 | 37.2% |
| College / Undergraduate | 115 | 22.3% |
| Graduate / Professional | 0 | 0.0% |
| Total | 516 | 100.0% |
School Enrollment by Age by Funding Source in Whiteville
Out of a total of 516 students who are enrolled in schools in Whiteville, 56 (10.9%) attend a private institution, while the remaining 460 (89.1%) are enrolled in public schools. The age group of 15 to 17 year olds has the highest likelihood of being enrolled in private schools, with 13 (41.9% in the age bracket) enrolled. Conversely, the age group of 3 to 4 year olds has the lowest likelihood of being enrolled in a private school, with 25 (100.0% in the age bracket) attending a public institution.
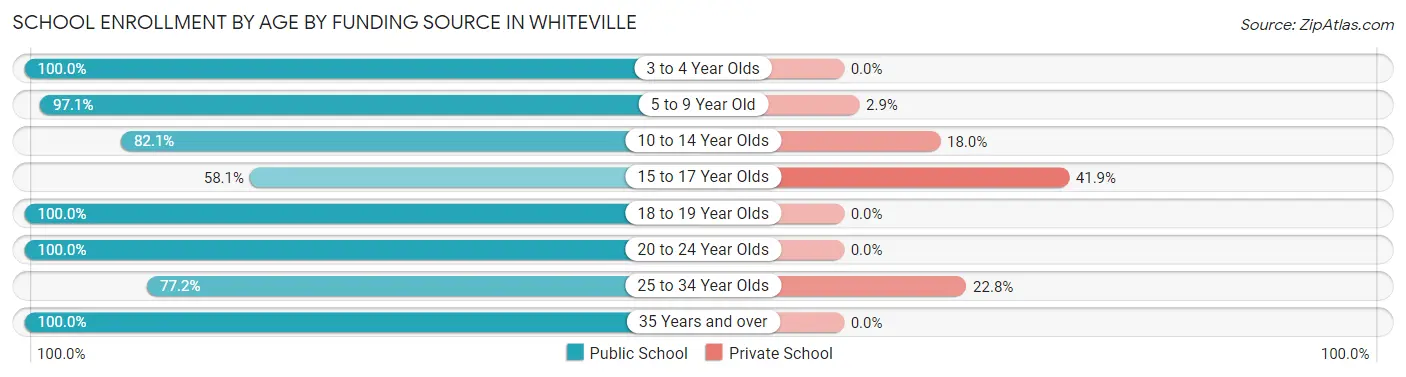
| Age Bracket | Public School | Private School |
| 3 to 4 Year Olds | 25 (100.0%) | 0 (0.0%) |
| 5 to 9 Year Old | 101 (97.1%) | 3 (2.9%) |
| 10 to 14 Year Olds | 64 (82.1%) | 14 (17.9%) |
| 15 to 17 Year Olds | 18 (58.1%) | 13 (41.9%) |
| 18 to 19 Year Olds | 13 (100.0%) | 0 (0.0%) |
| 20 to 24 Year Olds | 50 (100.0%) | 0 (0.0%) |
| 25 to 34 Year Olds | 88 (77.2%) | 26 (22.8%) |
| 35 Years and over | 101 (100.0%) | 0 (0.0%) |
| Total | 460 (89.1%) | 56 (10.9%) |
Educational Attainment by Field of Study in Whiteville
Psychology (41 | 22.4%), business (33 | 18.0%), engineering (26 | 14.2%), education (24 | 13.1%), and arts & humanities (16 | 8.7%) are the most common fields of study among 183 individuals in Whiteville who have obtained a bachelor's degree or higher.
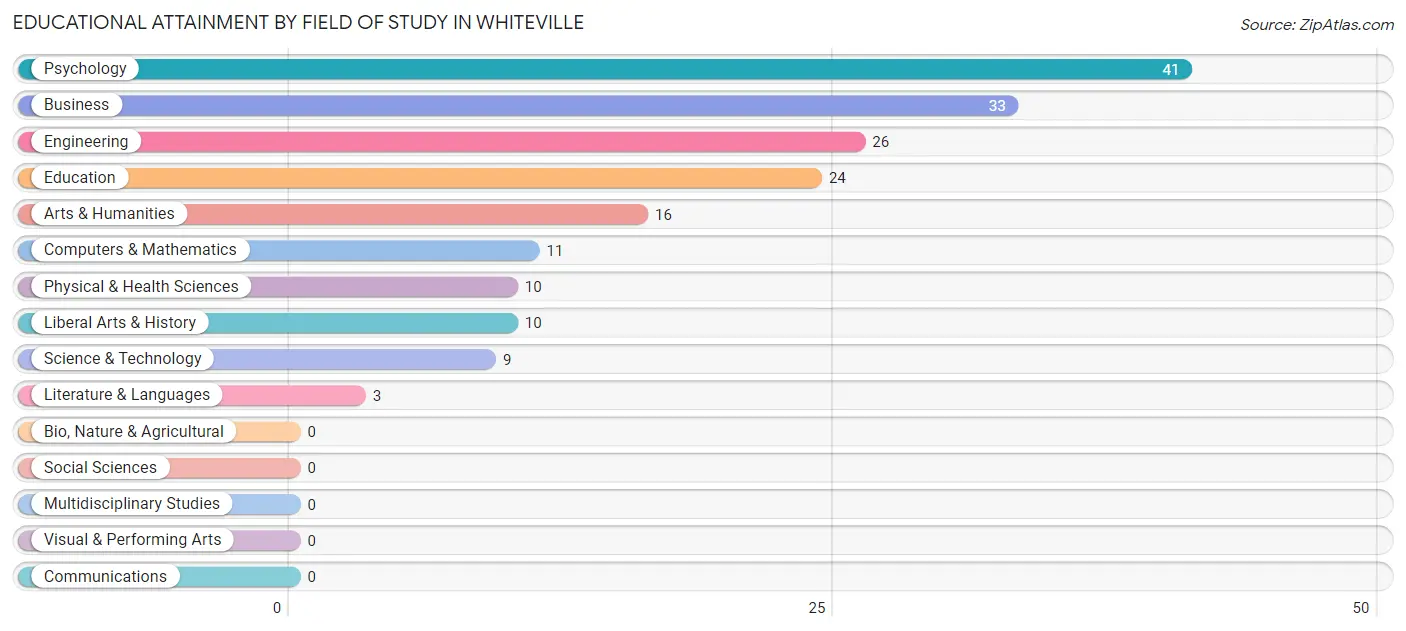
| Field of Study | # Graduates | % Graduates |
| Computers & Mathematics | 11 | 6.0% |
| Bio, Nature & Agricultural | 0 | 0.0% |
| Physical & Health Sciences | 10 | 5.5% |
| Psychology | 41 | 22.4% |
| Social Sciences | 0 | 0.0% |
| Engineering | 26 | 14.2% |
| Multidisciplinary Studies | 0 | 0.0% |
| Science & Technology | 9 | 4.9% |
| Business | 33 | 18.0% |
| Education | 24 | 13.1% |
| Literature & Languages | 3 | 1.6% |
| Liberal Arts & History | 10 | 5.5% |
| Visual & Performing Arts | 0 | 0.0% |
| Communications | 0 | 0.0% |
| Arts & Humanities | 16 | 8.7% |
| Total | 183 | 100.0% |
Transportation & Commute in Whiteville
Vehicle Availability by Sex in Whiteville
The most prevalent vehicle ownership categories in Whiteville are males with 2 vehicles (133, accounting for 55.0%) and females with 2 vehicles (91, making up 55.6%).
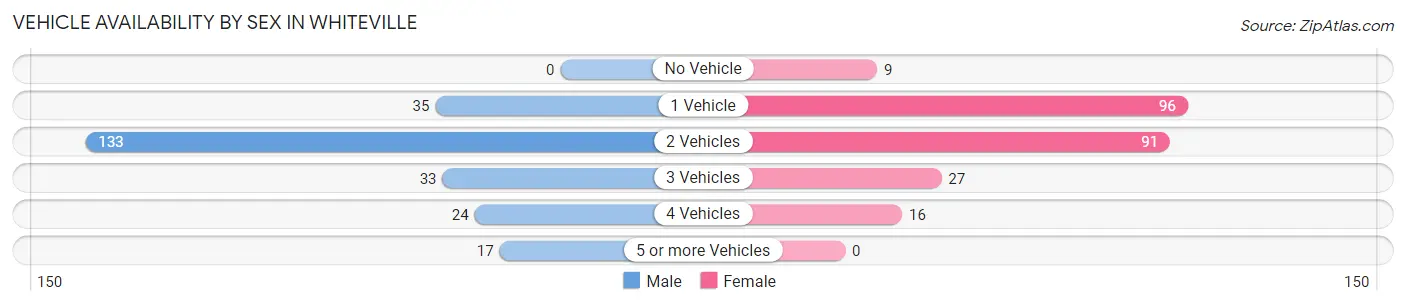
| Vehicles Available | Male | Female |
| No Vehicle | 0 (0.0%) | 9 (3.8%) |
| 1 Vehicle | 35 (14.5%) | 96 (40.2%) |
| 2 Vehicles | 133 (55.0%) | 91 (38.1%) |
| 3 Vehicles | 33 (13.6%) | 27 (11.3%) |
| 4 Vehicles | 24 (9.9%) | 16 (6.7%) |
| 5 or more Vehicles | 17 (7.0%) | 0 (0.0%) |
| Total | 242 (100.0%) | 239 (100.0%) |
Commute Time in Whiteville
The most frequently occuring commute durations in Whiteville are 20 to 24 minutes (105 commuters, 21.8%), 45 to 59 minutes (90 commuters, 18.7%), and 5 to 9 minutes (60 commuters, 12.5%).
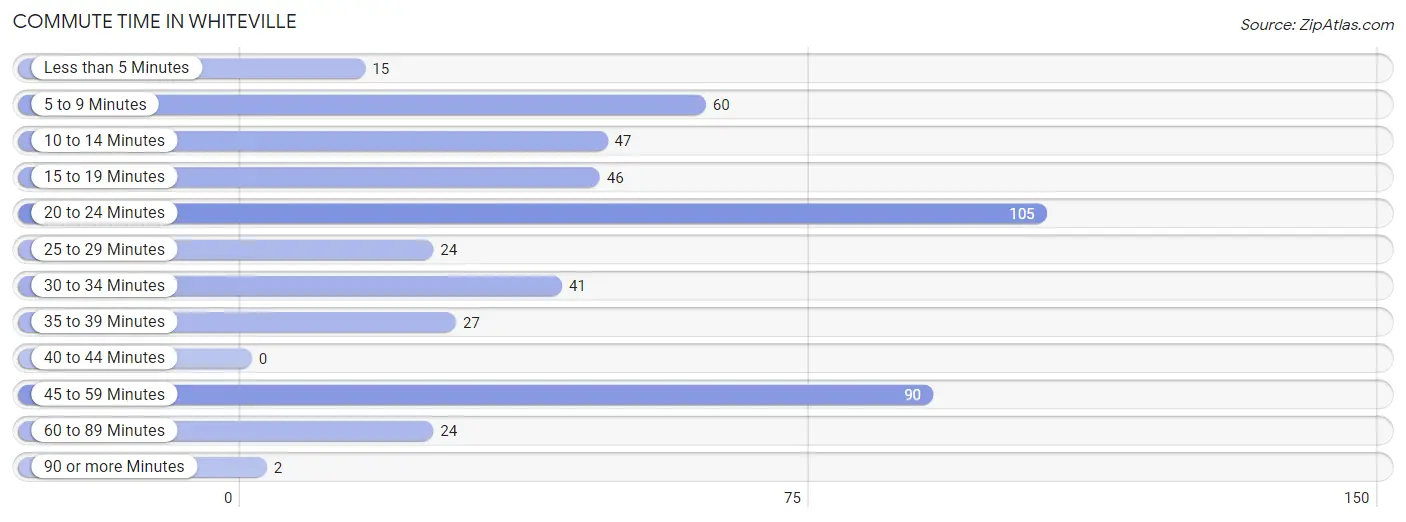
| Commute Time | # Commuters | % Commuters |
| Less than 5 Minutes | 15 | 3.1% |
| 5 to 9 Minutes | 60 | 12.5% |
| 10 to 14 Minutes | 47 | 9.8% |
| 15 to 19 Minutes | 46 | 9.6% |
| 20 to 24 Minutes | 105 | 21.8% |
| 25 to 29 Minutes | 24 | 5.0% |
| 30 to 34 Minutes | 41 | 8.5% |
| 35 to 39 Minutes | 27 | 5.6% |
| 40 to 44 Minutes | 0 | 0.0% |
| 45 to 59 Minutes | 90 | 18.7% |
| 60 to 89 Minutes | 24 | 5.0% |
| 90 or more Minutes | 2 | 0.4% |
Commute Time by Sex in Whiteville
The most common commute times in Whiteville are 45 to 59 minutes (52 commuters, 21.5%) for males and 20 to 24 minutes (63 commuters, 26.4%) for females.
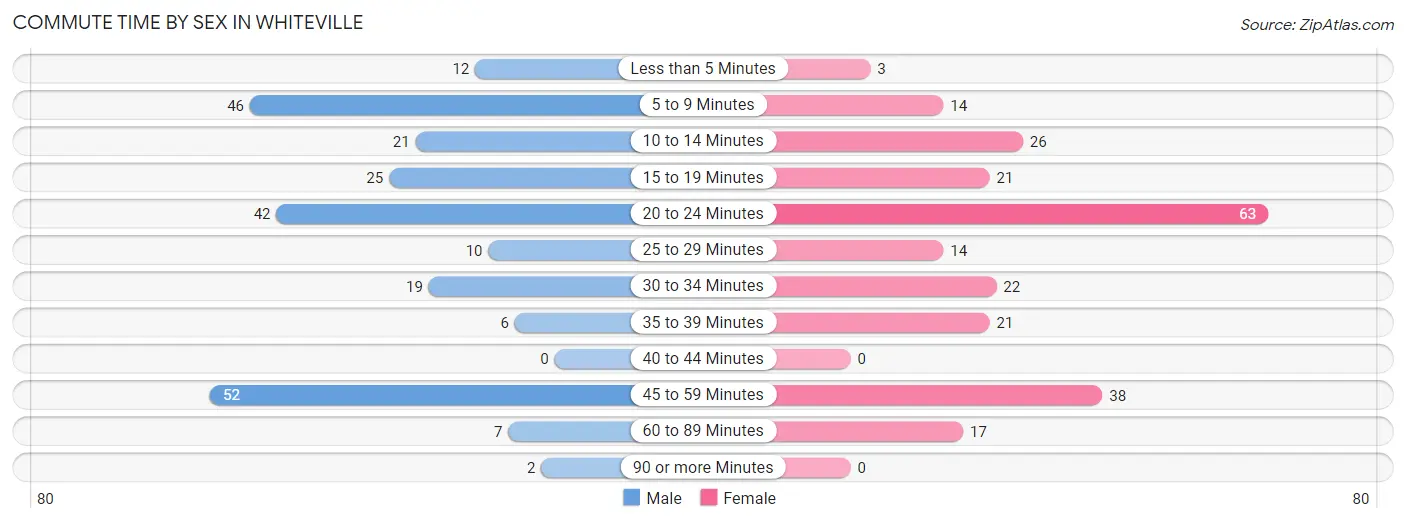
| Commute Time | Male | Female |
| Less than 5 Minutes | 12 (5.0%) | 3 (1.3%) |
| 5 to 9 Minutes | 46 (19.0%) | 14 (5.9%) |
| 10 to 14 Minutes | 21 (8.7%) | 26 (10.9%) |
| 15 to 19 Minutes | 25 (10.3%) | 21 (8.8%) |
| 20 to 24 Minutes | 42 (17.4%) | 63 (26.4%) |
| 25 to 29 Minutes | 10 (4.1%) | 14 (5.9%) |
| 30 to 34 Minutes | 19 (7.9%) | 22 (9.2%) |
| 35 to 39 Minutes | 6 (2.5%) | 21 (8.8%) |
| 40 to 44 Minutes | 0 (0.0%) | 0 (0.0%) |
| 45 to 59 Minutes | 52 (21.5%) | 38 (15.9%) |
| 60 to 89 Minutes | 7 (2.9%) | 17 (7.1%) |
| 90 or more Minutes | 2 (0.8%) | 0 (0.0%) |
Time of Departure to Work by Sex in Whiteville
The most frequent times of departure to work in Whiteville are 12:00 PM to 3:59 PM (54, 22.3%) for males and 7:00 AM to 7:29 AM (42, 17.6%) for females.
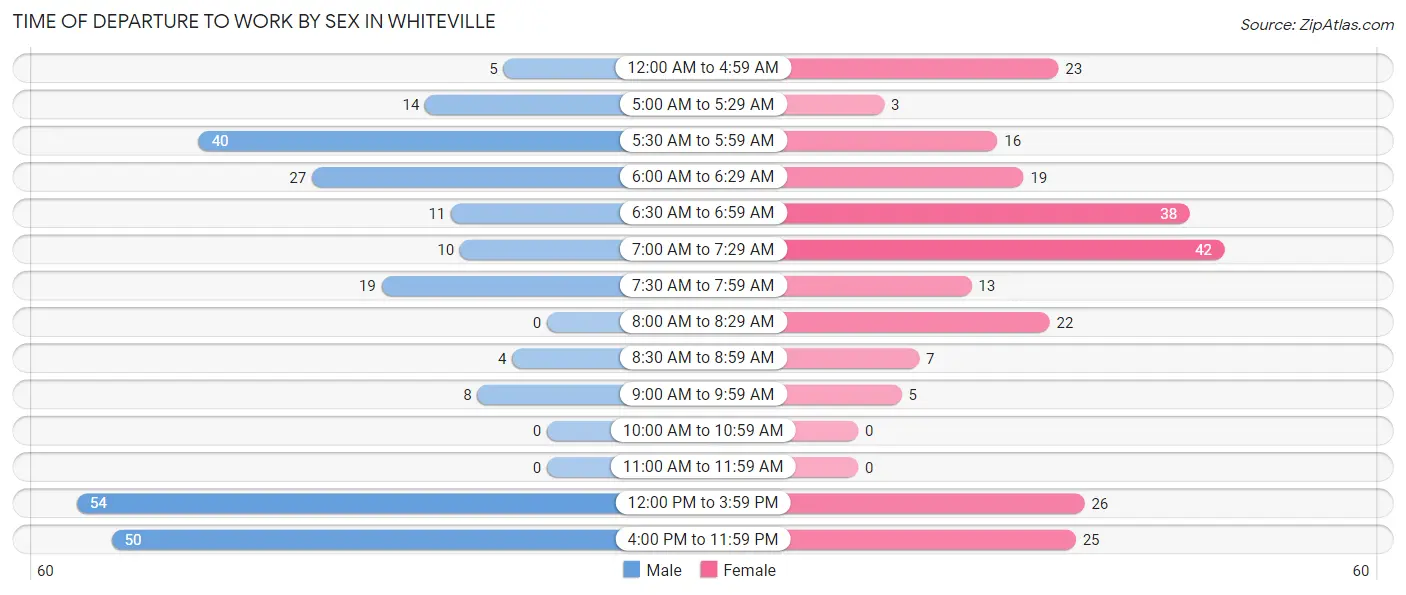
| Time of Departure | Male | Female |
| 12:00 AM to 4:59 AM | 5 (2.1%) | 23 (9.6%) |
| 5:00 AM to 5:29 AM | 14 (5.8%) | 3 (1.3%) |
| 5:30 AM to 5:59 AM | 40 (16.5%) | 16 (6.7%) |
| 6:00 AM to 6:29 AM | 27 (11.2%) | 19 (8.0%) |
| 6:30 AM to 6:59 AM | 11 (4.5%) | 38 (15.9%) |
| 7:00 AM to 7:29 AM | 10 (4.1%) | 42 (17.6%) |
| 7:30 AM to 7:59 AM | 19 (7.9%) | 13 (5.4%) |
| 8:00 AM to 8:29 AM | 0 (0.0%) | 22 (9.2%) |
| 8:30 AM to 8:59 AM | 4 (1.7%) | 7 (2.9%) |
| 9:00 AM to 9:59 AM | 8 (3.3%) | 5 (2.1%) |
| 10:00 AM to 10:59 AM | 0 (0.0%) | 0 (0.0%) |
| 11:00 AM to 11:59 AM | 0 (0.0%) | 0 (0.0%) |
| 12:00 PM to 3:59 PM | 54 (22.3%) | 26 (10.9%) |
| 4:00 PM to 11:59 PM | 50 (20.7%) | 25 (10.5%) |
| Total | 242 (100.0%) | 239 (100.0%) |
Housing Occupancy in Whiteville
Occupancy by Ownership in Whiteville
Of the total 539 dwellings in Whiteville, owner-occupied units account for 220 (40.8%), while renter-occupied units make up 319 (59.2%).
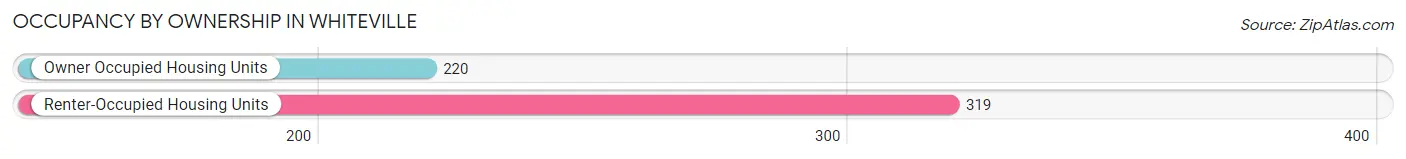
| Occupancy | # Housing Units | % Housing Units |
| Owner Occupied Housing Units | 220 | 40.8% |
| Renter-Occupied Housing Units | 319 | 59.2% |
| Total Occupied Housing Units | 539 | 100.0% |
Occupancy by Household Size in Whiteville
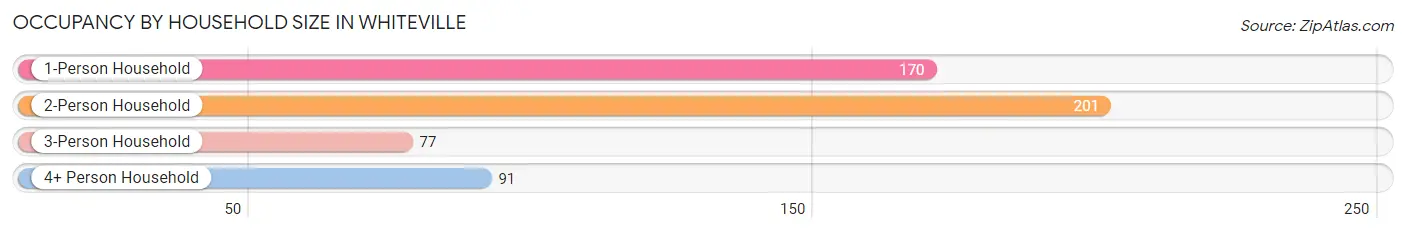
| Household Size | # Housing Units | % Housing Units |
| 1-Person Household | 170 | 31.5% |
| 2-Person Household | 201 | 37.3% |
| 3-Person Household | 77 | 14.3% |
| 4+ Person Household | 91 | 16.9% |
| Total Housing Units | 539 | 100.0% |
Occupancy by Ownership by Household Size in Whiteville
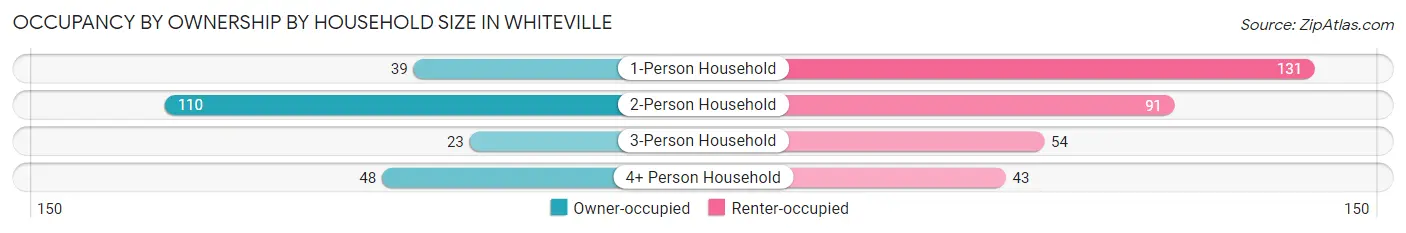
| Household Size | Owner-occupied | Renter-occupied |
| 1-Person Household | 39 (22.9%) | 131 (77.1%) |
| 2-Person Household | 110 (54.7%) | 91 (45.3%) |
| 3-Person Household | 23 (29.9%) | 54 (70.1%) |
| 4+ Person Household | 48 (52.7%) | 43 (47.2%) |
| Total Housing Units | 220 (40.8%) | 319 (59.2%) |
Occupancy by Educational Attainment in Whiteville
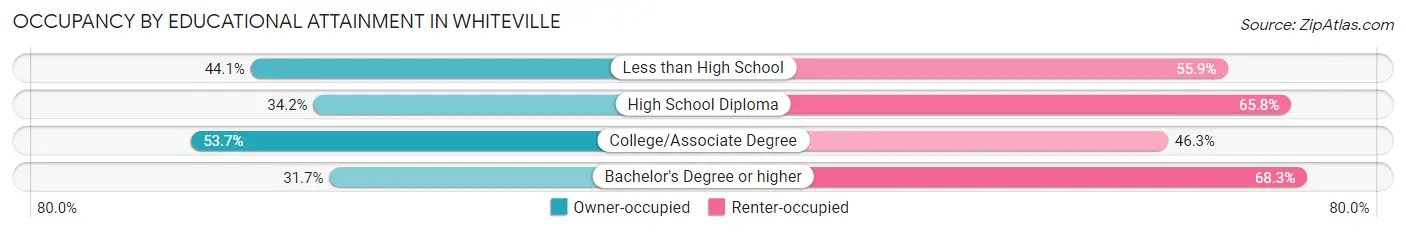
| Household Size | Owner-occupied | Renter-occupied |
| Less than High School | 49 (44.1%) | 62 (55.9%) |
| High School Diploma | 80 (34.2%) | 154 (65.8%) |
| College/Associate Degree | 72 (53.7%) | 62 (46.3%) |
| Bachelor's Degree or higher | 19 (31.7%) | 41 (68.3%) |
Occupancy by Age of Householder in Whiteville
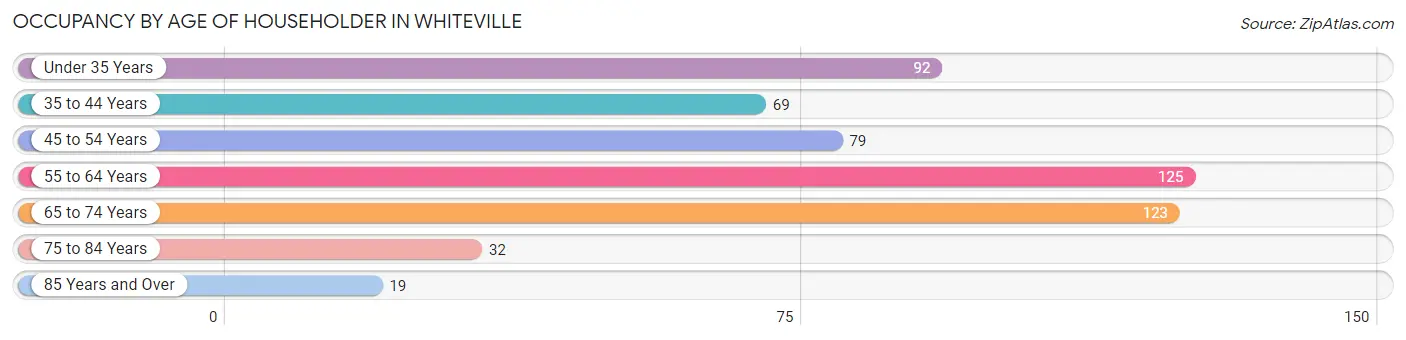
| Age Bracket | # Households | % Households |
| Under 35 Years | 92 | 17.1% |
| 35 to 44 Years | 69 | 12.8% |
| 45 to 54 Years | 79 | 14.7% |
| 55 to 64 Years | 125 | 23.2% |
| 65 to 74 Years | 123 | 22.8% |
| 75 to 84 Years | 32 | 5.9% |
| 85 Years and Over | 19 | 3.5% |
| Total | 539 | 100.0% |
Housing Finances in Whiteville
Median Income by Occupancy in Whiteville
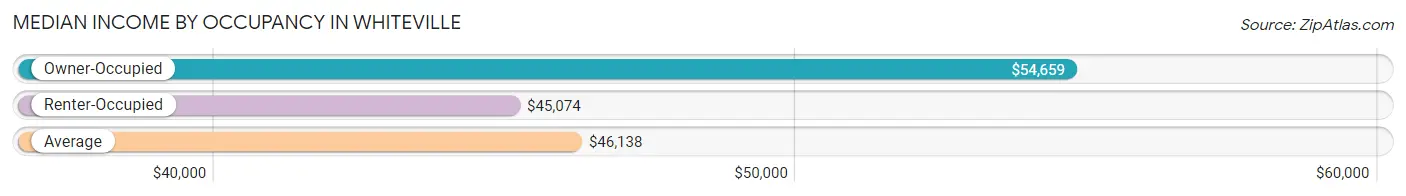
| Occupancy Type | # Households | Median Income |
| Owner-Occupied | 220 (40.8%) | $54,659 |
| Renter-Occupied | 319 (59.2%) | $45,074 |
| Average | 539 (100.0%) | $46,138 |
Occupancy by Householder Income Bracket in Whiteville
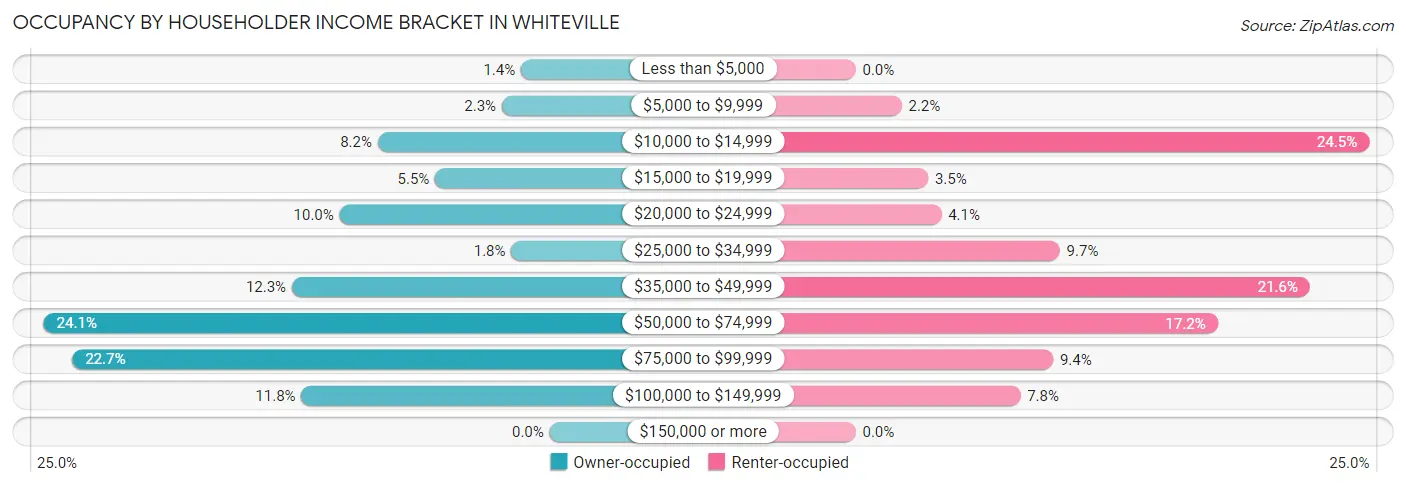
| Income Bracket | Owner-occupied | Renter-occupied |
| Less than $5,000 | 3 (1.4%) | 0 (0.0%) |
| $5,000 to $9,999 | 5 (2.3%) | 7 (2.2%) |
| $10,000 to $14,999 | 18 (8.2%) | 78 (24.4%) |
| $15,000 to $19,999 | 12 (5.4%) | 11 (3.5%) |
| $20,000 to $24,999 | 22 (10.0%) | 13 (4.1%) |
| $25,000 to $34,999 | 4 (1.8%) | 31 (9.7%) |
| $35,000 to $49,999 | 27 (12.3%) | 69 (21.6%) |
| $50,000 to $74,999 | 53 (24.1%) | 55 (17.2%) |
| $75,000 to $99,999 | 50 (22.7%) | 30 (9.4%) |
| $100,000 to $149,999 | 26 (11.8%) | 25 (7.8%) |
| $150,000 or more | 0 (0.0%) | 0 (0.0%) |
| Total | 220 (100.0%) | 319 (100.0%) |
Monthly Housing Cost Tiers in Whiteville
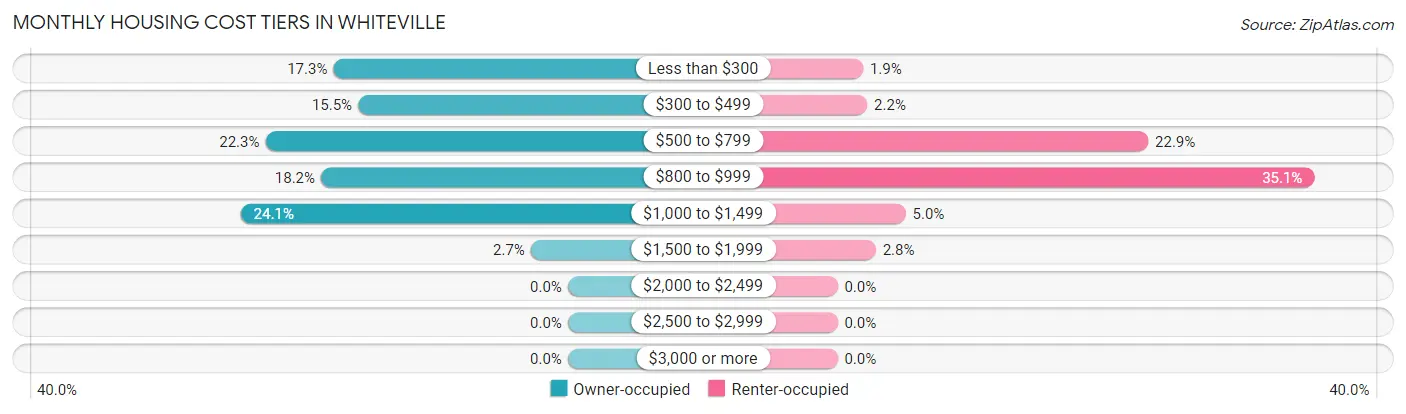
| Monthly Cost | Owner-occupied | Renter-occupied |
| Less than $300 | 38 (17.3%) | 6 (1.9%) |
| $300 to $499 | 34 (15.4%) | 7 (2.2%) |
| $500 to $799 | 49 (22.3%) | 73 (22.9%) |
| $800 to $999 | 40 (18.2%) | 112 (35.1%) |
| $1,000 to $1,499 | 53 (24.1%) | 16 (5.0%) |
| $1,500 to $1,999 | 6 (2.7%) | 9 (2.8%) |
| $2,000 to $2,499 | 0 (0.0%) | 0 (0.0%) |
| $2,500 to $2,999 | 0 (0.0%) | 0 (0.0%) |
| $3,000 or more | 0 (0.0%) | 0 (0.0%) |
| Total | 220 (100.0%) | 319 (100.0%) |
Physical Housing Characteristics in Whiteville
Housing Structures in Whiteville
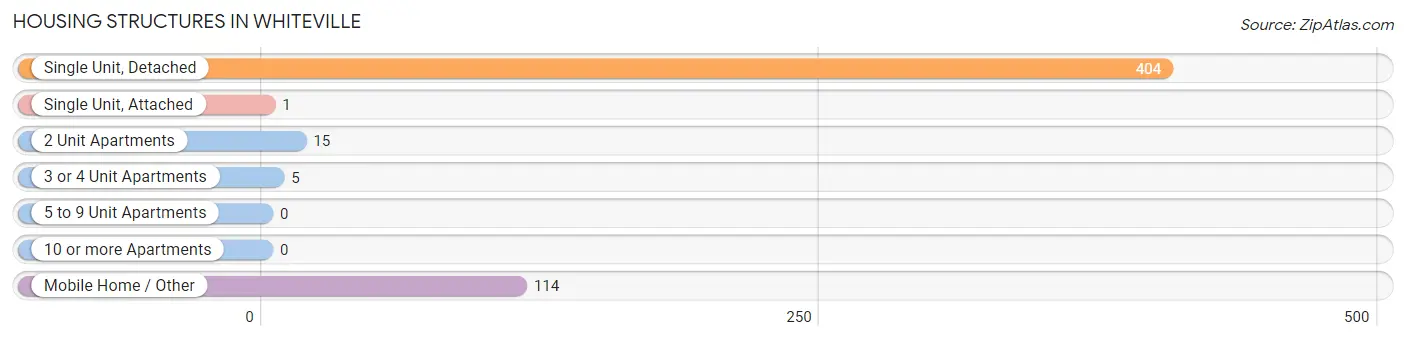
| Structure Type | # Housing Units | % Housing Units |
| Single Unit, Detached | 404 | 75.0% |
| Single Unit, Attached | 1 | 0.2% |
| 2 Unit Apartments | 15 | 2.8% |
| 3 or 4 Unit Apartments | 5 | 0.9% |
| 5 to 9 Unit Apartments | 0 | 0.0% |
| 10 or more Apartments | 0 | 0.0% |
| Mobile Home / Other | 114 | 21.1% |
| Total | 539 | 100.0% |
Housing Structures by Occupancy in Whiteville
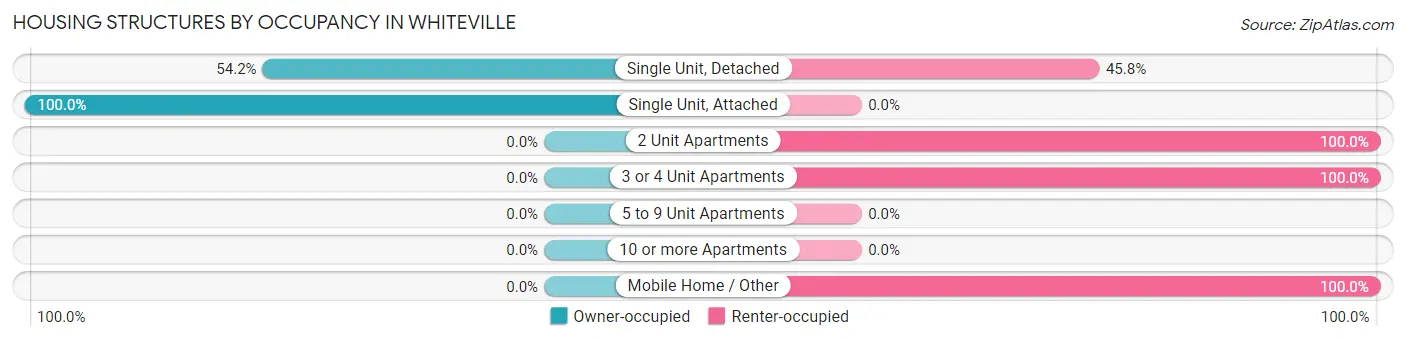
| Structure Type | Owner-occupied | Renter-occupied |
| Single Unit, Detached | 219 (54.2%) | 185 (45.8%) |
| Single Unit, Attached | 1 (100.0%) | 0 (0.0%) |
| 2 Unit Apartments | 0 (0.0%) | 15 (100.0%) |
| 3 or 4 Unit Apartments | 0 (0.0%) | 5 (100.0%) |
| 5 to 9 Unit Apartments | 0 (0.0%) | 0 (0.0%) |
| 10 or more Apartments | 0 (0.0%) | 0 (0.0%) |
| Mobile Home / Other | 0 (0.0%) | 114 (100.0%) |
| Total | 220 (40.8%) | 319 (59.2%) |
Housing Structures by Number of Rooms in Whiteville
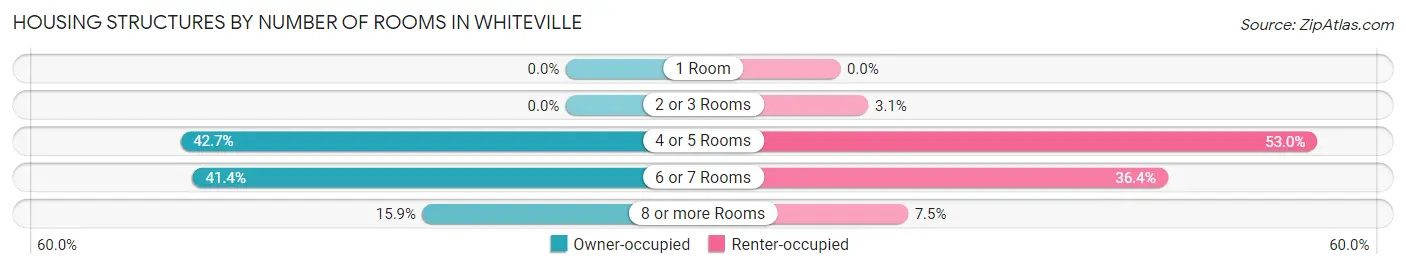
| Number of Rooms | Owner-occupied | Renter-occupied |
| 1 Room | 0 (0.0%) | 0 (0.0%) |
| 2 or 3 Rooms | 0 (0.0%) | 10 (3.1%) |
| 4 or 5 Rooms | 94 (42.7%) | 169 (53.0%) |
| 6 or 7 Rooms | 91 (41.4%) | 116 (36.4%) |
| 8 or more Rooms | 35 (15.9%) | 24 (7.5%) |
| Total | 220 (100.0%) | 319 (100.0%) |
Housing Structure by Heating Type in Whiteville
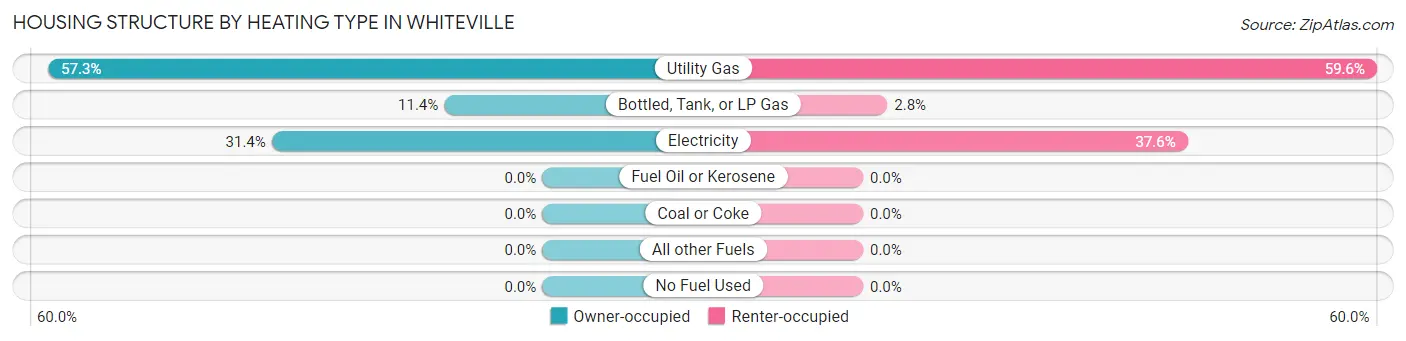
| Heating Type | Owner-occupied | Renter-occupied |
| Utility Gas | 126 (57.3%) | 190 (59.6%) |
| Bottled, Tank, or LP Gas | 25 (11.4%) | 9 (2.8%) |
| Electricity | 69 (31.4%) | 120 (37.6%) |
| Fuel Oil or Kerosene | 0 (0.0%) | 0 (0.0%) |
| Coal or Coke | 0 (0.0%) | 0 (0.0%) |
| All other Fuels | 0 (0.0%) | 0 (0.0%) |
| No Fuel Used | 0 (0.0%) | 0 (0.0%) |
| Total | 220 (100.0%) | 319 (100.0%) |
Household Vehicle Usage in Whiteville
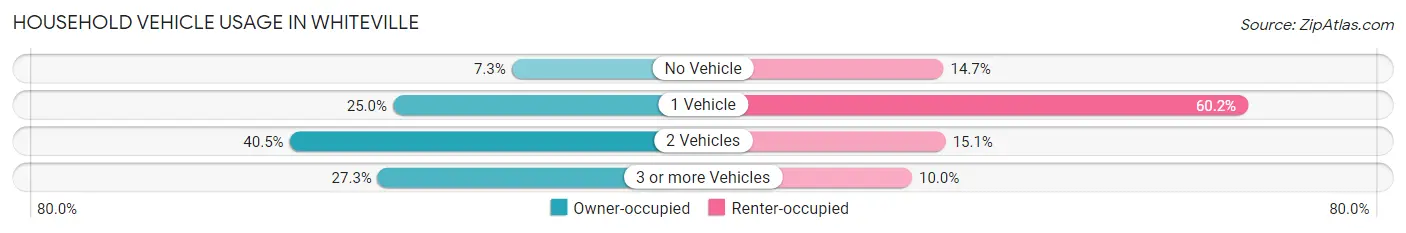
| Vehicles per Household | Owner-occupied | Renter-occupied |
| No Vehicle | 16 (7.3%) | 47 (14.7%) |
| 1 Vehicle | 55 (25.0%) | 192 (60.2%) |
| 2 Vehicles | 89 (40.5%) | 48 (15.0%) |
| 3 or more Vehicles | 60 (27.3%) | 32 (10.0%) |
| Total | 220 (100.0%) | 319 (100.0%) |
Real Estate & Mortgages in Whiteville
Real Estate and Mortgage Overview in Whiteville
| Characteristic | Without Mortgage | With Mortgage |
| Housing Units | 88 | 132 |
| Median Property Value | $73,800 | $95,000 |
| Median Household Income | $40,833 | $0 |
| Monthly Housing Costs | $355 | $0 |
| Real Estate Taxes | $558 | $0 |
Property Value by Mortgage Status in Whiteville
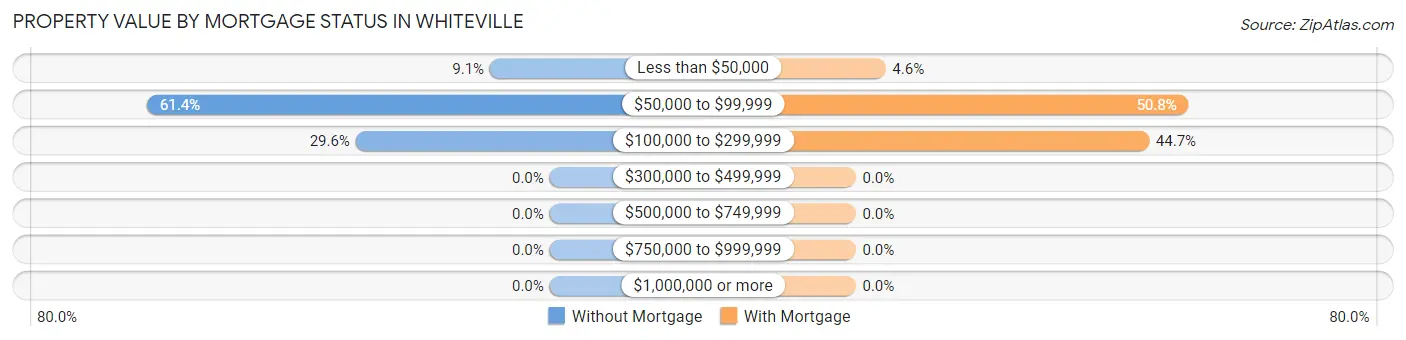
| Property Value | Without Mortgage | With Mortgage |
| Less than $50,000 | 8 (9.1%) | 6 (4.5%) |
| $50,000 to $99,999 | 54 (61.4%) | 67 (50.8%) |
| $100,000 to $299,999 | 26 (29.5%) | 59 (44.7%) |
| $300,000 to $499,999 | 0 (0.0%) | 0 (0.0%) |
| $500,000 to $749,999 | 0 (0.0%) | 0 (0.0%) |
| $750,000 to $999,999 | 0 (0.0%) | 0 (0.0%) |
| $1,000,000 or more | 0 (0.0%) | 0 (0.0%) |
| Total | 88 (100.0%) | 132 (100.0%) |
Household Income by Mortgage Status in Whiteville
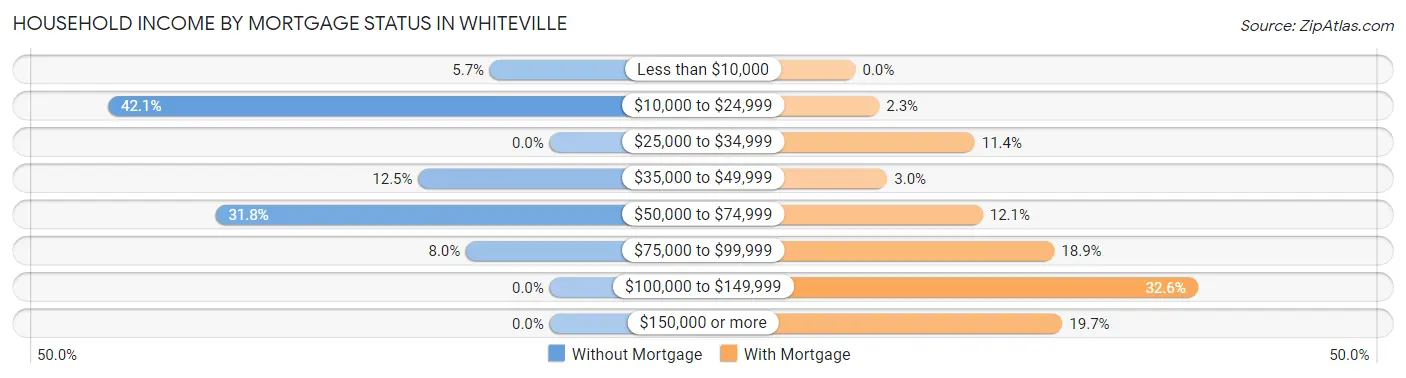
| Household Income | Without Mortgage | With Mortgage |
| Less than $10,000 | 5 (5.7%) | 0 (0.0%) |
| $10,000 to $24,999 | 37 (42.0%) | 3 (2.3%) |
| $25,000 to $34,999 | 0 (0.0%) | 15 (11.4%) |
| $35,000 to $49,999 | 11 (12.5%) | 4 (3.0%) |
| $50,000 to $74,999 | 28 (31.8%) | 16 (12.1%) |
| $75,000 to $99,999 | 7 (8.0%) | 25 (18.9%) |
| $100,000 to $149,999 | 0 (0.0%) | 43 (32.6%) |
| $150,000 or more | 0 (0.0%) | 26 (19.7%) |
| Total | 88 (100.0%) | 132 (100.0%) |
Property Value to Household Income Ratio in Whiteville
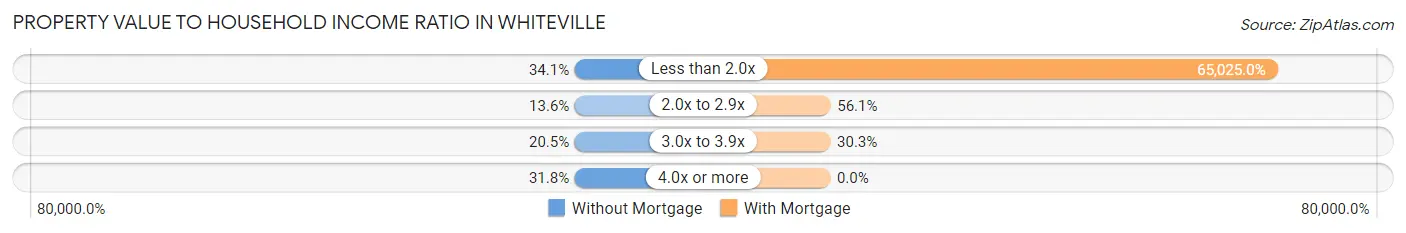
| Value-to-Income Ratio | Without Mortgage | With Mortgage |
| Less than 2.0x | 30 (34.1%) | 85,833 (65,025.0%) |
| 2.0x to 2.9x | 12 (13.6%) | 74 (56.1%) |
| 3.0x to 3.9x | 18 (20.4%) | 40 (30.3%) |
| 4.0x or more | 28 (31.8%) | 0 (0.0%) |
| Total | 88 (100.0%) | 132 (100.0%) |
Real Estate Taxes by Mortgage Status in Whiteville
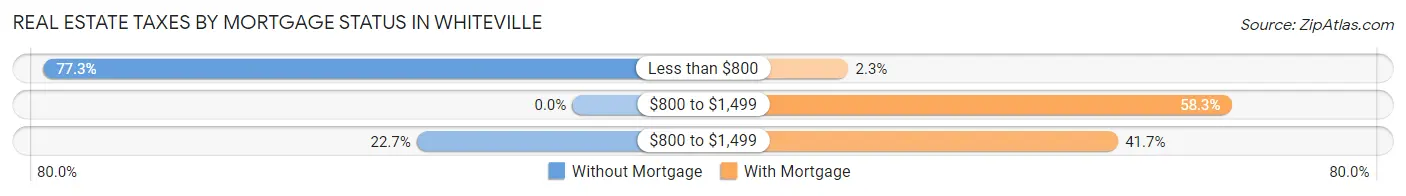
| Property Taxes | Without Mortgage | With Mortgage |
| Less than $800 | 68 (77.3%) | 3 (2.3%) |
| $800 to $1,499 | 0 (0.0%) | 77 (58.3%) |
| $800 to $1,499 | 20 (22.7%) | 55 (41.7%) |
| Total | 88 (100.0%) | 132 (100.0%) |
Health & Disability in Whiteville
Health Insurance Coverage by Age in Whiteville
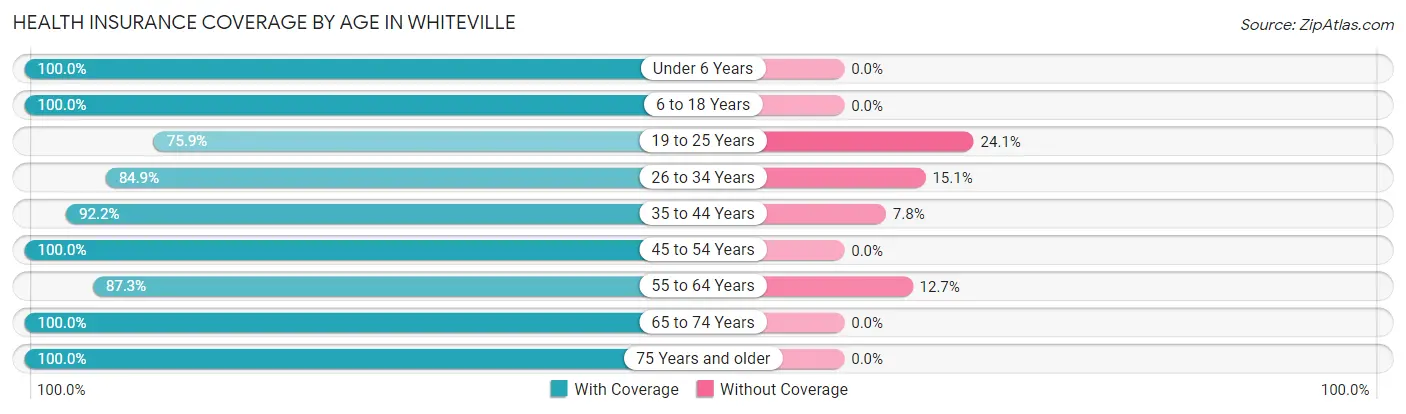
| Age Bracket | With Coverage | Without Coverage |
| Under 6 Years | 85 (100.0%) | 0 (0.0%) |
| 6 to 18 Years | 212 (100.0%) | 0 (0.0%) |
| 19 to 25 Years | 129 (75.9%) | 41 (24.1%) |
| 26 to 34 Years | 157 (84.9%) | 28 (15.1%) |
| 35 to 44 Years | 107 (92.2%) | 9 (7.8%) |
| 45 to 54 Years | 100 (100.0%) | 0 (0.0%) |
| 55 to 64 Years | 137 (87.3%) | 20 (12.7%) |
| 65 to 74 Years | 190 (100.0%) | 0 (0.0%) |
| 75 Years and older | 63 (100.0%) | 0 (0.0%) |
| Total | 1,180 (92.3%) | 98 (7.7%) |
Health Insurance Coverage by Citizenship Status in Whiteville
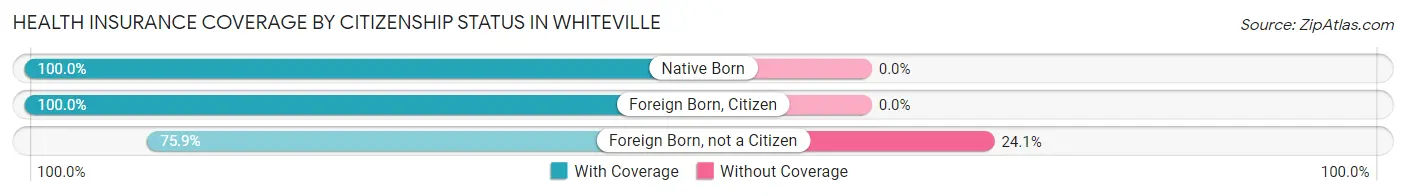
| Citizenship Status | With Coverage | Without Coverage |
| Native Born | 85 (100.0%) | 0 (0.0%) |
| Foreign Born, Citizen | 212 (100.0%) | 0 (0.0%) |
| Foreign Born, not a Citizen | 129 (75.9%) | 41 (24.1%) |
Health Insurance Coverage by Household Income in Whiteville
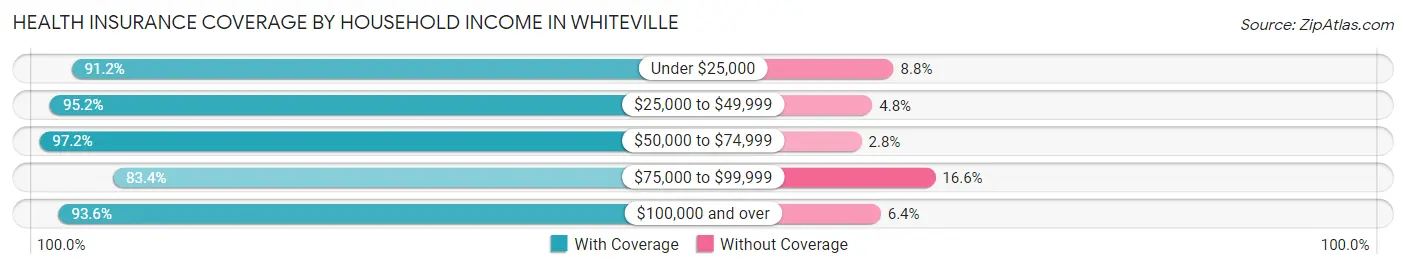
| Household Income | With Coverage | Without Coverage |
| Under $25,000 | 239 (91.2%) | 23 (8.8%) |
| $25,000 to $49,999 | 298 (95.2%) | 15 (4.8%) |
| $50,000 to $74,999 | 281 (97.2%) | 8 (2.8%) |
| $75,000 to $99,999 | 211 (83.4%) | 42 (16.6%) |
| $100,000 and over | 147 (93.6%) | 10 (6.4%) |
Public vs Private Health Insurance Coverage by Age in Whiteville
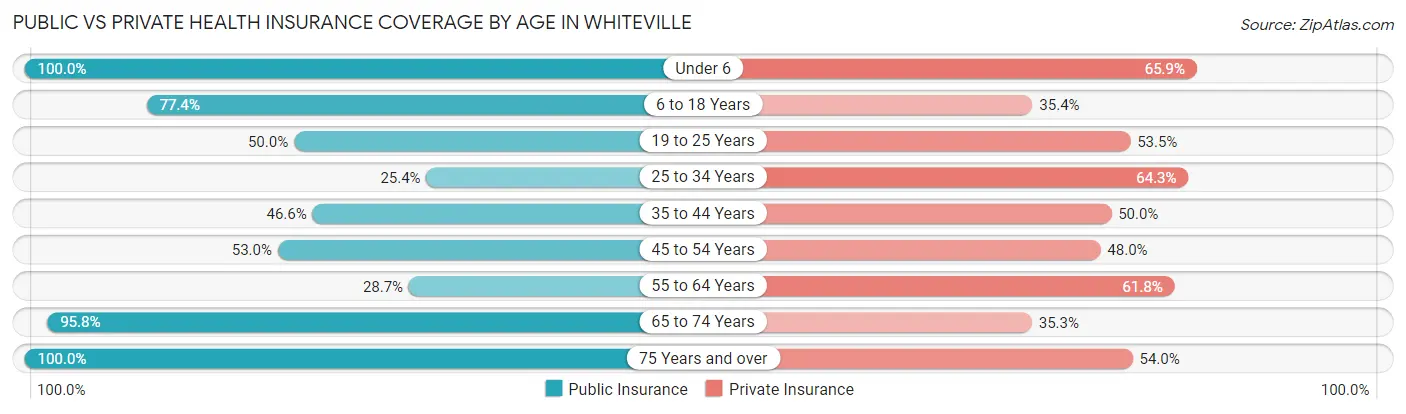
| Age Bracket | Public Insurance | Private Insurance |
| Under 6 | 85 (100.0%) | 56 (65.9%) |
| 6 to 18 Years | 164 (77.4%) | 75 (35.4%) |
| 19 to 25 Years | 85 (50.0%) | 91 (53.5%) |
| 25 to 34 Years | 47 (25.4%) | 119 (64.3%) |
| 35 to 44 Years | 54 (46.6%) | 58 (50.0%) |
| 45 to 54 Years | 53 (53.0%) | 48 (48.0%) |
| 55 to 64 Years | 45 (28.7%) | 97 (61.8%) |
| 65 to 74 Years | 182 (95.8%) | 67 (35.3%) |
| 75 Years and over | 63 (100.0%) | 34 (54.0%) |
| Total | 778 (60.9%) | 645 (50.5%) |
Disability Status by Sex by Age in Whiteville
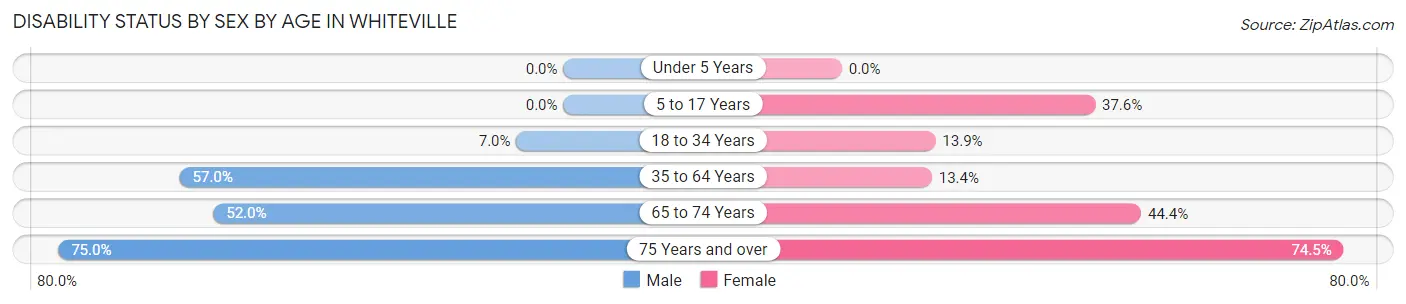
| Age Bracket | Male | Female |
| Under 5 Years | 0 (0.0%) | 0 (0.0%) |
| 5 to 17 Years | 0 (0.0%) | 44 (37.6%) |
| 18 to 34 Years | 12 (7.0%) | 26 (13.9%) |
| 35 to 64 Years | 106 (57.0%) | 25 (13.4%) |
| 65 to 74 Years | 66 (52.0%) | 28 (44.4%) |
| 75 Years and over | 9 (75.0%) | 38 (74.5%) |
Disability Class by Sex by Age in Whiteville
Disability Class: Hearing Difficulty
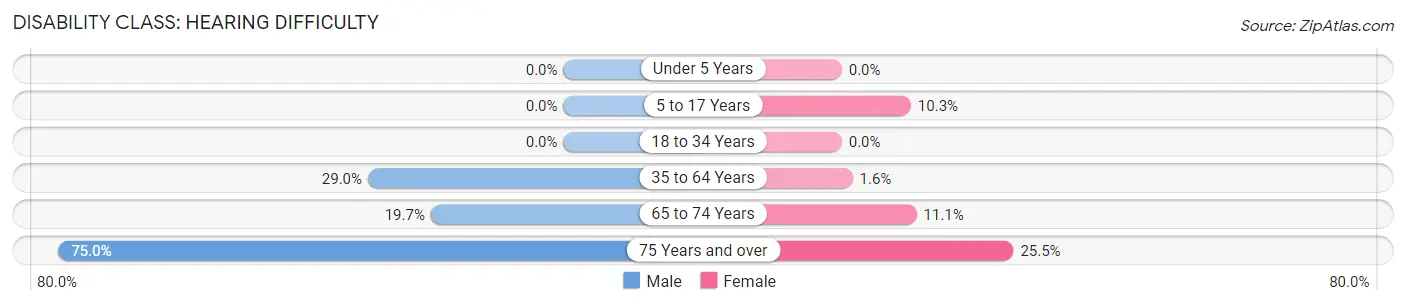
| Age Bracket | Male | Female |
| Under 5 Years | 0 (0.0%) | 0 (0.0%) |
| 5 to 17 Years | 0 (0.0%) | 12 (10.3%) |
| 18 to 34 Years | 0 (0.0%) | 0 (0.0%) |
| 35 to 64 Years | 54 (29.0%) | 3 (1.6%) |
| 65 to 74 Years | 25 (19.7%) | 7 (11.1%) |
| 75 Years and over | 9 (75.0%) | 13 (25.5%) |
Disability Class: Vision Difficulty
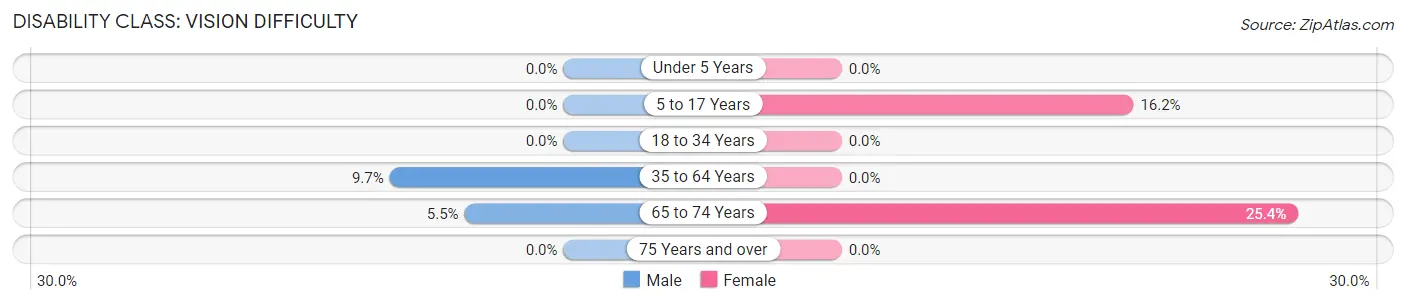
| Age Bracket | Male | Female |
| Under 5 Years | 0 (0.0%) | 0 (0.0%) |
| 5 to 17 Years | 0 (0.0%) | 19 (16.2%) |
| 18 to 34 Years | 0 (0.0%) | 0 (0.0%) |
| 35 to 64 Years | 18 (9.7%) | 0 (0.0%) |
| 65 to 74 Years | 7 (5.5%) | 16 (25.4%) |
| 75 Years and over | 0 (0.0%) | 0 (0.0%) |
Disability Class: Cognitive Difficulty
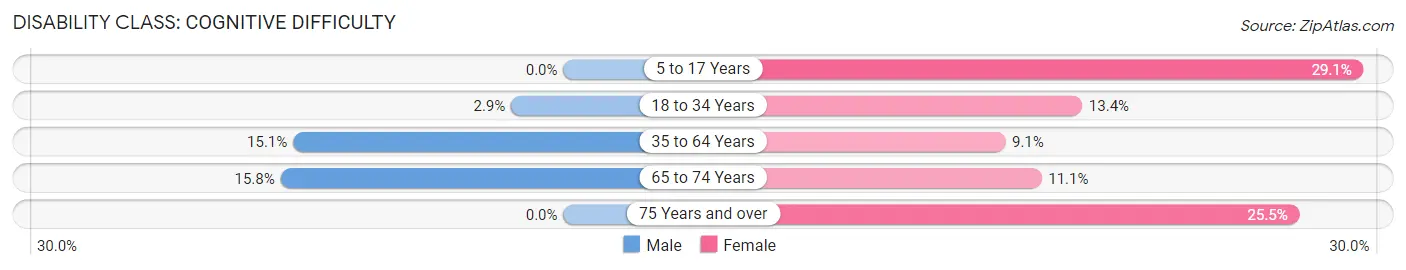
| Age Bracket | Male | Female |
| 5 to 17 Years | 0 (0.0%) | 34 (29.1%) |
| 18 to 34 Years | 5 (2.9%) | 25 (13.4%) |
| 35 to 64 Years | 28 (15.0%) | 17 (9.1%) |
| 65 to 74 Years | 20 (15.8%) | 7 (11.1%) |
| 75 Years and over | 0 (0.0%) | 13 (25.5%) |
Disability Class: Ambulatory Difficulty
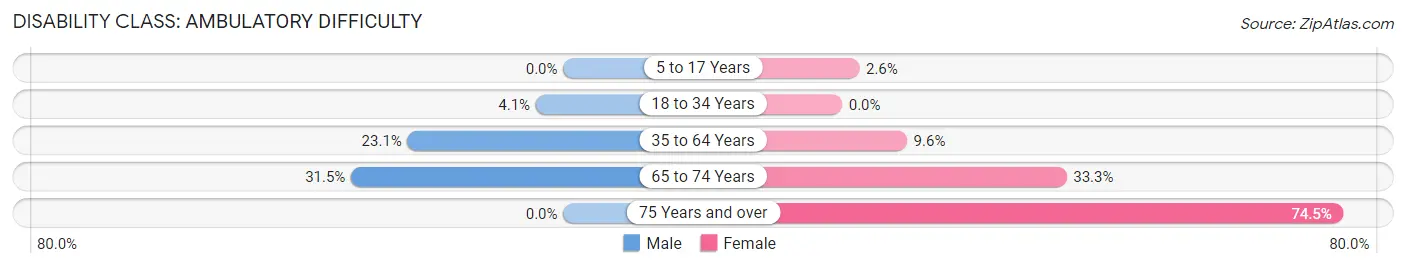
| Age Bracket | Male | Female |
| 5 to 17 Years | 0 (0.0%) | 3 (2.6%) |
| 18 to 34 Years | 7 (4.1%) | 0 (0.0%) |
| 35 to 64 Years | 43 (23.1%) | 18 (9.6%) |
| 65 to 74 Years | 40 (31.5%) | 21 (33.3%) |
| 75 Years and over | 0 (0.0%) | 38 (74.5%) |
Disability Class: Self-Care Difficulty
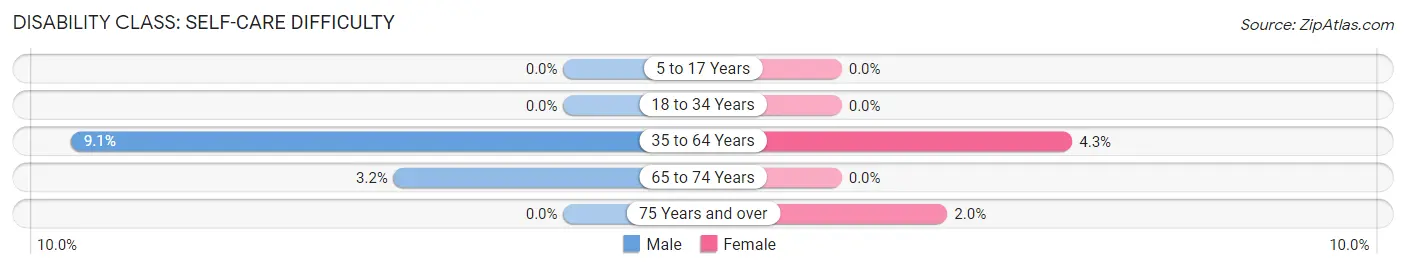
| Age Bracket | Male | Female |
| 5 to 17 Years | 0 (0.0%) | 0 (0.0%) |
| 18 to 34 Years | 0 (0.0%) | 0 (0.0%) |
| 35 to 64 Years | 17 (9.1%) | 8 (4.3%) |
| 65 to 74 Years | 4 (3.2%) | 0 (0.0%) |
| 75 Years and over | 0 (0.0%) | 1 (2.0%) |
Technology Access in Whiteville
Computing Device Access in Whiteville
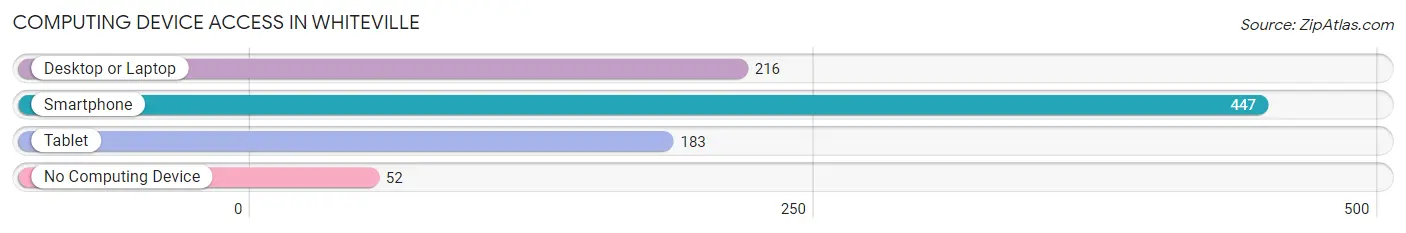
| Device Type | # Households | % Households |
| Desktop or Laptop | 216 | 40.1% |
| Smartphone | 447 | 82.9% |
| Tablet | 183 | 34.0% |
| No Computing Device | 52 | 9.7% |
| Total | 539 | 100.0% |
Internet Access in Whiteville
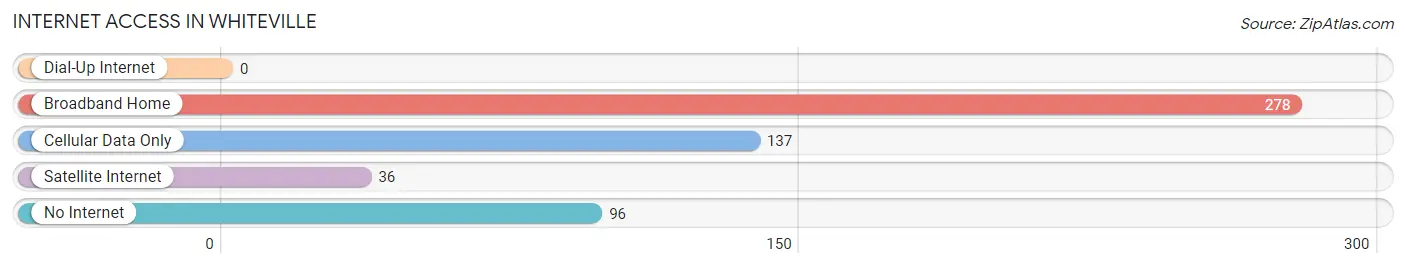
| Internet Type | # Households | % Households |
| Dial-Up Internet | 0 | 0.0% |
| Broadband Home | 278 | 51.6% |
| Cellular Data Only | 137 | 25.4% |
| Satellite Internet | 36 | 6.7% |
| No Internet | 96 | 17.8% |
| Total | 539 | 100.0% |
Whiteville Summary
Whiteville is a small town located in Hardeman County, Tennessee. It is situated in the northwest corner of the state, about 40 miles east of Memphis. The town was founded in 1871 and has a population of approximately 1,500 people.
History
Whiteville was founded in 1871 by a group of settlers from North Carolina. The town was named after the white clapboard houses that the settlers built. The town was originally a farming community, but it soon became a center for the timber industry. The town was also home to a number of sawmills and gristmills.
In the late 19th century, Whiteville was a thriving community with a population of over 1,000 people. The town had a number of stores, churches, and a school. The town also had a post office, a bank, and a newspaper.
In the early 20th century, the timber industry began to decline and the town's population began to decline as well. The Great Depression also had a negative impact on the town. In the 1940s, the town's population had dropped to just over 500 people.
Geography
Whiteville is located in the northwest corner of Hardeman County, Tennessee. The town is situated on the banks of the Hatchie River, which flows through the town. The town is surrounded by rolling hills and farmland. The town is located about 40 miles east of Memphis.
The climate in Whiteville is humid subtropical, with hot summers and mild winters. The average annual temperature is around 65 degrees Fahrenheit. The average annual precipitation is around 45 inches.
Economy
The economy of Whiteville is largely based on agriculture. The town is home to a number of farms, which produce a variety of crops, including corn, soybeans, cotton, and wheat. The town is also home to a number of small businesses, including restaurants, stores, and service providers.
The town is also home to a number of manufacturing companies, including a furniture factory and a plastics factory. The town is also home to a number of trucking companies, which provide transportation services to the surrounding area.
Demographics
As of the 2010 census, the population of Whiteville was 1,500 people. The racial makeup of the town was 95.3% White, 2.7% African American, 0.2% Native American, 0.2% Asian, and 1.6% from other races. The median household income was $31,250, and the median family income was $37,500.
The town is home to a number of churches, including Baptist, Methodist, and Presbyterian. The town is also home to a number of schools, including Whiteville Elementary School, Whiteville Middle School, and Whiteville High School.
Conclusion
Whiteville is a small town located in Hardeman County, Tennessee. The town was founded in 1871 and has a population of approximately 1,500 people. The town's economy is largely based on agriculture, and it is home to a number of small businesses, manufacturing companies, and trucking companies. The town is also home to a number of churches and schools.
Common Questions
What is Per Capita Income in Whiteville?
Per Capita income in Whiteville is $7,520.
What is the Median Family Income in Whiteville?
Median Family Income in Whiteville is $47,311.
What is the Median Household income in Whiteville?
Median Household Income in Whiteville is $46,138.
What is Income or Wage Gap in Whiteville?
Income or Wage Gap in Whiteville is 14.5%.
Women in Whiteville earn 85.5 cents for every dollar earned by a man.
What is Inequality or Gini Index in Whiteville?
Inequality or Gini Index in Whiteville is 0.37.
What is the Total Population of Whiteville?
Total Population of Whiteville is 4,734.
What is the Total Male Population of Whiteville?
Total Male Population of Whiteville is 4,068.
What is the Total Female Population of Whiteville?
Total Female Population of Whiteville is 666.
What is the Ratio of Males per 100 Females in Whiteville?
There are 610.81 Males per 100 Females in Whiteville.
What is the Ratio of Females per 100 Males in Whiteville?
There are 16.37 Females per 100 Males in Whiteville.
What is the Median Population Age in Whiteville?
Median Population Age in Whiteville is 39.4 Years.
What is the Average Family Size in Whiteville
Average Family Size in Whiteville is 3.0 People.
What is the Average Household Size in Whiteville
Average Household Size in Whiteville is 2.4 People.
How Large is the Labor Force in Whiteville?
There are 549 People in the Labor Forcein in Whiteville.
What is the Percentage of People in the Labor Force in Whiteville?
12.3% of People are in the Labor Force in Whiteville.
What is the Unemployment Rate in Whiteville?
Unemployment Rate in Whiteville is 11.7%.