Zip Codes with the Highest Percentage of Population Employed in Security & Protection in Morristown, TN
RELATED REPORTS & OPTIONS
Security & Protection
Morristown
Compare Zip Codes
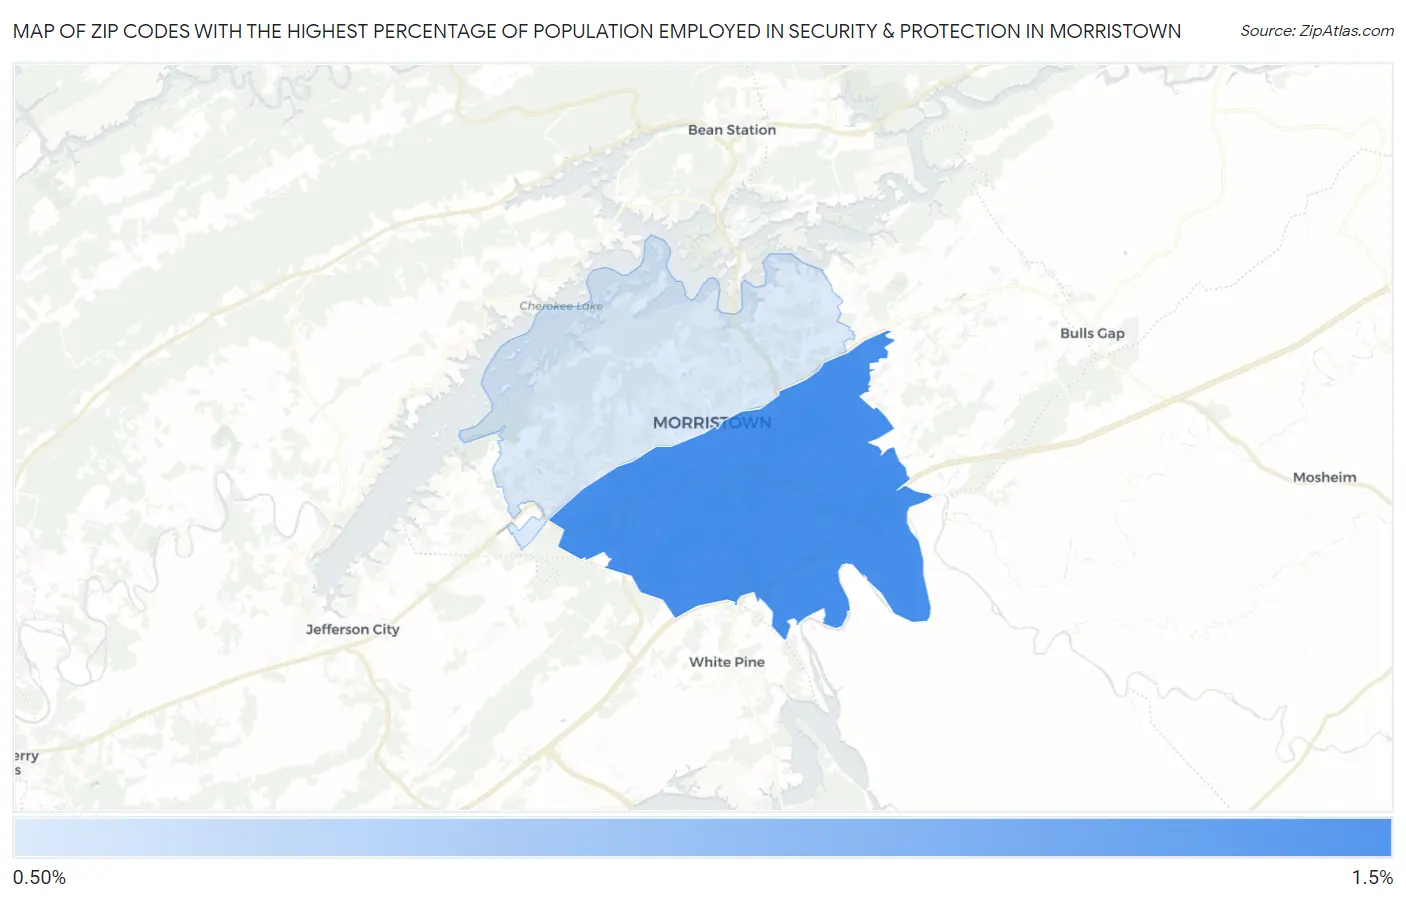
Map of Zip Codes with the Highest Percentage of Population Employed in Security & Protection in Morristown
0.54%
1.4%
Zip Codes with the Highest Percentage of Population Employed in Security & Protection in Morristown, TN
| Zip Code | % Employed | vs State | vs National | |
| 1. | 37813 | 1.4% | 2.1%(-0.716)#348 | 2.1%(-0.771)#17,118 |
| 2. | 37814 | 0.54% | 2.1%(-1.56)#461 | 2.1%(-1.61)#23,028 |
1
Common Questions
What are the Top Zip Codes with the Highest Percentage of Population Employed in Security & Protection in Morristown, TN?
Top Zip Codes with the Highest Percentage of Population Employed in Security & Protection in Morristown, TN are:
What zip code has the Highest Percentage of Population Employed in Security & Protection in Morristown, TN?
37813 has the Highest Percentage of Population Employed in Security & Protection in Morristown, TN with 1.4%.
What is the Percentage of Population Employed in Security & Protection in Morristown, TN?
Percentage of Population Employed in Security & Protection in Morristown is 1.1%.
What is the Percentage of Population Employed in Security & Protection in Tennessee?
Percentage of Population Employed in Security & Protection in Tennessee is 2.1%.
What is the Percentage of Population Employed in Security & Protection in the United States?
Percentage of Population Employed in Security & Protection in the United States is 2.1%.