Zip Codes with the Highest Percentage of Population Employed in Security & Protection in Tennessee
RELATED REPORTS & OPTIONS
Security & Protection
Tennessee
Compare Zip Codes
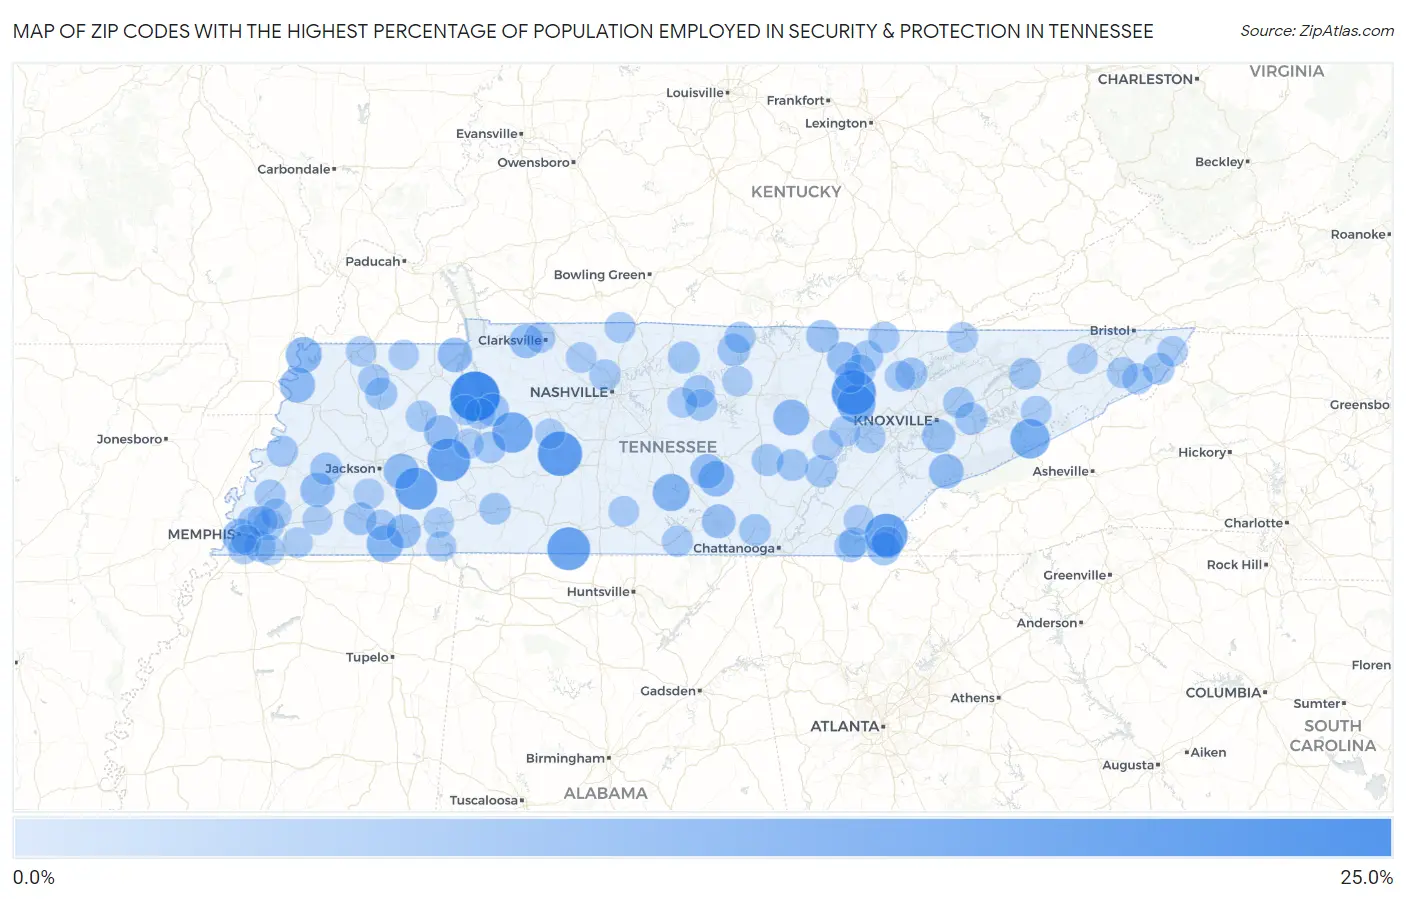
Map of Zip Codes with the Highest Percentage of Population Employed in Security & Protection in Tennessee
0.0%
25.0%
Zip Codes with the Highest Percentage of Population Employed in Security & Protection in Tennessee
| Zip Code | % Employed | vs State | vs National | |
| 1. | 38333 | 22.6% | 2.1%(+20.5)#1 | 2.1%(+20.4)#155 |
| 2. | 38487 | 17.4% | 2.1%(+15.3)#2 | 2.1%(+15.3)#271 |
| 3. | 37770 | 17.4% | 2.1%(+15.3)#3 | 2.1%(+15.3)#272 |
| 4. | 38473 | 16.0% | 2.1%(+13.9)#4 | 2.1%(+13.8)#320 |
| 5. | 37333 | 15.8% | 2.1%(+13.7)#5 | 2.1%(+13.6)#328 |
| 6. | 38328 | 15.7% | 2.1%(+13.6)#6 | 2.1%(+13.5)#332 |
| 7. | 38347 | 15.2% | 2.1%(+13.1)#7 | 2.1%(+13.0)#355 |
| 8. | 37140 | 13.5% | 2.1%(+11.4)#8 | 2.1%(+11.4)#442 |
| 9. | 37753 | 12.6% | 2.1%(+10.5)#9 | 2.1%(+10.4)#500 |
| 10. | 37887 | 11.5% | 2.1%(+9.46)#10 | 2.1%(+9.40)#593 |
| 11. | 37360 | 10.4% | 2.1%(+8.30)#11 | 2.1%(+8.24)#724 |
| 12. | 38061 | 9.8% | 2.1%(+7.71)#12 | 2.1%(+7.66)#794 |
| 13. | 38079 | 9.2% | 2.1%(+7.13)#13 | 2.1%(+7.08)#873 |
| 14. | 38578 | 9.1% | 2.1%(+7.00)#14 | 2.1%(+6.94)#895 |
| 15. | 37394 | 8.7% | 2.1%(+6.60)#15 | 2.1%(+6.55)#970 |
| 16. | 38080 | 8.5% | 2.1%(+6.36)#16 | 2.1%(+6.31)#1,024 |
| 17. | 38313 | 8.4% | 2.1%(+6.35)#17 | 2.1%(+6.30)#1,028 |
| 18. | 38126 | 8.4% | 2.1%(+6.27)#18 | 2.1%(+6.22)#1,055 |
| 19. | 37882 | 8.0% | 2.1%(+5.90)#19 | 2.1%(+5.84)#1,173 |
| 20. | 38222 | 7.8% | 2.1%(+5.71)#20 | 2.1%(+5.65)#1,240 |
| 21. | 38387 | 7.8% | 2.1%(+5.68)#21 | 2.1%(+5.63)#1,248 |
| 22. | 38069 | 7.7% | 2.1%(+5.64)#22 | 2.1%(+5.59)#1,257 |
| 23. | 37357 | 7.6% | 2.1%(+5.51)#23 | 2.1%(+5.45)#1,296 |
| 24. | 38375 | 7.3% | 2.1%(+5.24)#24 | 2.1%(+5.18)#1,388 |
| 25. | 37356 | 7.2% | 2.1%(+5.09)#25 | 2.1%(+5.03)#1,452 |
| 26. | 37191 | 7.1% | 2.1%(+4.97)#26 | 2.1%(+4.91)#1,509 |
| 27. | 38504 | 7.0% | 2.1%(+4.91)#27 | 2.1%(+4.85)#1,530 |
| 28. | 37853 | 6.9% | 2.1%(+4.78)#28 | 2.1%(+4.73)#1,591 |
| 29. | 37326 | 6.5% | 2.1%(+4.39)#29 | 2.1%(+4.33)#1,791 |
| 30. | 37185 | 6.4% | 2.1%(+4.26)#30 | 2.1%(+4.21)#1,856 |
| 31. | 38008 | 6.1% | 2.1%(+3.99)#31 | 2.1%(+3.93)#2,029 |
| 32. | 38577 | 6.0% | 2.1%(+3.95)#32 | 2.1%(+3.89)#2,052 |
| 33. | 38588 | 6.0% | 2.1%(+3.88)#33 | 2.1%(+3.82)#2,100 |
| 34. | 38128 | 5.7% | 2.1%(+3.59)#34 | 2.1%(+3.54)#2,293 |
| 35. | 38012 | 5.6% | 2.1%(+3.55)#35 | 2.1%(+3.50)#2,328 |
| 36. | 37764 | 5.5% | 2.1%(+3.42)#36 | 2.1%(+3.37)#2,443 |
| 37. | 37757 | 5.5% | 2.1%(+3.41)#37 | 2.1%(+3.35)#2,456 |
| 38. | 37332 | 5.5% | 2.1%(+3.40)#38 | 2.1%(+3.34)#2,461 |
| 39. | 38547 | 5.5% | 2.1%(+3.38)#39 | 2.1%(+3.32)#2,476 |
| 40. | 37391 | 5.5% | 2.1%(+3.37)#40 | 2.1%(+3.31)#2,484 |
| 41. | 37074 | 5.4% | 2.1%(+3.34)#41 | 2.1%(+3.28)#2,511 |
| 42. | 38585 | 5.4% | 2.1%(+3.33)#42 | 2.1%(+3.28)#2,516 |
| 43. | 38230 | 5.3% | 2.1%(+3.24)#43 | 2.1%(+3.19)#2,597 |
| 44. | 37367 | 5.3% | 2.1%(+3.18)#44 | 2.1%(+3.12)#2,653 |
| 45. | 37891 | 5.2% | 2.1%(+3.13)#45 | 2.1%(+3.07)#2,697 |
| 46. | 37012 | 5.2% | 2.1%(+3.09)#46 | 2.1%(+3.04)#2,723 |
| 47. | 37640 | 5.1% | 2.1%(+3.05)#47 | 2.1%(+2.99)#2,770 |
| 48. | 37397 | 5.1% | 2.1%(+3.04)#48 | 2.1%(+2.99)#2,773 |
| 49. | 38485 | 5.1% | 2.1%(+3.01)#49 | 2.1%(+2.96)#2,803 |
| 50. | 37755 | 5.0% | 2.1%(+2.88)#50 | 2.1%(+2.83)#2,952 |
| 51. | 37362 | 4.9% | 2.1%(+2.85)#51 | 2.1%(+2.79)#2,993 |
| 52. | 38255 | 4.9% | 2.1%(+2.83)#52 | 2.1%(+2.77)#3,021 |
| 53. | 37097 | 4.9% | 2.1%(+2.78)#53 | 2.1%(+2.72)#3,085 |
| 54. | 37189 | 4.9% | 2.1%(+2.77)#54 | 2.1%(+2.71)#3,095 |
| 55. | 37892 | 4.8% | 2.1%(+2.76)#55 | 2.1%(+2.70)#3,110 |
| 56. | 37852 | 4.8% | 2.1%(+2.71)#56 | 2.1%(+2.65)#3,176 |
| 57. | 38115 | 4.7% | 2.1%(+2.65)#57 | 2.1%(+2.60)#3,241 |
| 58. | 38575 | 4.7% | 2.1%(+2.63)#58 | 2.1%(+2.57)#3,270 |
| 59. | 37806 | 4.7% | 2.1%(+2.62)#59 | 2.1%(+2.56)#3,286 |
| 60. | 38063 | 4.7% | 2.1%(+2.61)#60 | 2.1%(+2.56)#3,296 |
| 61. | 38344 | 4.7% | 2.1%(+2.56)#61 | 2.1%(+2.50)#3,364 |
| 62. | 37763 | 4.6% | 2.1%(+2.50)#62 | 2.1%(+2.45)#3,456 |
| 63. | 37306 | 4.6% | 2.1%(+2.47)#63 | 2.1%(+2.42)#3,494 |
| 64. | 38116 | 4.5% | 2.1%(+2.44)#64 | 2.1%(+2.39)#3,554 |
| 65. | 37682 | 4.5% | 2.1%(+2.43)#65 | 2.1%(+2.37)#3,584 |
| 66. | 38133 | 4.5% | 2.1%(+2.38)#66 | 2.1%(+2.33)#3,647 |
| 67. | 37141 | 4.4% | 2.1%(+2.34)#67 | 2.1%(+2.28)#3,722 |
| 68. | 37134 | 4.4% | 2.1%(+2.32)#68 | 2.1%(+2.27)#3,749 |
| 69. | 38004 | 4.4% | 2.1%(+2.27)#69 | 2.1%(+2.22)#3,831 |
| 70. | 37872 | 4.4% | 2.1%(+2.27)#70 | 2.1%(+2.22)#3,835 |
| 71. | 37658 | 4.3% | 2.1%(+2.24)#71 | 2.1%(+2.19)#3,880 |
| 72. | 37843 | 4.3% | 2.1%(+2.20)#72 | 2.1%(+2.15)#3,954 |
| 73. | 37724 | 4.3% | 2.1%(+2.17)#73 | 2.1%(+2.11)#4,001 |
| 74. | 38002 | 4.3% | 2.1%(+2.17)#74 | 2.1%(+2.11)#4,007 |
| 75. | 37042 | 4.2% | 2.1%(+2.15)#75 | 2.1%(+2.09)#4,041 |
| 76. | 37714 | 4.2% | 2.1%(+2.07)#76 | 2.1%(+2.02)#4,182 |
| 77. | 37146 | 4.2% | 2.1%(+2.07)#77 | 2.1%(+2.02)#4,191 |
| 78. | 38257 | 4.1% | 2.1%(+2.05)#78 | 2.1%(+2.00)#4,218 |
| 79. | 38135 | 4.1% | 2.1%(+2.05)#79 | 2.1%(+1.99)#4,225 |
| 80. | 38044 | 4.1% | 2.1%(+2.03)#80 | 2.1%(+1.98)#4,257 |
| 81. | 37854 | 4.1% | 2.1%(+2.02)#81 | 2.1%(+1.96)#4,280 |
| 82. | 37656 | 4.1% | 2.1%(+1.98)#82 | 2.1%(+1.92)#4,358 |
| 83. | 37144 | 4.1% | 2.1%(+1.97)#83 | 2.1%(+1.92)#4,362 |
| 84. | 37683 | 4.0% | 2.1%(+1.93)#84 | 2.1%(+1.88)#4,435 |
| 85. | 37337 | 3.9% | 2.1%(+1.83)#85 | 2.1%(+1.78)#4,631 |
| 86. | 37361 | 3.9% | 2.1%(+1.81)#86 | 2.1%(+1.76)#4,673 |
| 87. | 38066 | 3.9% | 2.1%(+1.78)#87 | 2.1%(+1.73)#4,733 |
| 88. | 38320 | 3.9% | 2.1%(+1.78)#88 | 2.1%(+1.72)#4,754 |
| 89. | 38114 | 3.9% | 2.1%(+1.77)#89 | 2.1%(+1.72)#4,761 |
| 90. | 38241 | 3.9% | 2.1%(+1.77)#90 | 2.1%(+1.71)#4,776 |
| 91. | 38327 | 3.9% | 2.1%(+1.77)#91 | 2.1%(+1.71)#4,780 |
| 92. | 38356 | 3.9% | 2.1%(+1.76)#92 | 2.1%(+1.70)#4,798 |
| 93. | 38545 | 3.9% | 2.1%(+1.76)#93 | 2.1%(+1.70)#4,803 |
| 94. | 38380 | 3.8% | 2.1%(+1.72)#94 | 2.1%(+1.67)#4,874 |
| 95. | 37184 | 3.8% | 2.1%(+1.71)#95 | 2.1%(+1.66)#4,890 |
| 96. | 37325 | 3.8% | 2.1%(+1.70)#96 | 2.1%(+1.64)#4,926 |
| 97. | 37098 | 3.8% | 2.1%(+1.67)#97 | 2.1%(+1.61)#5,001 |
| 98. | 38068 | 3.8% | 2.1%(+1.67)#98 | 2.1%(+1.61)#5,009 |
| 99. | 38326 | 3.8% | 2.1%(+1.66)#99 | 2.1%(+1.60)#5,021 |
| 100. | 38125 | 3.7% | 2.1%(+1.65)#100 | 2.1%(+1.60)#5,042 |
Common Questions
What are the Top 10 Zip Codes with the Highest Percentage of Population Employed in Security & Protection in Tennessee?
Top 10 Zip Codes with the Highest Percentage of Population Employed in Security & Protection in Tennessee are:
What zip code has the Highest Percentage of Population Employed in Security & Protection in Tennessee?
38333 has the Highest Percentage of Population Employed in Security & Protection in Tennessee with 22.6%.
What is the Percentage of Population Employed in Security & Protection in the State of Tennessee?
Percentage of Population Employed in Security & Protection in Tennessee is 2.1%.
What is the Percentage of Population Employed in Security & Protection in the United States?
Percentage of Population Employed in Security & Protection in the United States is 2.1%.