Blountville, TN Map & Demographics
Blountville Map
Blountville Overview
$25,216
PER CAPITA INCOME
$77,245
AVG FAMILY INCOME
$63,487
AVG HOUSEHOLD INCOME
38.2%
WAGE / INCOME GAP [ % ]
61.8¢/ $1
WAGE / INCOME GAP [ $ ]
$3,591
FAMILY INCOME DEFICIT
0.34
INEQUALITY / GINI INDEX
3,265
TOTAL POPULATION
1,866
MALE POPULATION
1,399
FEMALE POPULATION
133.38
MALES / 100 FEMALES
74.97
FEMALES / 100 MALES
43.2
MEDIAN AGE
2.7
AVG FAMILY SIZE
2.3
AVG HOUSEHOLD SIZE
1,375
LABOR FORCE [ PEOPLE ]
46.8%
PERCENT IN LABOR FORCE
6.5%
UNEMPLOYMENT RATE
Blountville Zip Codes
Blountville Area Codes
Income in Blountville
Income Overview in Blountville
Per Capita Income in Blountville is $25,216, while median incomes of families and households are $77,245 and $63,487 respectively.
| Characteristic | Number | Measure |
| Per Capita Income | 3,265 | $25,216 |
| Median Family Income | 768 | $77,245 |
| Mean Family Income | 768 | $79,919 |
| Median Household Income | 1,073 | $63,487 |
| Mean Household Income | 1,073 | $67,696 |
| Income Deficit | 768 | $3,591 |
| Wage / Income Gap (%) | 3,265 | 38.24% |
| Wage / Income Gap ($) | 3,265 | 61.76¢ per $1 |
| Gini / Inequality Index | 3,265 | 0.34 |
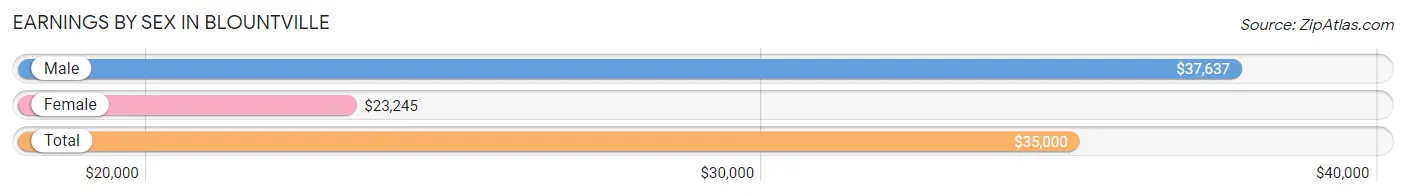
Earnings by Sex in Blountville
Average Earnings in Blountville are $35,000, $37,637 for men and $23,245 for women, a difference of 38.2%.
| Sex | Number | Average Earnings |
| Male | 972 (56.4%) | $37,637 |
| Female | 752 (43.6%) | $23,245 |
| Total | 1,724 (100.0%) | $35,000 |
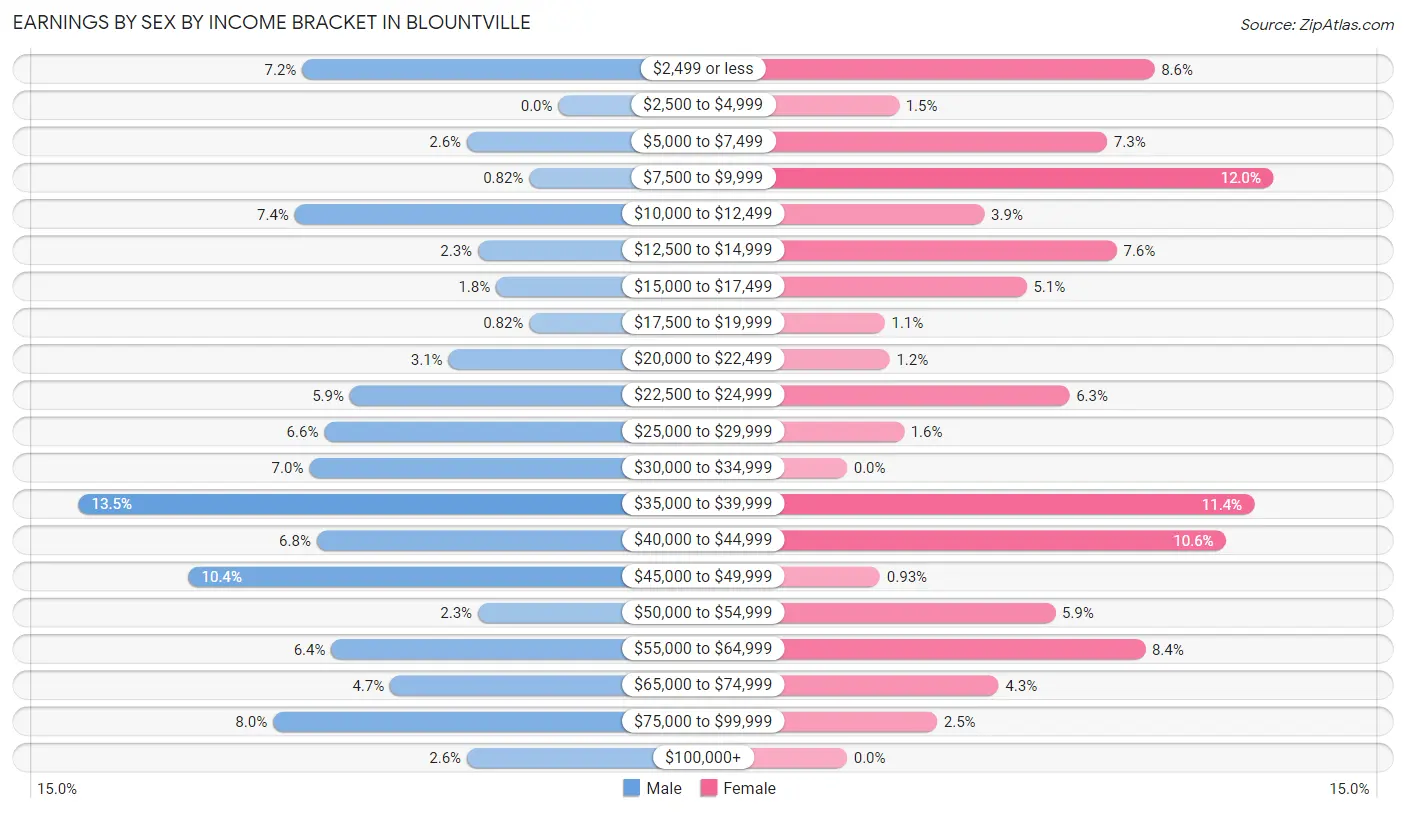
Earnings by Sex by Income Bracket in Blountville
The most common earnings brackets in Blountville are $35,000 to $39,999 for men (131 | 13.5%) and $7,500 to $9,999 for women (90 | 12.0%).
| Income | Male | Female |
| $2,499 or less | 70 (7.2%) | 65 (8.6%) |
| $2,500 to $4,999 | 0 (0.0%) | 11 (1.5%) |
| $5,000 to $7,499 | 25 (2.6%) | 55 (7.3%) |
| $7,500 to $9,999 | 8 (0.8%) | 90 (12.0%) |
| $10,000 to $12,499 | 72 (7.4%) | 29 (3.9%) |
| $12,500 to $14,999 | 22 (2.3%) | 57 (7.6%) |
| $15,000 to $17,499 | 17 (1.8%) | 38 (5.1%) |
| $17,500 to $19,999 | 8 (0.8%) | 8 (1.1%) |
| $20,000 to $22,499 | 30 (3.1%) | 9 (1.2%) |
| $22,500 to $24,999 | 57 (5.9%) | 47 (6.2%) |
| $25,000 to $29,999 | 64 (6.6%) | 12 (1.6%) |
| $30,000 to $34,999 | 68 (7.0%) | 0 (0.0%) |
| $35,000 to $39,999 | 131 (13.5%) | 86 (11.4%) |
| $40,000 to $44,999 | 66 (6.8%) | 80 (10.6%) |
| $45,000 to $49,999 | 101 (10.4%) | 7 (0.9%) |
| $50,000 to $54,999 | 22 (2.3%) | 44 (5.9%) |
| $55,000 to $64,999 | 62 (6.4%) | 63 (8.4%) |
| $65,000 to $74,999 | 46 (4.7%) | 32 (4.3%) |
| $75,000 to $99,999 | 78 (8.0%) | 19 (2.5%) |
| $100,000+ | 25 (2.6%) | 0 (0.0%) |
| Total | 972 (100.0%) | 752 (100.0%) |
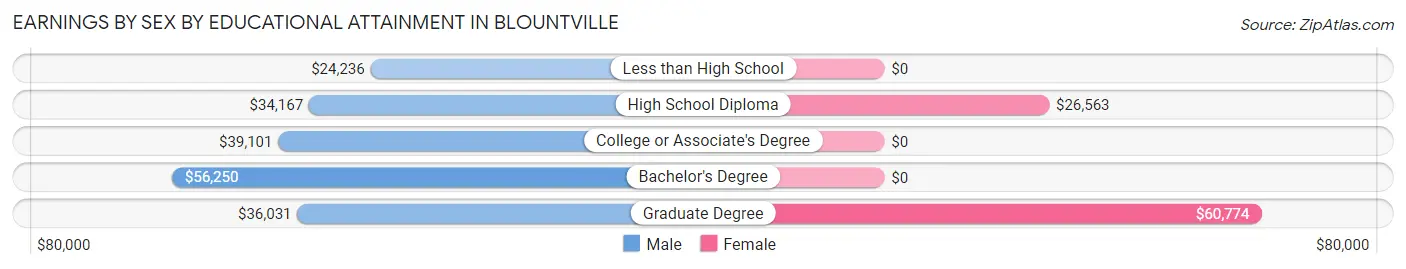
Earnings by Sex by Educational Attainment in Blountville
Average earnings in Blountville are $38,613 for men and $25,938 for women, a difference of 32.8%. Men with an educational attainment of bachelor's degree enjoy the highest average annual earnings of $56,250, while those with less than high school education earn the least with $24,236. Women with an educational attainment of graduate degree earn the most with the average annual earnings of $60,774, while those with high school diploma education have the smallest earnings of $26,563.
| Educational Attainment | Male Income | Female Income |
| Less than High School | $24,236 | $0 |
| High School Diploma | $34,167 | $26,563 |
| College or Associate's Degree | $39,101 | $0 |
| Bachelor's Degree | $56,250 | $0 |
| Graduate Degree | $36,031 | $60,774 |
| Total | $38,613 | $25,938 |
Family Income in Blountville
Family Income Brackets in Blountville
According to the Blountville family income data, there are 216 families falling into the $100,000 to $149,999 income range, which is the most common income bracket and makes up 28.1% of all families.
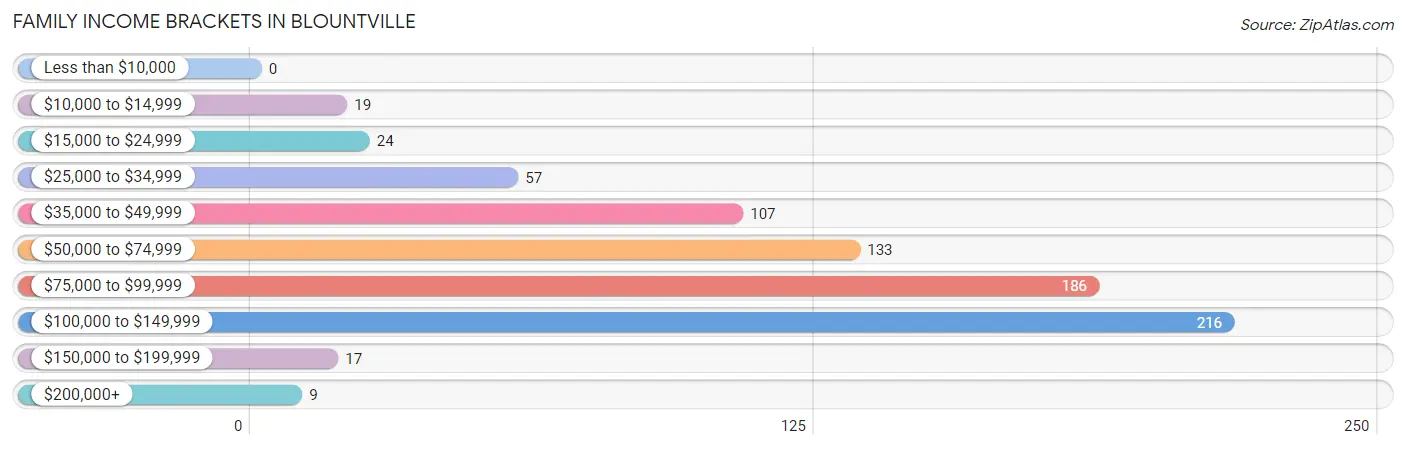
| Income Bracket | # Families | % Families |
| Less than $10,000 | 0 | 0.0% |
| $10,000 to $14,999 | 19 | 2.5% |
| $15,000 to $24,999 | 24 | 3.1% |
| $25,000 to $34,999 | 57 | 7.4% |
| $35,000 to $49,999 | 107 | 13.9% |
| $50,000 to $74,999 | 133 | 17.3% |
| $75,000 to $99,999 | 186 | 24.2% |
| $100,000 to $149,999 | 216 | 28.1% |
| $150,000 to $199,999 | 17 | 2.2% |
| $200,000+ | 9 | 1.2% |
Family Income by Famaliy Size in Blountville
4-person families (102 | 13.3%) account for the highest median family income in Blountville with $119,911 per family, while 2-person families (523 | 68.1%) have the highest median income of $34,097 per family member.
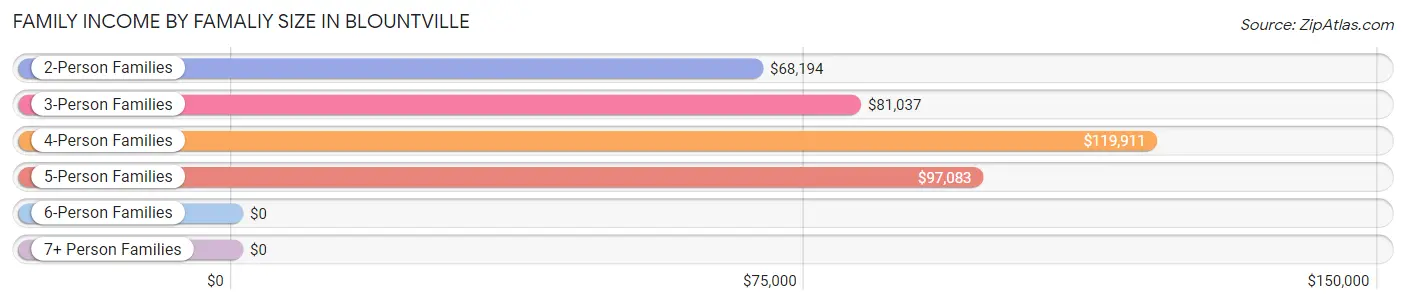
| Income Bracket | # Families | Median Income |
| 2-Person Families | 523 (68.1%) | $68,194 |
| 3-Person Families | 117 (15.2%) | $81,037 |
| 4-Person Families | 102 (13.3%) | $119,911 |
| 5-Person Families | 19 (2.5%) | $97,083 |
| 6-Person Families | 7 (0.9%) | $0 |
| 7+ Person Families | 0 (0.0%) | $0 |
| Total | 768 (100.0%) | $77,245 |
Family Income by Number of Earners in Blountville
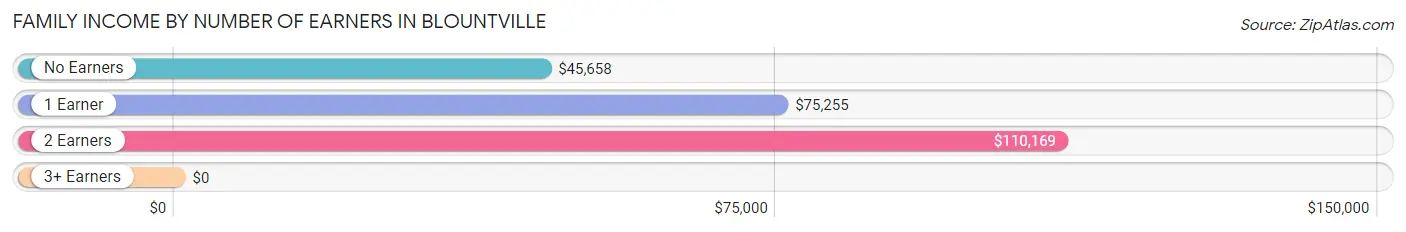
| Number of Earners | # Families | Median Income |
| No Earners | 114 (14.8%) | $45,658 |
| 1 Earner | 248 (32.3%) | $75,255 |
| 2 Earners | 352 (45.8%) | $110,169 |
| 3+ Earners | 54 (7.0%) | $0 |
| Total | 768 (100.0%) | $77,245 |
Household Income in Blountville
Household Income Brackets in Blountville
With 223 households falling in the category, the $100,000 to $149,999 income range is the most frequent in Blountville, accounting for 20.8% of all households. In contrast, only 9 households (0.8%) fall into the $200,000+ income bracket, making it the least populous group.
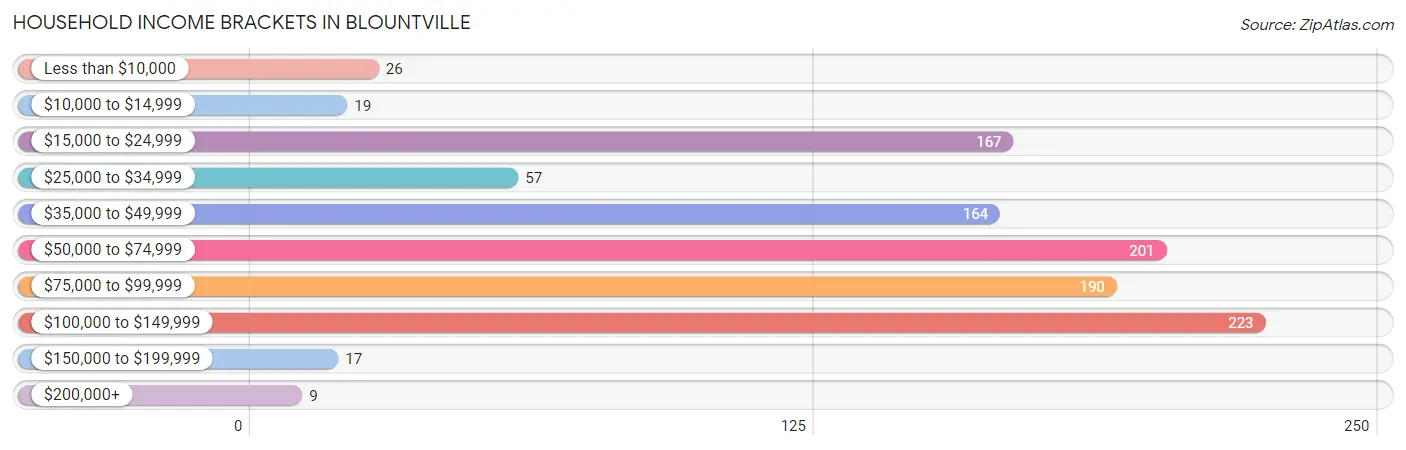
| Income Bracket | # Households | % Households |
| Less than $10,000 | 26 | 2.4% |
| $10,000 to $14,999 | 19 | 1.8% |
| $15,000 to $24,999 | 167 | 15.6% |
| $25,000 to $34,999 | 57 | 5.3% |
| $35,000 to $49,999 | 164 | 15.3% |
| $50,000 to $74,999 | 201 | 18.7% |
| $75,000 to $99,999 | 190 | 17.7% |
| $100,000 to $149,999 | 223 | 20.8% |
| $150,000 to $199,999 | 17 | 1.6% |
| $200,000+ | 9 | 0.8% |
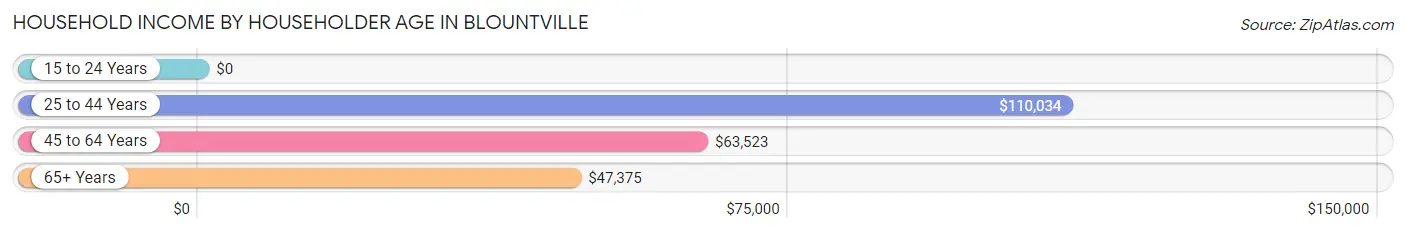
Household Income by Householder Age in Blountville
The median household income in Blountville is $63,487, with the highest median household income of $110,034 found in the 25 to 44 years age bracket for the primary householder. A total of 270 households (25.2%) fall into this category. Meanwhile, the 15 to 24 years age bracket for the primary householder has the lowest median household income of $0, with 11 households (1.0%) in this group.
| Income Bracket | # Households | Median Income |
| 15 to 24 Years | 11 (1.0%) | $0 |
| 25 to 44 Years | 270 (25.2%) | $110,034 |
| 45 to 64 Years | 457 (42.6%) | $63,523 |
| 65+ Years | 335 (31.2%) | $47,375 |
| Total | 1,073 (100.0%) | $63,487 |
Poverty in Blountville
Income Below Poverty by Sex and Age in Blountville
With 4.0% poverty level for males and 10.1% for females among the residents of Blountville, 75 year old and over males and 25 to 34 year old females are the most vulnerable to poverty, with 8 males (18.2%) and 47 females (18.9%) in their respective age groups living below the poverty level.
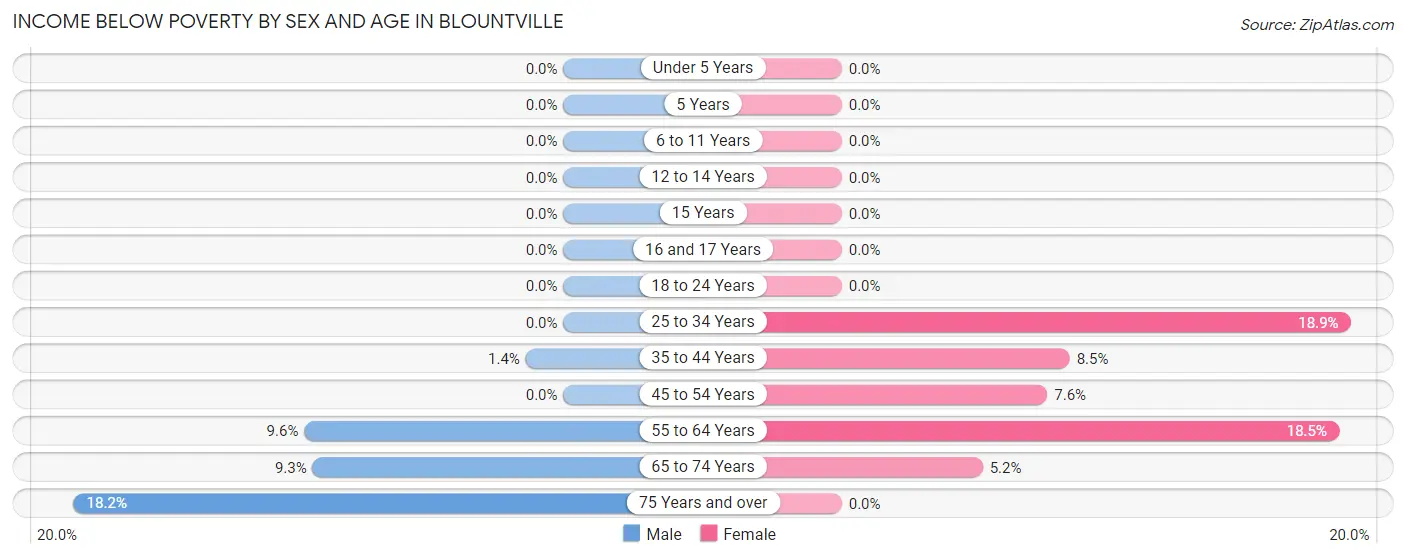
| Age Bracket | Male | Female |
| Under 5 Years | 0 (0.0%) | 0 (0.0%) |
| 5 Years | 0 (0.0%) | 0 (0.0%) |
| 6 to 11 Years | 0 (0.0%) | 0 (0.0%) |
| 12 to 14 Years | 0 (0.0%) | 0 (0.0%) |
| 15 Years | 0 (0.0%) | 0 (0.0%) |
| 16 and 17 Years | 0 (0.0%) | 0 (0.0%) |
| 18 to 24 Years | 0 (0.0%) | 0 (0.0%) |
| 25 to 34 Years | 0 (0.0%) | 47 (18.9%) |
| 35 to 44 Years | 2 (1.4%) | 11 (8.5%) |
| 45 to 54 Years | 0 (0.0%) | 10 (7.6%) |
| 55 to 64 Years | 20 (9.6%) | 50 (18.4%) |
| 65 to 74 Years | 19 (9.3%) | 9 (5.2%) |
| 75 Years and over | 8 (18.2%) | 0 (0.0%) |
| Total | 49 (4.0%) | 127 (10.1%) |
Income Above Poverty by Sex and Age in Blountville
According to the poverty statistics in Blountville, males aged under 5 years and females aged under 5 years are the age groups that are most secure financially, with 100.0% of males and 100.0% of females in these age groups living above the poverty line.
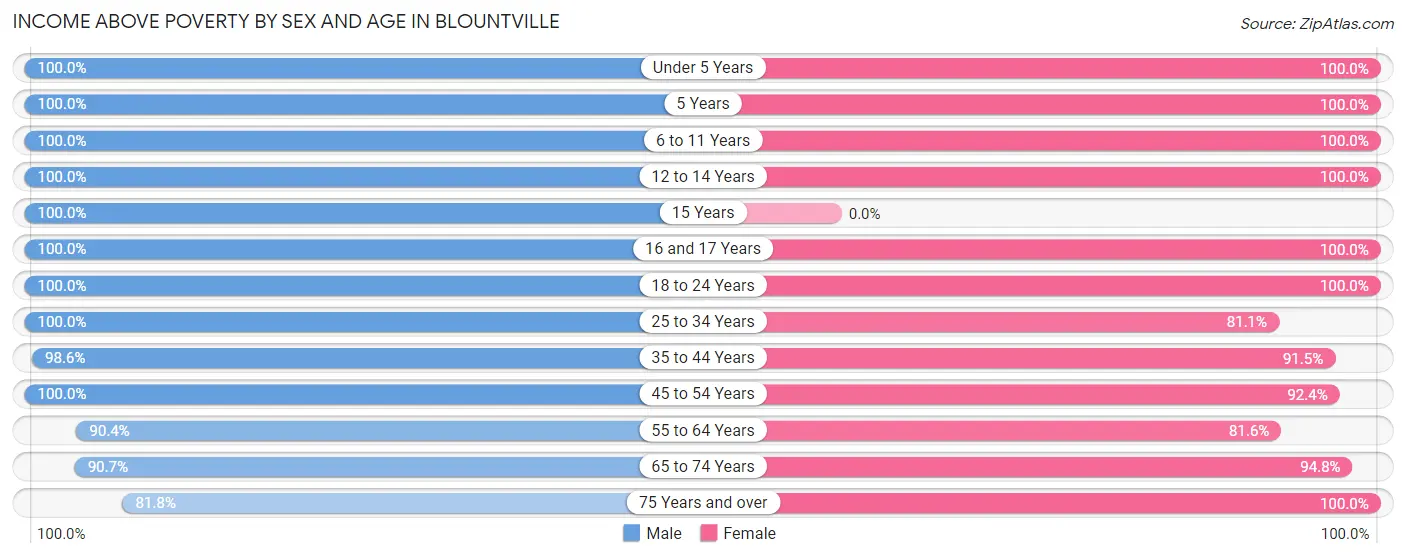
| Age Bracket | Male | Female |
| Under 5 Years | 78 (100.0%) | 17 (100.0%) |
| 5 Years | 6 (100.0%) | 49 (100.0%) |
| 6 to 11 Years | 24 (100.0%) | 25 (100.0%) |
| 12 to 14 Years | 99 (100.0%) | 14 (100.0%) |
| 15 Years | 14 (100.0%) | 0 (0.0%) |
| 16 and 17 Years | 6 (100.0%) | 45 (100.0%) |
| 18 to 24 Years | 45 (100.0%) | 22 (100.0%) |
| 25 to 34 Years | 149 (100.0%) | 202 (81.1%) |
| 35 to 44 Years | 141 (98.6%) | 119 (91.5%) |
| 45 to 54 Years | 213 (100.0%) | 121 (92.4%) |
| 55 to 64 Years | 188 (90.4%) | 221 (81.6%) |
| 65 to 74 Years | 185 (90.7%) | 163 (94.8%) |
| 75 Years and over | 36 (81.8%) | 128 (100.0%) |
| Total | 1,184 (96.0%) | 1,126 (89.9%) |
Income Below Poverty Among Married-Couple Families in Blountville
The poverty statistics for married-couple families in Blountville show that 7.2% or 43 of the total 599 families live below the poverty line. Families with no children have the highest poverty rate of 8.8%, comprising of 43 families. On the other hand, families with 1 or 2 children have the lowest poverty rate of 0.0%, which includes 0 families.
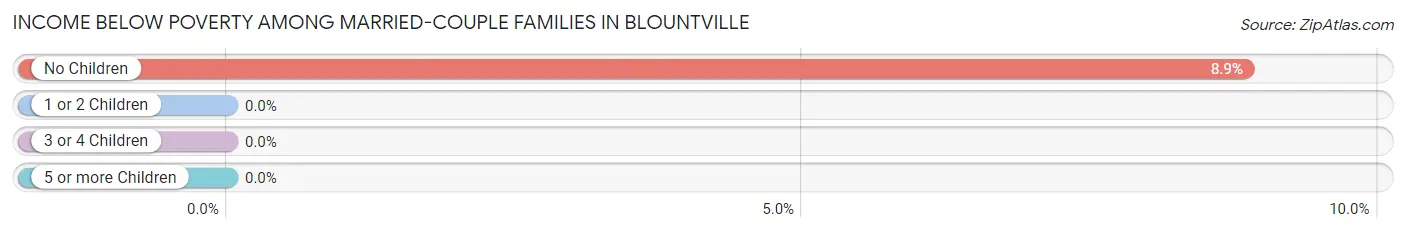
| Children | Above Poverty | Below Poverty |
| No Children | 443 (91.1%) | 43 (8.8%) |
| 1 or 2 Children | 97 (100.0%) | 0 (0.0%) |
| 3 or 4 Children | 16 (100.0%) | 0 (0.0%) |
| 5 or more Children | 0 (0.0%) | 0 (0.0%) |
| Total | 556 (92.8%) | 43 (7.2%) |
Income Below Poverty Among Single-Parent Households in Blountville
| Children | Single Father | Single Mother |
| No Children | 0 (0.0%) | 0 (0.0%) |
| 1 or 2 Children | 0 (0.0%) | 0 (0.0%) |
| 3 or 4 Children | 0 (0.0%) | 0 (0.0%) |
| 5 or more Children | 0 (0.0%) | 0 (0.0%) |
| Total | 0 (0.0%) | 0 (0.0%) |
Income Below Poverty Among Married-Couple vs Single-Parent Households in Blountville
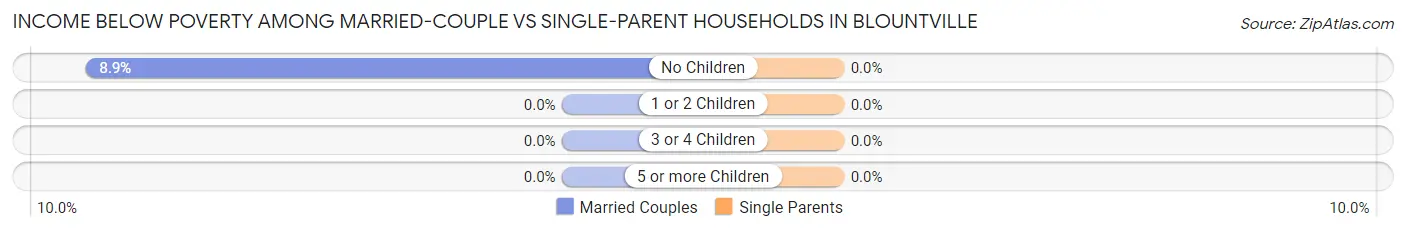
| Children | Married-Couple Families | Single-Parent Households |
| No Children | 43 (8.8%) | 0 (0.0%) |
| 1 or 2 Children | 0 (0.0%) | 0 (0.0%) |
| 3 or 4 Children | 0 (0.0%) | 0 (0.0%) |
| 5 or more Children | 0 (0.0%) | 0 (0.0%) |
| Total | 43 (7.2%) | 0 (0.0%) |
Race in Blountville
The most populous races in Blountville are White / Caucasian (3,159 | 96.8%), Black / African American (63 | 1.9%), and Two or more Races (29 | 0.9%).
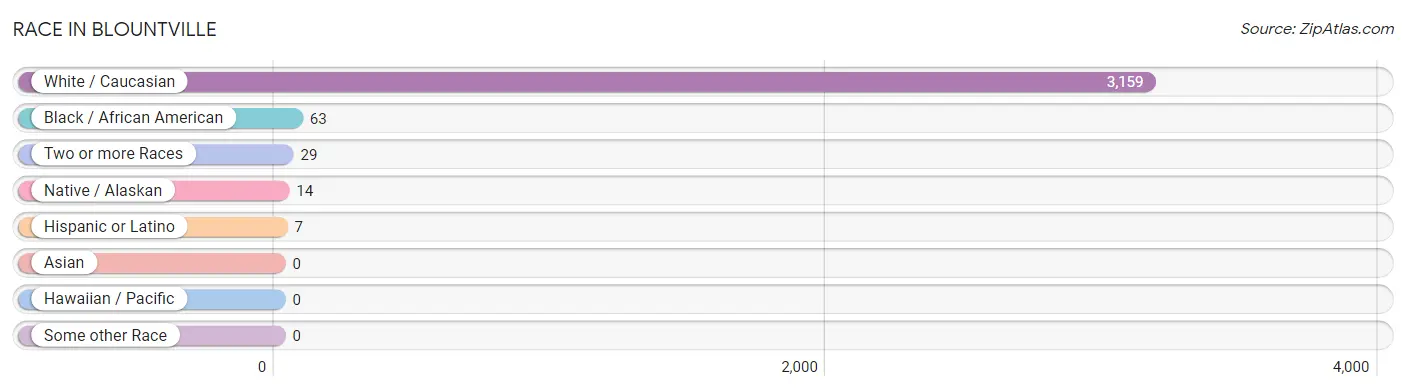
| Race | # Population | % Population |
| Asian | 0 | 0.0% |
| Black / African American | 63 | 1.9% |
| Hawaiian / Pacific | 0 | 0.0% |
| Hispanic or Latino | 7 | 0.2% |
| Native / Alaskan | 14 | 0.4% |
| White / Caucasian | 3,159 | 96.8% |
| Two or more Races | 29 | 0.9% |
| Some other Race | 0 | 0.0% |
| Total | 3,265 | 100.0% |
Ancestry in Blountville
The most populous ancestries reported in Blountville are Irish (510 | 15.6%), English (488 | 14.9%), American (446 | 13.7%), German (442 | 13.5%), and Scotch-Irish (180 | 5.5%), together accounting for 63.3% of all Blountville residents.
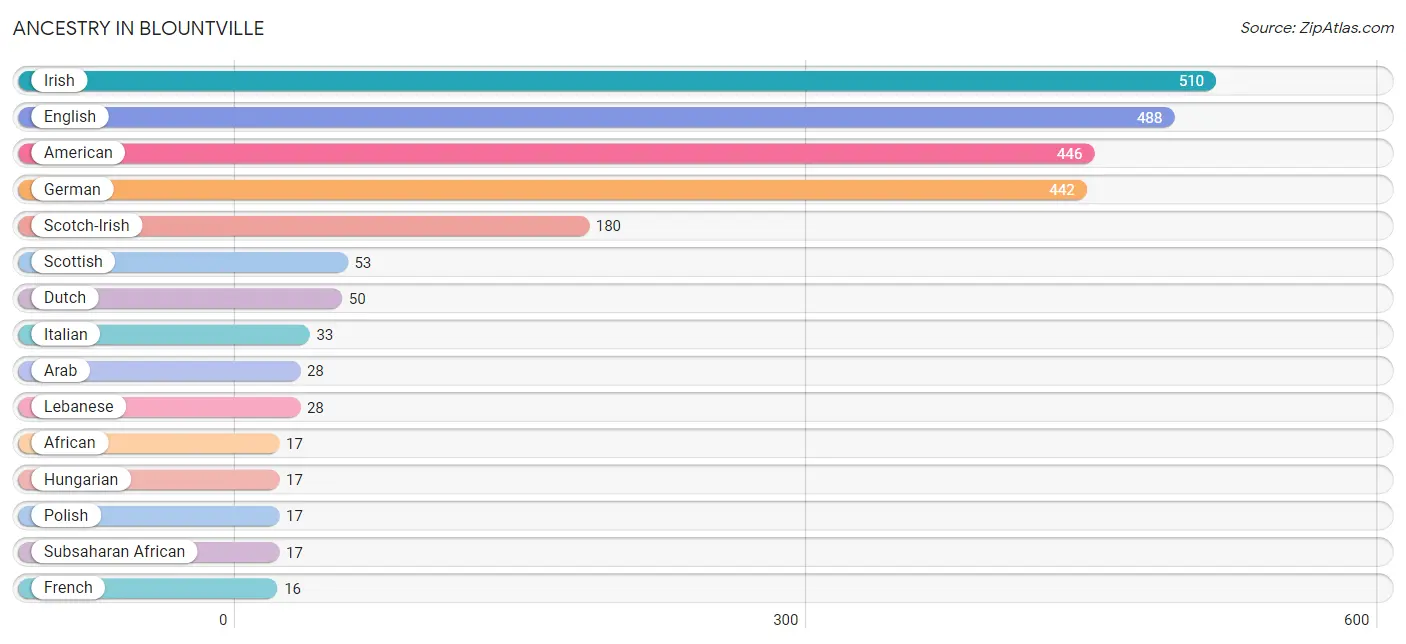
| Ancestry | # Population | % Population |
| African | 17 | 0.5% |
| American | 446 | 13.7% |
| Arab | 28 | 0.9% |
| British | 14 | 0.4% |
| Central American | 7 | 0.2% |
| Cherokee | 7 | 0.2% |
| Choctaw | 5 | 0.2% |
| Dutch | 50 | 1.5% |
| English | 488 | 14.9% |
| French | 16 | 0.5% |
| French Canadian | 4 | 0.1% |
| German | 442 | 13.5% |
| Hungarian | 17 | 0.5% |
| Irish | 510 | 15.6% |
| Italian | 33 | 1.0% |
| Lebanese | 28 | 0.9% |
| Panamanian | 7 | 0.2% |
| Polish | 17 | 0.5% |
| Scotch-Irish | 180 | 5.5% |
| Scottish | 53 | 1.6% |
| Sioux | 16 | 0.5% |
| Subsaharan African | 17 | 0.5% |
| Welsh | 10 | 0.3% | View All 23 Rows |
Immigrants in Blountville

| Immigration Origin | # Population | % Population | View All 0 Rows |
Sex and Age in Blountville
Sex and Age in Blountville
The most populous age groups in Blountville are 35 to 39 Years (202 | 10.8%) for men and 30 to 34 Years (175 | 12.5%) for women.
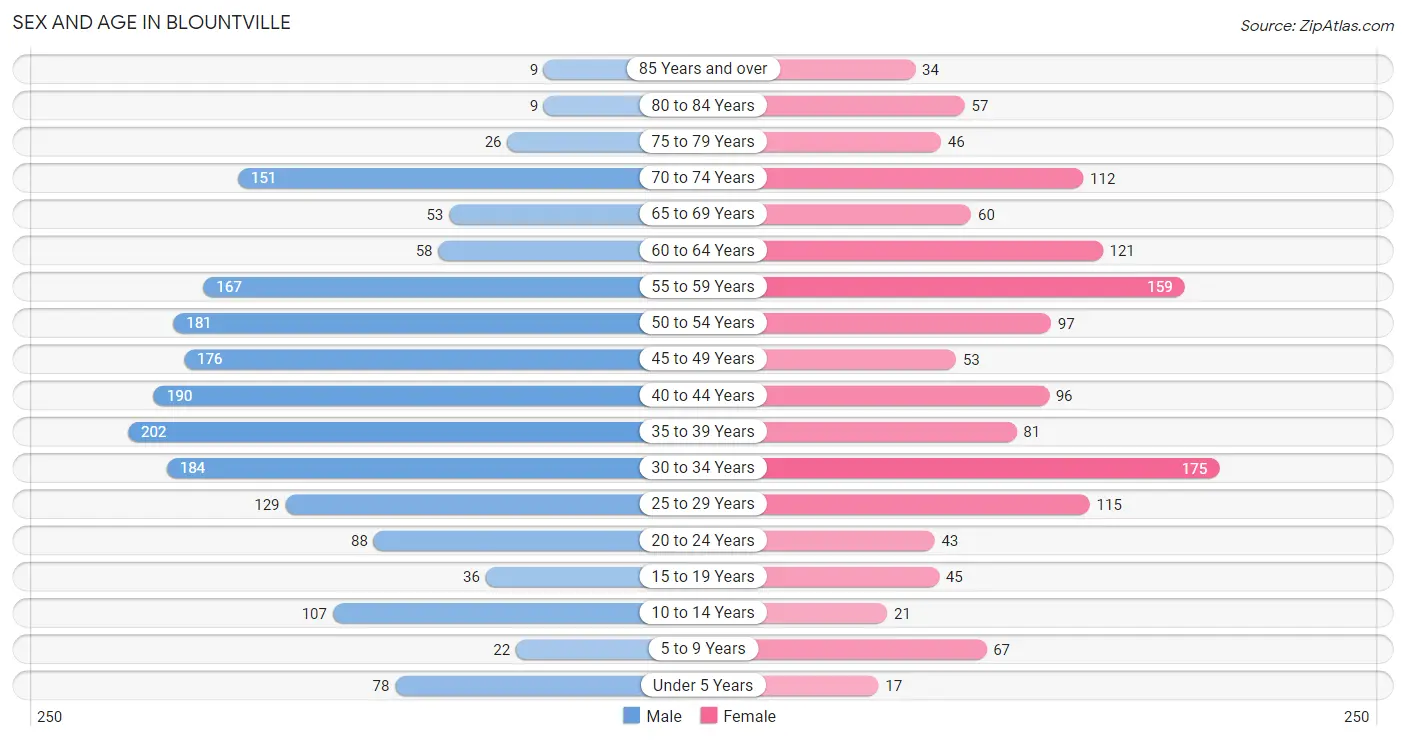
| Age Bracket | Male | Female |
| Under 5 Years | 78 (4.2%) | 17 (1.2%) |
| 5 to 9 Years | 22 (1.2%) | 67 (4.8%) |
| 10 to 14 Years | 107 (5.7%) | 21 (1.5%) |
| 15 to 19 Years | 36 (1.9%) | 45 (3.2%) |
| 20 to 24 Years | 88 (4.7%) | 43 (3.1%) |
| 25 to 29 Years | 129 (6.9%) | 115 (8.2%) |
| 30 to 34 Years | 184 (9.9%) | 175 (12.5%) |
| 35 to 39 Years | 202 (10.8%) | 81 (5.8%) |
| 40 to 44 Years | 190 (10.2%) | 96 (6.9%) |
| 45 to 49 Years | 176 (9.4%) | 53 (3.8%) |
| 50 to 54 Years | 181 (9.7%) | 97 (6.9%) |
| 55 to 59 Years | 167 (8.9%) | 159 (11.4%) |
| 60 to 64 Years | 58 (3.1%) | 121 (8.6%) |
| 65 to 69 Years | 53 (2.8%) | 60 (4.3%) |
| 70 to 74 Years | 151 (8.1%) | 112 (8.0%) |
| 75 to 79 Years | 26 (1.4%) | 46 (3.3%) |
| 80 to 84 Years | 9 (0.5%) | 57 (4.1%) |
| 85 Years and over | 9 (0.5%) | 34 (2.4%) |
| Total | 1,866 (100.0%) | 1,399 (100.0%) |
Families and Households in Blountville
Median Family Size in Blountville
The median family size in Blountville is 2.68 persons per family, with single female/mother families (99 | 12.9%) accounting for the largest median family size of 3.73 persons per family. On the other hand, single male/father families (70 | 9.1%) represent the smallest median family size with 2.27 persons per family.
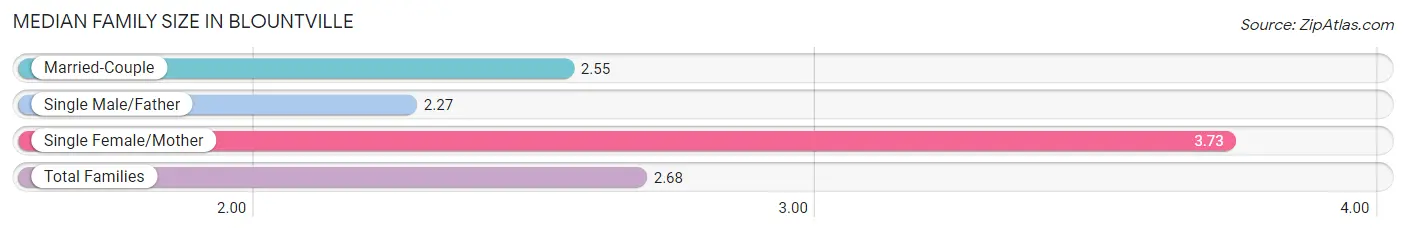
| Family Type | # Families | Family Size |
| Married-Couple | 599 (78.0%) | 2.55 |
| Single Male/Father | 70 (9.1%) | 2.27 |
| Single Female/Mother | 99 (12.9%) | 3.73 |
| Total Families | 768 (100.0%) | 2.68 |
Median Household Size in Blountville
The median household size in Blountville is 2.31 persons per household, with single female/mother households (99 | 9.2%) accounting for the largest median household size of 3.8 persons per household. non-family households (305 | 28.4%) represent the smallest median household size with 1.35 persons per household.
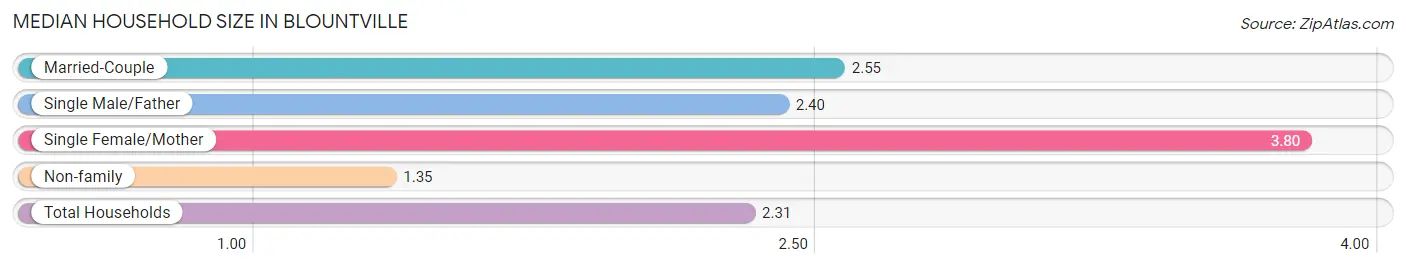
| Household Type | # Households | Household Size |
| Married-Couple | 599 (55.8%) | 2.55 |
| Single Male/Father | 70 (6.5%) | 2.40 |
| Single Female/Mother | 99 (9.2%) | 3.80 |
| Non-family | 305 (28.4%) | 1.35 |
| Total Households | 1,073 (100.0%) | 2.31 |
Household Size by Marriage Status in Blountville
Out of a total of 1,073 households in Blountville, 768 (71.6%) are family households, while 305 (28.4%) are nonfamily households. The most numerous type of family households are 2-person households, comprising 523, and the most common type of nonfamily households are 1-person households, comprising 206.
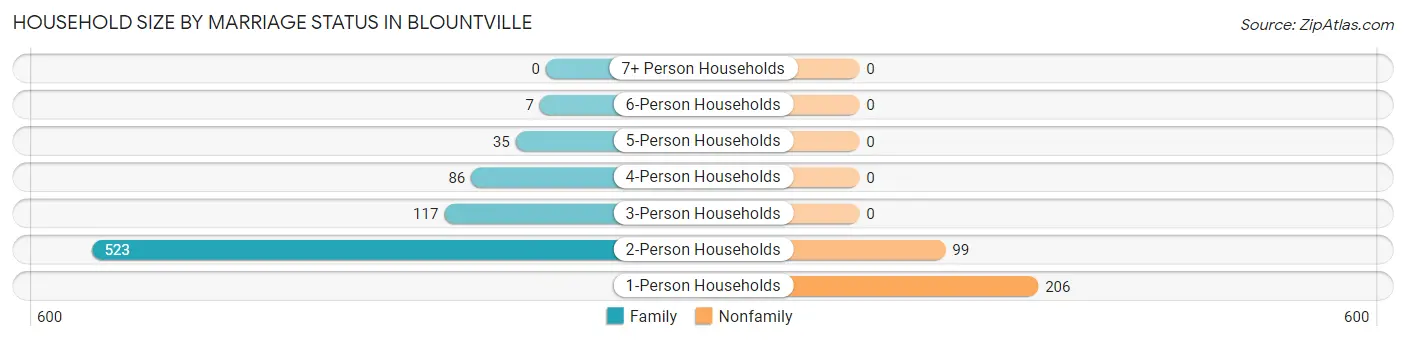
| Household Size | Family Households | Nonfamily Households |
| 1-Person Households | - | 206 (19.2%) |
| 2-Person Households | 523 (48.7%) | 99 (9.2%) |
| 3-Person Households | 117 (10.9%) | 0 (0.0%) |
| 4-Person Households | 86 (8.0%) | 0 (0.0%) |
| 5-Person Households | 35 (3.3%) | 0 (0.0%) |
| 6-Person Households | 7 (0.6%) | 0 (0.0%) |
| 7+ Person Households | 0 (0.0%) | 0 (0.0%) |
| Total | 768 (71.6%) | 305 (28.4%) |
Female Fertility in Blountville
Fertility by Age in Blountville
Average fertility rate in Blountville is 16.0 births per 1,000 women. Women in the age bracket of 20 to 34 years have the highest fertility rate with 30.0 births per 1,000 women. Women in the age bracket of 20 to 34 years acount for 100.0% of all women with births.
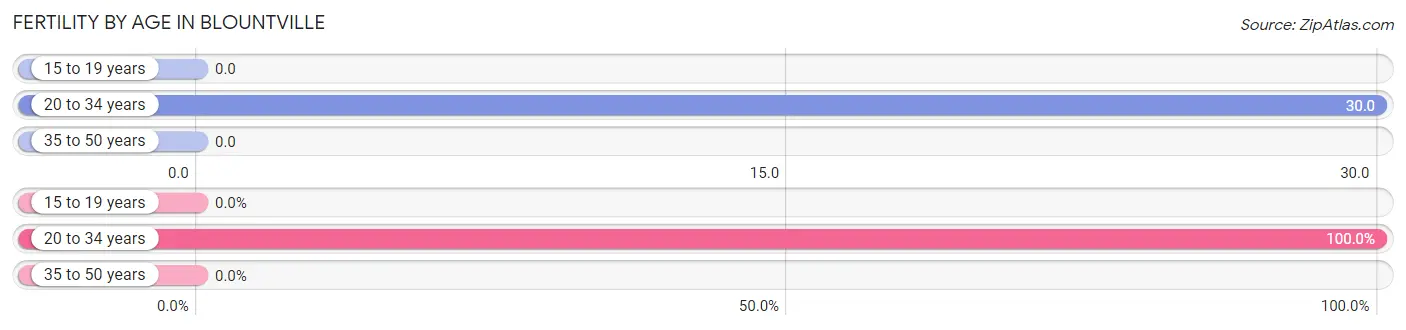
| Age Bracket | Women with Births | Births / 1,000 Women |
| 15 to 19 years | 0 (0.0%) | 0.0 |
| 20 to 34 years | 10 (100.0%) | 30.0 |
| 35 to 50 years | 0 (0.0%) | 0.0 |
| Total | 10 (100.0%) | 16.0 |
Fertility by Age by Marriage Status in Blountville
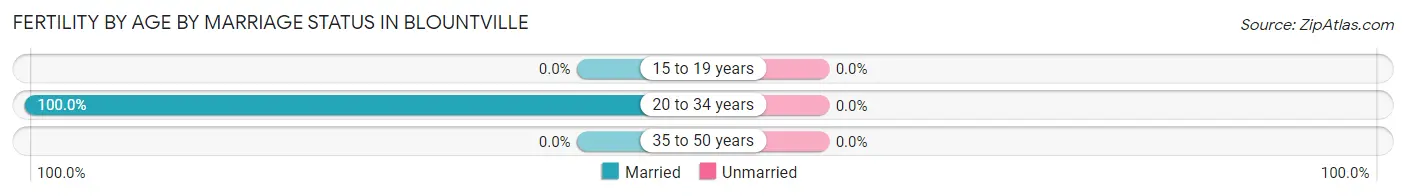
| Age Bracket | Married | Unmarried |
| 15 to 19 years | 0 (0.0%) | 0 (0.0%) |
| 20 to 34 years | 10 (100.0%) | 0 (0.0%) |
| 35 to 50 years | 0 (0.0%) | 0 (0.0%) |
| Total | 10 (100.0%) | 0 (0.0%) |
Fertility by Education in Blountville
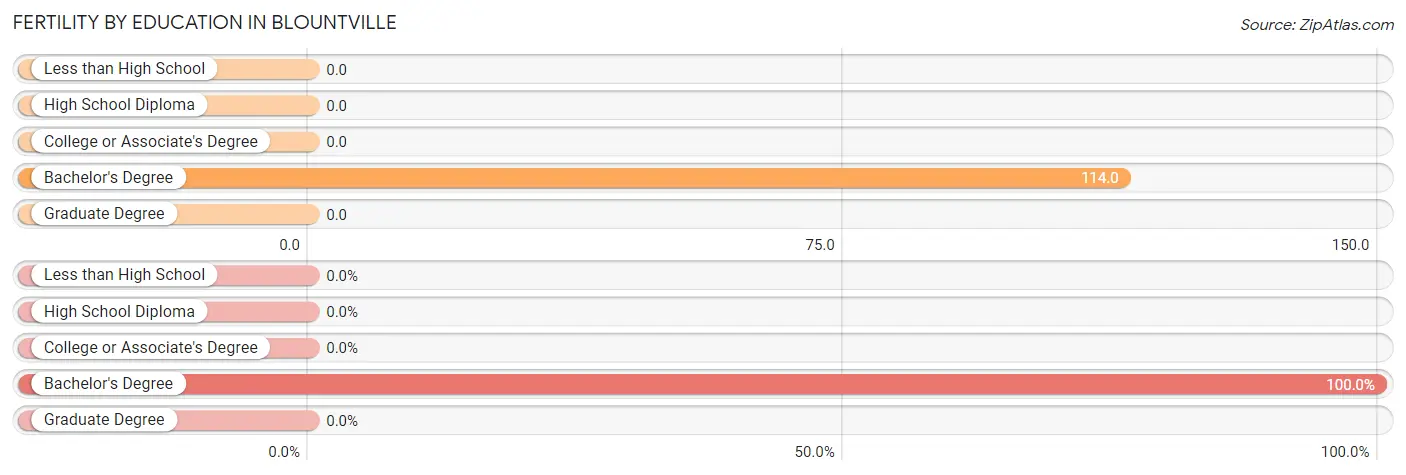
| Educational Attainment | Women with Births | Births / 1,000 Women |
| Less than High School | 0 (0.0%) | 0.0 |
| High School Diploma | 0 (0.0%) | 0.0 |
| College or Associate's Degree | 0 (0.0%) | 0.0 |
| Bachelor's Degree | 10 (100.0%) | 114.0 |
| Graduate Degree | 0 (0.0%) | 0.0 |
| Total | 10 (100.0%) | 16.0 |
Fertility by Education by Marriage Status in Blountville
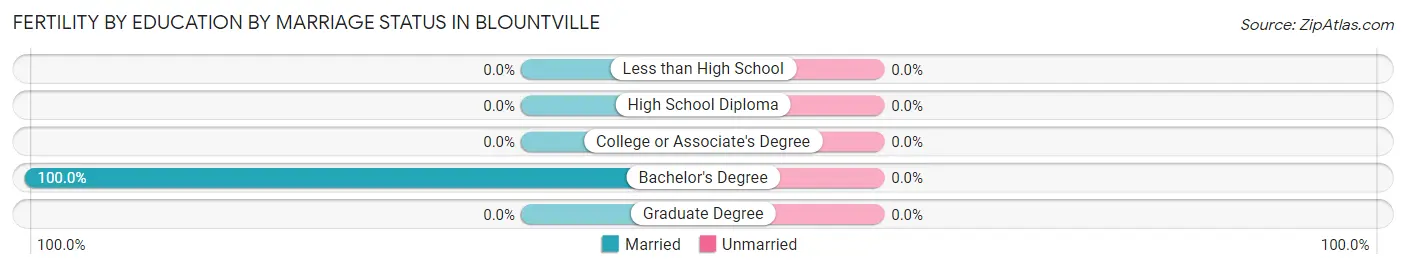
| Educational Attainment | Married | Unmarried |
| Less than High School | 0 (0.0%) | 0 (0.0%) |
| High School Diploma | 0 (0.0%) | 0 (0.0%) |
| College or Associate's Degree | 0 (0.0%) | 0 (0.0%) |
| Bachelor's Degree | 10 (100.0%) | 0 (0.0%) |
| Graduate Degree | 0 (0.0%) | 0 (0.0%) |
| Total | 10 (100.0%) | 0 (0.0%) |
Employment Characteristics in Blountville
Employment by Class of Employer in Blountville
Among the 1,161 employed individuals in Blountville, private company employees (575 | 49.5%), not-for-profit organizations (257 | 22.1%), and local government employees (137 | 11.8%) make up the most common classes of employment.
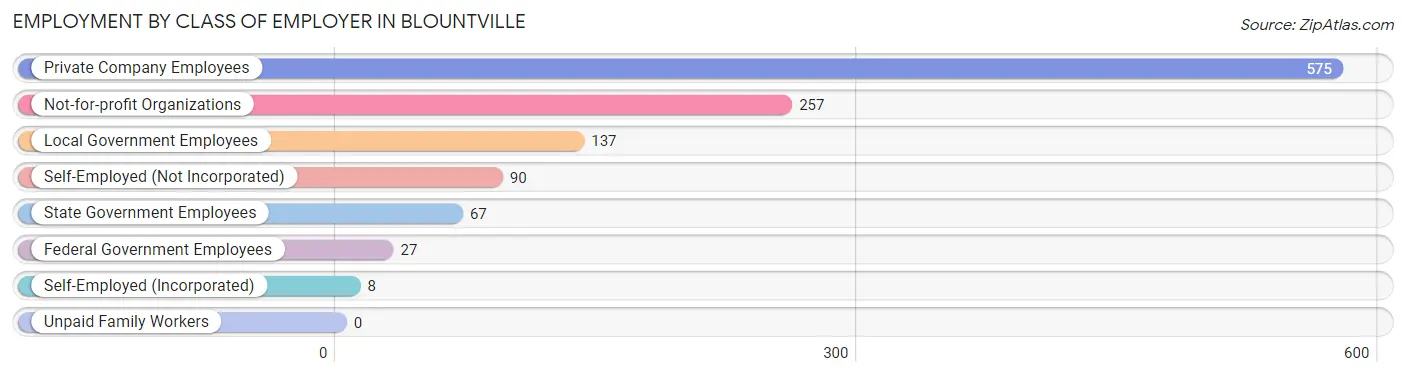
| Employer Class | # Employees | % Employees |
| Private Company Employees | 575 | 49.5% |
| Self-Employed (Incorporated) | 8 | 0.7% |
| Self-Employed (Not Incorporated) | 90 | 7.7% |
| Not-for-profit Organizations | 257 | 22.1% |
| Local Government Employees | 137 | 11.8% |
| State Government Employees | 67 | 5.8% |
| Federal Government Employees | 27 | 2.3% |
| Unpaid Family Workers | 0 | 0.0% |
| Total | 1,161 | 100.0% |
Employment Status by Age in Blountville
According to the labor force statistics for Blountville, out of the total population over 16 years of age (2,939), 46.8% or 1,375 individuals are in the labor force, with 6.5% or 89 of them unemployed. The age group with the highest labor force participation rate is 30 to 34 years, with 68.2% or 245 individuals in the labor force. Within the labor force, the 35 to 44 years age range has the highest percentage of unemployed individuals, with 17.0% or 40 of them being unemployed.
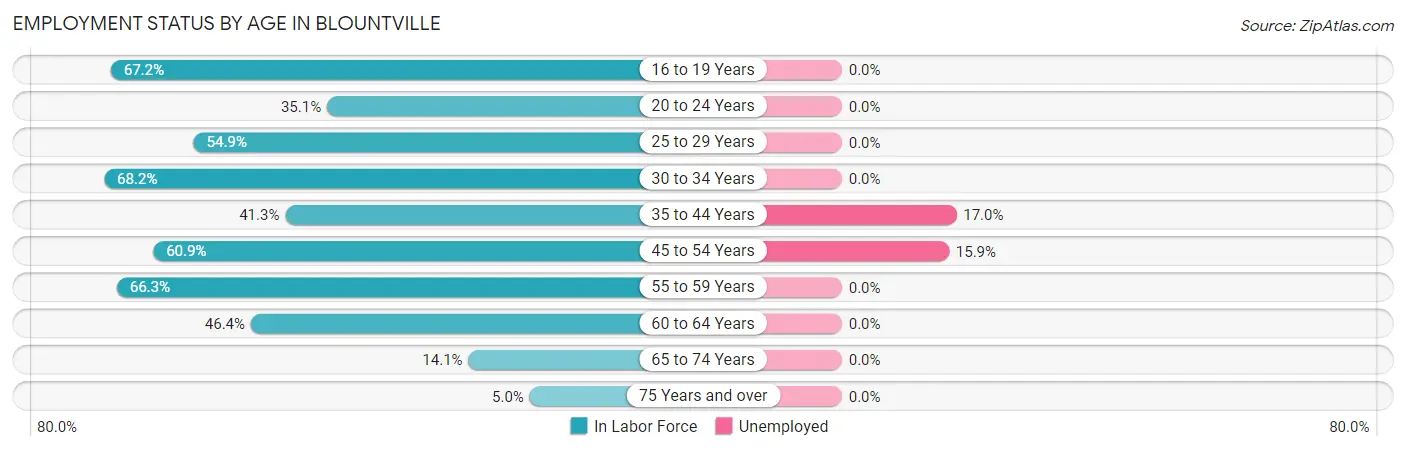
| Age Bracket | In Labor Force | Unemployed |
| 16 to 19 Years | 45 (67.2%) | 0 (0.0%) |
| 20 to 24 Years | 46 (35.1%) | 0 (0.0%) |
| 25 to 29 Years | 134 (54.9%) | 0 (0.0%) |
| 30 to 34 Years | 245 (68.2%) | 0 (0.0%) |
| 35 to 44 Years | 235 (41.3%) | 40 (17.0%) |
| 45 to 54 Years | 309 (60.9%) | 49 (15.9%) |
| 55 to 59 Years | 216 (66.3%) | 0 (0.0%) |
| 60 to 64 Years | 83 (46.4%) | 0 (0.0%) |
| 65 to 74 Years | 53 (14.1%) | 0 (0.0%) |
| 75 Years and over | 9 (5.0%) | 0 (0.0%) |
| Total | 1,375 (46.8%) | 89 (6.5%) |
Employment Status by Educational Attainment in Blountville
According to labor force statistics for Blountville, 56.0% of individuals (1,223) out of the total population between 25 and 64 years of age (2,184) are in the labor force, with 7.3% or 89 of them being unemployed. The group with the highest labor force participation rate are those with the educational attainment of bachelor's degree or higher, with 90.7% or 431 individuals in the labor force. Within the labor force, individuals with high school diploma education have the highest percentage of unemployment, with 12.9% or 49 of them being unemployed.
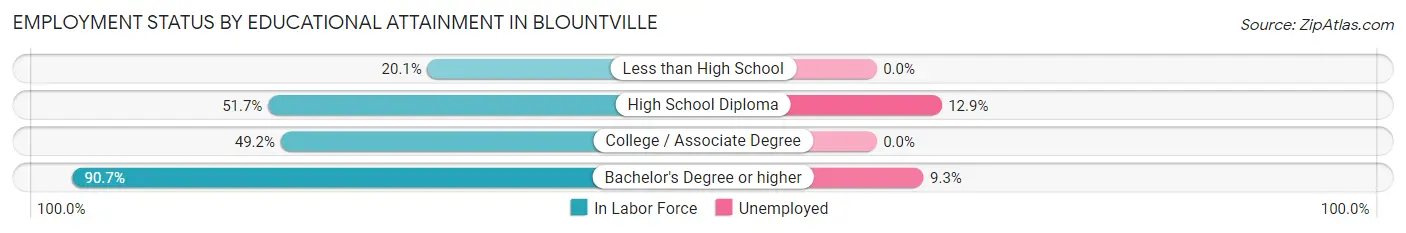
| Educational Attainment | In Labor Force | Unemployed |
| Less than High School | 47 (20.1%) | 0 (0.0%) |
| High School Diploma | 381 (51.7%) | 95 (12.9%) |
| College / Associate Degree | 363 (49.2%) | 0 (0.0%) |
| Bachelor's Degree or higher | 431 (90.7%) | 44 (9.3%) |
| Total | 1,223 (56.0%) | 159 (7.3%) |
Employment Occupations by Sex in Blountville
Management, Business, Science and Arts Occupations
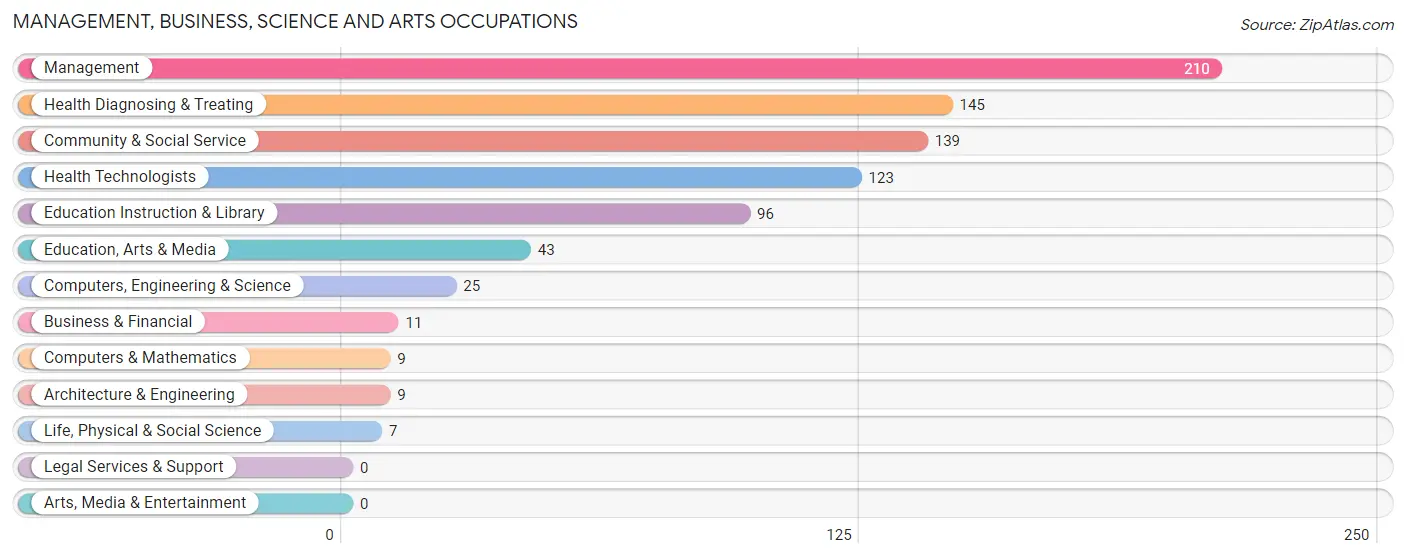
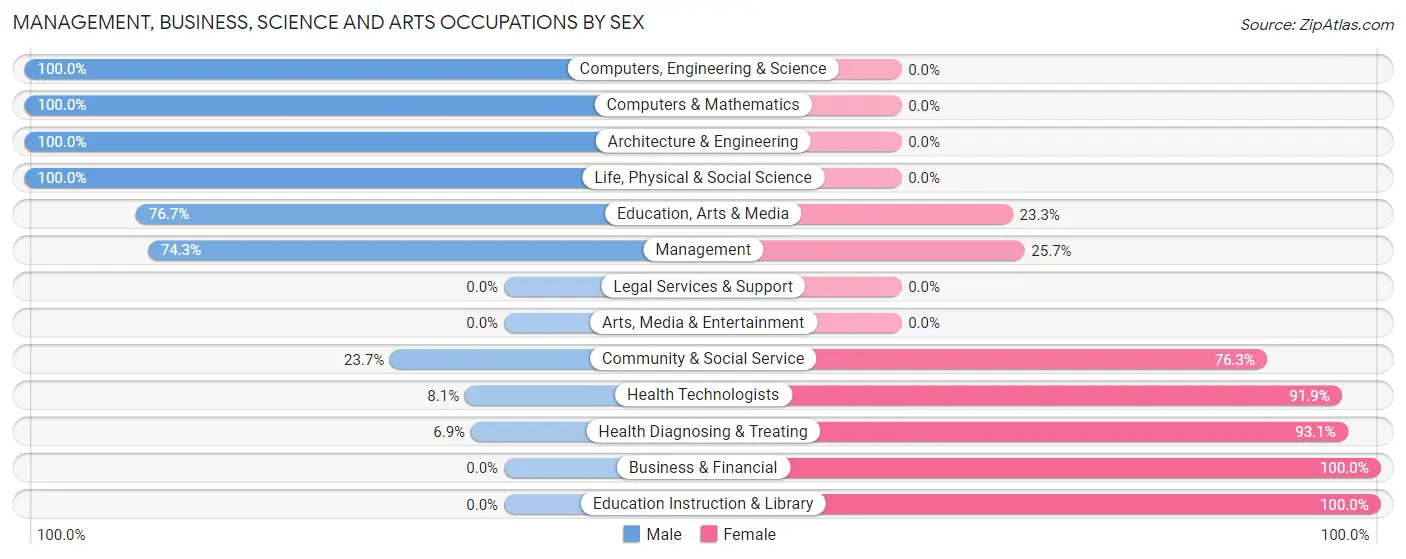
The most common Management, Business, Science and Arts occupations in Blountville are Management (210 | 16.3%), Health Diagnosing & Treating (145 | 11.3%), Community & Social Service (139 | 10.8%), Health Technologists (123 | 9.6%), and Education Instruction & Library (96 | 7.5%).
Management, Business, Science and Arts Occupations by Sex
Within the Management, Business, Science and Arts occupations in Blountville, the most male-oriented occupations are Computers, Engineering & Science (100.0%), Computers & Mathematics (100.0%), and Architecture & Engineering (100.0%), while the most female-oriented occupations are Business & Financial (100.0%), Education Instruction & Library (100.0%), and Health Diagnosing & Treating (93.1%).
| Occupation | Male | Female |
| Management | 156 (74.3%) | 54 (25.7%) |
| Business & Financial | 0 (0.0%) | 11 (100.0%) |
| Computers, Engineering & Science | 25 (100.0%) | 0 (0.0%) |
| Computers & Mathematics | 9 (100.0%) | 0 (0.0%) |
| Architecture & Engineering | 9 (100.0%) | 0 (0.0%) |
| Life, Physical & Social Science | 7 (100.0%) | 0 (0.0%) |
| Community & Social Service | 33 (23.7%) | 106 (76.3%) |
| Education, Arts & Media | 33 (76.7%) | 10 (23.3%) |
| Legal Services & Support | 0 (0.0%) | 0 (0.0%) |
| Education Instruction & Library | 0 (0.0%) | 96 (100.0%) |
| Arts, Media & Entertainment | 0 (0.0%) | 0 (0.0%) |
| Health Diagnosing & Treating | 10 (6.9%) | 135 (93.1%) |
| Health Technologists | 10 (8.1%) | 113 (91.9%) |
| Total (Category) | 224 (42.3%) | 306 (57.7%) |
| Total (Overall) | 648 (50.4%) | 638 (49.6%) |
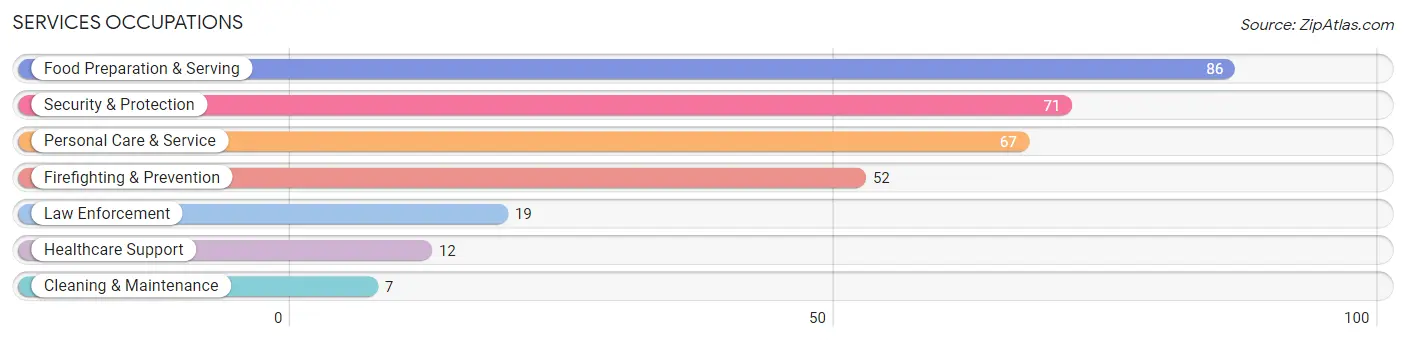
Services Occupations
The most common Services occupations in Blountville are Food Preparation & Serving (86 | 6.7%), Security & Protection (71 | 5.5%), Personal Care & Service (67 | 5.2%), Firefighting & Prevention (52 | 4.0%), and Law Enforcement (19 | 1.5%).
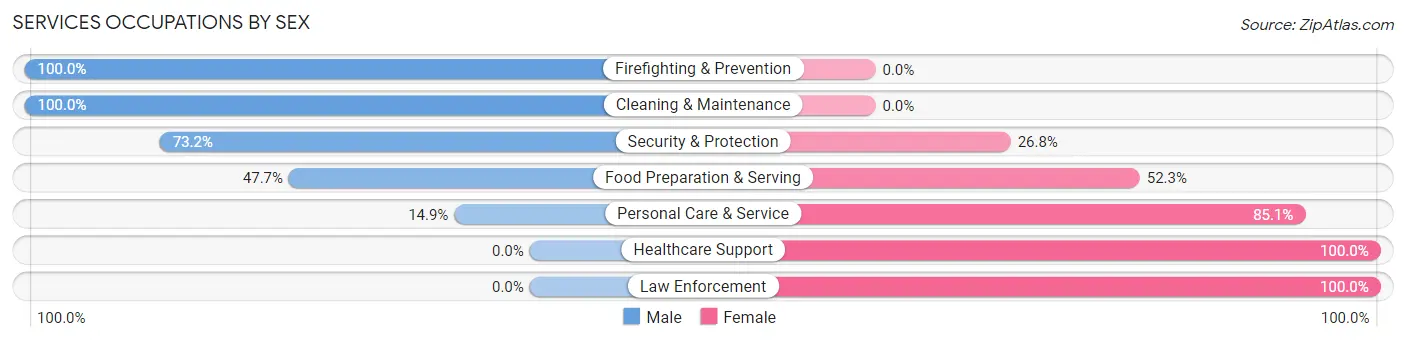
Services Occupations by Sex
Within the Services occupations in Blountville, the most male-oriented occupations are Firefighting & Prevention (100.0%), Cleaning & Maintenance (100.0%), and Security & Protection (73.2%), while the most female-oriented occupations are Healthcare Support (100.0%), Law Enforcement (100.0%), and Personal Care & Service (85.1%).
| Occupation | Male | Female |
| Healthcare Support | 0 (0.0%) | 12 (100.0%) |
| Security & Protection | 52 (73.2%) | 19 (26.8%) |
| Firefighting & Prevention | 52 (100.0%) | 0 (0.0%) |
| Law Enforcement | 0 (0.0%) | 19 (100.0%) |
| Food Preparation & Serving | 41 (47.7%) | 45 (52.3%) |
| Cleaning & Maintenance | 7 (100.0%) | 0 (0.0%) |
| Personal Care & Service | 10 (14.9%) | 57 (85.1%) |
| Total (Category) | 110 (45.3%) | 133 (54.7%) |
| Total (Overall) | 648 (50.4%) | 638 (49.6%) |
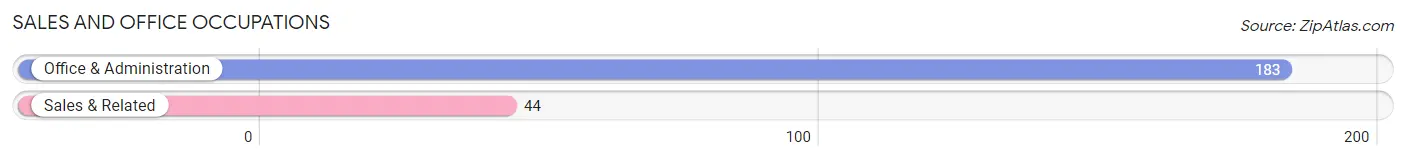
Sales and Office Occupations
The most common Sales and Office occupations in Blountville are Office & Administration (183 | 14.2%), and Sales & Related (44 | 3.4%).
Sales and Office Occupations by Sex
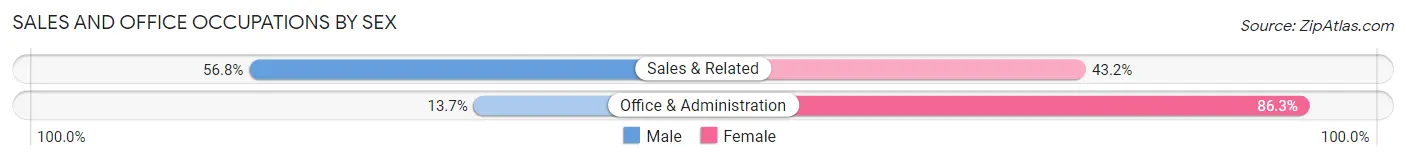
| Occupation | Male | Female |
| Sales & Related | 25 (56.8%) | 19 (43.2%) |
| Office & Administration | 25 (13.7%) | 158 (86.3%) |
| Total (Category) | 50 (22.0%) | 177 (78.0%) |
| Total (Overall) | 648 (50.4%) | 638 (49.6%) |
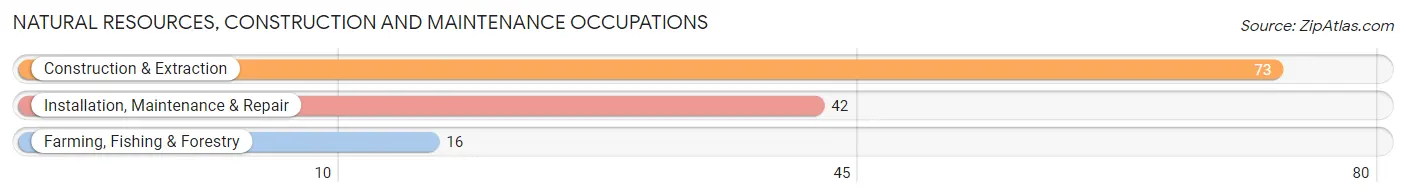
Natural Resources, Construction and Maintenance Occupations
The most common Natural Resources, Construction and Maintenance occupations in Blountville are Construction & Extraction (73 | 5.7%), Installation, Maintenance & Repair (42 | 3.3%), and Farming, Fishing & Forestry (16 | 1.2%).
Natural Resources, Construction and Maintenance Occupations by Sex
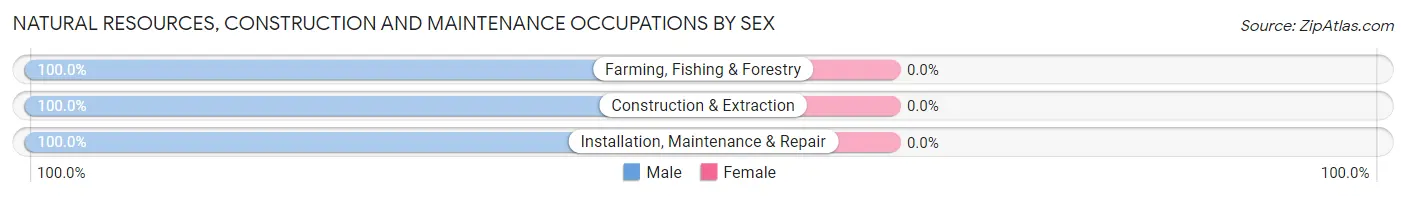
| Occupation | Male | Female |
| Farming, Fishing & Forestry | 16 (100.0%) | 0 (0.0%) |
| Construction & Extraction | 73 (100.0%) | 0 (0.0%) |
| Installation, Maintenance & Repair | 42 (100.0%) | 0 (0.0%) |
| Total (Category) | 131 (100.0%) | 0 (0.0%) |
| Total (Overall) | 648 (50.4%) | 638 (49.6%) |
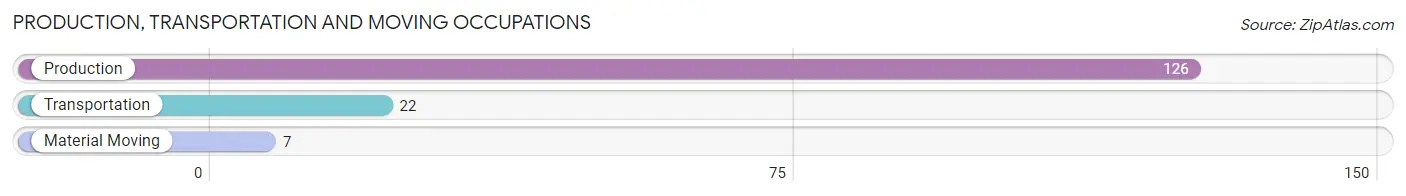
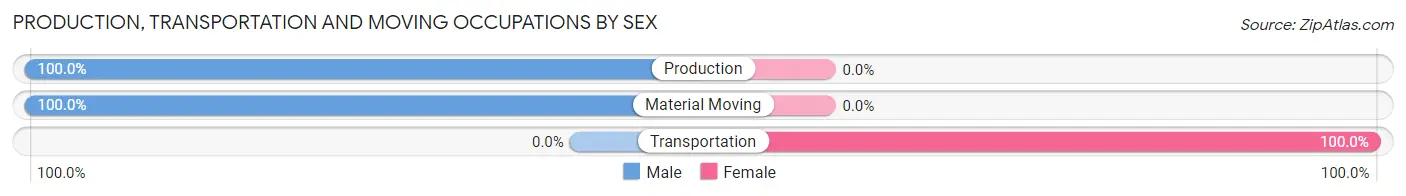
Production, Transportation and Moving Occupations
The most common Production, Transportation and Moving occupations in Blountville are Production (126 | 9.8%), Transportation (22 | 1.7%), and Material Moving (7 | 0.5%).
Production, Transportation and Moving Occupations by Sex
| Occupation | Male | Female |
| Production | 126 (100.0%) | 0 (0.0%) |
| Transportation | 0 (0.0%) | 22 (100.0%) |
| Material Moving | 7 (100.0%) | 0 (0.0%) |
| Total (Category) | 133 (85.8%) | 22 (14.2%) |
| Total (Overall) | 648 (50.4%) | 638 (49.6%) |
Employment Industries by Sex in Blountville
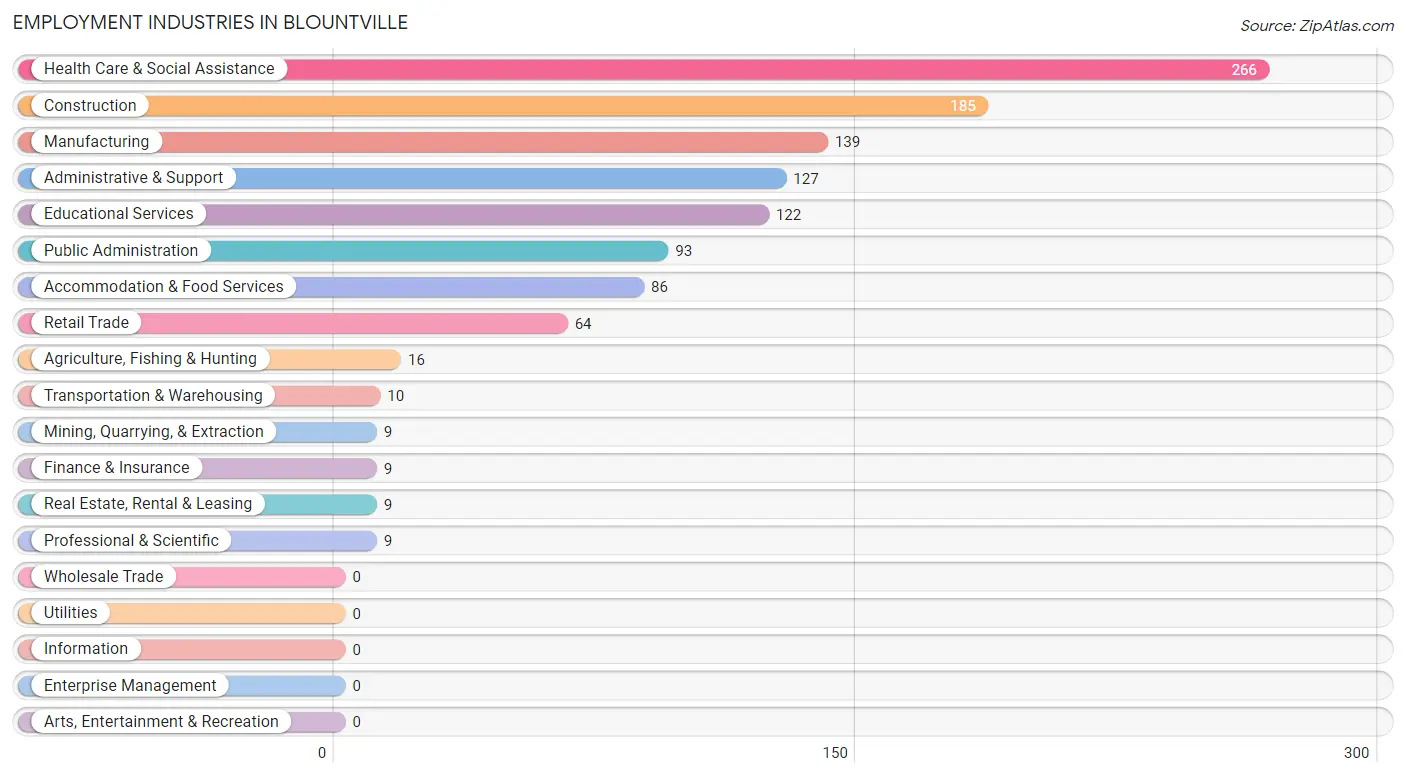
Employment Industries in Blountville
The major employment industries in Blountville include Health Care & Social Assistance (266 | 20.7%), Construction (185 | 14.4%), Manufacturing (139 | 10.8%), Administrative & Support (127 | 9.9%), and Educational Services (122 | 9.5%).
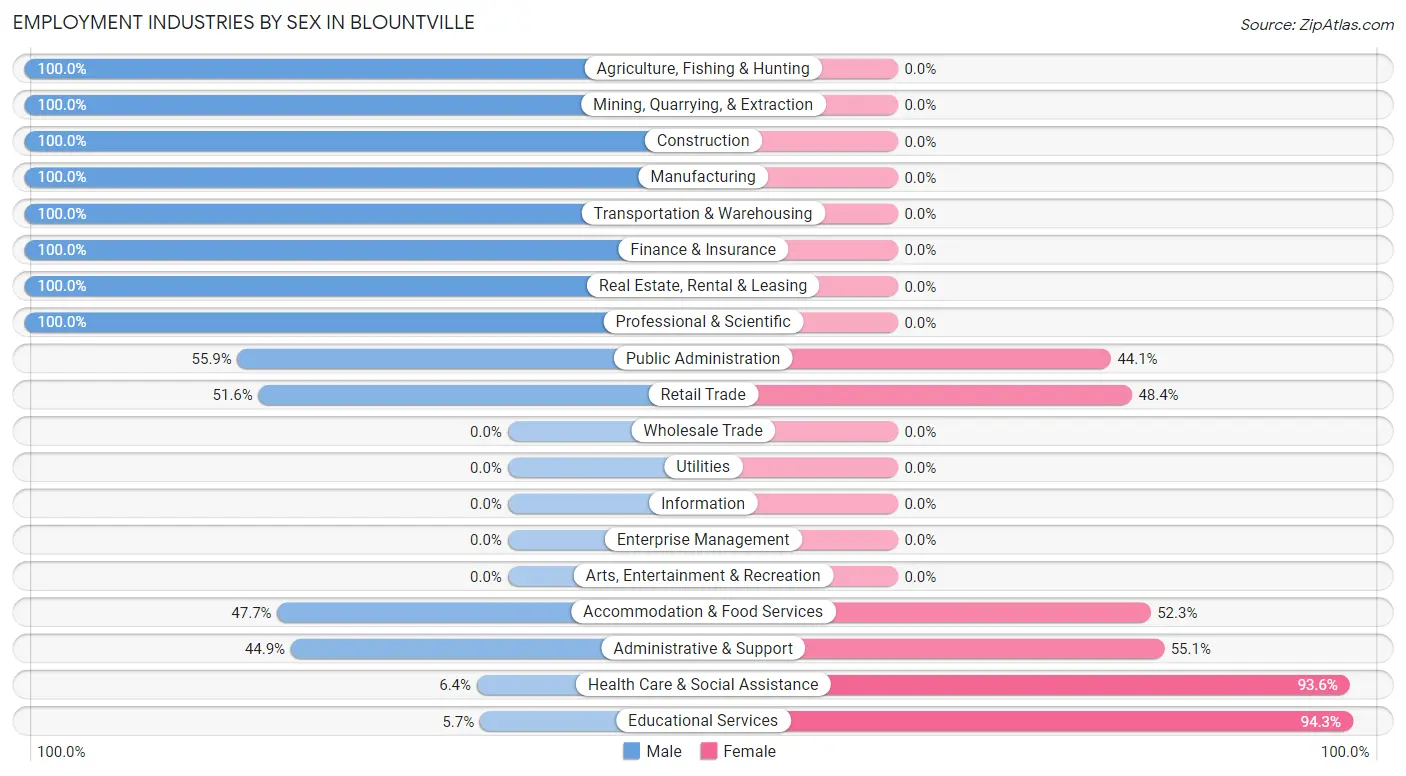
Employment Industries by Sex in Blountville
The Blountville industries that see more men than women are Agriculture, Fishing & Hunting (100.0%), Mining, Quarrying, & Extraction (100.0%), and Construction (100.0%), whereas the industries that tend to have a higher number of women are Educational Services (94.3%), Health Care & Social Assistance (93.6%), and Administrative & Support (55.1%).
| Industry | Male | Female |
| Agriculture, Fishing & Hunting | 16 (100.0%) | 0 (0.0%) |
| Mining, Quarrying, & Extraction | 9 (100.0%) | 0 (0.0%) |
| Construction | 185 (100.0%) | 0 (0.0%) |
| Manufacturing | 139 (100.0%) | 0 (0.0%) |
| Wholesale Trade | 0 (0.0%) | 0 (0.0%) |
| Retail Trade | 33 (51.6%) | 31 (48.4%) |
| Transportation & Warehousing | 10 (100.0%) | 0 (0.0%) |
| Utilities | 0 (0.0%) | 0 (0.0%) |
| Information | 0 (0.0%) | 0 (0.0%) |
| Finance & Insurance | 9 (100.0%) | 0 (0.0%) |
| Real Estate, Rental & Leasing | 9 (100.0%) | 0 (0.0%) |
| Professional & Scientific | 9 (100.0%) | 0 (0.0%) |
| Enterprise Management | 0 (0.0%) | 0 (0.0%) |
| Administrative & Support | 57 (44.9%) | 70 (55.1%) |
| Educational Services | 7 (5.7%) | 115 (94.3%) |
| Health Care & Social Assistance | 17 (6.4%) | 249 (93.6%) |
| Arts, Entertainment & Recreation | 0 (0.0%) | 0 (0.0%) |
| Accommodation & Food Services | 41 (47.7%) | 45 (52.3%) |
| Public Administration | 52 (55.9%) | 41 (44.1%) |
| Total | 648 (50.4%) | 638 (49.6%) |
Education in Blountville
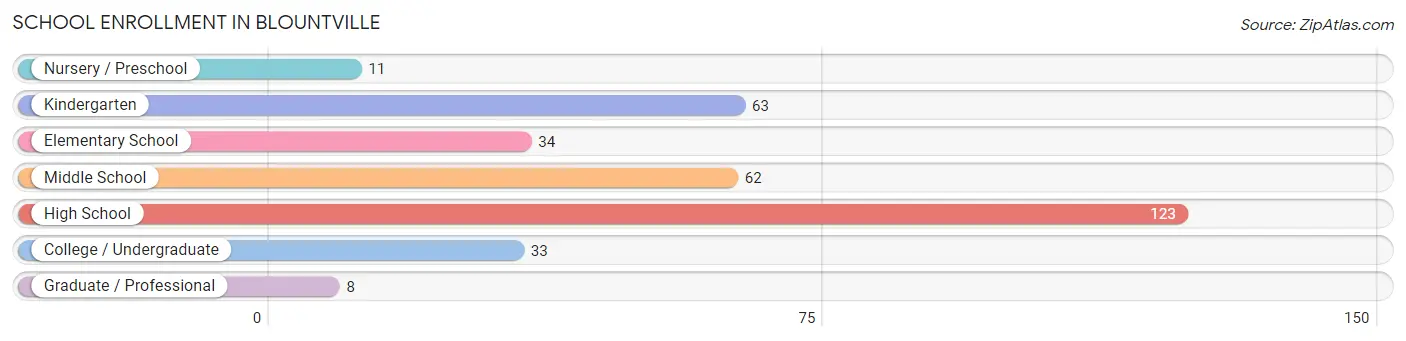
School Enrollment in Blountville
The most common levels of schooling among the 334 students in Blountville are high school (123 | 36.8%), kindergarten (63 | 18.9%), and middle school (62 | 18.6%).
| School Level | # Students | % Students |
| Nursery / Preschool | 11 | 3.3% |
| Kindergarten | 63 | 18.9% |
| Elementary School | 34 | 10.2% |
| Middle School | 62 | 18.6% |
| High School | 123 | 36.8% |
| College / Undergraduate | 33 | 9.9% |
| Graduate / Professional | 8 | 2.4% |
| Total | 334 | 100.0% |
School Enrollment by Age by Funding Source in Blountville
Out of a total of 334 students who are enrolled in schools in Blountville, 164 (49.1%) attend a private institution, while the remaining 170 (50.9%) are enrolled in public schools. The age group of 3 to 4 year olds has the highest likelihood of being enrolled in private schools, with 11 (100.0% in the age bracket) enrolled. Conversely, the age group of 5 to 9 year old has the lowest likelihood of being enrolled in a private school, with 89 (100.0% in the age bracket) attending a public institution.
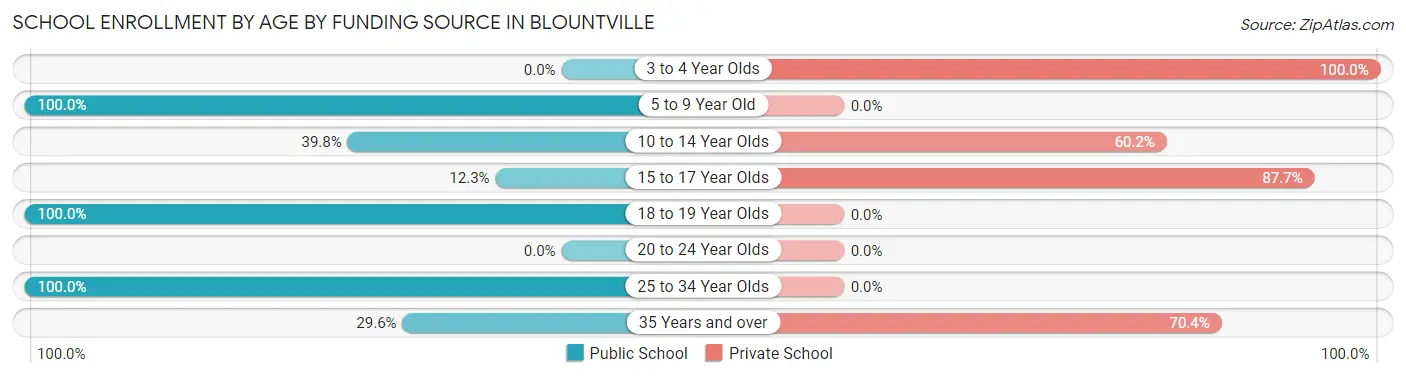
| Age Bracket | Public School | Private School |
| 3 to 4 Year Olds | 0 (0.0%) | 11 (100.0%) |
| 5 to 9 Year Old | 89 (100.0%) | 0 (0.0%) |
| 10 to 14 Year Olds | 51 (39.8%) | 77 (60.2%) |
| 15 to 17 Year Olds | 8 (12.3%) | 57 (87.7%) |
| 18 to 19 Year Olds | 8 (100.0%) | 0 (0.0%) |
| 20 to 24 Year Olds | 0 (0.0%) | 0 (0.0%) |
| 25 to 34 Year Olds | 6 (100.0%) | 0 (0.0%) |
| 35 Years and over | 8 (29.6%) | 19 (70.4%) |
| Total | 170 (50.9%) | 164 (49.1%) |
Educational Attainment by Field of Study in Blountville
Science & technology (156 | 23.6%), education (140 | 21.2%), arts & humanities (111 | 16.8%), business (64 | 9.7%), and liberal arts & history (48 | 7.3%) are the most common fields of study among 660 individuals in Blountville who have obtained a bachelor's degree or higher.
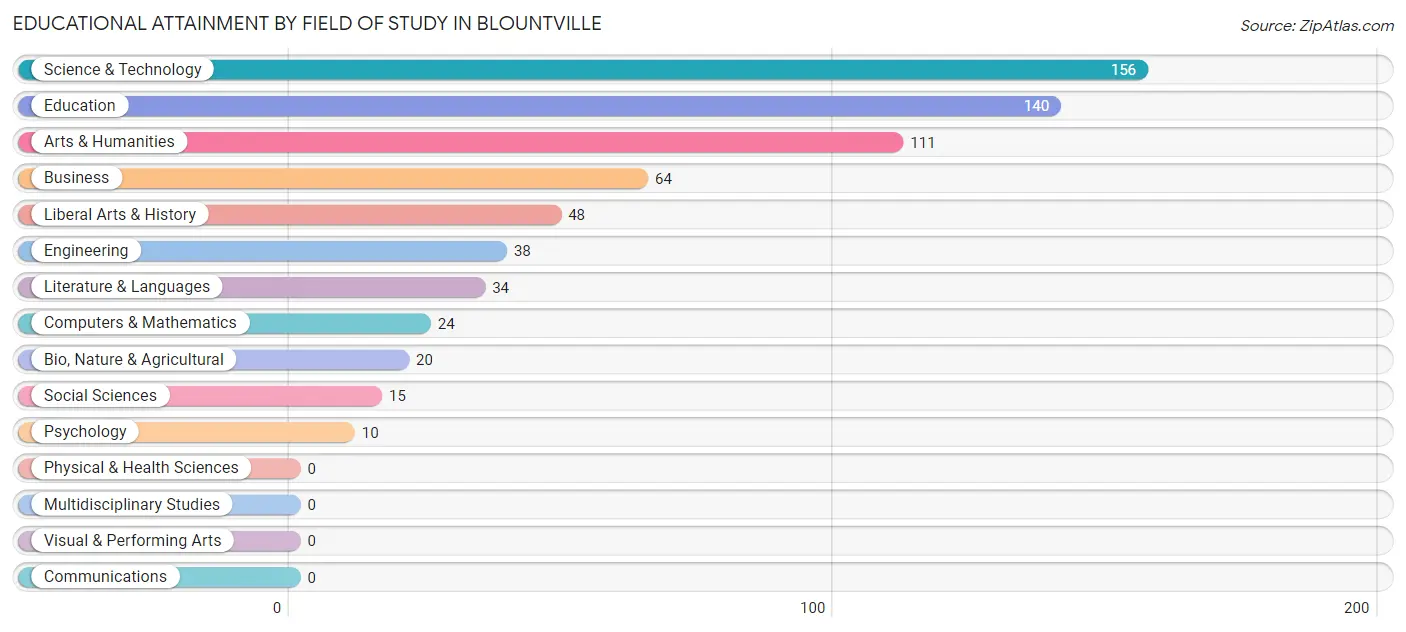
| Field of Study | # Graduates | % Graduates |
| Computers & Mathematics | 24 | 3.6% |
| Bio, Nature & Agricultural | 20 | 3.0% |
| Physical & Health Sciences | 0 | 0.0% |
| Psychology | 10 | 1.5% |
| Social Sciences | 15 | 2.3% |
| Engineering | 38 | 5.8% |
| Multidisciplinary Studies | 0 | 0.0% |
| Science & Technology | 156 | 23.6% |
| Business | 64 | 9.7% |
| Education | 140 | 21.2% |
| Literature & Languages | 34 | 5.1% |
| Liberal Arts & History | 48 | 7.3% |
| Visual & Performing Arts | 0 | 0.0% |
| Communications | 0 | 0.0% |
| Arts & Humanities | 111 | 16.8% |
| Total | 660 | 100.0% |
Transportation & Commute in Blountville
Vehicle Availability by Sex in Blountville
The most prevalent vehicle ownership categories in Blountville are males with 3 vehicles (177, accounting for 33.8%) and females with 3 vehicles (118, making up 27.7%).
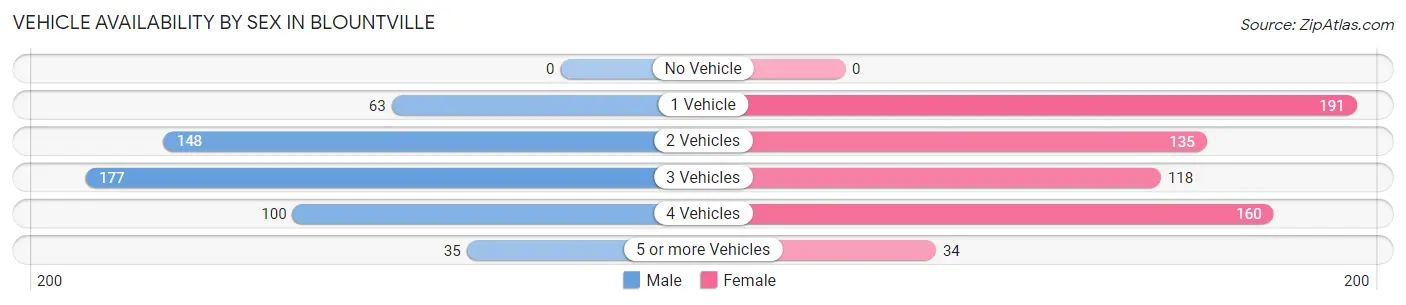
| Vehicles Available | Male | Female |
| No Vehicle | 0 (0.0%) | 0 (0.0%) |
| 1 Vehicle | 63 (12.0%) | 191 (29.9%) |
| 2 Vehicles | 148 (28.3%) | 135 (21.2%) |
| 3 Vehicles | 177 (33.8%) | 118 (18.5%) |
| 4 Vehicles | 100 (19.1%) | 160 (25.1%) |
| 5 or more Vehicles | 35 (6.7%) | 34 (5.3%) |
| Total | 523 (100.0%) | 638 (100.0%) |
Commute Time in Blountville
The most frequently occuring commute durations in Blountville are 30 to 34 minutes (165 commuters, 14.8%), 20 to 24 minutes (150 commuters, 13.5%), and 10 to 14 minutes (144 commuters, 12.9%).
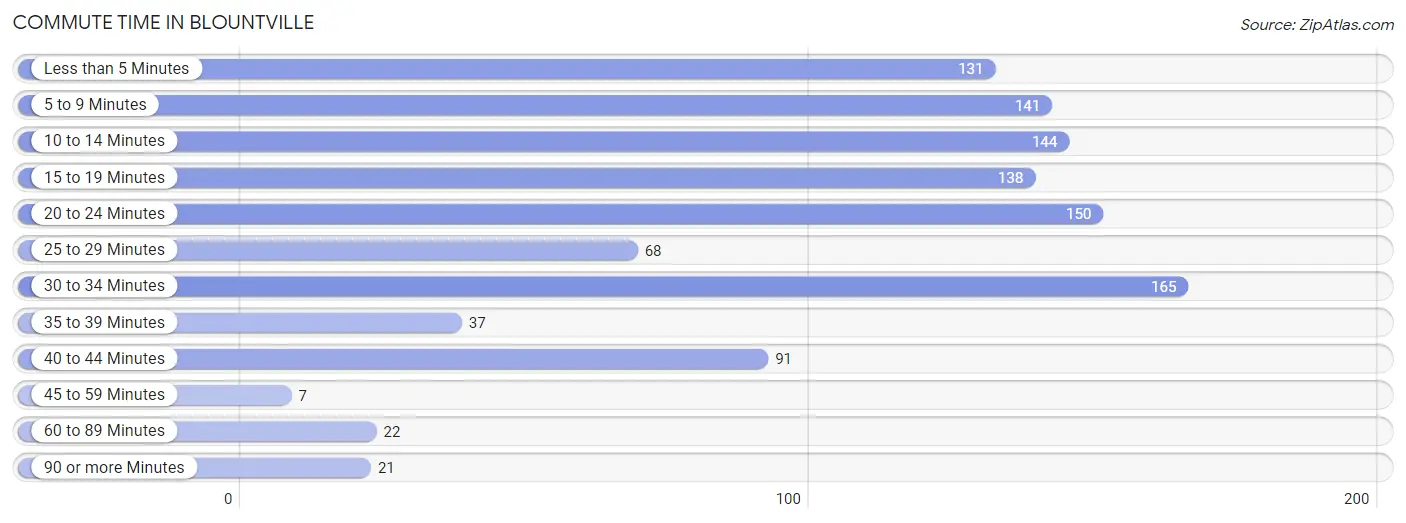
| Commute Time | # Commuters | % Commuters |
| Less than 5 Minutes | 131 | 11.7% |
| 5 to 9 Minutes | 141 | 12.7% |
| 10 to 14 Minutes | 144 | 12.9% |
| 15 to 19 Minutes | 138 | 12.4% |
| 20 to 24 Minutes | 150 | 13.5% |
| 25 to 29 Minutes | 68 | 6.1% |
| 30 to 34 Minutes | 165 | 14.8% |
| 35 to 39 Minutes | 37 | 3.3% |
| 40 to 44 Minutes | 91 | 8.2% |
| 45 to 59 Minutes | 7 | 0.6% |
| 60 to 89 Minutes | 22 | 2.0% |
| 90 or more Minutes | 21 | 1.9% |
Commute Time by Sex in Blountville
The most common commute times in Blountville are 10 to 14 minutes (86 commuters, 17.0%) for males and 20 to 24 minutes (98 commuters, 16.1%) for females.
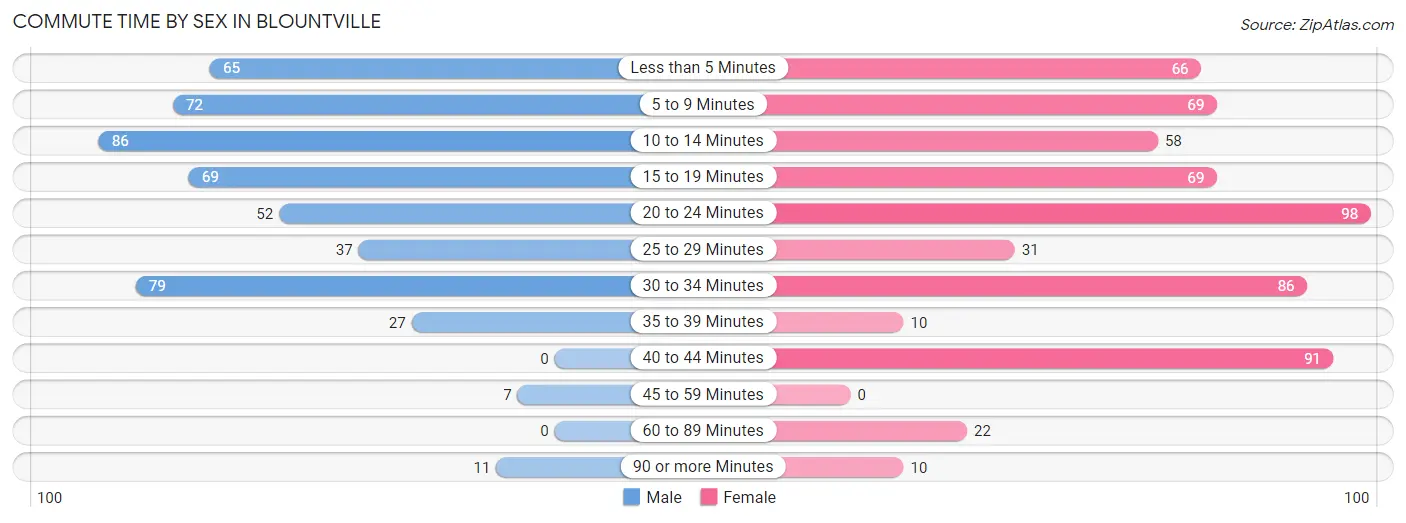
| Commute Time | Male | Female |
| Less than 5 Minutes | 65 (12.9%) | 66 (10.8%) |
| 5 to 9 Minutes | 72 (14.3%) | 69 (11.3%) |
| 10 to 14 Minutes | 86 (17.0%) | 58 (9.5%) |
| 15 to 19 Minutes | 69 (13.7%) | 69 (11.3%) |
| 20 to 24 Minutes | 52 (10.3%) | 98 (16.1%) |
| 25 to 29 Minutes | 37 (7.3%) | 31 (5.1%) |
| 30 to 34 Minutes | 79 (15.6%) | 86 (14.1%) |
| 35 to 39 Minutes | 27 (5.3%) | 10 (1.6%) |
| 40 to 44 Minutes | 0 (0.0%) | 91 (14.9%) |
| 45 to 59 Minutes | 7 (1.4%) | 0 (0.0%) |
| 60 to 89 Minutes | 0 (0.0%) | 22 (3.6%) |
| 90 or more Minutes | 11 (2.2%) | 10 (1.6%) |
Time of Departure to Work by Sex in Blountville
The most frequent times of departure to work in Blountville are 7:00 AM to 7:29 AM (97, 19.2%) for males and 7:00 AM to 7:29 AM (187, 30.7%) for females.
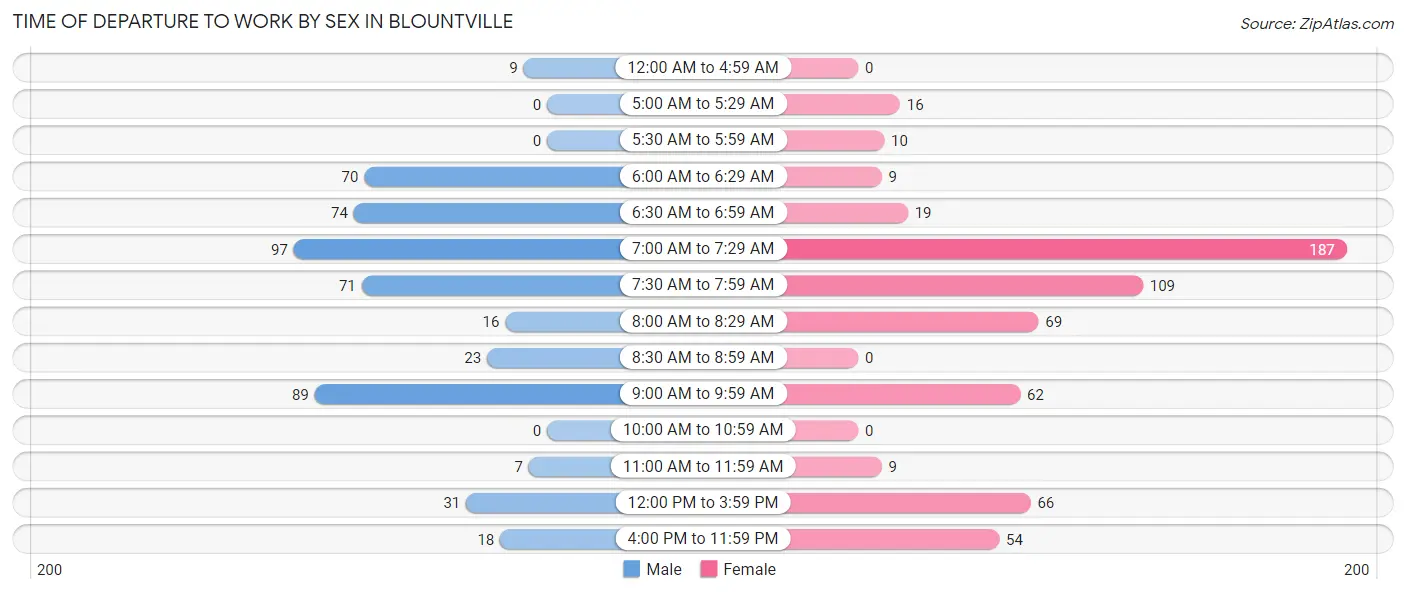
| Time of Departure | Male | Female |
| 12:00 AM to 4:59 AM | 9 (1.8%) | 0 (0.0%) |
| 5:00 AM to 5:29 AM | 0 (0.0%) | 16 (2.6%) |
| 5:30 AM to 5:59 AM | 0 (0.0%) | 10 (1.6%) |
| 6:00 AM to 6:29 AM | 70 (13.9%) | 9 (1.5%) |
| 6:30 AM to 6:59 AM | 74 (14.6%) | 19 (3.1%) |
| 7:00 AM to 7:29 AM | 97 (19.2%) | 187 (30.7%) |
| 7:30 AM to 7:59 AM | 71 (14.1%) | 109 (17.9%) |
| 8:00 AM to 8:29 AM | 16 (3.2%) | 69 (11.3%) |
| 8:30 AM to 8:59 AM | 23 (4.5%) | 0 (0.0%) |
| 9:00 AM to 9:59 AM | 89 (17.6%) | 62 (10.2%) |
| 10:00 AM to 10:59 AM | 0 (0.0%) | 0 (0.0%) |
| 11:00 AM to 11:59 AM | 7 (1.4%) | 9 (1.5%) |
| 12:00 PM to 3:59 PM | 31 (6.1%) | 66 (10.8%) |
| 4:00 PM to 11:59 PM | 18 (3.6%) | 54 (8.8%) |
| Total | 505 (100.0%) | 610 (100.0%) |
Housing Occupancy in Blountville
Occupancy by Ownership in Blountville
Of the total 1,073 dwellings in Blountville, owner-occupied units account for 886 (82.6%), while renter-occupied units make up 187 (17.4%).
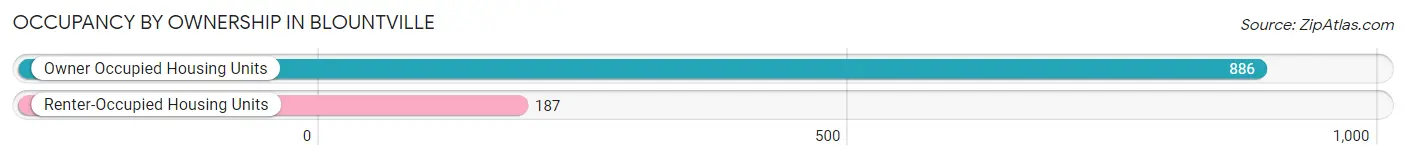
| Occupancy | # Housing Units | % Housing Units |
| Owner Occupied Housing Units | 886 | 82.6% |
| Renter-Occupied Housing Units | 187 | 17.4% |
| Total Occupied Housing Units | 1,073 | 100.0% |
Occupancy by Household Size in Blountville
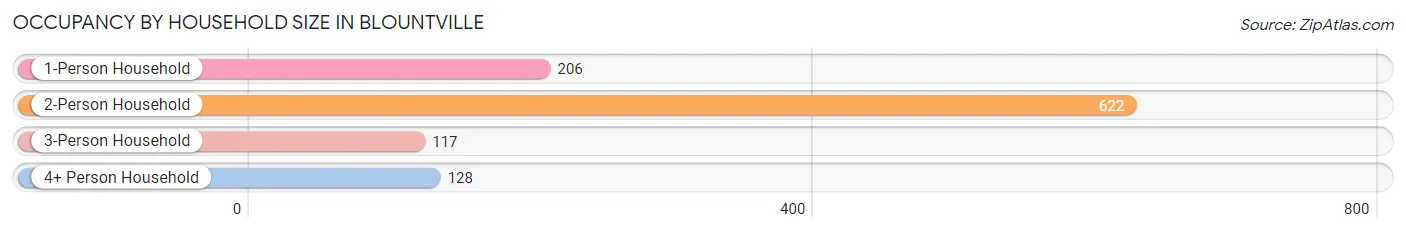
| Household Size | # Housing Units | % Housing Units |
| 1-Person Household | 206 | 19.2% |
| 2-Person Household | 622 | 58.0% |
| 3-Person Household | 117 | 10.9% |
| 4+ Person Household | 128 | 11.9% |
| Total Housing Units | 1,073 | 100.0% |
Occupancy by Ownership by Household Size in Blountville
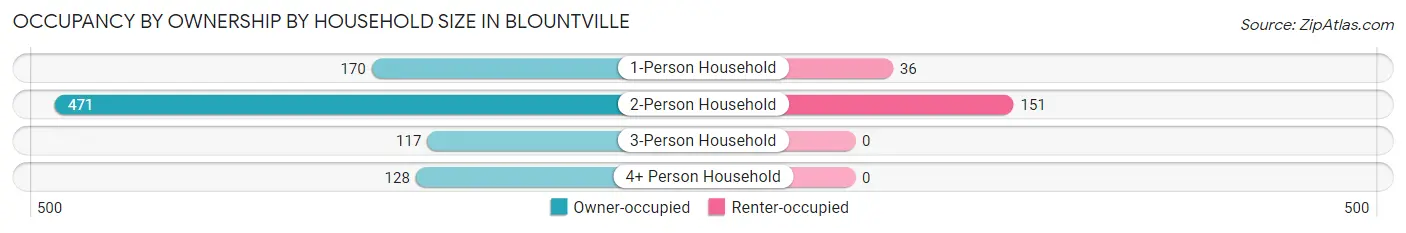
| Household Size | Owner-occupied | Renter-occupied |
| 1-Person Household | 170 (82.5%) | 36 (17.5%) |
| 2-Person Household | 471 (75.7%) | 151 (24.3%) |
| 3-Person Household | 117 (100.0%) | 0 (0.0%) |
| 4+ Person Household | 128 (100.0%) | 0 (0.0%) |
| Total Housing Units | 886 (82.6%) | 187 (17.4%) |
Occupancy by Educational Attainment in Blountville
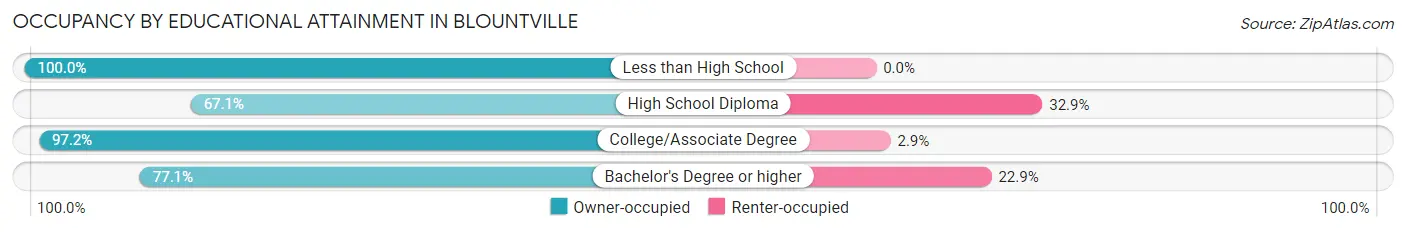
| Household Size | Owner-occupied | Renter-occupied |
| Less than High School | 99 (100.0%) | 0 (0.0%) |
| High School Diploma | 230 (67.1%) | 113 (32.9%) |
| College/Associate Degree | 341 (97.2%) | 10 (2.9%) |
| Bachelor's Degree or higher | 216 (77.1%) | 64 (22.9%) |
Occupancy by Age of Householder in Blountville
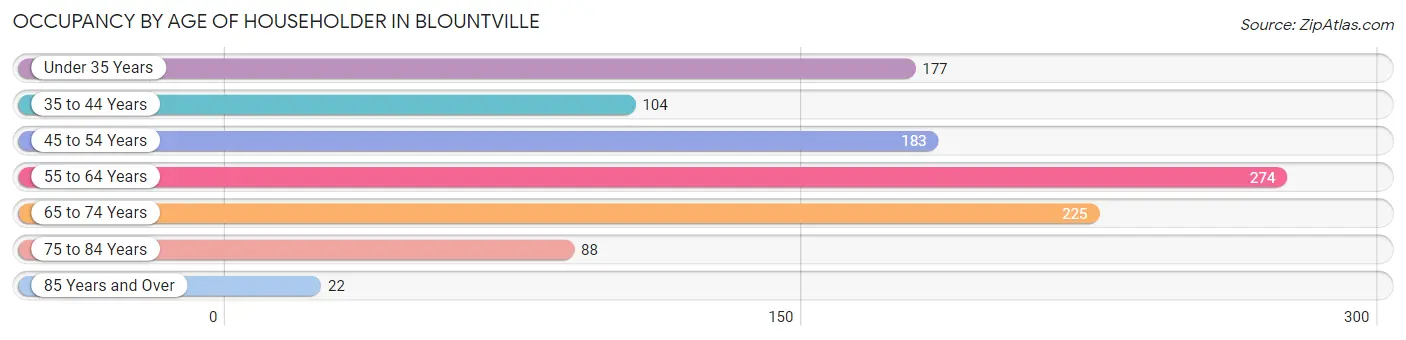
| Age Bracket | # Households | % Households |
| Under 35 Years | 177 | 16.5% |
| 35 to 44 Years | 104 | 9.7% |
| 45 to 54 Years | 183 | 17.1% |
| 55 to 64 Years | 274 | 25.5% |
| 65 to 74 Years | 225 | 21.0% |
| 75 to 84 Years | 88 | 8.2% |
| 85 Years and Over | 22 | 2.1% |
| Total | 1,073 | 100.0% |
Housing Finances in Blountville
Median Income by Occupancy in Blountville
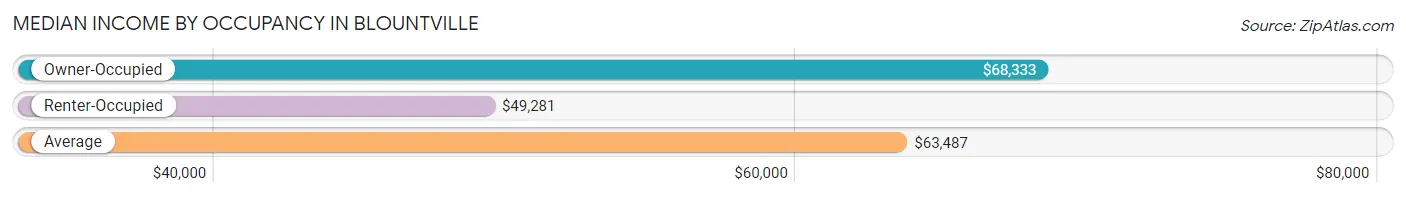
| Occupancy Type | # Households | Median Income |
| Owner-Occupied | 886 (82.6%) | $68,333 |
| Renter-Occupied | 187 (17.4%) | $49,281 |
| Average | 1,073 (100.0%) | $63,487 |
Occupancy by Householder Income Bracket in Blountville
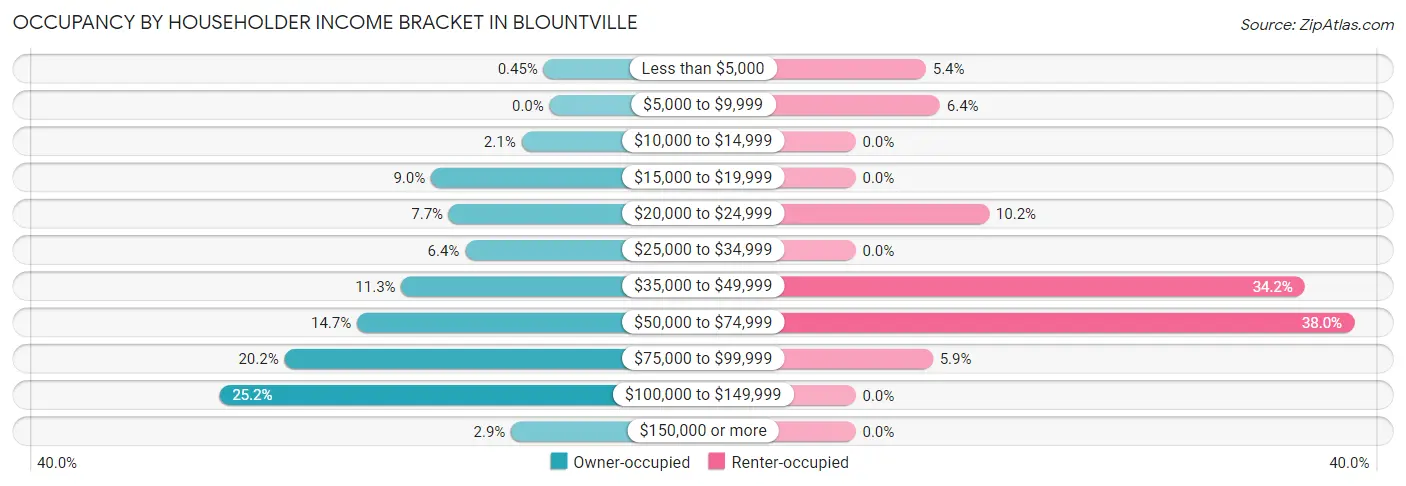
| Income Bracket | Owner-occupied | Renter-occupied |
| Less than $5,000 | 4 (0.4%) | 10 (5.3%) |
| $5,000 to $9,999 | 0 (0.0%) | 12 (6.4%) |
| $10,000 to $14,999 | 19 (2.1%) | 0 (0.0%) |
| $15,000 to $19,999 | 80 (9.0%) | 0 (0.0%) |
| $20,000 to $24,999 | 68 (7.7%) | 19 (10.2%) |
| $25,000 to $34,999 | 57 (6.4%) | 0 (0.0%) |
| $35,000 to $49,999 | 100 (11.3%) | 64 (34.2%) |
| $50,000 to $74,999 | 130 (14.7%) | 71 (38.0%) |
| $75,000 to $99,999 | 179 (20.2%) | 11 (5.9%) |
| $100,000 to $149,999 | 223 (25.2%) | 0 (0.0%) |
| $150,000 or more | 26 (2.9%) | 0 (0.0%) |
| Total | 886 (100.0%) | 187 (100.0%) |
Monthly Housing Cost Tiers in Blountville
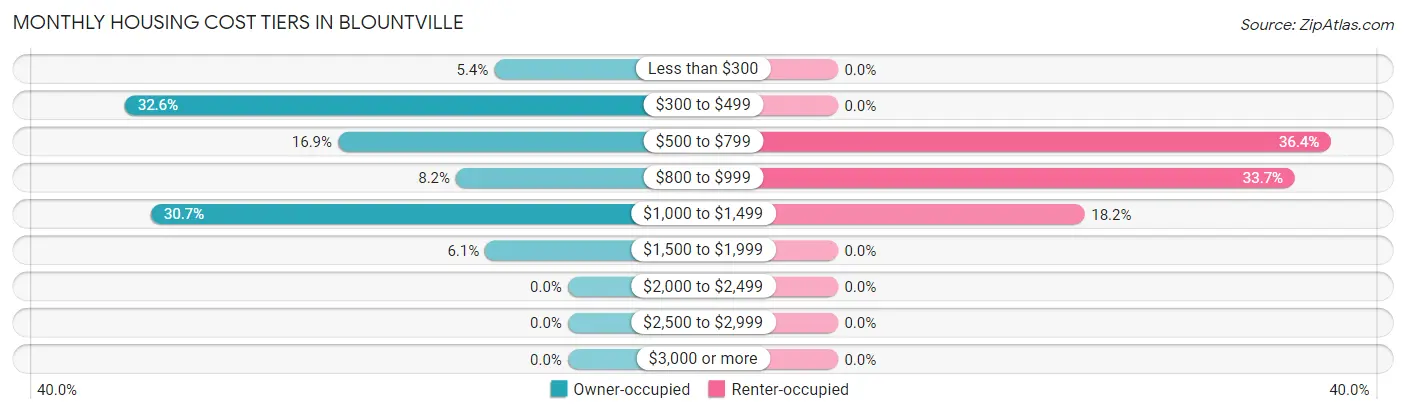
| Monthly Cost | Owner-occupied | Renter-occupied |
| Less than $300 | 48 (5.4%) | 0 (0.0%) |
| $300 to $499 | 289 (32.6%) | 0 (0.0%) |
| $500 to $799 | 150 (16.9%) | 68 (36.4%) |
| $800 to $999 | 73 (8.2%) | 63 (33.7%) |
| $1,000 to $1,499 | 272 (30.7%) | 34 (18.2%) |
| $1,500 to $1,999 | 54 (6.1%) | 0 (0.0%) |
| $2,000 to $2,499 | 0 (0.0%) | 0 (0.0%) |
| $2,500 to $2,999 | 0 (0.0%) | 0 (0.0%) |
| $3,000 or more | 0 (0.0%) | 0 (0.0%) |
| Total | 886 (100.0%) | 187 (100.0%) |
Physical Housing Characteristics in Blountville
Housing Structures in Blountville
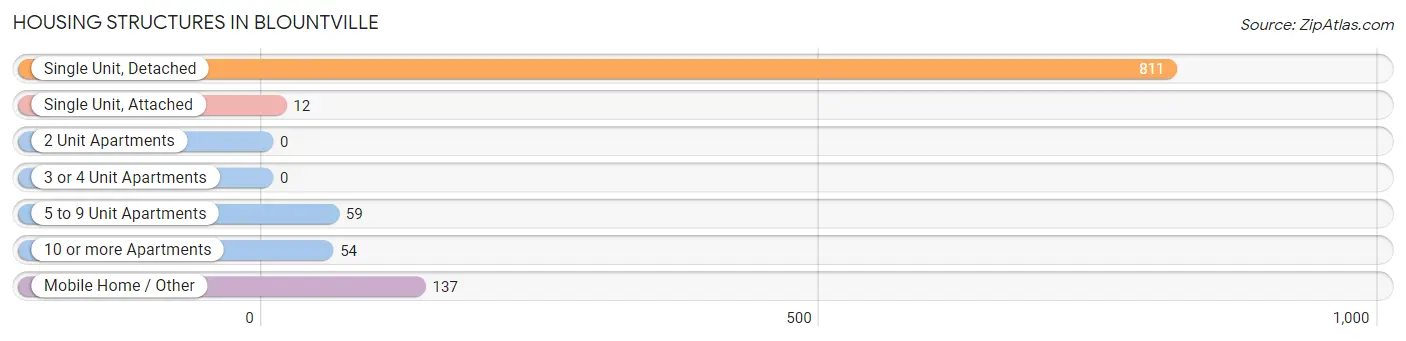
| Structure Type | # Housing Units | % Housing Units |
| Single Unit, Detached | 811 | 75.6% |
| Single Unit, Attached | 12 | 1.1% |
| 2 Unit Apartments | 0 | 0.0% |
| 3 or 4 Unit Apartments | 0 | 0.0% |
| 5 to 9 Unit Apartments | 59 | 5.5% |
| 10 or more Apartments | 54 | 5.0% |
| Mobile Home / Other | 137 | 12.8% |
| Total | 1,073 | 100.0% |
Housing Structures by Occupancy in Blountville
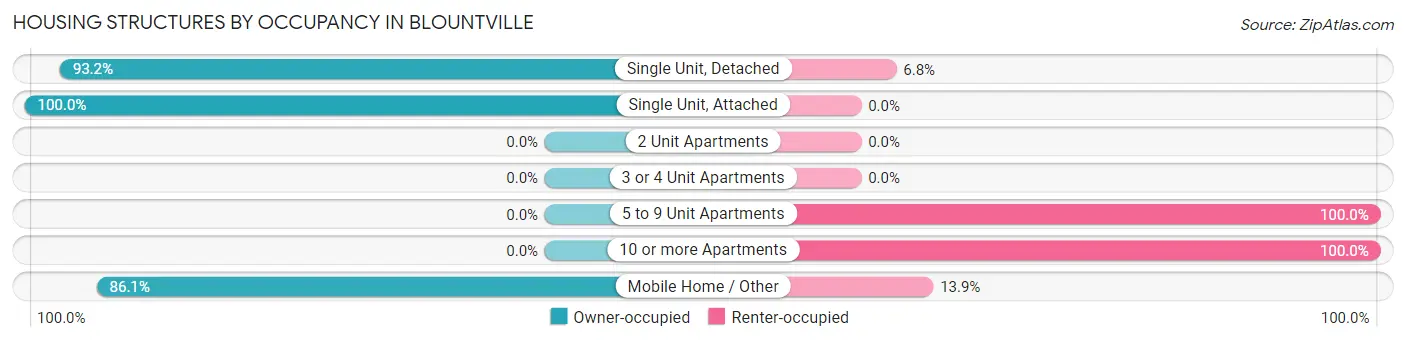
| Structure Type | Owner-occupied | Renter-occupied |
| Single Unit, Detached | 756 (93.2%) | 55 (6.8%) |
| Single Unit, Attached | 12 (100.0%) | 0 (0.0%) |
| 2 Unit Apartments | 0 (0.0%) | 0 (0.0%) |
| 3 or 4 Unit Apartments | 0 (0.0%) | 0 (0.0%) |
| 5 to 9 Unit Apartments | 0 (0.0%) | 59 (100.0%) |
| 10 or more Apartments | 0 (0.0%) | 54 (100.0%) |
| Mobile Home / Other | 118 (86.1%) | 19 (13.9%) |
| Total | 886 (82.6%) | 187 (17.4%) |
Housing Structures by Number of Rooms in Blountville
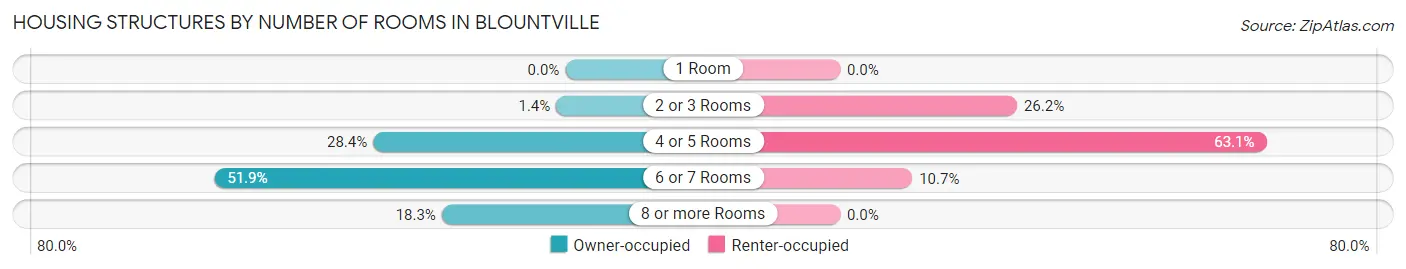
| Number of Rooms | Owner-occupied | Renter-occupied |
| 1 Room | 0 (0.0%) | 0 (0.0%) |
| 2 or 3 Rooms | 12 (1.3%) | 49 (26.2%) |
| 4 or 5 Rooms | 252 (28.4%) | 118 (63.1%) |
| 6 or 7 Rooms | 460 (51.9%) | 20 (10.7%) |
| 8 or more Rooms | 162 (18.3%) | 0 (0.0%) |
| Total | 886 (100.0%) | 187 (100.0%) |
Housing Structure by Heating Type in Blountville
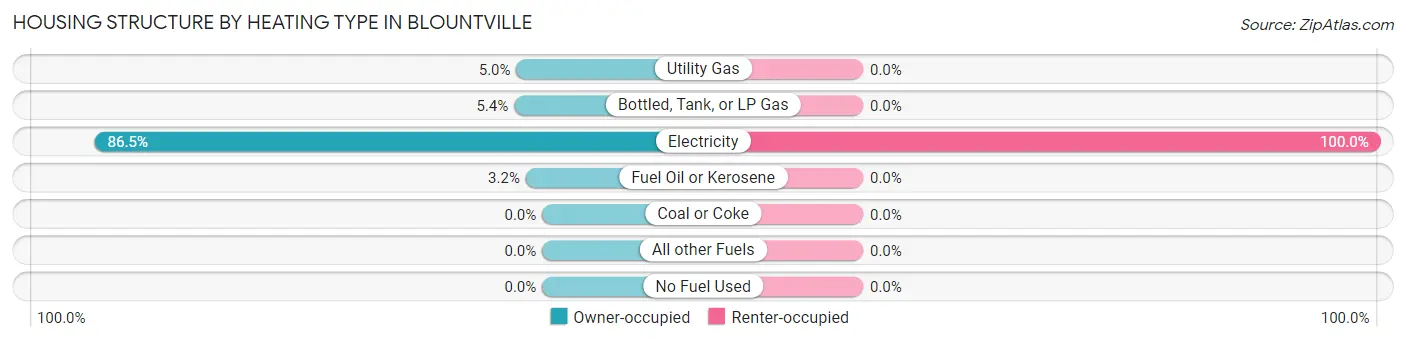
| Heating Type | Owner-occupied | Renter-occupied |
| Utility Gas | 44 (5.0%) | 0 (0.0%) |
| Bottled, Tank, or LP Gas | 48 (5.4%) | 0 (0.0%) |
| Electricity | 766 (86.5%) | 187 (100.0%) |
| Fuel Oil or Kerosene | 28 (3.2%) | 0 (0.0%) |
| Coal or Coke | 0 (0.0%) | 0 (0.0%) |
| All other Fuels | 0 (0.0%) | 0 (0.0%) |
| No Fuel Used | 0 (0.0%) | 0 (0.0%) |
| Total | 886 (100.0%) | 187 (100.0%) |
Household Vehicle Usage in Blountville
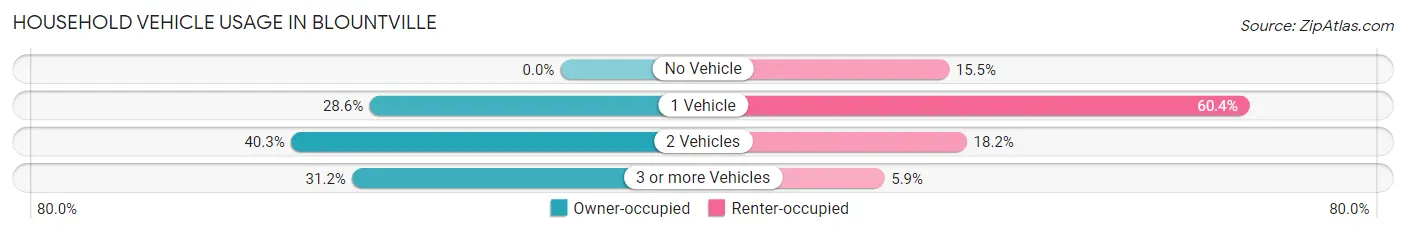
| Vehicles per Household | Owner-occupied | Renter-occupied |
| No Vehicle | 0 (0.0%) | 29 (15.5%) |
| 1 Vehicle | 253 (28.6%) | 113 (60.4%) |
| 2 Vehicles | 357 (40.3%) | 34 (18.2%) |
| 3 or more Vehicles | 276 (31.1%) | 11 (5.9%) |
| Total | 886 (100.0%) | 187 (100.0%) |
Real Estate & Mortgages in Blountville
Real Estate and Mortgage Overview in Blountville
| Characteristic | Without Mortgage | With Mortgage |
| Housing Units | 442 | 444 |
| Median Property Value | $124,800 | $184,600 |
| Median Household Income | $46,250 | $26 |
| Monthly Housing Costs | $382 | $0 |
| Real Estate Taxes | $779 | $12 |
Property Value by Mortgage Status in Blountville
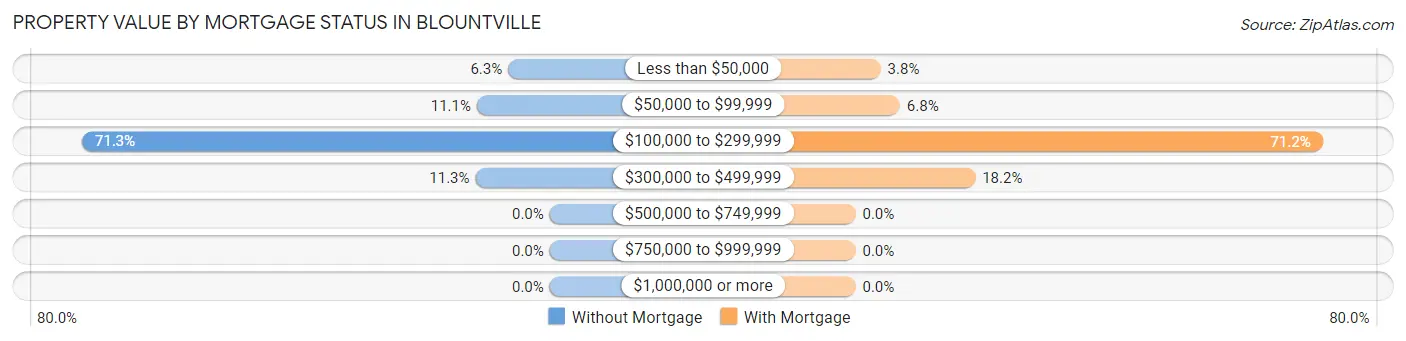
| Property Value | Without Mortgage | With Mortgage |
| Less than $50,000 | 28 (6.3%) | 17 (3.8%) |
| $50,000 to $99,999 | 49 (11.1%) | 30 (6.8%) |
| $100,000 to $299,999 | 315 (71.3%) | 316 (71.2%) |
| $300,000 to $499,999 | 50 (11.3%) | 81 (18.2%) |
| $500,000 to $749,999 | 0 (0.0%) | 0 (0.0%) |
| $750,000 to $999,999 | 0 (0.0%) | 0 (0.0%) |
| $1,000,000 or more | 0 (0.0%) | 0 (0.0%) |
| Total | 442 (100.0%) | 444 (100.0%) |
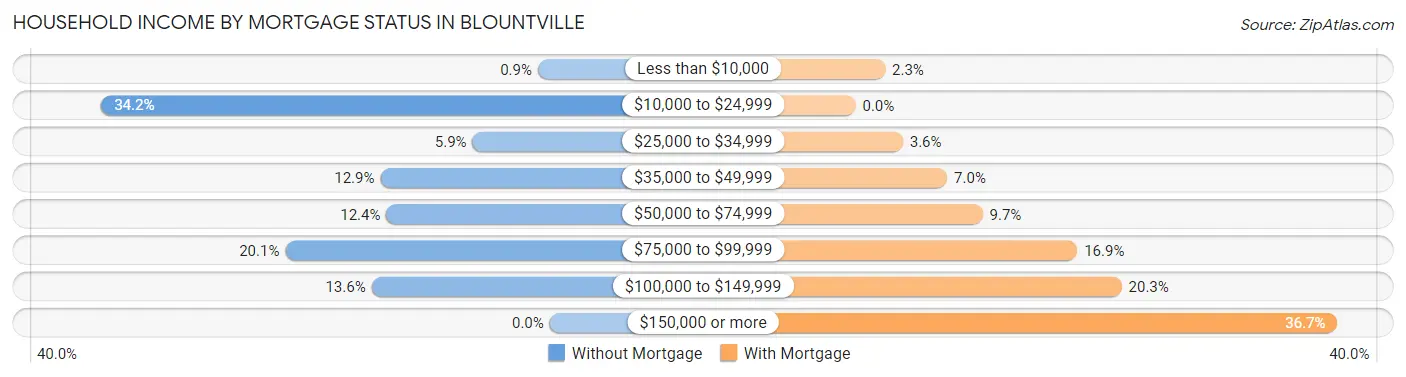
Household Income by Mortgage Status in Blountville
| Household Income | Without Mortgage | With Mortgage |
| Less than $10,000 | 4 (0.9%) | 10 (2.2%) |
| $10,000 to $24,999 | 151 (34.2%) | 0 (0.0%) |
| $25,000 to $34,999 | 26 (5.9%) | 16 (3.6%) |
| $35,000 to $49,999 | 57 (12.9%) | 31 (7.0%) |
| $50,000 to $74,999 | 55 (12.4%) | 43 (9.7%) |
| $75,000 to $99,999 | 89 (20.1%) | 75 (16.9%) |
| $100,000 to $149,999 | 60 (13.6%) | 90 (20.3%) |
| $150,000 or more | 0 (0.0%) | 163 (36.7%) |
| Total | 442 (100.0%) | 444 (100.0%) |
Property Value to Household Income Ratio in Blountville
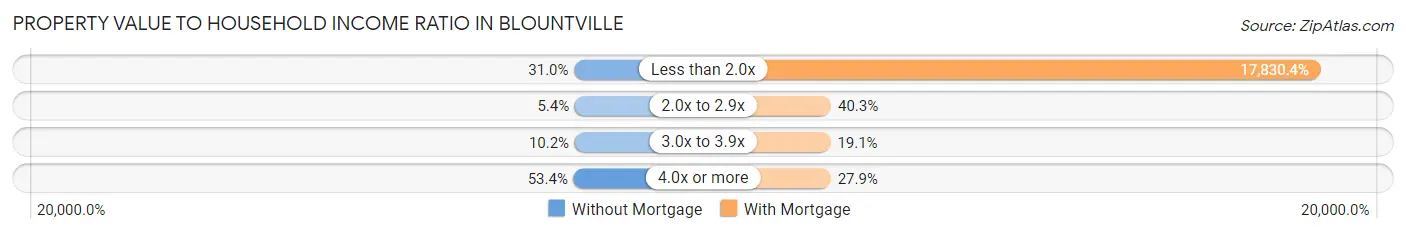
| Value-to-Income Ratio | Without Mortgage | With Mortgage |
| Less than 2.0x | 137 (31.0%) | 79,167 (17,830.4%) |
| 2.0x to 2.9x | 24 (5.4%) | 179 (40.3%) |
| 3.0x to 3.9x | 45 (10.2%) | 85 (19.1%) |
| 4.0x or more | 236 (53.4%) | 124 (27.9%) |
| Total | 442 (100.0%) | 444 (100.0%) |
Real Estate Taxes by Mortgage Status in Blountville
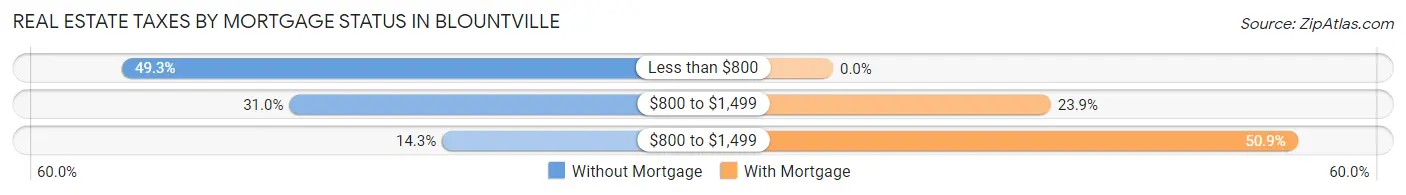
| Property Taxes | Without Mortgage | With Mortgage |
| Less than $800 | 218 (49.3%) | 0 (0.0%) |
| $800 to $1,499 | 137 (31.0%) | 106 (23.9%) |
| $800 to $1,499 | 63 (14.2%) | 226 (50.9%) |
| Total | 442 (100.0%) | 444 (100.0%) |
Health & Disability in Blountville
Health Insurance Coverage by Age in Blountville
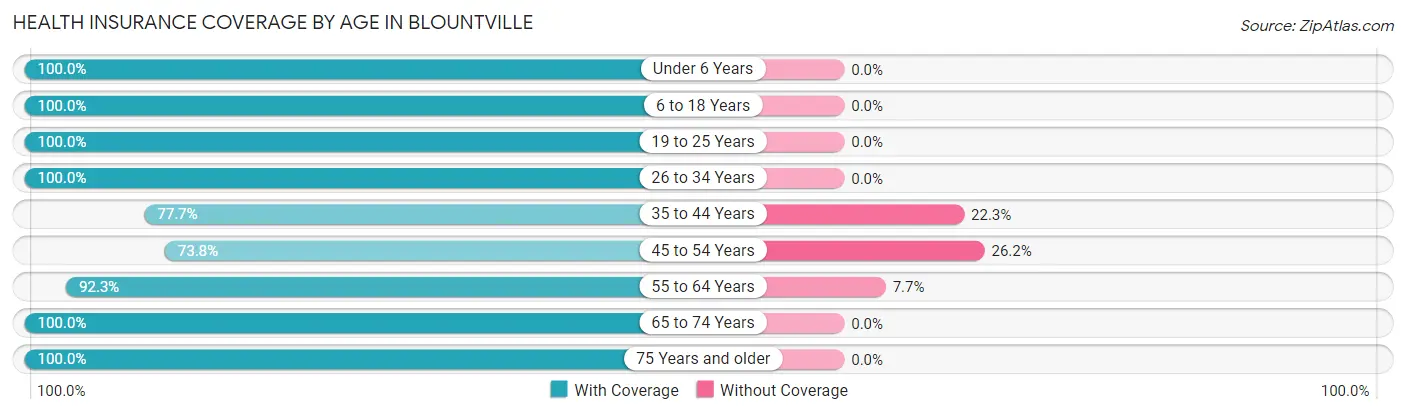
| Age Bracket | With Coverage | Without Coverage |
| Under 6 Years | 150 (100.0%) | 0 (0.0%) |
| 6 to 18 Years | 235 (100.0%) | 0 (0.0%) |
| 19 to 25 Years | 100 (100.0%) | 0 (0.0%) |
| 26 to 34 Years | 357 (100.0%) | 0 (0.0%) |
| 35 to 44 Years | 212 (77.7%) | 61 (22.3%) |
| 45 to 54 Years | 254 (73.8%) | 90 (26.2%) |
| 55 to 64 Years | 442 (92.3%) | 37 (7.7%) |
| 65 to 74 Years | 376 (100.0%) | 0 (0.0%) |
| 75 Years and older | 172 (100.0%) | 0 (0.0%) |
| Total | 2,298 (92.4%) | 188 (7.6%) |
Health Insurance Coverage by Citizenship Status in Blountville
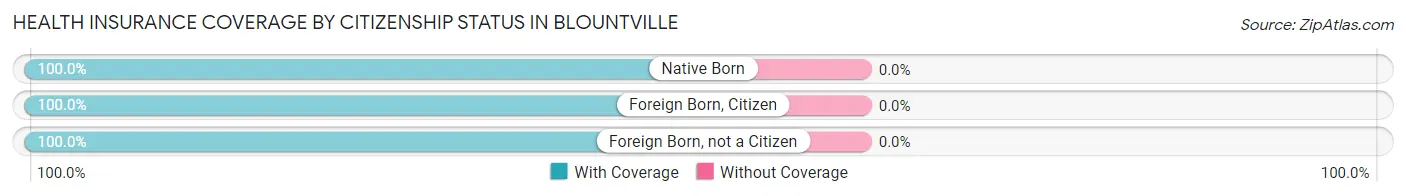
| Citizenship Status | With Coverage | Without Coverage |
| Native Born | 150 (100.0%) | 0 (0.0%) |
| Foreign Born, Citizen | 235 (100.0%) | 0 (0.0%) |
| Foreign Born, not a Citizen | 100 (100.0%) | 0 (0.0%) |
Health Insurance Coverage by Household Income in Blountville
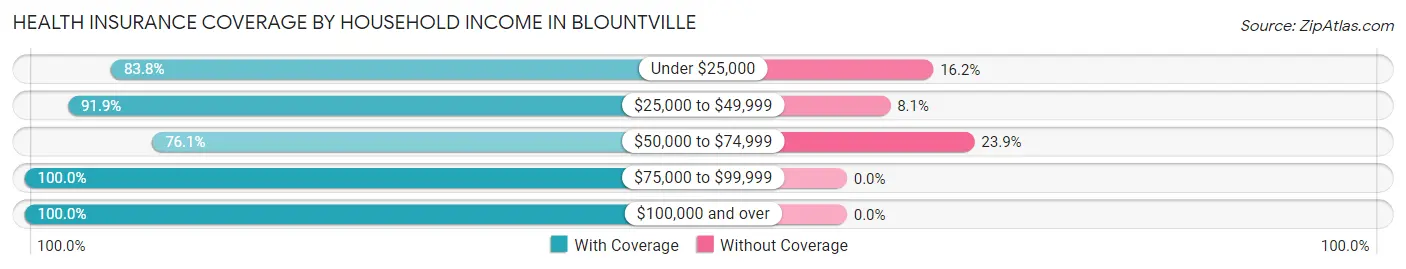
| Household Income | With Coverage | Without Coverage |
| Under $25,000 | 233 (83.8%) | 45 (16.2%) |
| $25,000 to $49,999 | 373 (91.9%) | 33 (8.1%) |
| $50,000 to $74,999 | 350 (76.1%) | 110 (23.9%) |
| $75,000 to $99,999 | 590 (100.0%) | 0 (0.0%) |
| $100,000 and over | 749 (100.0%) | 0 (0.0%) |
Public vs Private Health Insurance Coverage by Age in Blountville
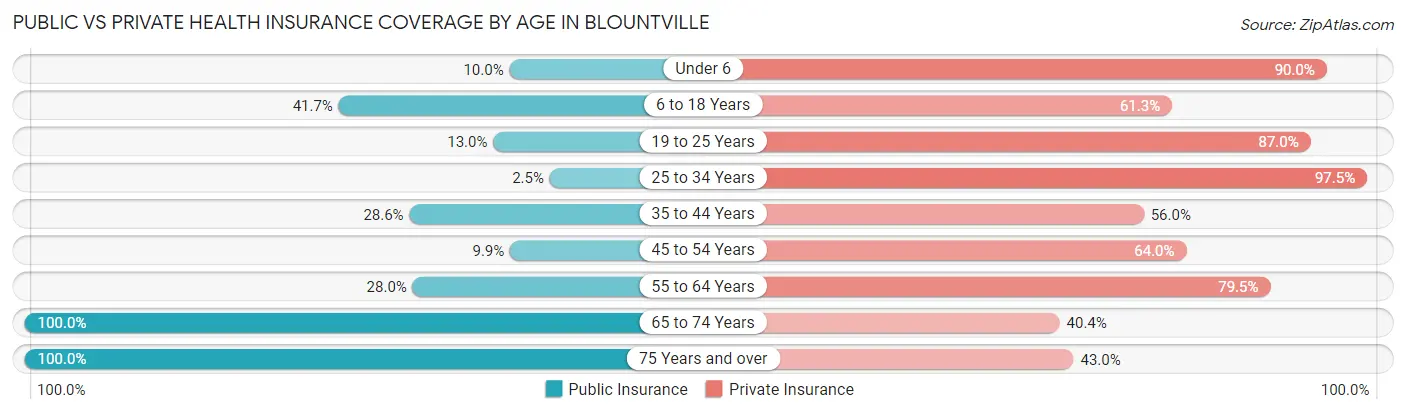
| Age Bracket | Public Insurance | Private Insurance |
| Under 6 | 15 (10.0%) | 135 (90.0%) |
| 6 to 18 Years | 98 (41.7%) | 144 (61.3%) |
| 19 to 25 Years | 13 (13.0%) | 87 (87.0%) |
| 25 to 34 Years | 9 (2.5%) | 348 (97.5%) |
| 35 to 44 Years | 78 (28.6%) | 153 (56.0%) |
| 45 to 54 Years | 34 (9.9%) | 220 (63.9%) |
| 55 to 64 Years | 134 (28.0%) | 381 (79.5%) |
| 65 to 74 Years | 376 (100.0%) | 152 (40.4%) |
| 75 Years and over | 172 (100.0%) | 74 (43.0%) |
| Total | 929 (37.4%) | 1,694 (68.1%) |
Disability Status by Sex by Age in Blountville
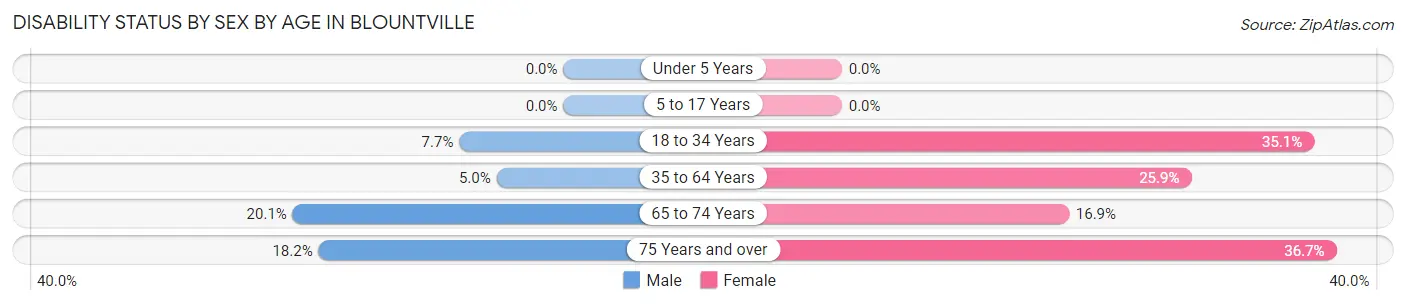
| Age Bracket | Male | Female |
| Under 5 Years | 0 (0.0%) | 0 (0.0%) |
| 5 to 17 Years | 0 (0.0%) | 0 (0.0%) |
| 18 to 34 Years | 15 (7.7%) | 95 (35.1%) |
| 35 to 64 Years | 28 (5.0%) | 138 (25.9%) |
| 65 to 74 Years | 41 (20.1%) | 29 (16.9%) |
| 75 Years and over | 8 (18.2%) | 47 (36.7%) |
Disability Class by Sex by Age in Blountville
Disability Class: Hearing Difficulty
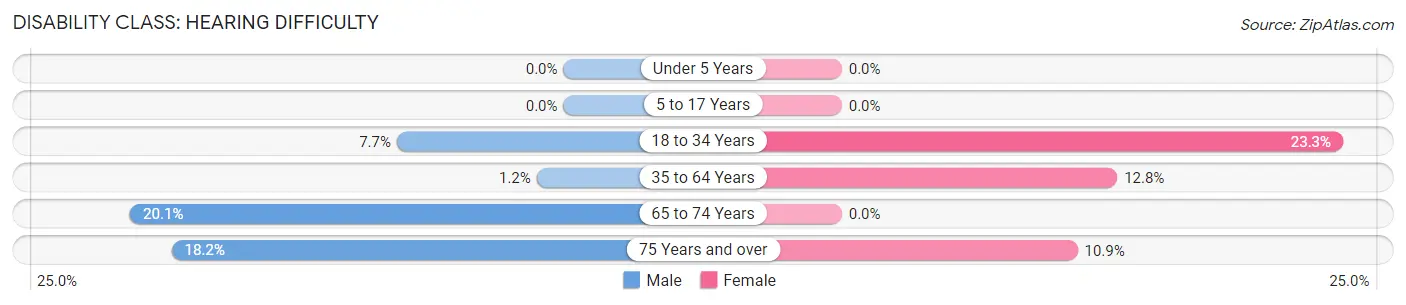
| Age Bracket | Male | Female |
| Under 5 Years | 0 (0.0%) | 0 (0.0%) |
| 5 to 17 Years | 0 (0.0%) | 0 (0.0%) |
| 18 to 34 Years | 15 (7.7%) | 63 (23.3%) |
| 35 to 64 Years | 7 (1.2%) | 68 (12.8%) |
| 65 to 74 Years | 41 (20.1%) | 0 (0.0%) |
| 75 Years and over | 8 (18.2%) | 14 (10.9%) |
Disability Class: Vision Difficulty
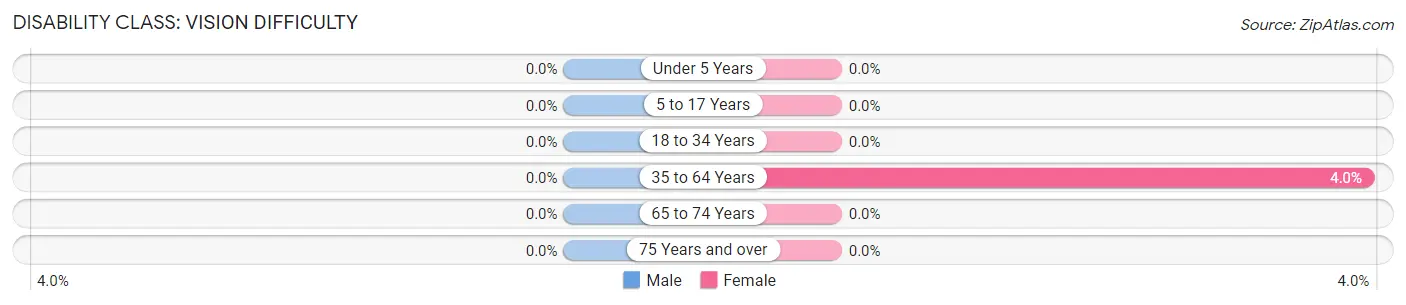
| Age Bracket | Male | Female |
| Under 5 Years | 0 (0.0%) | 0 (0.0%) |
| 5 to 17 Years | 0 (0.0%) | 0 (0.0%) |
| 18 to 34 Years | 0 (0.0%) | 0 (0.0%) |
| 35 to 64 Years | 0 (0.0%) | 21 (4.0%) |
| 65 to 74 Years | 0 (0.0%) | 0 (0.0%) |
| 75 Years and over | 0 (0.0%) | 0 (0.0%) |
Disability Class: Cognitive Difficulty
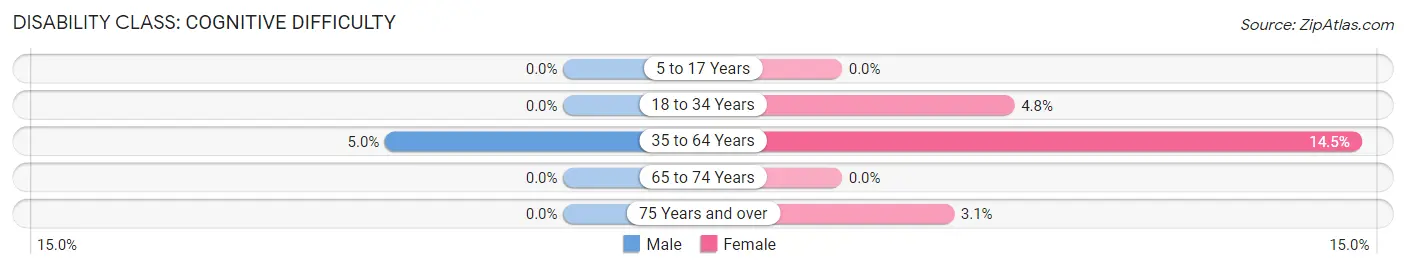
| Age Bracket | Male | Female |
| 5 to 17 Years | 0 (0.0%) | 0 (0.0%) |
| 18 to 34 Years | 0 (0.0%) | 13 (4.8%) |
| 35 to 64 Years | 28 (5.0%) | 77 (14.5%) |
| 65 to 74 Years | 0 (0.0%) | 0 (0.0%) |
| 75 Years and over | 0 (0.0%) | 4 (3.1%) |
Disability Class: Ambulatory Difficulty
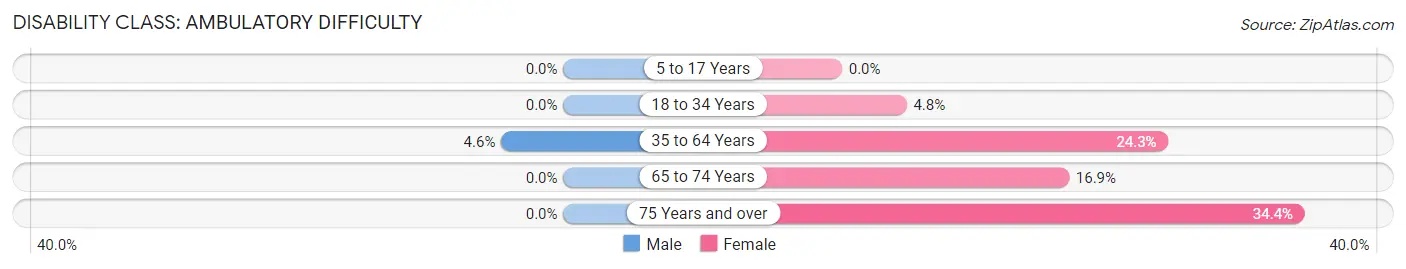
| Age Bracket | Male | Female |
| 5 to 17 Years | 0 (0.0%) | 0 (0.0%) |
| 18 to 34 Years | 0 (0.0%) | 13 (4.8%) |
| 35 to 64 Years | 26 (4.6%) | 129 (24.2%) |
| 65 to 74 Years | 0 (0.0%) | 29 (16.9%) |
| 75 Years and over | 0 (0.0%) | 44 (34.4%) |
Disability Class: Self-Care Difficulty
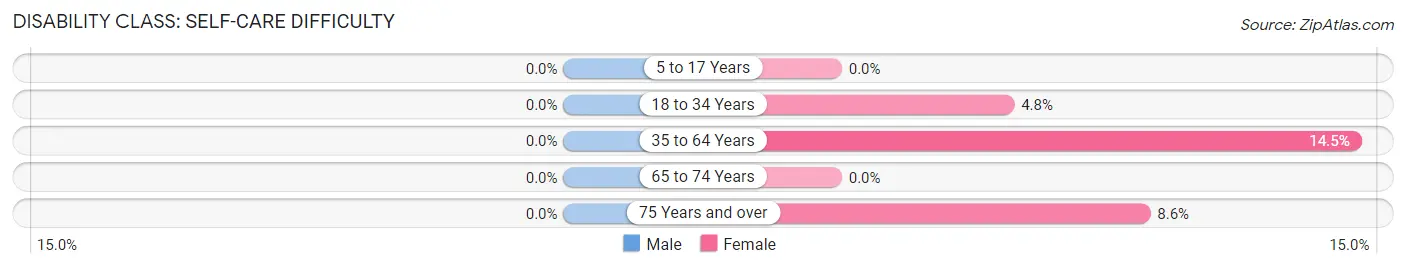
| Age Bracket | Male | Female |
| 5 to 17 Years | 0 (0.0%) | 0 (0.0%) |
| 18 to 34 Years | 0 (0.0%) | 13 (4.8%) |
| 35 to 64 Years | 0 (0.0%) | 77 (14.5%) |
| 65 to 74 Years | 0 (0.0%) | 0 (0.0%) |
| 75 Years and over | 0 (0.0%) | 11 (8.6%) |
Technology Access in Blountville
Computing Device Access in Blountville
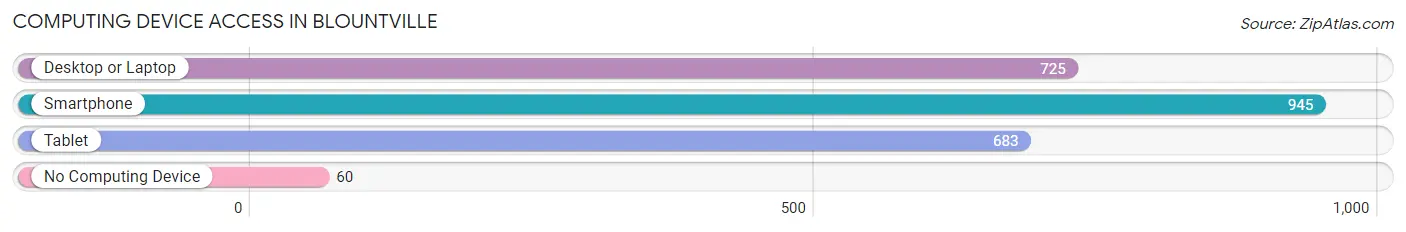
| Device Type | # Households | % Households |
| Desktop or Laptop | 725 | 67.6% |
| Smartphone | 945 | 88.1% |
| Tablet | 683 | 63.6% |
| No Computing Device | 60 | 5.6% |
| Total | 1,073 | 100.0% |
Internet Access in Blountville
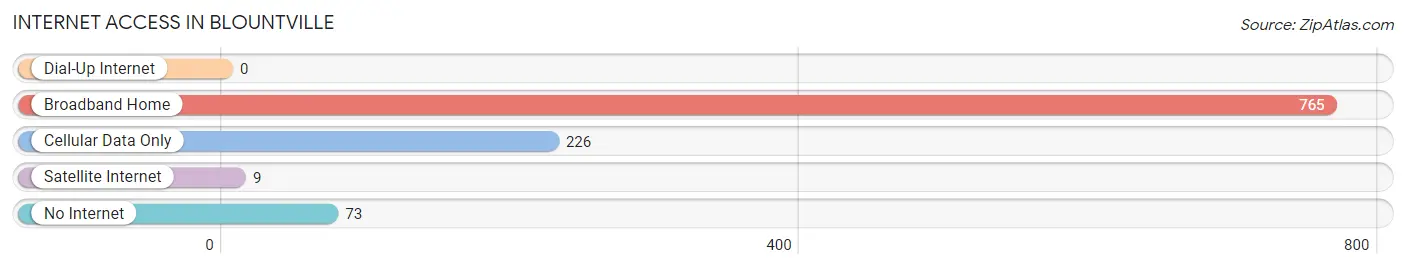
| Internet Type | # Households | % Households |
| Dial-Up Internet | 0 | 0.0% |
| Broadband Home | 765 | 71.3% |
| Cellular Data Only | 226 | 21.1% |
| Satellite Internet | 9 | 0.8% |
| No Internet | 73 | 6.8% |
| Total | 1,073 | 100.0% |
Blountville Summary
Blountville is a small town located in Sullivan County, Tennessee. It is situated in the foothills of the Appalachian Mountains and is part of the Tri-Cities region, which includes Johnson City, Kingsport, and Bristol. The town was founded in 1795 and is named after William Blount, the first governor of Tennessee. Blountville is home to approximately 5,000 people and is the county seat of Sullivan County.
History
Blountville was founded in 1795 by William Blount, the first governor of Tennessee. The town was originally known as Blountville Station and was a stop on the stagecoach line between Knoxville and Abingdon, Virginia. In 1802, the town was officially incorporated and renamed Blountville.
During the Civil War, Blountville was the site of a major battle between Union and Confederate forces. The Battle of Blountville was fought on November 8, 1863 and resulted in a Confederate victory.
In the late 19th century, Blountville began to grow and develop. The town was home to several businesses, including a flour mill, a sawmill, and a tannery. In the early 20th century, the town was home to several factories, including a cotton mill and a furniture factory.
Geography
Blountville is located in Sullivan County, Tennessee. It is situated in the foothills of the Appalachian Mountains and is part of the Tri-Cities region, which includes Johnson City, Kingsport, and Bristol. The town is located along the Holston River and is approximately 20 miles northeast of Johnson City and 30 miles southwest of Bristol.
The town has a total area of 4.2 square miles, all of which is land. The terrain is mostly flat with some rolling hills. The climate is humid subtropical, with hot, humid summers and mild winters.
Economy
The economy of Blountville is largely based on agriculture and manufacturing. The town is home to several farms, which produce a variety of crops, including corn, soybeans, and tobacco. The town is also home to several factories, including a furniture factory and a cotton mill.
In addition to agriculture and manufacturing, Blountville is home to several businesses, including restaurants, retail stores, and professional services. The town is also home to several educational institutions, including Northeast State Community College and the University of Tennessee at Knoxville.
Demographics
As of the 2010 census, Blountville had a population of 5,063. The racial makeup of the town was 95.3% White, 1.7% African American, 0.3% Native American, 0.7% Asian, 0.1% Pacific Islander, 0.7% from other races, and 1.2% from two or more races. Hispanic or Latino of any race were 2.2% of the population.
The median household income in Blountville was $37,917, and the median family income was $45,938. The per capita income was $20,945. About 11.3% of families and 14.2% of the population were below the poverty line, including 19.2% of those under age 18 and 11.2% of those age 65 or over.
Common Questions
What is Per Capita Income in Blountville?
Per Capita income in Blountville is $25,216.
What is the Median Family Income in Blountville?
Median Family Income in Blountville is $77,245.
What is the Median Household income in Blountville?
Median Household Income in Blountville is $63,487.
What is Income or Wage Gap in Blountville?
Income or Wage Gap in Blountville is 38.2%.
Women in Blountville earn 61.8 cents for every dollar earned by a man.
What is Family Income Deficit in Blountville?
Family Income Deficit in Blountville is $3,591.
Families that are below poverty line in Blountville earn $3,591 less on average than the poverty threshold level.
What is Inequality or Gini Index in Blountville?
Inequality or Gini Index in Blountville is 0.34.
What is the Total Population of Blountville?
Total Population of Blountville is 3,265.
What is the Total Male Population of Blountville?
Total Male Population of Blountville is 1,866.
What is the Total Female Population of Blountville?
Total Female Population of Blountville is 1,399.
What is the Ratio of Males per 100 Females in Blountville?
There are 133.38 Males per 100 Females in Blountville.
What is the Ratio of Females per 100 Males in Blountville?
There are 74.97 Females per 100 Males in Blountville.
What is the Median Population Age in Blountville?
Median Population Age in Blountville is 43.2 Years.
What is the Average Family Size in Blountville
Average Family Size in Blountville is 2.7 People.
What is the Average Household Size in Blountville
Average Household Size in Blountville is 2.3 People.
How Large is the Labor Force in Blountville?
There are 1,375 People in the Labor Forcein in Blountville.
What is the Percentage of People in the Labor Force in Blountville?
46.8% of People are in the Labor Force in Blountville.
What is the Unemployment Rate in Blountville?
Unemployment Rate in Blountville is 6.5%.