Zip Codes with the Highest Percentage of Population Employed in Security & Protection in Johnson City, TN
RELATED REPORTS & OPTIONS
Security & Protection
Johnson City
Compare Zip Codes
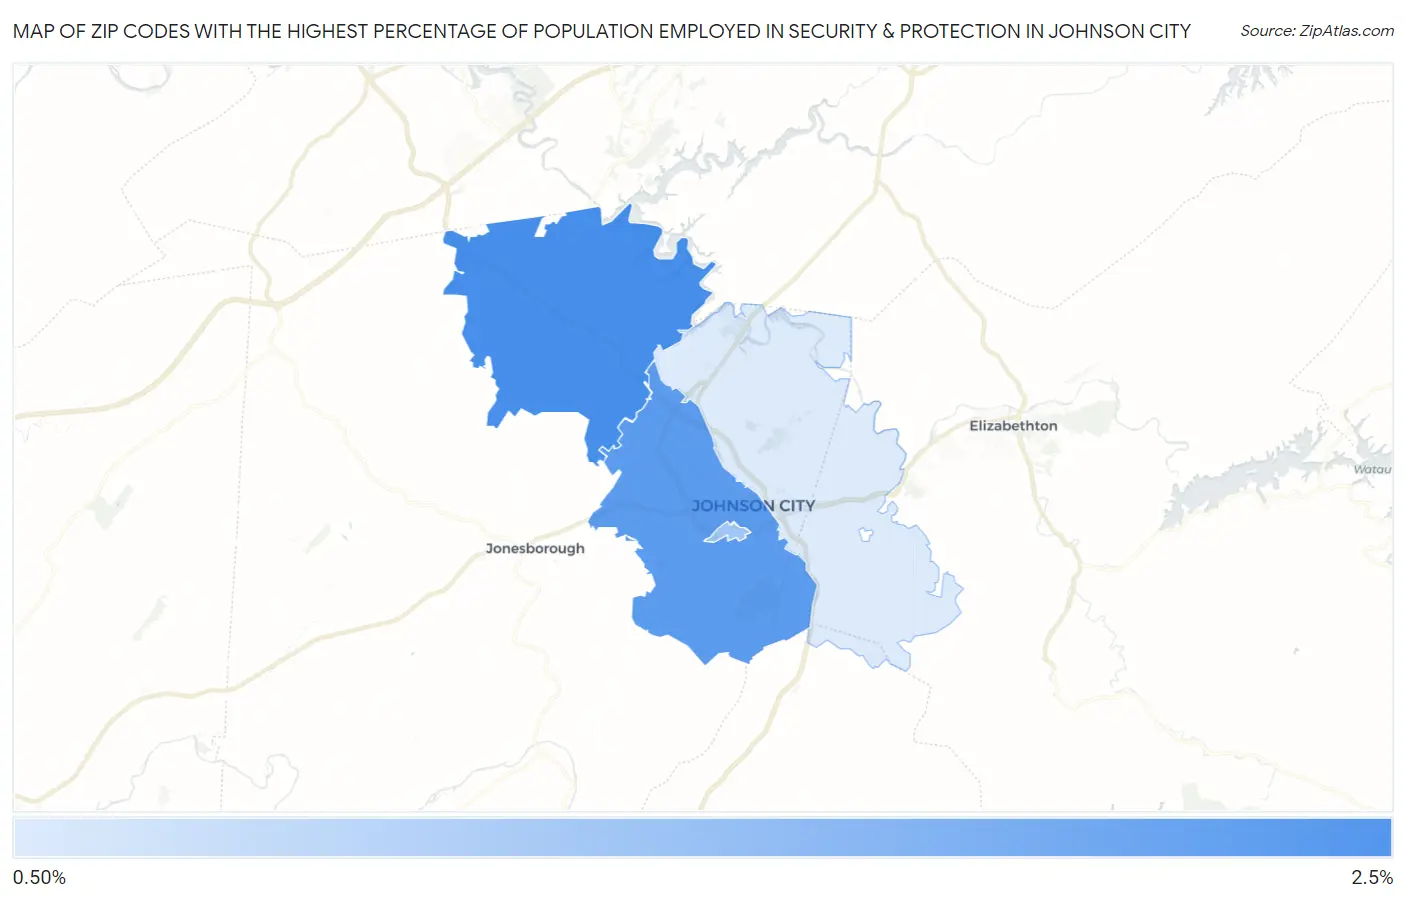
Map of Zip Codes with the Highest Percentage of Population Employed in Security & Protection in Johnson City
0.55%
2.0%
Zip Codes with the Highest Percentage of Population Employed in Security & Protection in Johnson City, TN
| Zip Code | % Employed | vs State | vs National | |
| 1. | 37615 | 2.0% | 2.1%(-0.069)#253 | 2.1%(-0.123)#12,389 |
| 2. | 37604 | 1.8% | 2.1%(-0.254)#278 | 2.1%(-0.309)#13,646 |
| 3. | 37614 | 1.1% | 2.1%(-0.974)#379 | 2.1%(-1.03)#19,135 |
| 4. | 37601 | 0.55% | 2.1%(-1.54)#459 | 2.1%(-1.59)#22,945 |
1
Common Questions
What are the Top 3 Zip Codes with the Highest Percentage of Population Employed in Security & Protection in Johnson City, TN?
Top 3 Zip Codes with the Highest Percentage of Population Employed in Security & Protection in Johnson City, TN are:
What zip code has the Highest Percentage of Population Employed in Security & Protection in Johnson City, TN?
37615 has the Highest Percentage of Population Employed in Security & Protection in Johnson City, TN with 2.0%.
What is the Percentage of Population Employed in Security & Protection in Johnson City, TN?
Percentage of Population Employed in Security & Protection in Johnson City is 1.2%.
What is the Percentage of Population Employed in Security & Protection in Tennessee?
Percentage of Population Employed in Security & Protection in Tennessee is 2.1%.
What is the Percentage of Population Employed in Security & Protection in the United States?
Percentage of Population Employed in Security & Protection in the United States is 2.1%.