South Pittsburg, TN Map & Demographics
South Pittsburg Map
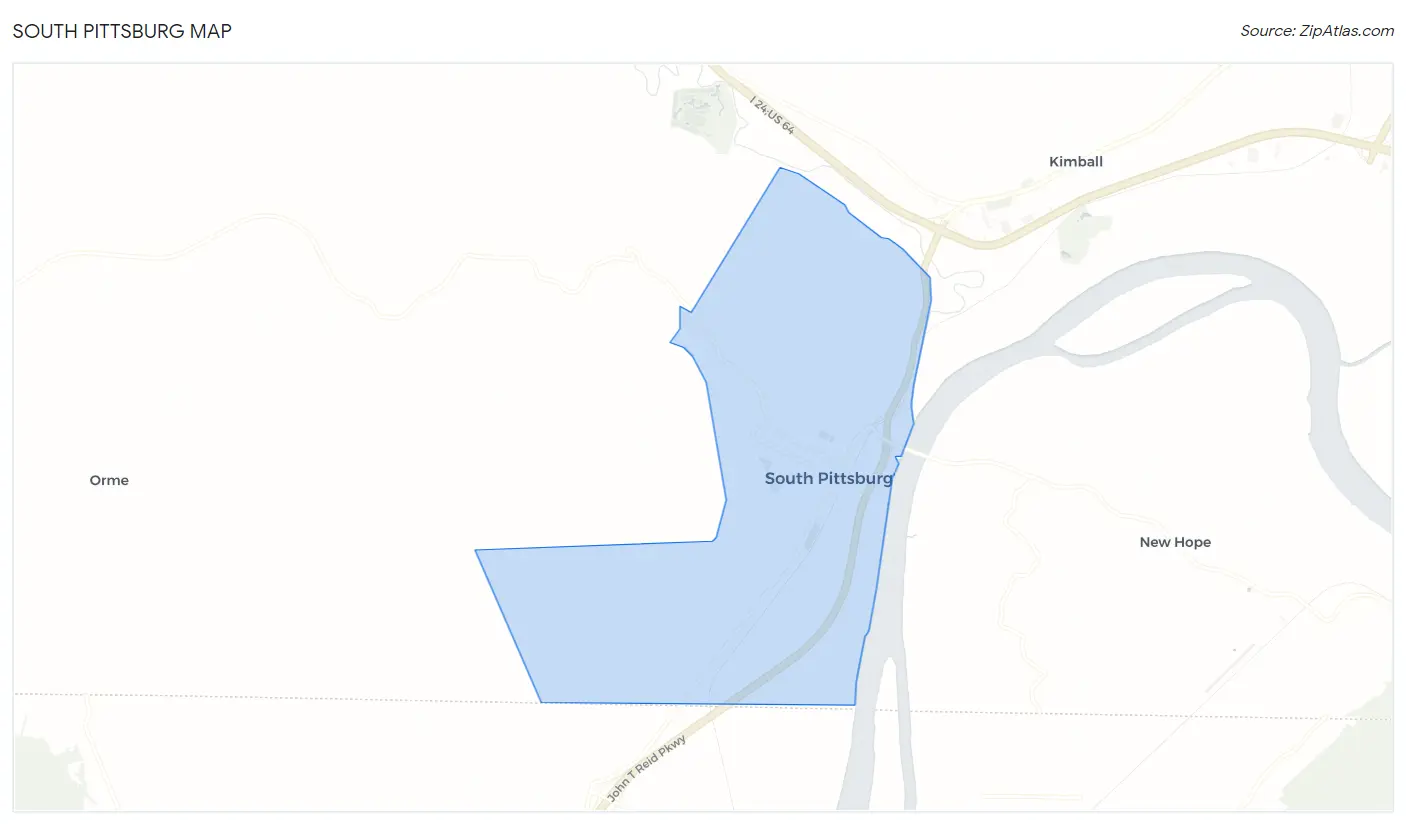
South Pittsburg Overview
$24,156
PER CAPITA INCOME
$53,288
AVG FAMILY INCOME
$45,250
AVG HOUSEHOLD INCOME
43.5%
WAGE / INCOME GAP [ % ]
56.5¢/ $1
WAGE / INCOME GAP [ $ ]
0.39
INEQUALITY / GINI INDEX
3,068
TOTAL POPULATION
1,494
MALE POPULATION
1,574
FEMALE POPULATION
94.92
MALES / 100 FEMALES
105.35
FEMALES / 100 MALES
49.7
MEDIAN AGE
2.6
AVG FAMILY SIZE
2.4
AVG HOUSEHOLD SIZE
1,243
LABOR FORCE [ PEOPLE ]
47.0%
PERCENT IN LABOR FORCE
5.3%
UNEMPLOYMENT RATE
South Pittsburg Zip Codes
South Pittsburg Area Codes
Income in South Pittsburg
Income Overview in South Pittsburg
Per Capita Income in South Pittsburg is $24,156, while median incomes of families and households are $53,288 and $45,250 respectively.
| Characteristic | Number | Measure |
| Per Capita Income | 3,068 | $24,156 |
| Median Family Income | 839 | $53,288 |
| Mean Family Income | 839 | $63,734 |
| Median Household Income | 1,233 | $45,250 |
| Mean Household Income | 1,233 | $56,724 |
| Income Deficit | 839 | $0 |
| Wage / Income Gap (%) | 3,068 | 43.53% |
| Wage / Income Gap ($) | 3,068 | 56.47¢ per $1 |
| Gini / Inequality Index | 3,068 | 0.39 |
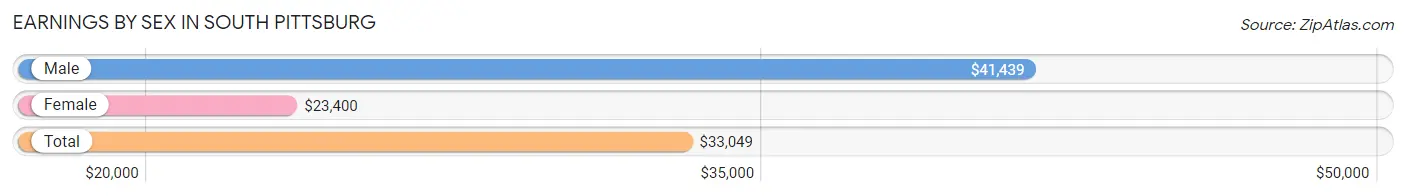
Earnings by Sex in South Pittsburg
Average Earnings in South Pittsburg are $33,049, $41,439 for men and $23,400 for women, a difference of 43.5%.
| Sex | Number | Average Earnings |
| Male | 774 (58.1%) | $41,439 |
| Female | 558 (41.9%) | $23,400 |
| Total | 1,332 (100.0%) | $33,049 |
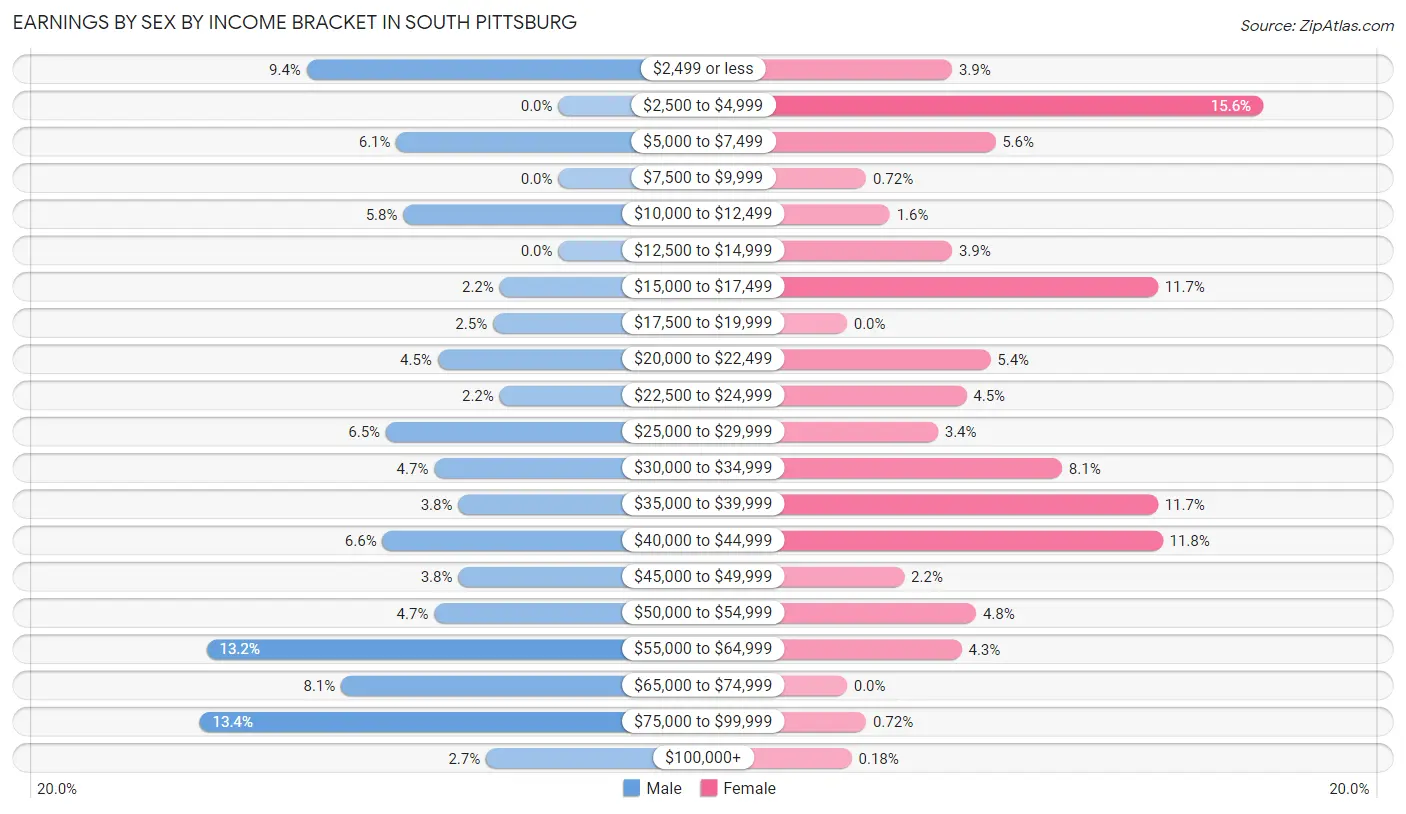
Earnings by Sex by Income Bracket in South Pittsburg
The most common earnings brackets in South Pittsburg are $75,000 to $99,999 for men (104 | 13.4%) and $2,500 to $4,999 for women (87 | 15.6%).
| Income | Male | Female |
| $2,499 or less | 73 (9.4%) | 22 (3.9%) |
| $2,500 to $4,999 | 0 (0.0%) | 87 (15.6%) |
| $5,000 to $7,499 | 47 (6.1%) | 31 (5.6%) |
| $7,500 to $9,999 | 0 (0.0%) | 4 (0.7%) |
| $10,000 to $12,499 | 45 (5.8%) | 9 (1.6%) |
| $12,500 to $14,999 | 0 (0.0%) | 22 (3.9%) |
| $15,000 to $17,499 | 17 (2.2%) | 65 (11.7%) |
| $17,500 to $19,999 | 19 (2.5%) | 0 (0.0%) |
| $20,000 to $22,499 | 35 (4.5%) | 30 (5.4%) |
| $22,500 to $24,999 | 17 (2.2%) | 25 (4.5%) |
| $25,000 to $29,999 | 50 (6.5%) | 19 (3.4%) |
| $30,000 to $34,999 | 36 (4.6%) | 45 (8.1%) |
| $35,000 to $39,999 | 29 (3.7%) | 65 (11.7%) |
| $40,000 to $44,999 | 51 (6.6%) | 66 (11.8%) |
| $45,000 to $49,999 | 29 (3.7%) | 12 (2.1%) |
| $50,000 to $54,999 | 36 (4.6%) | 27 (4.8%) |
| $55,000 to $64,999 | 102 (13.2%) | 24 (4.3%) |
| $65,000 to $74,999 | 63 (8.1%) | 0 (0.0%) |
| $75,000 to $99,999 | 104 (13.4%) | 4 (0.7%) |
| $100,000+ | 21 (2.7%) | 1 (0.2%) |
| Total | 774 (100.0%) | 558 (100.0%) |
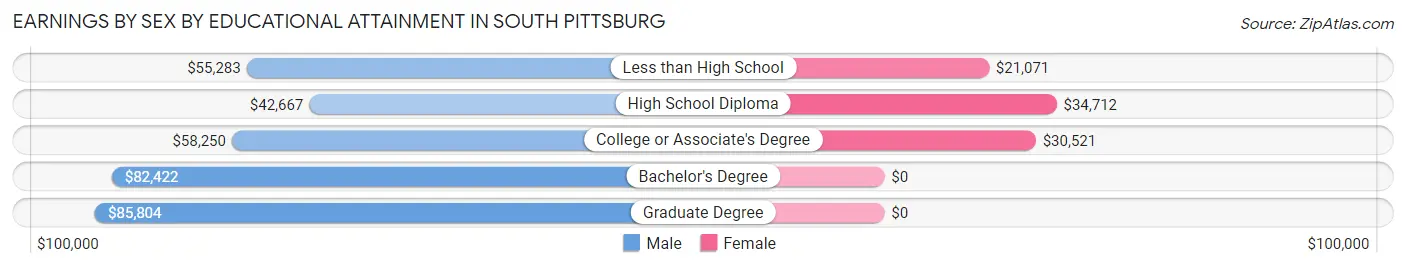
Earnings by Sex by Educational Attainment in South Pittsburg
Average earnings in South Pittsburg are $51,597 for men and $33,750 for women, a difference of 34.6%. Men with an educational attainment of graduate degree enjoy the highest average annual earnings of $85,804, while those with high school diploma education earn the least with $42,667. Women with an educational attainment of high school diploma earn the most with the average annual earnings of $34,712, while those with less than high school education have the smallest earnings of $21,071.
| Educational Attainment | Male Income | Female Income |
| Less than High School | $55,283 | $21,071 |
| High School Diploma | $42,667 | $34,712 |
| College or Associate's Degree | $58,250 | $30,521 |
| Bachelor's Degree | $82,422 | $0 |
| Graduate Degree | $85,804 | $0 |
| Total | $51,597 | $33,750 |
Family Income in South Pittsburg
Family Income Brackets in South Pittsburg
According to the South Pittsburg family income data, there are 171 families falling into the $100,000 to $149,999 income range, which is the most common income bracket and makes up 20.4% of all families.
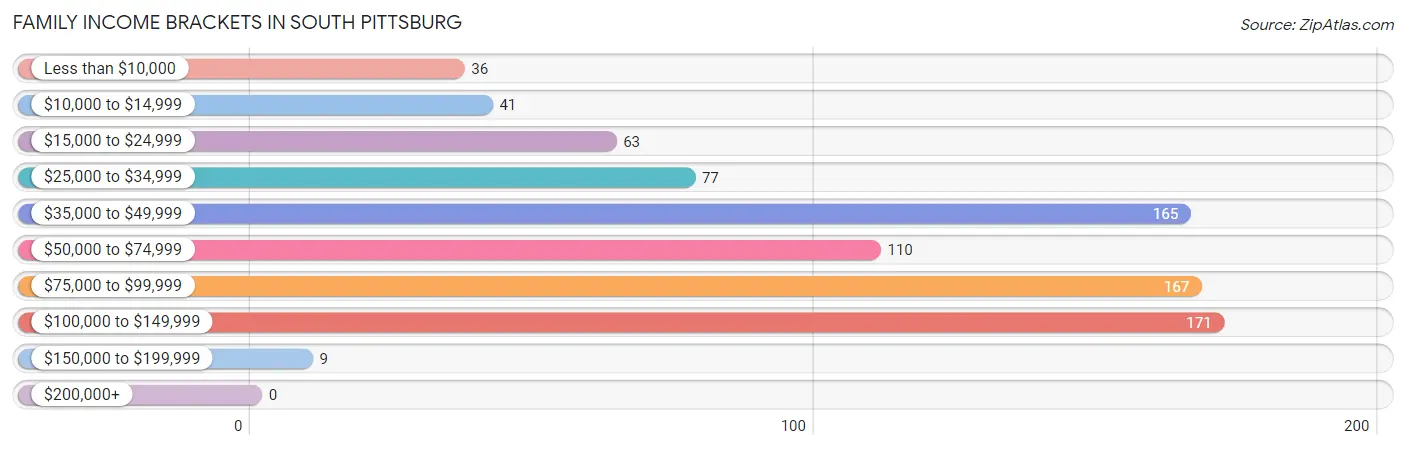
| Income Bracket | # Families | % Families |
| Less than $10,000 | 36 | 4.3% |
| $10,000 to $14,999 | 41 | 4.9% |
| $15,000 to $24,999 | 63 | 7.5% |
| $25,000 to $34,999 | 77 | 9.2% |
| $35,000 to $49,999 | 165 | 19.7% |
| $50,000 to $74,999 | 110 | 13.1% |
| $75,000 to $99,999 | 167 | 19.9% |
| $100,000 to $149,999 | 171 | 20.4% |
| $150,000 to $199,999 | 9 | 1.1% |
| $200,000+ | 0 | 0.0% |
Family Income by Famaliy Size in South Pittsburg
3-person families (251 | 29.9%) account for the highest median family income in South Pittsburg with $112,917 per family, while 3-person families (251 | 29.9%) have the highest median income of $37,639 per family member.
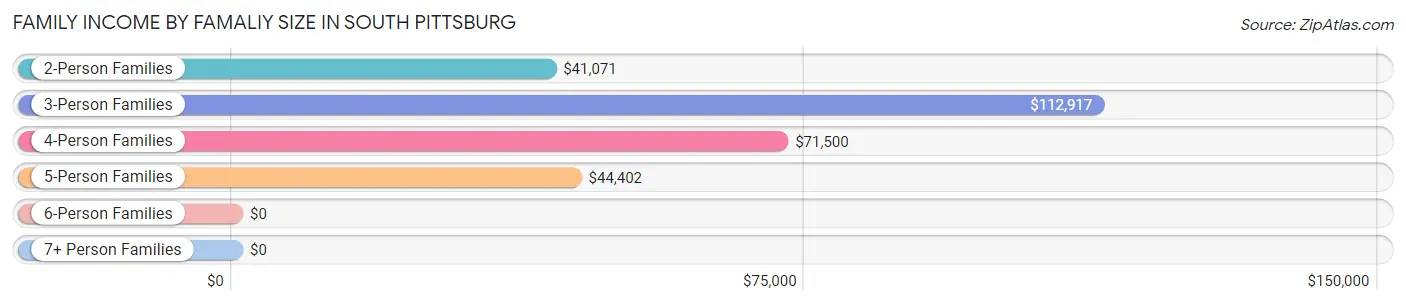
| Income Bracket | # Families | Median Income |
| 2-Person Families | 498 (59.4%) | $41,071 |
| 3-Person Families | 251 (29.9%) | $112,917 |
| 4-Person Families | 12 (1.4%) | $71,500 |
| 5-Person Families | 65 (7.7%) | $44,402 |
| 6-Person Families | 13 (1.5%) | $0 |
| 7+ Person Families | 0 (0.0%) | $0 |
| Total | 839 (100.0%) | $53,288 |
Family Income by Number of Earners in South Pittsburg
The median family income in South Pittsburg is $53,288, with families comprising 3+ earners (114) having the highest median family income of $114,267, while families with no earners (179) have the lowest median family income of $23,125, accounting for 13.6% and 21.3% of families, respectively.
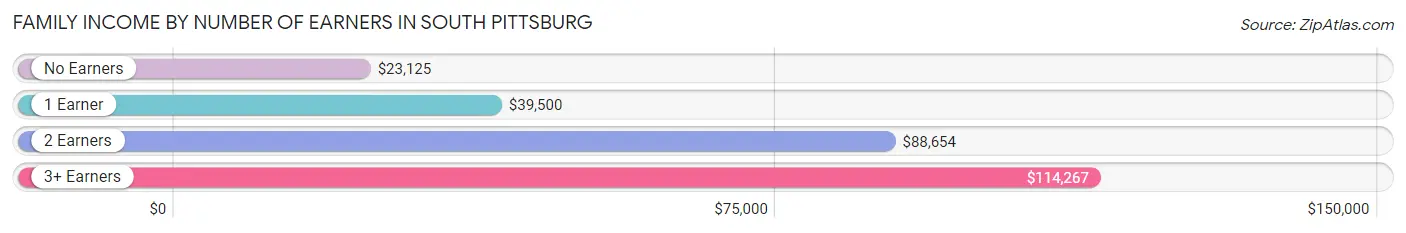
| Number of Earners | # Families | Median Income |
| No Earners | 179 (21.3%) | $23,125 |
| 1 Earner | 404 (48.1%) | $39,500 |
| 2 Earners | 142 (16.9%) | $88,654 |
| 3+ Earners | 114 (13.6%) | $114,267 |
| Total | 839 (100.0%) | $53,288 |
Household Income in South Pittsburg
Household Income Brackets in South Pittsburg
With 256 households falling in the category, the $35,000 to $49,999 income range is the most frequent in South Pittsburg, accounting for 20.8% of all households.
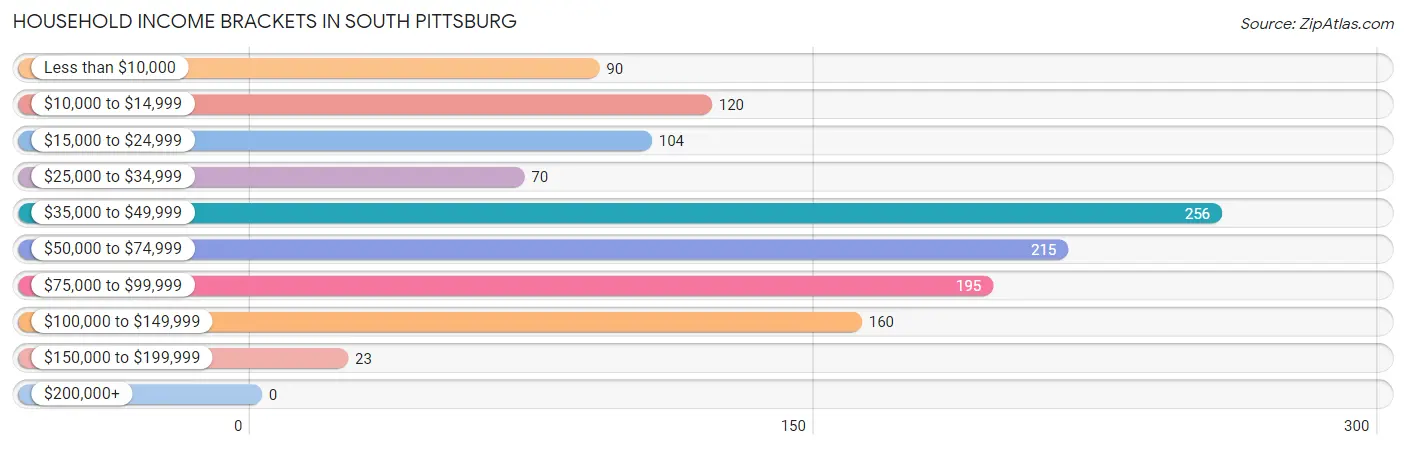
| Income Bracket | # Households | % Households |
| Less than $10,000 | 90 | 7.3% |
| $10,000 to $14,999 | 120 | 9.7% |
| $15,000 to $24,999 | 104 | 8.4% |
| $25,000 to $34,999 | 70 | 5.7% |
| $35,000 to $49,999 | 256 | 20.8% |
| $50,000 to $74,999 | 215 | 17.4% |
| $75,000 to $99,999 | 195 | 15.8% |
| $100,000 to $149,999 | 160 | 13.0% |
| $150,000 to $199,999 | 23 | 1.9% |
| $200,000+ | 0 | 0.0% |
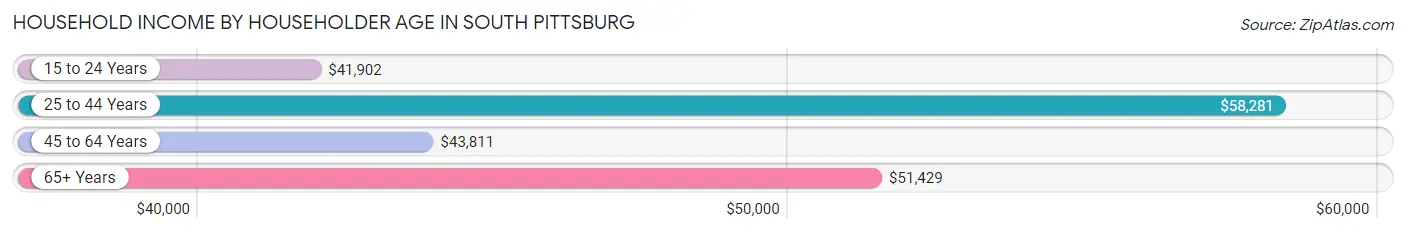
Household Income by Householder Age in South Pittsburg
The median household income in South Pittsburg is $45,250, with the highest median household income of $58,281 found in the 25 to 44 years age bracket for the primary householder. A total of 239 households (19.4%) fall into this category. Meanwhile, the 15 to 24 years age bracket for the primary householder has the lowest median household income of $41,902, with 55 households (4.5%) in this group.
| Income Bracket | # Households | Median Income |
| 15 to 24 Years | 55 (4.5%) | $41,902 |
| 25 to 44 Years | 239 (19.4%) | $58,281 |
| 45 to 64 Years | 547 (44.4%) | $43,811 |
| 65+ Years | 392 (31.8%) | $51,429 |
| Total | 1,233 (100.0%) | $45,250 |
Poverty in South Pittsburg
Income Below Poverty by Sex and Age in South Pittsburg
With 21.4% poverty level for males and 22.1% for females among the residents of South Pittsburg, 5 year old males and under 5 year old females are the most vulnerable to poverty, with 53 males (100.0%) and 35 females (51.5%) in their respective age groups living below the poverty level.
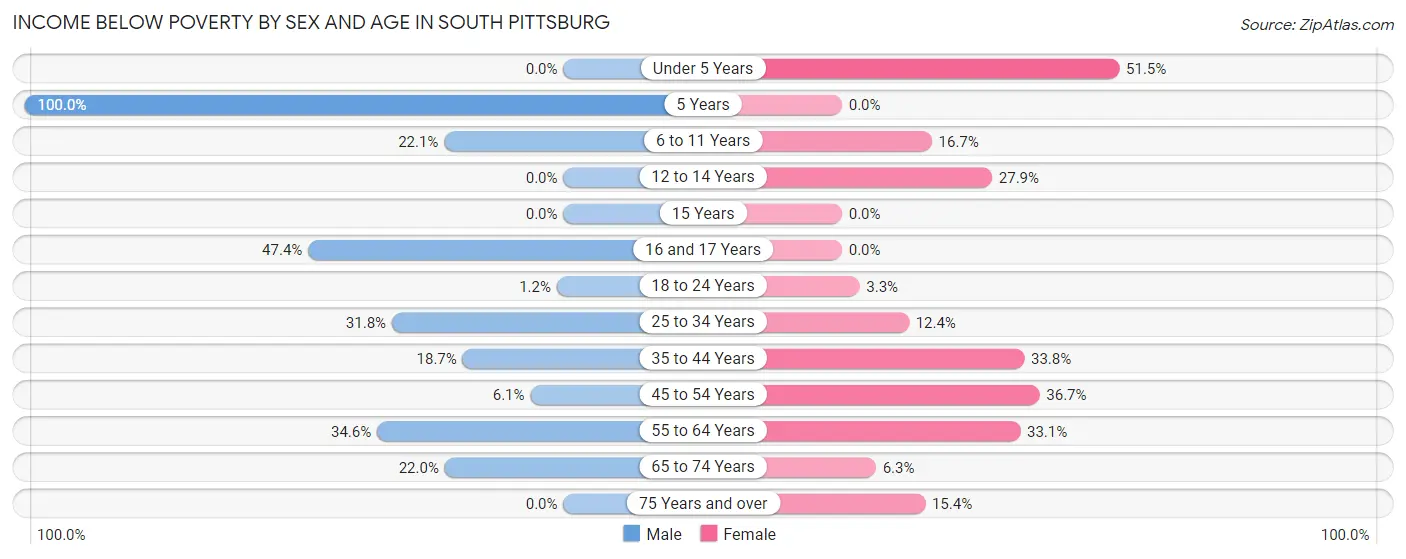
| Age Bracket | Male | Female |
| Under 5 Years | 0 (0.0%) | 35 (51.5%) |
| 5 Years | 53 (100.0%) | 0 (0.0%) |
| 6 to 11 Years | 25 (22.1%) | 5 (16.7%) |
| 12 to 14 Years | 0 (0.0%) | 22 (27.9%) |
| 15 Years | 0 (0.0%) | 0 (0.0%) |
| 16 and 17 Years | 18 (47.4%) | 0 (0.0%) |
| 18 to 24 Years | 2 (1.2%) | 3 (3.3%) |
| 25 to 34 Years | 28 (31.8%) | 20 (12.4%) |
| 35 to 44 Years | 23 (18.7%) | 45 (33.8%) |
| 45 to 54 Years | 15 (6.1%) | 77 (36.7%) |
| 55 to 64 Years | 120 (34.6%) | 89 (33.1%) |
| 65 to 74 Years | 24 (22.0%) | 15 (6.3%) |
| 75 Years and over | 0 (0.0%) | 21 (15.4%) |
| Total | 308 (21.4%) | 332 (22.1%) |
Income Above Poverty by Sex and Age in South Pittsburg
According to the poverty statistics in South Pittsburg, males aged under 5 years and females aged 16 and 17 years are the age groups that are most secure financially, with 100.0% of males and 100.0% of females in these age groups living above the poverty line.
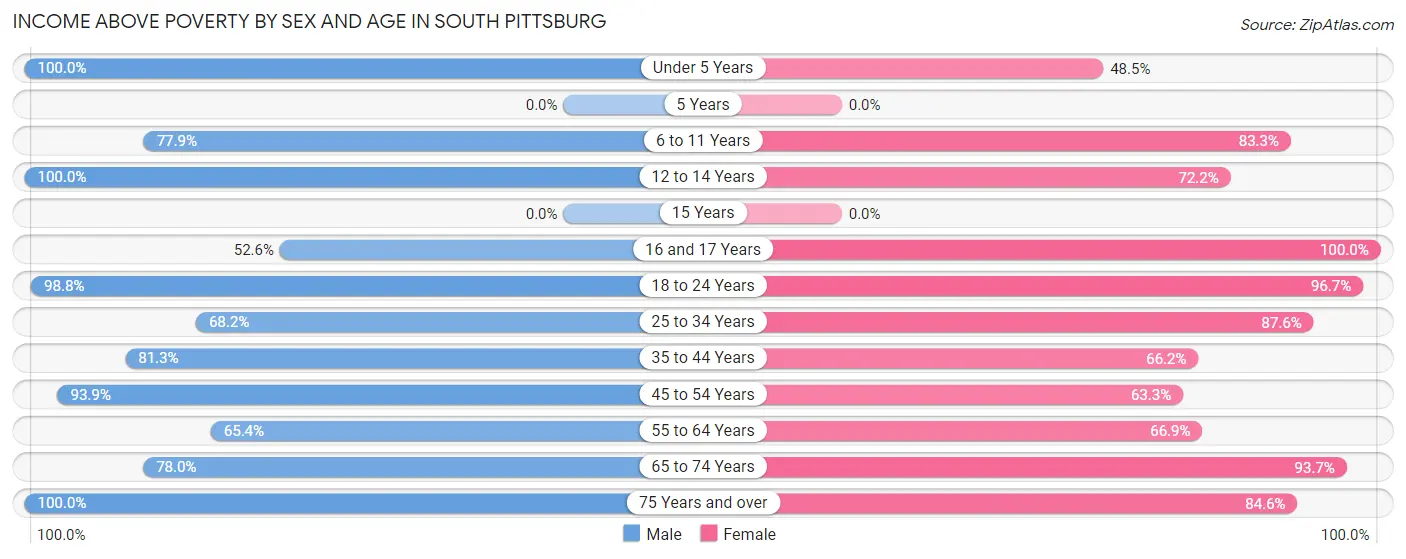
| Age Bracket | Male | Female |
| Under 5 Years | 13 (100.0%) | 33 (48.5%) |
| 5 Years | 0 (0.0%) | 0 (0.0%) |
| 6 to 11 Years | 88 (77.9%) | 25 (83.3%) |
| 12 to 14 Years | 58 (100.0%) | 57 (72.2%) |
| 15 Years | 0 (0.0%) | 0 (0.0%) |
| 16 and 17 Years | 20 (52.6%) | 88 (100.0%) |
| 18 to 24 Years | 162 (98.8%) | 89 (96.7%) |
| 25 to 34 Years | 60 (68.2%) | 141 (87.6%) |
| 35 to 44 Years | 100 (81.3%) | 88 (66.2%) |
| 45 to 54 Years | 230 (93.9%) | 133 (63.3%) |
| 55 to 64 Years | 227 (65.4%) | 180 (66.9%) |
| 65 to 74 Years | 85 (78.0%) | 223 (93.7%) |
| 75 Years and over | 88 (100.0%) | 115 (84.6%) |
| Total | 1,131 (78.6%) | 1,172 (77.9%) |
Income Below Poverty Among Married-Couple Families in South Pittsburg
The poverty statistics for married-couple families in South Pittsburg show that 3.6% or 19 of the total 520 families live below the poverty line. Families with no children have the highest poverty rate of 5.2%, comprising of 19 families. On the other hand, families with 1 or 2 children have the lowest poverty rate of 0.0%, which includes 0 families.
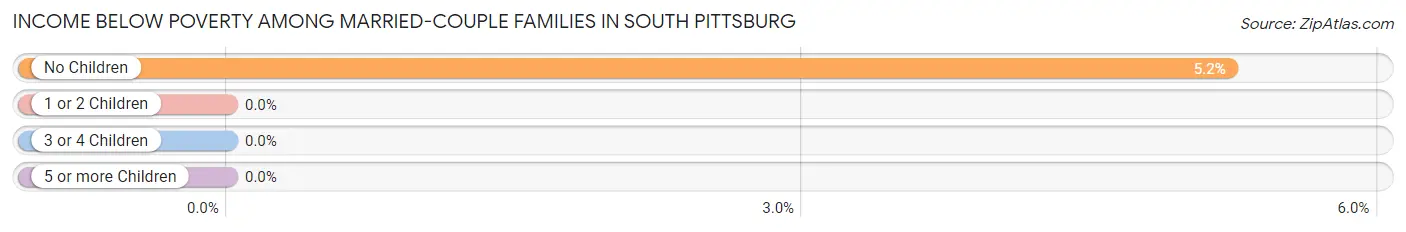
| Children | Above Poverty | Below Poverty |
| No Children | 345 (94.8%) | 19 (5.2%) |
| 1 or 2 Children | 115 (100.0%) | 0 (0.0%) |
| 3 or 4 Children | 41 (100.0%) | 0 (0.0%) |
| 5 or more Children | 0 (0.0%) | 0 (0.0%) |
| Total | 501 (96.4%) | 19 (3.6%) |
Income Below Poverty Among Single-Parent Households in South Pittsburg
According to the poverty data in South Pittsburg, 22.1% or 23 single-father households and 38.1% or 82 single-mother households are living below the poverty line. Among single-father households, those with no children have the highest poverty rate, with 20 households (37.0%) experiencing poverty. Likewise, among single-mother households, those with 1 or 2 children have the highest poverty rate, with 82 households (70.1%) falling below the poverty line.
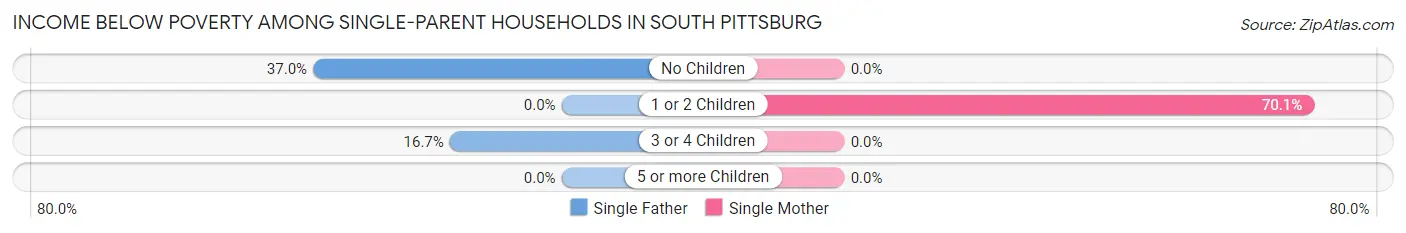
| Children | Single Father | Single Mother |
| No Children | 20 (37.0%) | 0 (0.0%) |
| 1 or 2 Children | 0 (0.0%) | 82 (70.1%) |
| 3 or 4 Children | 3 (16.7%) | 0 (0.0%) |
| 5 or more Children | 0 (0.0%) | 0 (0.0%) |
| Total | 23 (22.1%) | 82 (38.1%) |
Income Below Poverty Among Married-Couple vs Single-Parent Households in South Pittsburg
The poverty data for South Pittsburg shows that 19 of the married-couple family households (3.6%) and 105 of the single-parent households (32.9%) are living below the poverty level. Within the married-couple family households, those with no children have the highest poverty rate, with 19 households (5.2%) falling below the poverty line. Among the single-parent households, those with 1 or 2 children have the highest poverty rate, with 82 household (55.0%) living below poverty.
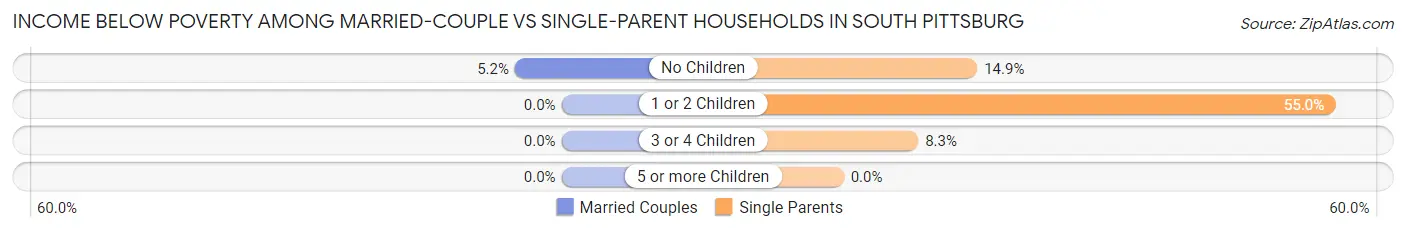
| Children | Married-Couple Families | Single-Parent Households |
| No Children | 19 (5.2%) | 20 (14.9%) |
| 1 or 2 Children | 0 (0.0%) | 82 (55.0%) |
| 3 or 4 Children | 0 (0.0%) | 3 (8.3%) |
| 5 or more Children | 0 (0.0%) | 0 (0.0%) |
| Total | 19 (3.6%) | 105 (32.9%) |
Race in South Pittsburg
The most populous races in South Pittsburg are White / Caucasian (2,560 | 83.4%), Black / African American (394 | 12.8%), and Asian (53 | 1.7%).
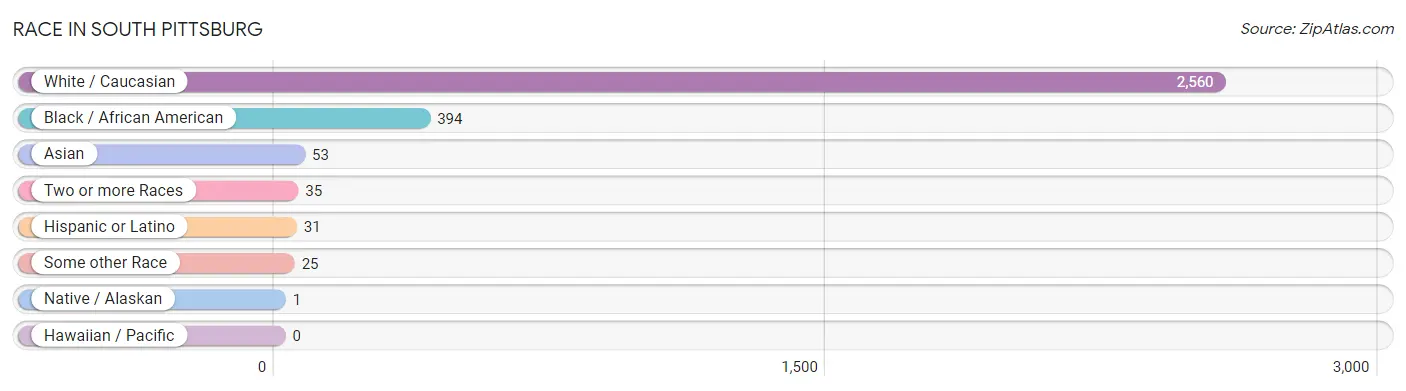
| Race | # Population | % Population |
| Asian | 53 | 1.7% |
| Black / African American | 394 | 12.8% |
| Hawaiian / Pacific | 0 | 0.0% |
| Hispanic or Latino | 31 | 1.0% |
| Native / Alaskan | 1 | 0.0% |
| White / Caucasian | 2,560 | 83.4% |
| Two or more Races | 35 | 1.1% |
| Some other Race | 25 | 0.8% |
| Total | 3,068 | 100.0% |
Ancestry in South Pittsburg
The most populous ancestries reported in South Pittsburg are American (622 | 20.3%), Irish (282 | 9.2%), English (210 | 6.8%), German (63 | 2.1%), and European (62 | 2.0%), together accounting for 40.4% of all South Pittsburg residents.
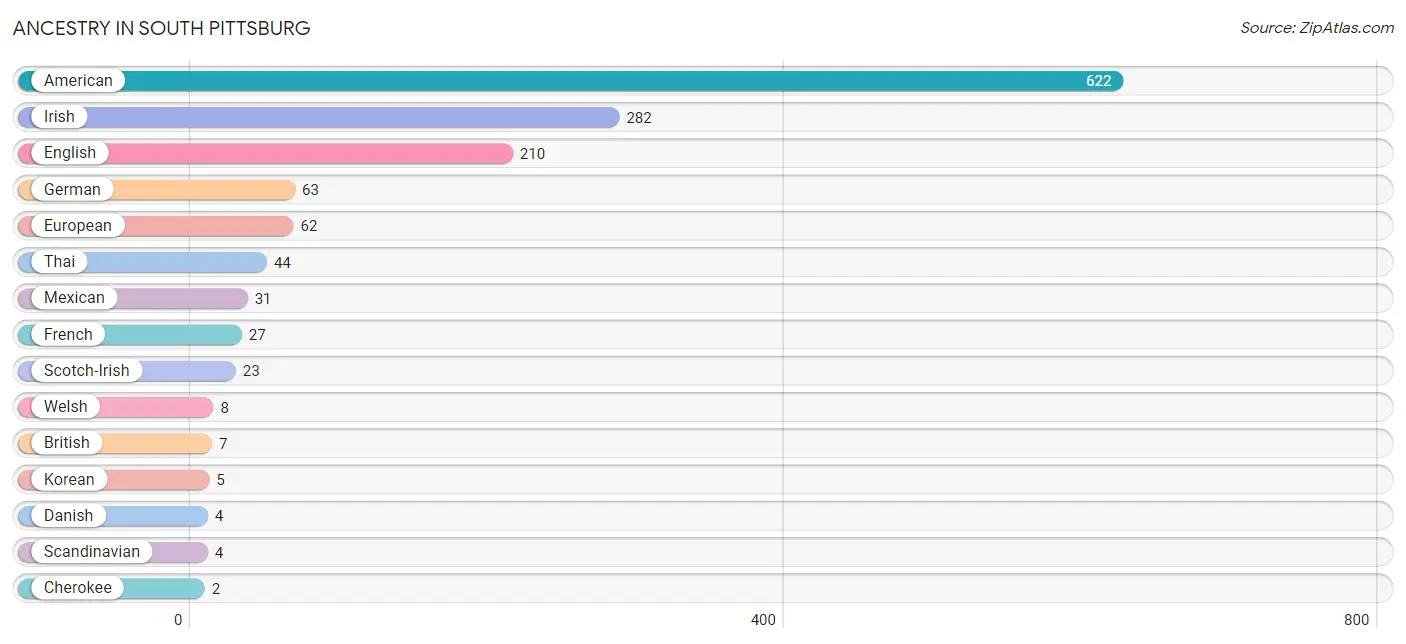
| Ancestry | # Population | % Population |
| American | 622 | 20.3% |
| Bhutanese | 1 | 0.0% |
| British | 7 | 0.2% |
| Cherokee | 2 | 0.1% |
| Danish | 4 | 0.1% |
| English | 210 | 6.8% |
| European | 62 | 2.0% |
| French | 27 | 0.9% |
| German | 63 | 2.1% |
| Irish | 282 | 9.2% |
| Korean | 5 | 0.2% |
| Mexican | 31 | 1.0% |
| Scandinavian | 4 | 0.1% |
| Scotch-Irish | 23 | 0.7% |
| Sioux | 1 | 0.0% |
| Thai | 44 | 1.4% |
| Welsh | 8 | 0.3% | View All 17 Rows |
Immigrants in South Pittsburg
The most numerous immigrant groups reported in South Pittsburg came from Central America (25 | 0.8%), Latin America (25 | 0.8%), Mexico (25 | 0.8%), Asia (24 | 0.8%), and India (24 | 0.8%), together accounting for 4.0% of all South Pittsburg residents.
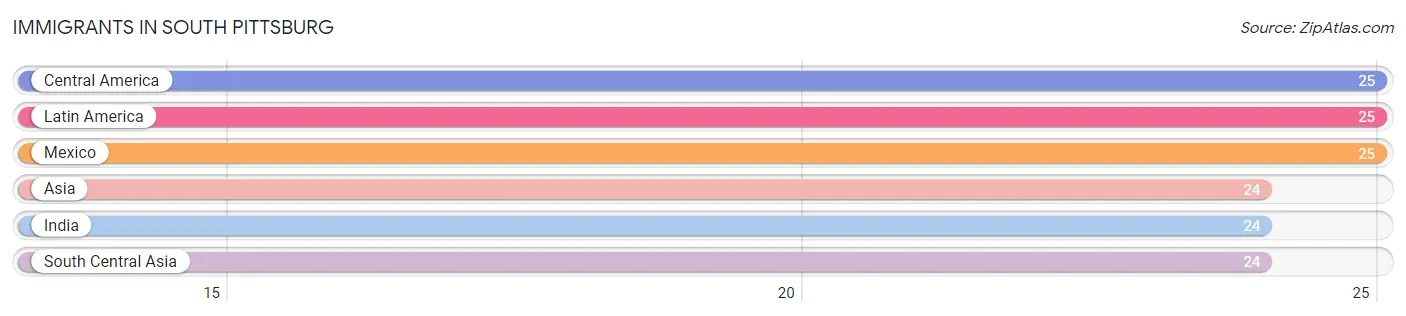
| Immigration Origin | # Population | % Population |
| Asia | 24 | 0.8% |
| Central America | 25 | 0.8% |
| India | 24 | 0.8% |
| Latin America | 25 | 0.8% |
| Mexico | 25 | 0.8% |
| South Central Asia | 24 | 0.8% | View All 6 Rows |
Sex and Age in South Pittsburg
Sex and Age in South Pittsburg
The most populous age groups in South Pittsburg are 55 to 59 Years (204 | 13.7%) for men and 60 to 64 Years (211 | 13.4%) for women.
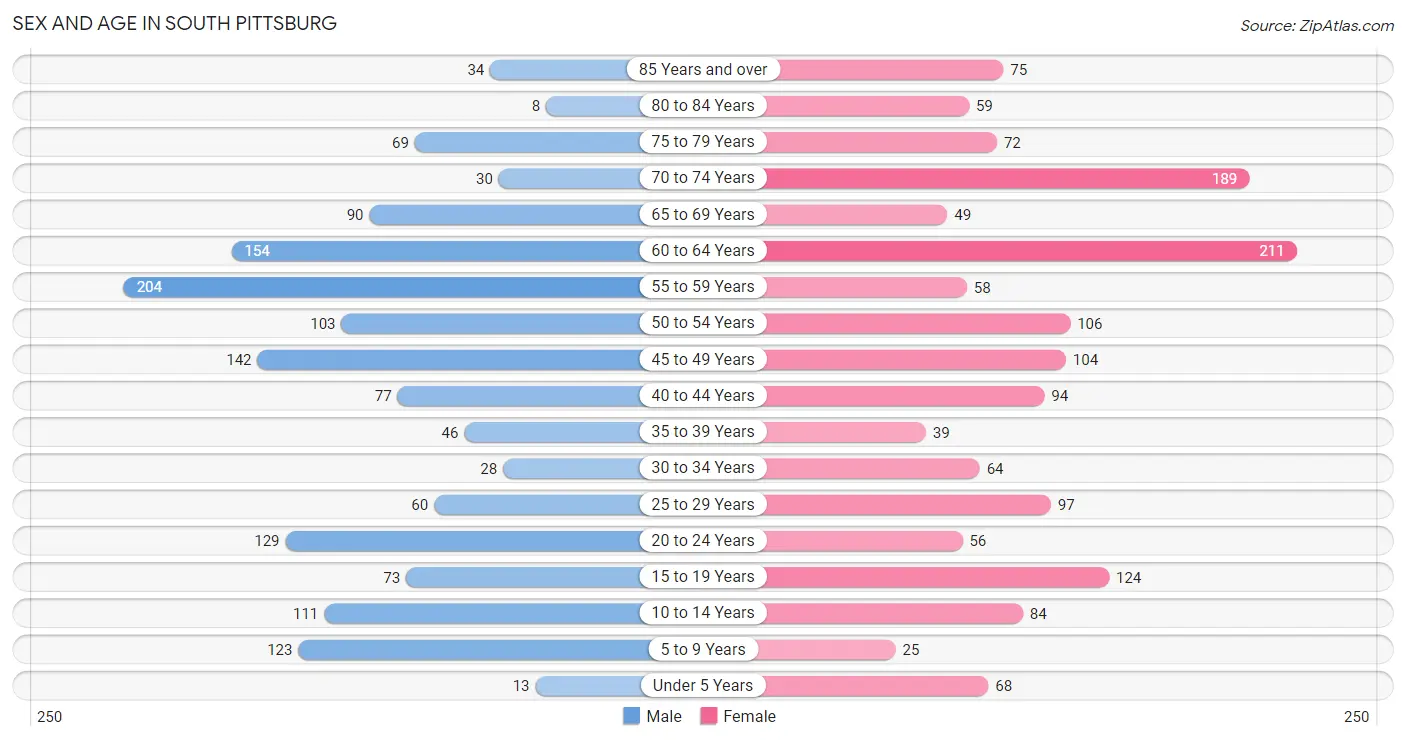
| Age Bracket | Male | Female |
| Under 5 Years | 13 (0.9%) | 68 (4.3%) |
| 5 to 9 Years | 123 (8.2%) | 25 (1.6%) |
| 10 to 14 Years | 111 (7.4%) | 84 (5.3%) |
| 15 to 19 Years | 73 (4.9%) | 124 (7.9%) |
| 20 to 24 Years | 129 (8.6%) | 56 (3.6%) |
| 25 to 29 Years | 60 (4.0%) | 97 (6.2%) |
| 30 to 34 Years | 28 (1.9%) | 64 (4.1%) |
| 35 to 39 Years | 46 (3.1%) | 39 (2.5%) |
| 40 to 44 Years | 77 (5.1%) | 94 (6.0%) |
| 45 to 49 Years | 142 (9.5%) | 104 (6.6%) |
| 50 to 54 Years | 103 (6.9%) | 106 (6.7%) |
| 55 to 59 Years | 204 (13.7%) | 58 (3.7%) |
| 60 to 64 Years | 154 (10.3%) | 211 (13.4%) |
| 65 to 69 Years | 90 (6.0%) | 49 (3.1%) |
| 70 to 74 Years | 30 (2.0%) | 189 (12.0%) |
| 75 to 79 Years | 69 (4.6%) | 72 (4.6%) |
| 80 to 84 Years | 8 (0.5%) | 59 (3.7%) |
| 85 Years and over | 34 (2.3%) | 75 (4.8%) |
| Total | 1,494 (100.0%) | 1,574 (100.0%) |
Families and Households in South Pittsburg
Median Family Size in South Pittsburg
The median family size in South Pittsburg is 2.64 persons per family, with single male/father families (104 | 12.4%) accounting for the largest median family size of 3.08 persons per family. On the other hand, married-couple families (520 | 62.0%) represent the smallest median family size with 2.52 persons per family.
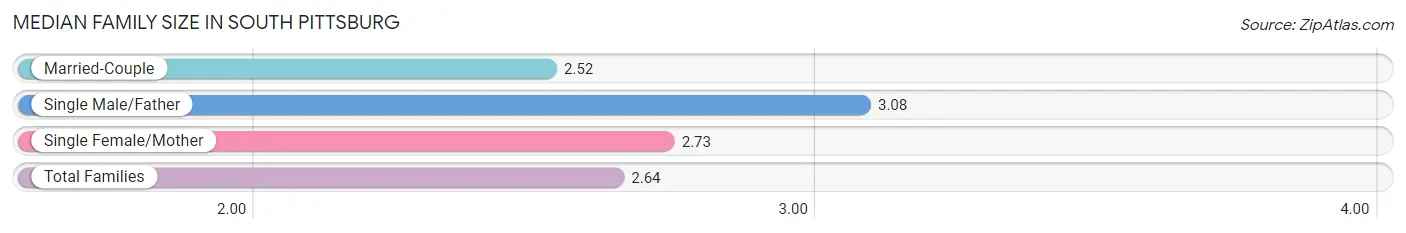
| Family Type | # Families | Family Size |
| Married-Couple | 520 (62.0%) | 2.52 |
| Single Male/Father | 104 (12.4%) | 3.08 |
| Single Female/Mother | 215 (25.6%) | 2.73 |
| Total Families | 839 (100.0%) | 2.64 |
Median Household Size in South Pittsburg
The median household size in South Pittsburg is 2.39 persons per household, with single male/father households (104 | 8.4%) accounting for the largest median household size of 3.55 persons per household. non-family households (394 | 32.0%) represent the smallest median household size with 1.46 persons per household.
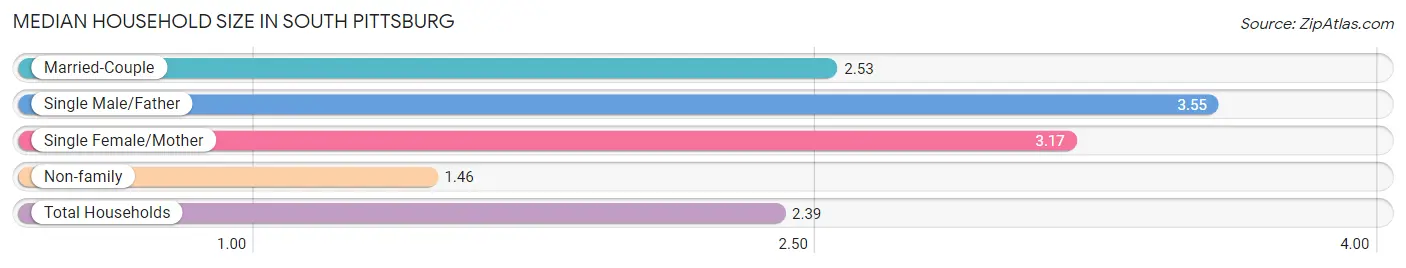
| Household Type | # Households | Household Size |
| Married-Couple | 520 (42.2%) | 2.53 |
| Single Male/Father | 104 (8.4%) | 3.55 |
| Single Female/Mother | 215 (17.4%) | 3.17 |
| Non-family | 394 (32.0%) | 1.46 |
| Total Households | 1,233 (100.0%) | 2.39 |
Household Size by Marriage Status in South Pittsburg
Out of a total of 1,233 households in South Pittsburg, 839 (68.0%) are family households, while 394 (32.0%) are nonfamily households. The most numerous type of family households are 2-person households, comprising 465, and the most common type of nonfamily households are 1-person households, comprising 244.
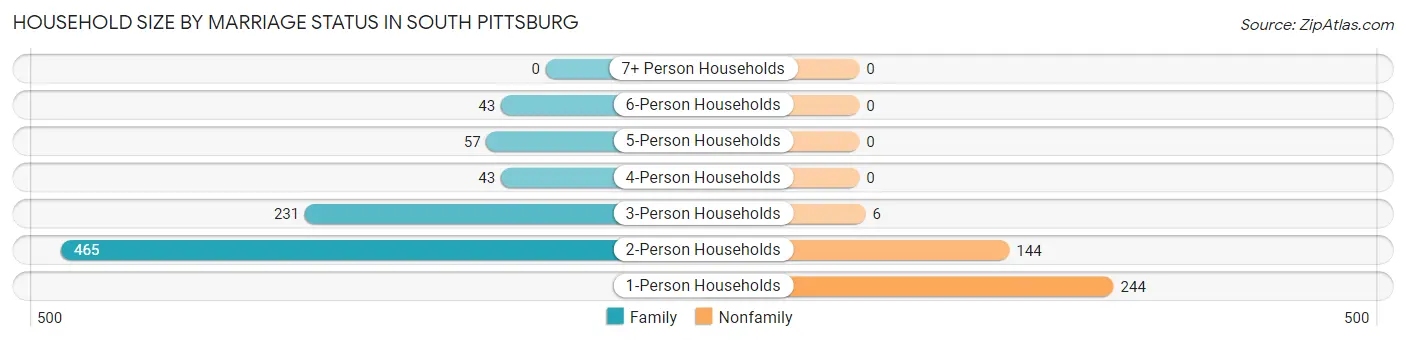
| Household Size | Family Households | Nonfamily Households |
| 1-Person Households | - | 244 (19.8%) |
| 2-Person Households | 465 (37.7%) | 144 (11.7%) |
| 3-Person Households | 231 (18.7%) | 6 (0.5%) |
| 4-Person Households | 43 (3.5%) | 0 (0.0%) |
| 5-Person Households | 57 (4.6%) | 0 (0.0%) |
| 6-Person Households | 43 (3.5%) | 0 (0.0%) |
| 7+ Person Households | 0 (0.0%) | 0 (0.0%) |
| Total | 839 (68.0%) | 394 (32.0%) |
Female Fertility in South Pittsburg
Fertility by Age in South Pittsburg
Average fertility rate in South Pittsburg is 7.0 births per 1,000 women. Women in the age bracket of 20 to 34 years have the highest fertility rate with 18.0 births per 1,000 women. Women in the age bracket of 20 to 34 years acount for 100.0% of all women with births.
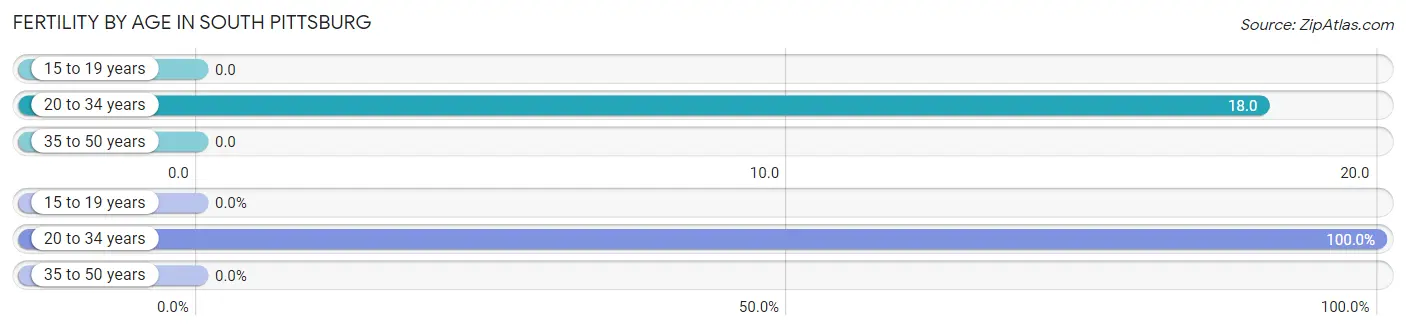
| Age Bracket | Women with Births | Births / 1,000 Women |
| 15 to 19 years | 0 (0.0%) | 0.0 |
| 20 to 34 years | 4 (100.0%) | 18.0 |
| 35 to 50 years | 0 (0.0%) | 0.0 |
| Total | 4 (100.0%) | 7.0 |
Fertility by Age by Marriage Status in South Pittsburg
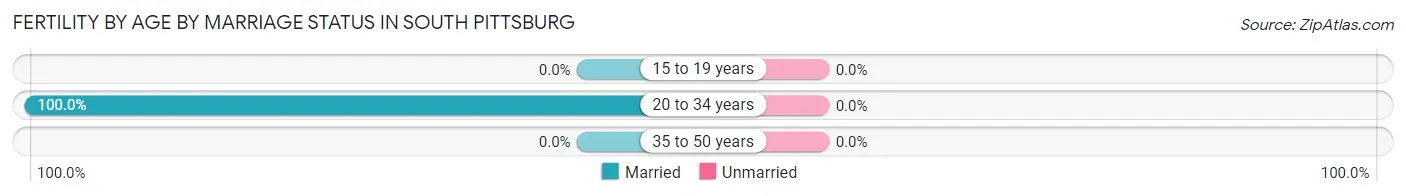
| Age Bracket | Married | Unmarried |
| 15 to 19 years | 0 (0.0%) | 0 (0.0%) |
| 20 to 34 years | 4 (100.0%) | 0 (0.0%) |
| 35 to 50 years | 0 (0.0%) | 0 (0.0%) |
| Total | 4 (100.0%) | 0 (0.0%) |
Fertility by Education in South Pittsburg
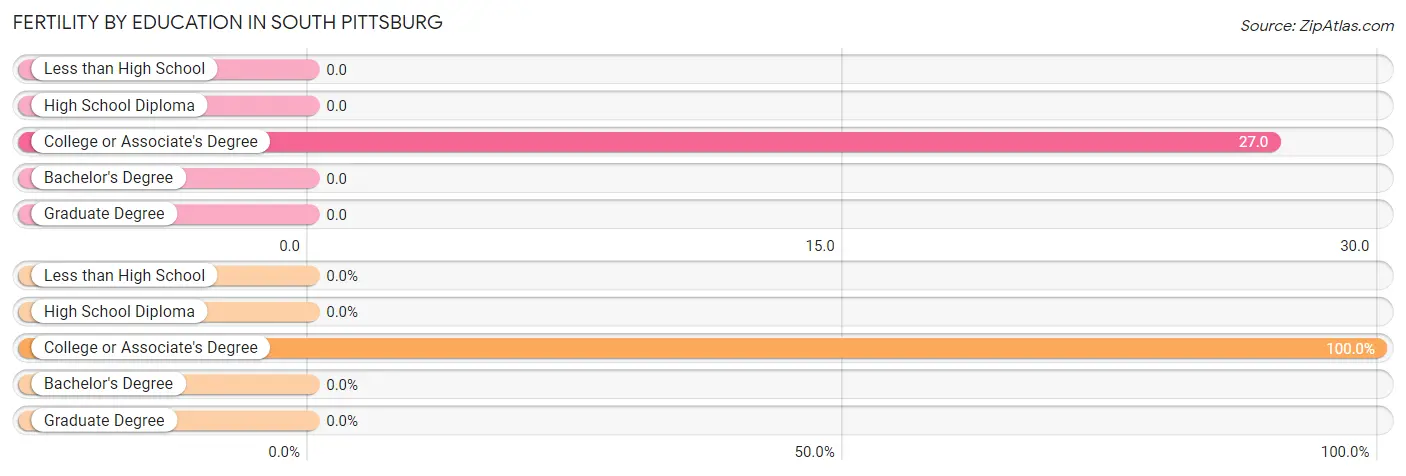
| Educational Attainment | Women with Births | Births / 1,000 Women |
| Less than High School | 0 (0.0%) | 0.0 |
| High School Diploma | 0 (0.0%) | 0.0 |
| College or Associate's Degree | 4 (100.0%) | 27.0 |
| Bachelor's Degree | 0 (0.0%) | 0.0 |
| Graduate Degree | 0 (0.0%) | 0.0 |
| Total | 4 (100.0%) | 7.0 |
Fertility by Education by Marriage Status in South Pittsburg
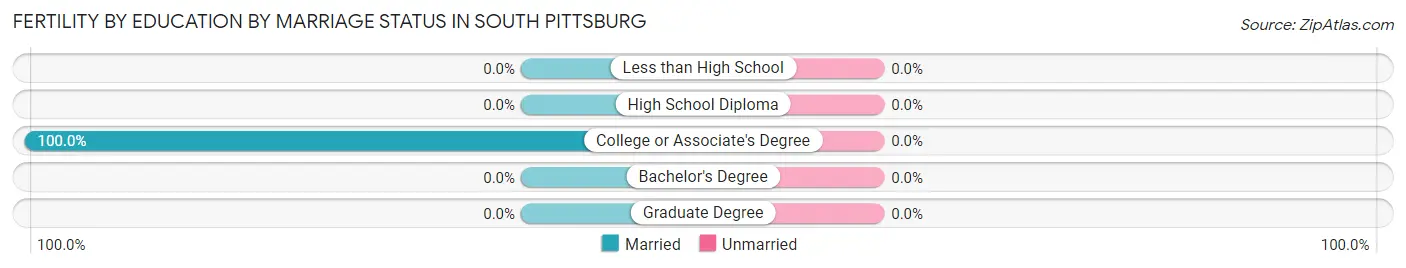
| Educational Attainment | Married | Unmarried |
| Less than High School | 0 (0.0%) | 0 (0.0%) |
| High School Diploma | 0 (0.0%) | 0 (0.0%) |
| College or Associate's Degree | 4 (100.0%) | 0 (0.0%) |
| Bachelor's Degree | 0 (0.0%) | 0 (0.0%) |
| Graduate Degree | 0 (0.0%) | 0 (0.0%) |
| Total | 4 (100.0%) | 0 (0.0%) |
Employment Characteristics in South Pittsburg
Employment by Class of Employer in South Pittsburg
Among the 1,147 employed individuals in South Pittsburg, private company employees (763 | 66.5%), self-employed (not incorporated) (184 | 16.0%), and self-employed (incorporated) (88 | 7.7%) make up the most common classes of employment.
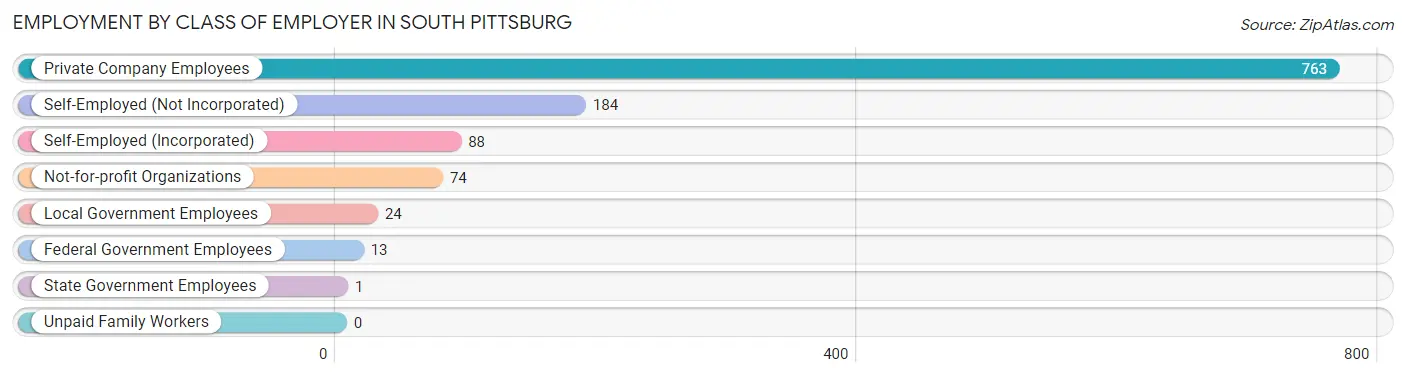
| Employer Class | # Employees | % Employees |
| Private Company Employees | 763 | 66.5% |
| Self-Employed (Incorporated) | 88 | 7.7% |
| Self-Employed (Not Incorporated) | 184 | 16.0% |
| Not-for-profit Organizations | 74 | 6.5% |
| Local Government Employees | 24 | 2.1% |
| State Government Employees | 1 | 0.1% |
| Federal Government Employees | 13 | 1.1% |
| Unpaid Family Workers | 0 | 0.0% |
| Total | 1,147 | 100.0% |
Employment Status by Age in South Pittsburg
According to the labor force statistics for South Pittsburg, out of the total population over 16 years of age (2,644), 47.0% or 1,243 individuals are in the labor force, with 5.3% or 66 of them unemployed. The age group with the highest labor force participation rate is 20 to 24 years, with 98.9% or 183 individuals in the labor force. Within the labor force, the 25 to 29 years age range has the highest percentage of unemployed individuals, with 25.0% or 26 of them being unemployed.
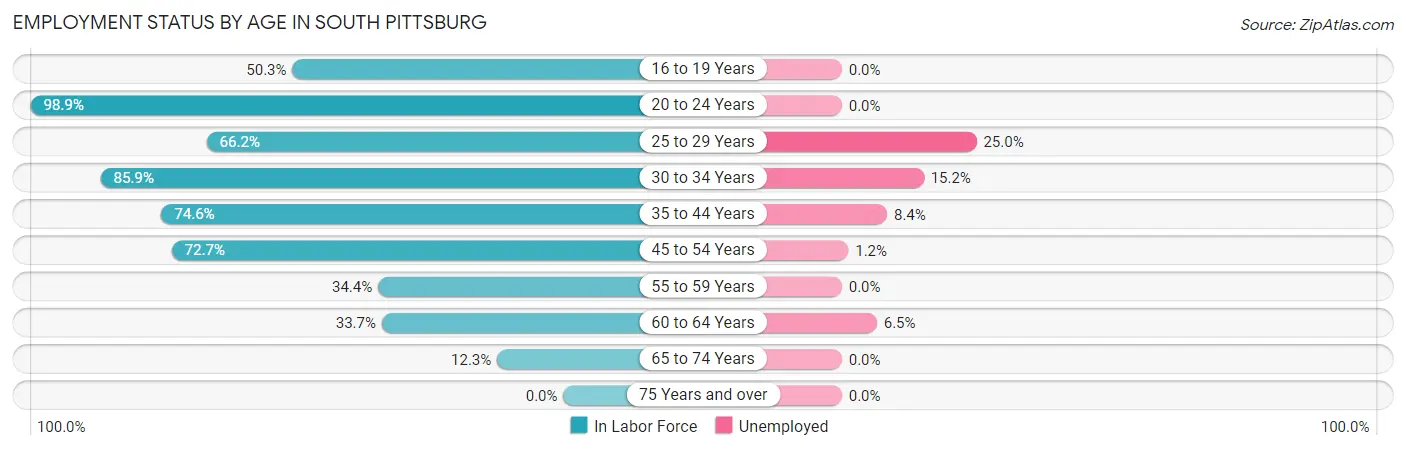
| Age Bracket | In Labor Force | Unemployed |
| 16 to 19 Years | 99 (50.3%) | 0 (0.0%) |
| 20 to 24 Years | 183 (98.9%) | 0 (0.0%) |
| 25 to 29 Years | 104 (66.2%) | 26 (25.0%) |
| 30 to 34 Years | 79 (85.9%) | 12 (15.2%) |
| 35 to 44 Years | 191 (74.6%) | 16 (8.4%) |
| 45 to 54 Years | 331 (72.7%) | 4 (1.2%) |
| 55 to 59 Years | 90 (34.4%) | 0 (0.0%) |
| 60 to 64 Years | 123 (33.7%) | 8 (6.5%) |
| 65 to 74 Years | 44 (12.3%) | 0 (0.0%) |
| 75 Years and over | 0 (0.0%) | 0 (0.0%) |
| Total | 1,243 (47.0%) | 66 (5.3%) |
Employment Status by Educational Attainment in South Pittsburg
According to labor force statistics for South Pittsburg, 57.8% of individuals (917) out of the total population between 25 and 64 years of age (1,587) are in the labor force, with 7.2% or 66 of them being unemployed. The group with the highest labor force participation rate are those with the educational attainment of bachelor's degree or higher, with 77.1% or 91 individuals in the labor force. Within the labor force, individuals with college / associate degree education have the highest percentage of unemployment, with 20.2% or 38 of them being unemployed.
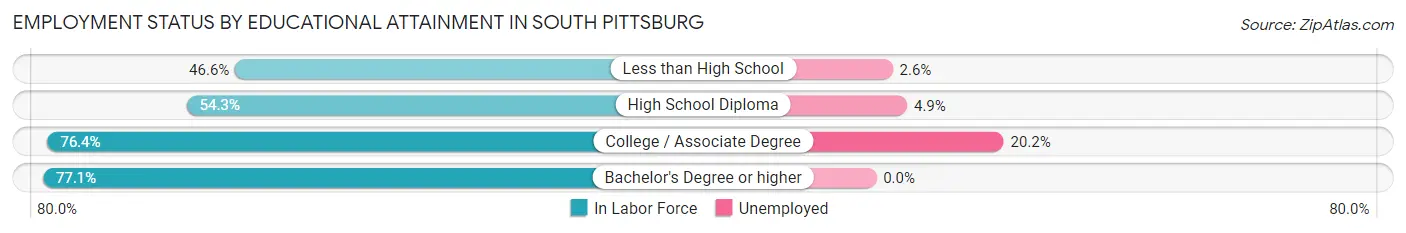
| Educational Attainment | In Labor Force | Unemployed |
| Less than High School | 152 (46.6%) | 8 (2.6%) |
| High School Diploma | 487 (54.3%) | 44 (4.9%) |
| College / Associate Degree | 188 (76.4%) | 50 (20.2%) |
| Bachelor's Degree or higher | 91 (77.1%) | 0 (0.0%) |
| Total | 917 (57.8%) | 114 (7.2%) |
Employment Occupations by Sex in South Pittsburg
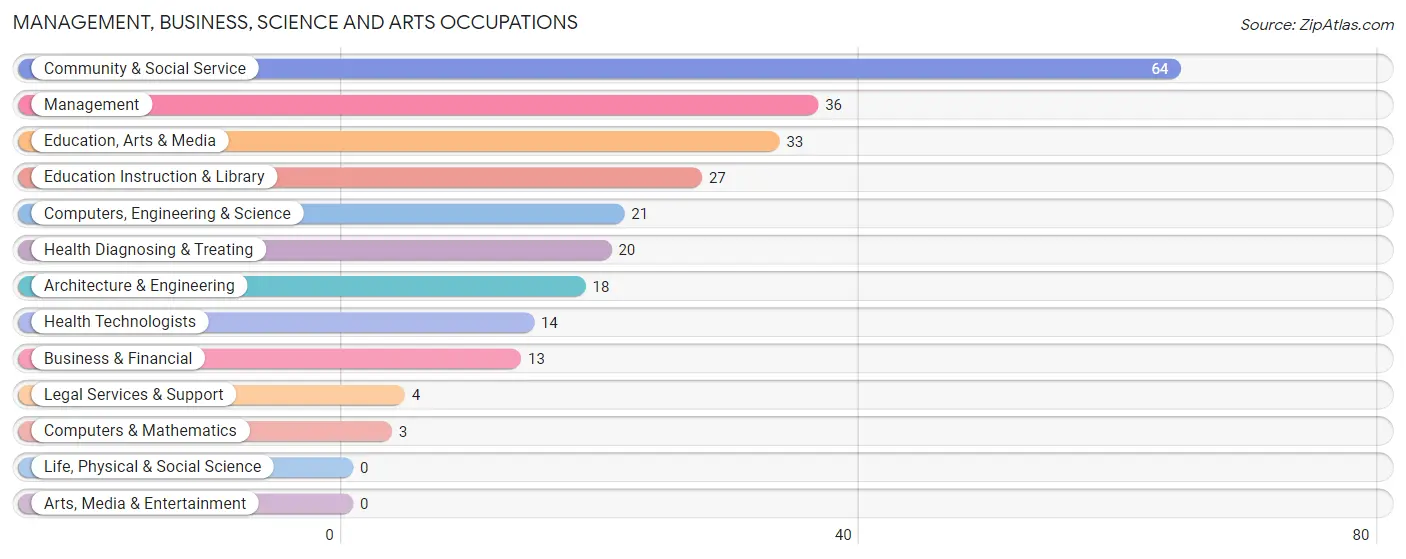
Management, Business, Science and Arts Occupations
The most common Management, Business, Science and Arts occupations in South Pittsburg are Community & Social Service (64 | 5.4%), Management (36 | 3.1%), Education, Arts & Media (33 | 2.8%), Education Instruction & Library (27 | 2.3%), and Computers, Engineering & Science (21 | 1.8%).
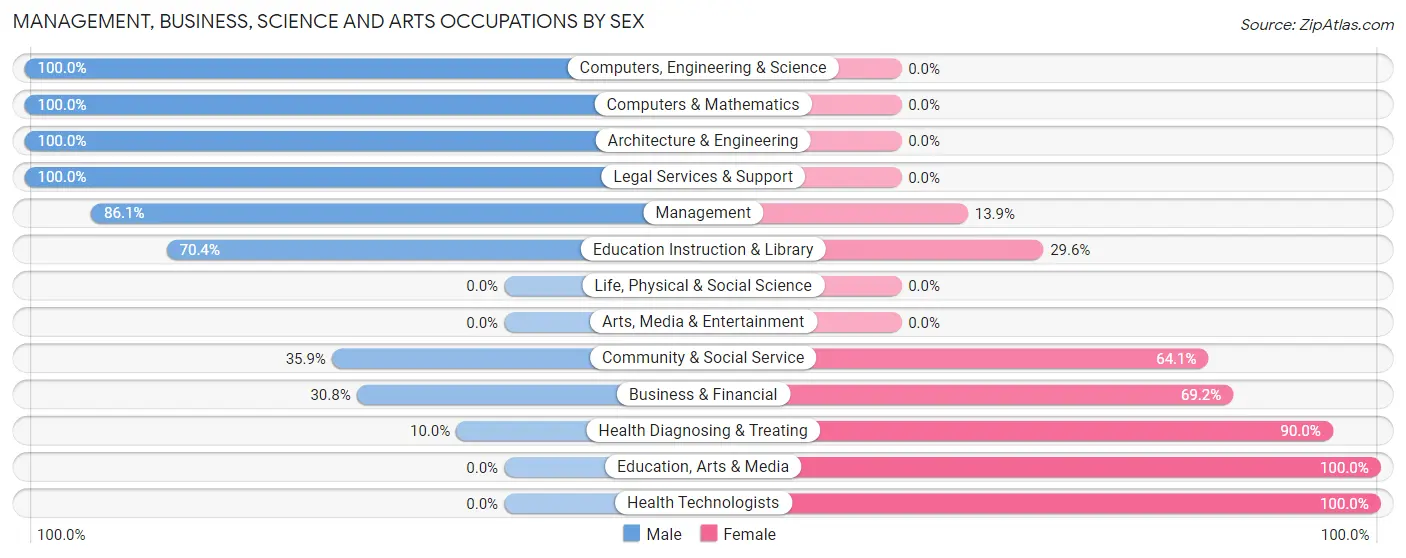
Management, Business, Science and Arts Occupations by Sex
Within the Management, Business, Science and Arts occupations in South Pittsburg, the most male-oriented occupations are Computers, Engineering & Science (100.0%), Computers & Mathematics (100.0%), and Architecture & Engineering (100.0%), while the most female-oriented occupations are Education, Arts & Media (100.0%), Health Technologists (100.0%), and Health Diagnosing & Treating (90.0%).
| Occupation | Male | Female |
| Management | 31 (86.1%) | 5 (13.9%) |
| Business & Financial | 4 (30.8%) | 9 (69.2%) |
| Computers, Engineering & Science | 21 (100.0%) | 0 (0.0%) |
| Computers & Mathematics | 3 (100.0%) | 0 (0.0%) |
| Architecture & Engineering | 18 (100.0%) | 0 (0.0%) |
| Life, Physical & Social Science | 0 (0.0%) | 0 (0.0%) |
| Community & Social Service | 23 (35.9%) | 41 (64.1%) |
| Education, Arts & Media | 0 (0.0%) | 33 (100.0%) |
| Legal Services & Support | 4 (100.0%) | 0 (0.0%) |
| Education Instruction & Library | 19 (70.4%) | 8 (29.6%) |
| Arts, Media & Entertainment | 0 (0.0%) | 0 (0.0%) |
| Health Diagnosing & Treating | 2 (10.0%) | 18 (90.0%) |
| Health Technologists | 0 (0.0%) | 14 (100.0%) |
| Total (Category) | 81 (52.6%) | 73 (47.4%) |
| Total (Overall) | 703 (59.7%) | 475 (40.3%) |
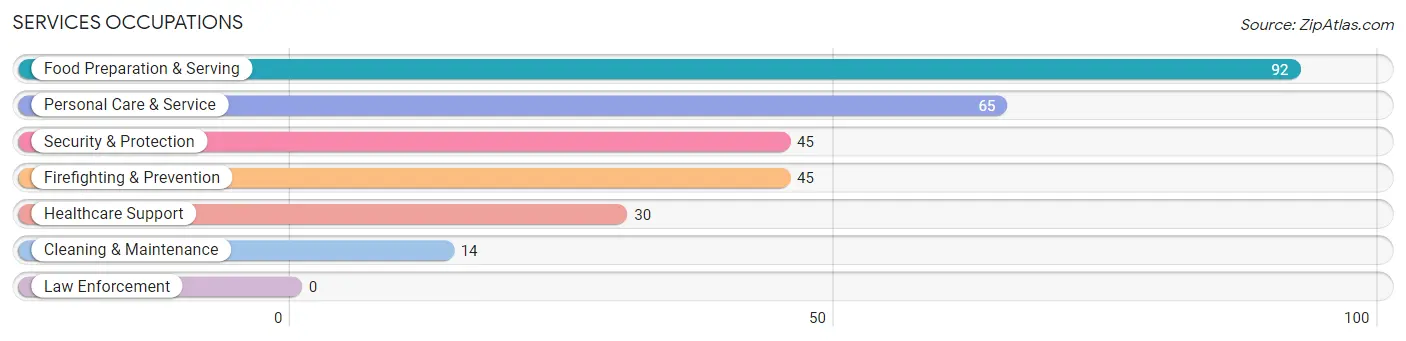
Services Occupations
The most common Services occupations in South Pittsburg are Food Preparation & Serving (92 | 7.8%), Personal Care & Service (65 | 5.5%), Security & Protection (45 | 3.8%), Firefighting & Prevention (45 | 3.8%), and Healthcare Support (30 | 2.5%).
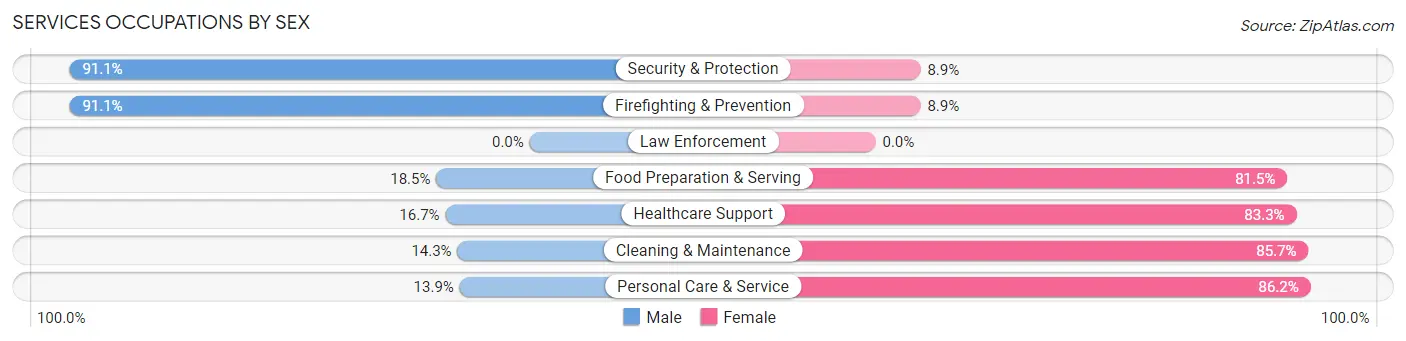
Services Occupations by Sex
Within the Services occupations in South Pittsburg, the most male-oriented occupations are Security & Protection (91.1%), Firefighting & Prevention (91.1%), and Food Preparation & Serving (18.5%), while the most female-oriented occupations are Personal Care & Service (86.2%), Cleaning & Maintenance (85.7%), and Healthcare Support (83.3%).
| Occupation | Male | Female |
| Healthcare Support | 5 (16.7%) | 25 (83.3%) |
| Security & Protection | 41 (91.1%) | 4 (8.9%) |
| Firefighting & Prevention | 41 (91.1%) | 4 (8.9%) |
| Law Enforcement | 0 (0.0%) | 0 (0.0%) |
| Food Preparation & Serving | 17 (18.5%) | 75 (81.5%) |
| Cleaning & Maintenance | 2 (14.3%) | 12 (85.7%) |
| Personal Care & Service | 9 (13.9%) | 56 (86.2%) |
| Total (Category) | 74 (30.1%) | 172 (69.9%) |
| Total (Overall) | 703 (59.7%) | 475 (40.3%) |
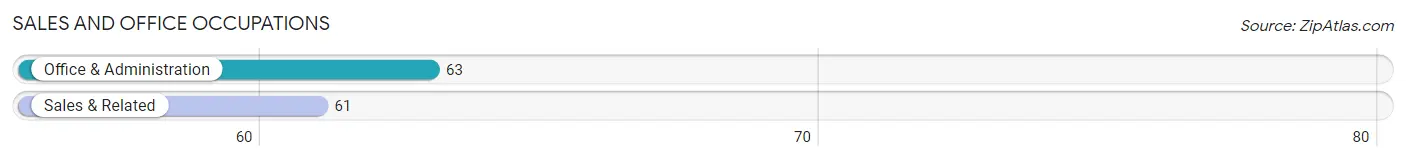
Sales and Office Occupations
The most common Sales and Office occupations in South Pittsburg are Office & Administration (63 | 5.3%), and Sales & Related (61 | 5.2%).
Sales and Office Occupations by Sex
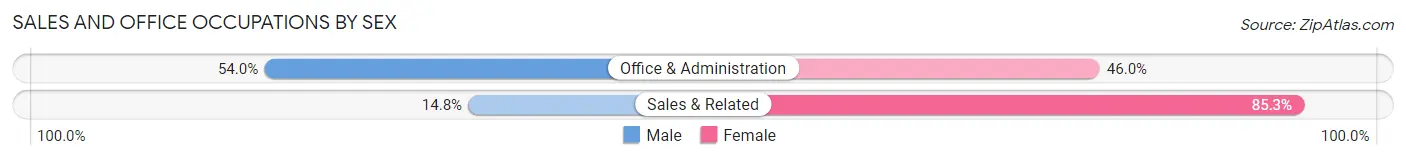
| Occupation | Male | Female |
| Sales & Related | 9 (14.7%) | 52 (85.3%) |
| Office & Administration | 34 (54.0%) | 29 (46.0%) |
| Total (Category) | 43 (34.7%) | 81 (65.3%) |
| Total (Overall) | 703 (59.7%) | 475 (40.3%) |
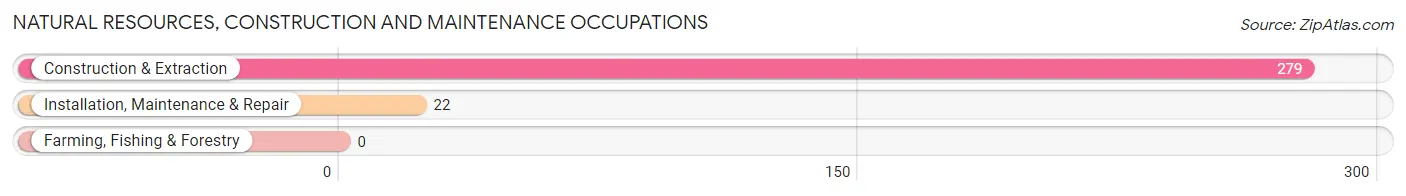
Natural Resources, Construction and Maintenance Occupations
The most common Natural Resources, Construction and Maintenance occupations in South Pittsburg are Construction & Extraction (279 | 23.7%), and Installation, Maintenance & Repair (22 | 1.9%).
Natural Resources, Construction and Maintenance Occupations by Sex
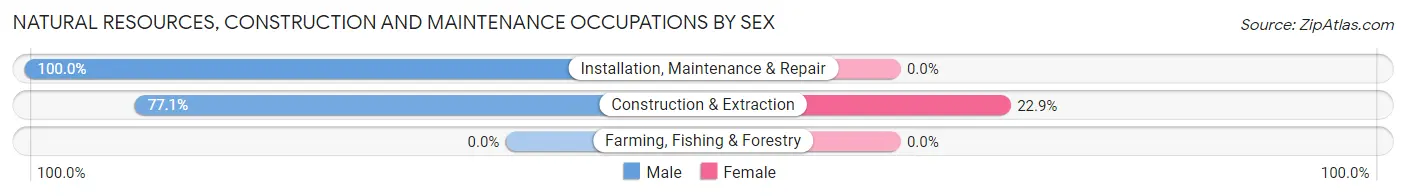
| Occupation | Male | Female |
| Farming, Fishing & Forestry | 0 (0.0%) | 0 (0.0%) |
| Construction & Extraction | 215 (77.1%) | 64 (22.9%) |
| Installation, Maintenance & Repair | 22 (100.0%) | 0 (0.0%) |
| Total (Category) | 237 (78.7%) | 64 (21.3%) |
| Total (Overall) | 703 (59.7%) | 475 (40.3%) |
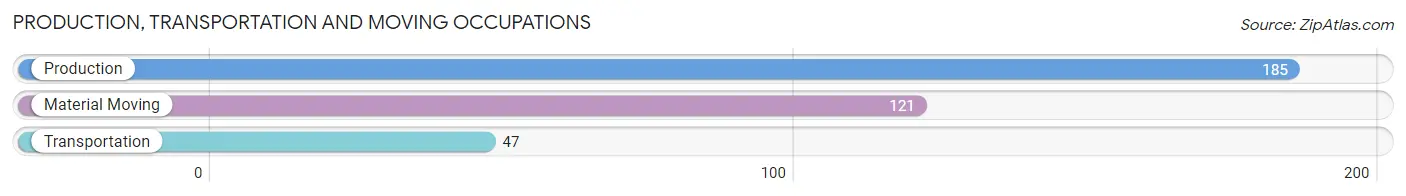
Production, Transportation and Moving Occupations
The most common Production, Transportation and Moving occupations in South Pittsburg are Production (185 | 15.7%), Material Moving (121 | 10.3%), and Transportation (47 | 4.0%).
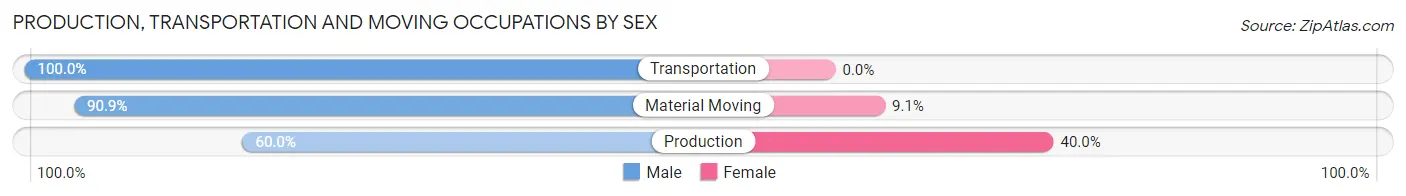
Production, Transportation and Moving Occupations by Sex
| Occupation | Male | Female |
| Production | 111 (60.0%) | 74 (40.0%) |
| Transportation | 47 (100.0%) | 0 (0.0%) |
| Material Moving | 110 (90.9%) | 11 (9.1%) |
| Total (Category) | 268 (75.9%) | 85 (24.1%) |
| Total (Overall) | 703 (59.7%) | 475 (40.3%) |
Employment Industries by Sex in South Pittsburg
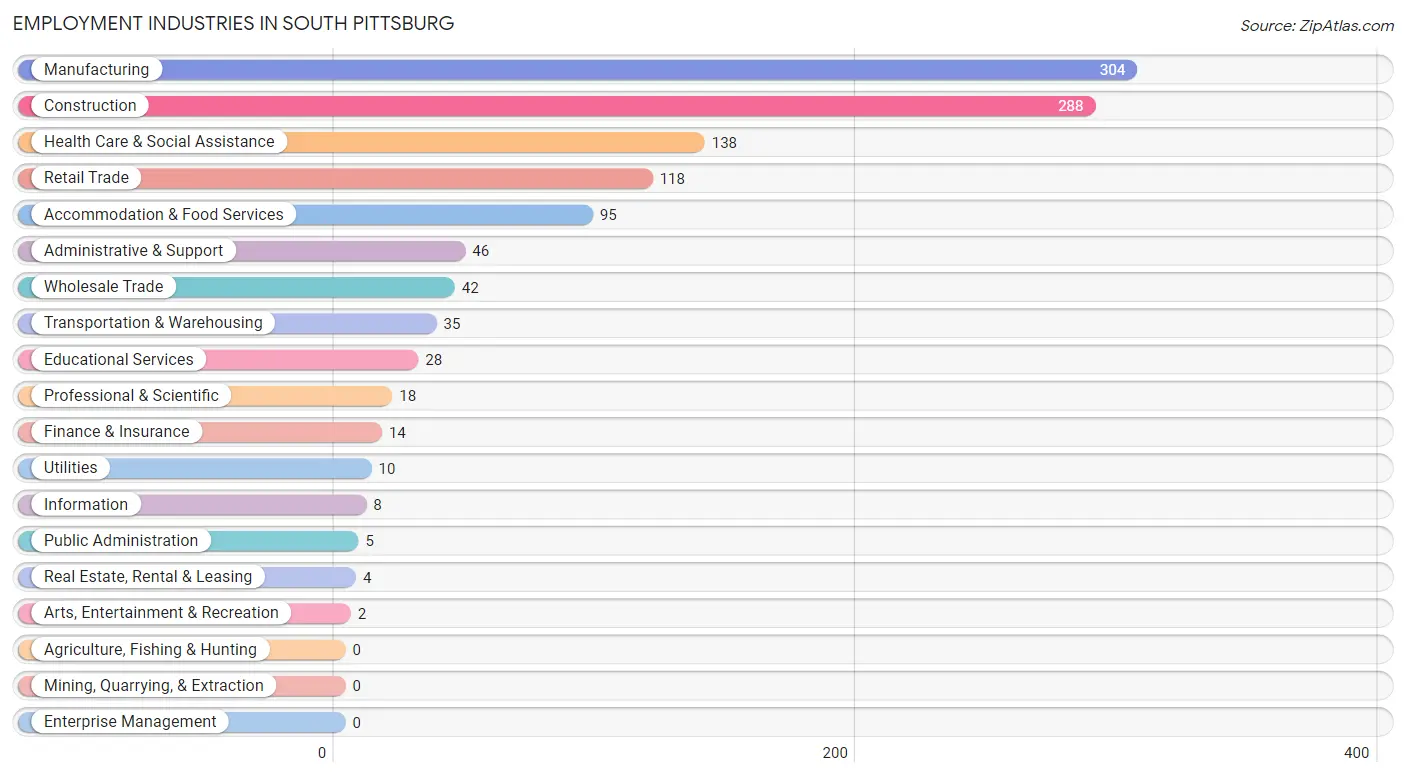
Employment Industries in South Pittsburg
The major employment industries in South Pittsburg include Manufacturing (304 | 25.8%), Construction (288 | 24.4%), Health Care & Social Assistance (138 | 11.7%), Retail Trade (118 | 10.0%), and Accommodation & Food Services (95 | 8.1%).
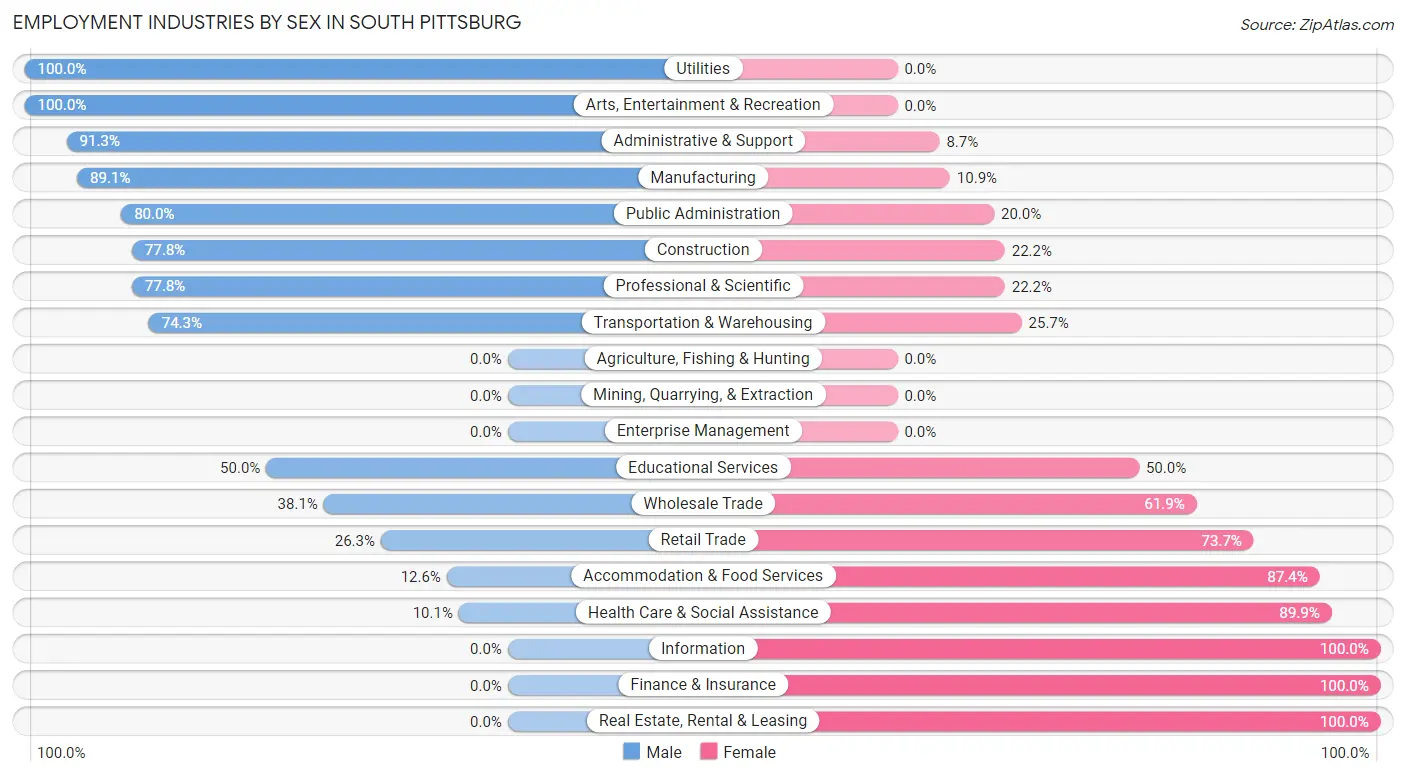
Employment Industries by Sex in South Pittsburg
The South Pittsburg industries that see more men than women are Utilities (100.0%), Arts, Entertainment & Recreation (100.0%), and Administrative & Support (91.3%), whereas the industries that tend to have a higher number of women are Information (100.0%), Finance & Insurance (100.0%), and Real Estate, Rental & Leasing (100.0%).
| Industry | Male | Female |
| Agriculture, Fishing & Hunting | 0 (0.0%) | 0 (0.0%) |
| Mining, Quarrying, & Extraction | 0 (0.0%) | 0 (0.0%) |
| Construction | 224 (77.8%) | 64 (22.2%) |
| Manufacturing | 271 (89.1%) | 33 (10.9%) |
| Wholesale Trade | 16 (38.1%) | 26 (61.9%) |
| Retail Trade | 31 (26.3%) | 87 (73.7%) |
| Transportation & Warehousing | 26 (74.3%) | 9 (25.7%) |
| Utilities | 10 (100.0%) | 0 (0.0%) |
| Information | 0 (0.0%) | 8 (100.0%) |
| Finance & Insurance | 0 (0.0%) | 14 (100.0%) |
| Real Estate, Rental & Leasing | 0 (0.0%) | 4 (100.0%) |
| Professional & Scientific | 14 (77.8%) | 4 (22.2%) |
| Enterprise Management | 0 (0.0%) | 0 (0.0%) |
| Administrative & Support | 42 (91.3%) | 4 (8.7%) |
| Educational Services | 14 (50.0%) | 14 (50.0%) |
| Health Care & Social Assistance | 14 (10.1%) | 124 (89.9%) |
| Arts, Entertainment & Recreation | 2 (100.0%) | 0 (0.0%) |
| Accommodation & Food Services | 12 (12.6%) | 83 (87.4%) |
| Public Administration | 4 (80.0%) | 1 (20.0%) |
| Total | 703 (59.7%) | 475 (40.3%) |
Education in South Pittsburg
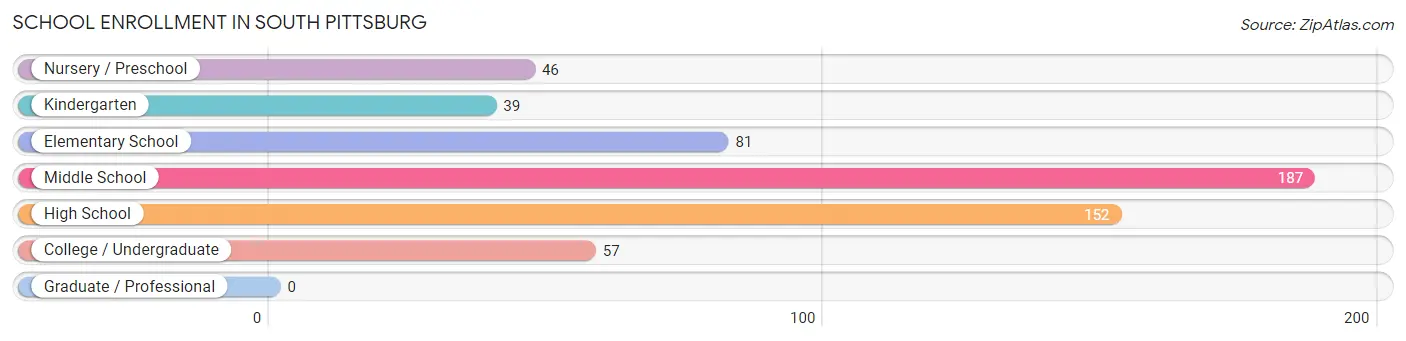
School Enrollment in South Pittsburg
The most common levels of schooling among the 562 students in South Pittsburg are middle school (187 | 33.3%), high school (152 | 27.1%), and elementary school (81 | 14.4%).
| School Level | # Students | % Students |
| Nursery / Preschool | 46 | 8.2% |
| Kindergarten | 39 | 6.9% |
| Elementary School | 81 | 14.4% |
| Middle School | 187 | 33.3% |
| High School | 152 | 27.1% |
| College / Undergraduate | 57 | 10.1% |
| Graduate / Professional | 0 | 0.0% |
| Total | 562 | 100.0% |
School Enrollment by Age by Funding Source in South Pittsburg
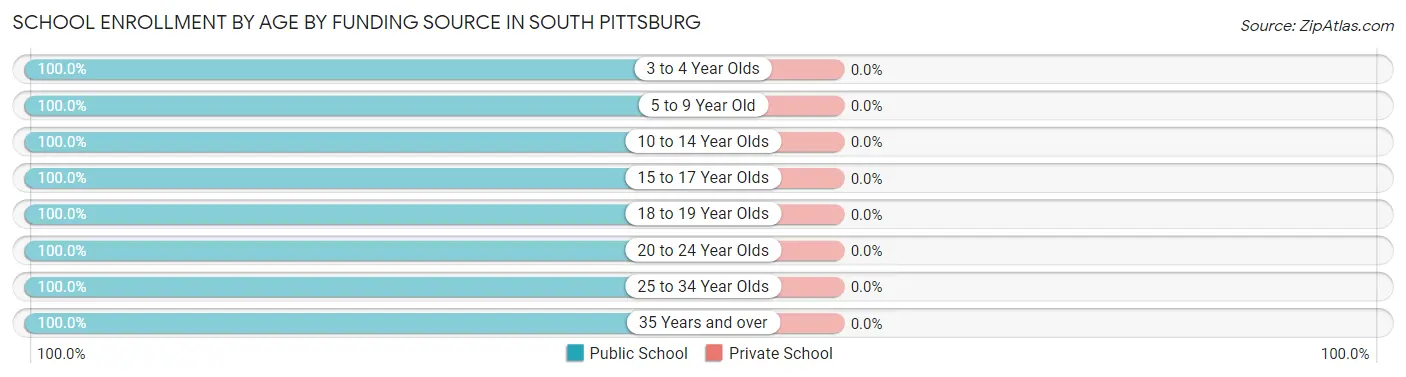
| Age Bracket | Public School | Private School |
| 3 to 4 Year Olds | 10 (100.0%) | 0 (0.0%) |
| 5 to 9 Year Old | 148 (100.0%) | 0 (0.0%) |
| 10 to 14 Year Olds | 195 (100.0%) | 0 (0.0%) |
| 15 to 17 Year Olds | 126 (100.0%) | 0 (0.0%) |
| 18 to 19 Year Olds | 26 (100.0%) | 0 (0.0%) |
| 20 to 24 Year Olds | 25 (100.0%) | 0 (0.0%) |
| 25 to 34 Year Olds | 14 (100.0%) | 0 (0.0%) |
| 35 Years and over | 18 (100.0%) | 0 (0.0%) |
| Total | 562 (100.0%) | 0 (0.0%) |
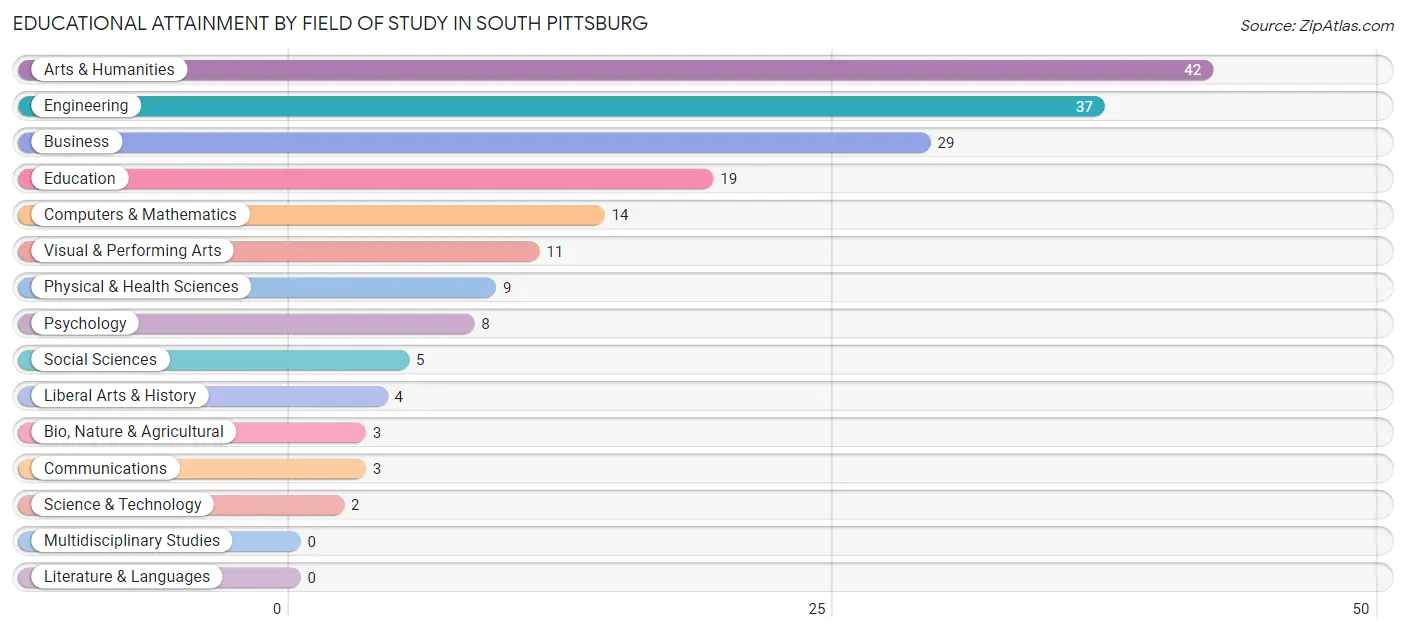
Educational Attainment by Field of Study in South Pittsburg
Arts & humanities (42 | 22.6%), engineering (37 | 19.9%), business (29 | 15.6%), education (19 | 10.2%), and computers & mathematics (14 | 7.5%) are the most common fields of study among 186 individuals in South Pittsburg who have obtained a bachelor's degree or higher.
| Field of Study | # Graduates | % Graduates |
| Computers & Mathematics | 14 | 7.5% |
| Bio, Nature & Agricultural | 3 | 1.6% |
| Physical & Health Sciences | 9 | 4.8% |
| Psychology | 8 | 4.3% |
| Social Sciences | 5 | 2.7% |
| Engineering | 37 | 19.9% |
| Multidisciplinary Studies | 0 | 0.0% |
| Science & Technology | 2 | 1.1% |
| Business | 29 | 15.6% |
| Education | 19 | 10.2% |
| Literature & Languages | 0 | 0.0% |
| Liberal Arts & History | 4 | 2.1% |
| Visual & Performing Arts | 11 | 5.9% |
| Communications | 3 | 1.6% |
| Arts & Humanities | 42 | 22.6% |
| Total | 186 | 100.0% |
Transportation & Commute in South Pittsburg
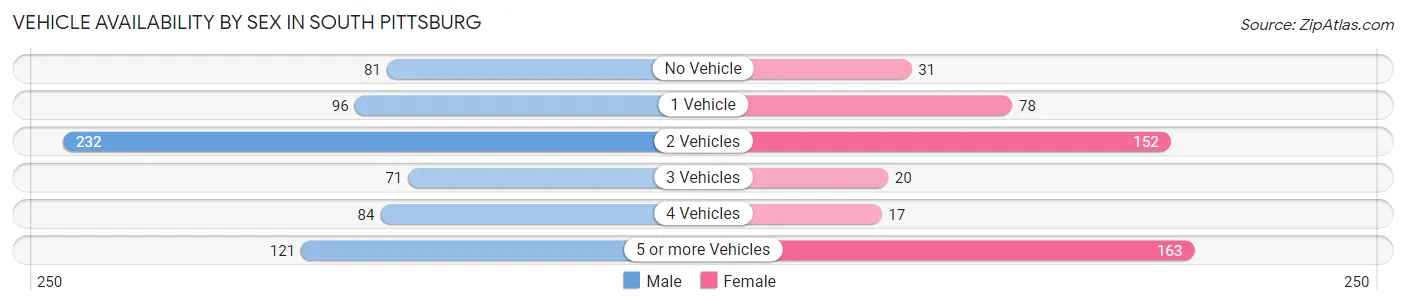
Vehicle Availability by Sex in South Pittsburg
The most prevalent vehicle ownership categories in South Pittsburg are males with 2 vehicles (232, accounting for 33.9%) and females with 2 vehicles (152, making up 50.3%).
| Vehicles Available | Male | Female |
| No Vehicle | 81 (11.8%) | 31 (6.7%) |
| 1 Vehicle | 96 (14.0%) | 78 (16.9%) |
| 2 Vehicles | 232 (33.9%) | 152 (33.0%) |
| 3 Vehicles | 71 (10.4%) | 20 (4.3%) |
| 4 Vehicles | 84 (12.3%) | 17 (3.7%) |
| 5 or more Vehicles | 121 (17.7%) | 163 (35.4%) |
| Total | 685 (100.0%) | 461 (100.0%) |
Commute Time in South Pittsburg
The most frequently occuring commute durations in South Pittsburg are 15 to 19 minutes (193 commuters, 17.2%), 10 to 14 minutes (181 commuters, 16.1%), and 30 to 34 minutes (169 commuters, 15.0%).
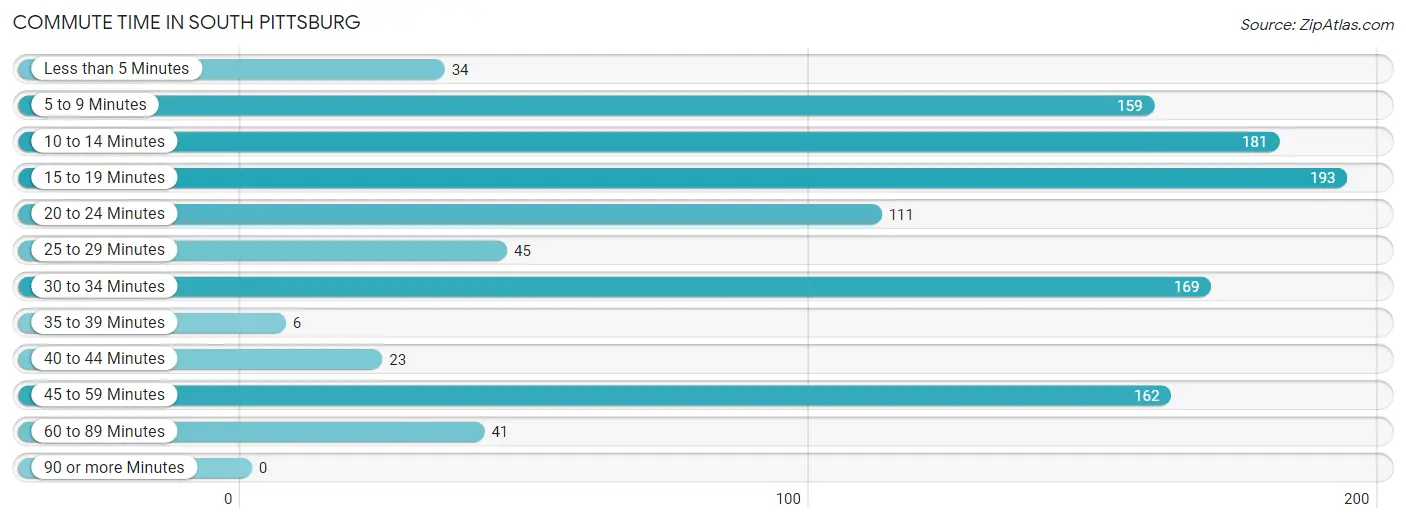
| Commute Time | # Commuters | % Commuters |
| Less than 5 Minutes | 34 | 3.0% |
| 5 to 9 Minutes | 159 | 14.1% |
| 10 to 14 Minutes | 181 | 16.1% |
| 15 to 19 Minutes | 193 | 17.2% |
| 20 to 24 Minutes | 111 | 9.9% |
| 25 to 29 Minutes | 45 | 4.0% |
| 30 to 34 Minutes | 169 | 15.0% |
| 35 to 39 Minutes | 6 | 0.5% |
| 40 to 44 Minutes | 23 | 2.1% |
| 45 to 59 Minutes | 162 | 14.4% |
| 60 to 89 Minutes | 41 | 3.6% |
| 90 or more Minutes | 0 | 0.0% |
Commute Time by Sex in South Pittsburg
The most common commute times in South Pittsburg are 45 to 59 minutes (116 commuters, 17.0%) for males and 15 to 19 minutes (102 commuters, 23.1%) for females.
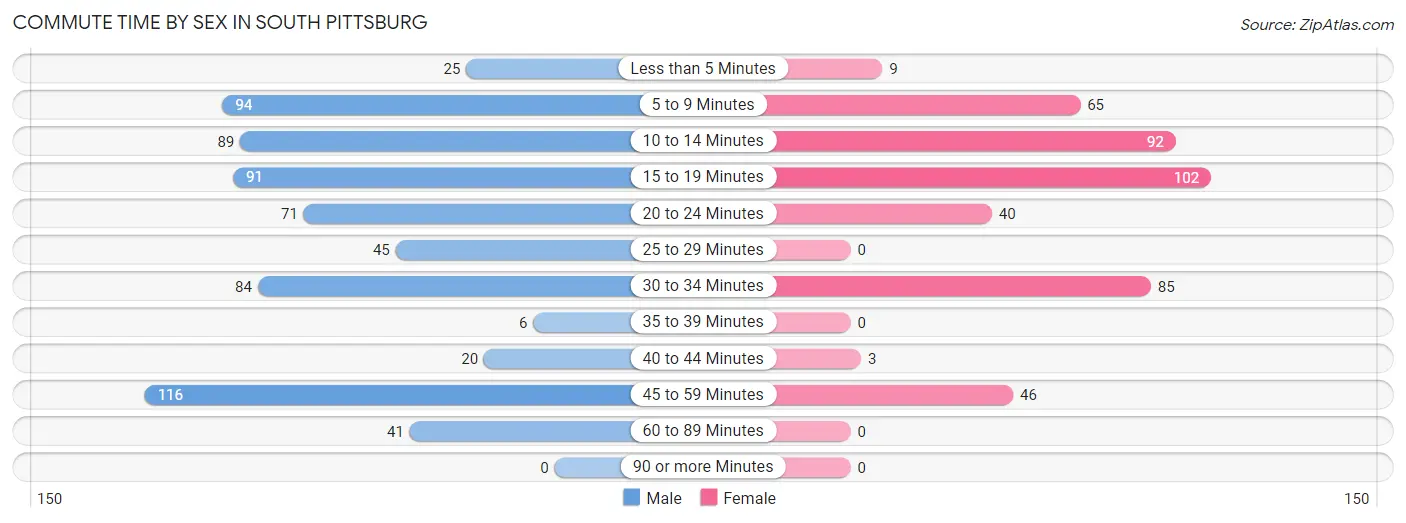
| Commute Time | Male | Female |
| Less than 5 Minutes | 25 (3.7%) | 9 (2.0%) |
| 5 to 9 Minutes | 94 (13.8%) | 65 (14.7%) |
| 10 to 14 Minutes | 89 (13.1%) | 92 (20.8%) |
| 15 to 19 Minutes | 91 (13.3%) | 102 (23.1%) |
| 20 to 24 Minutes | 71 (10.4%) | 40 (9.0%) |
| 25 to 29 Minutes | 45 (6.6%) | 0 (0.0%) |
| 30 to 34 Minutes | 84 (12.3%) | 85 (19.2%) |
| 35 to 39 Minutes | 6 (0.9%) | 0 (0.0%) |
| 40 to 44 Minutes | 20 (2.9%) | 3 (0.7%) |
| 45 to 59 Minutes | 116 (17.0%) | 46 (10.4%) |
| 60 to 89 Minutes | 41 (6.0%) | 0 (0.0%) |
| 90 or more Minutes | 0 (0.0%) | 0 (0.0%) |
Time of Departure to Work by Sex in South Pittsburg
The most frequent times of departure to work in South Pittsburg are 12:00 AM to 4:59 AM (122, 17.9%) for males and 7:30 AM to 7:59 AM (93, 21.0%) for females.
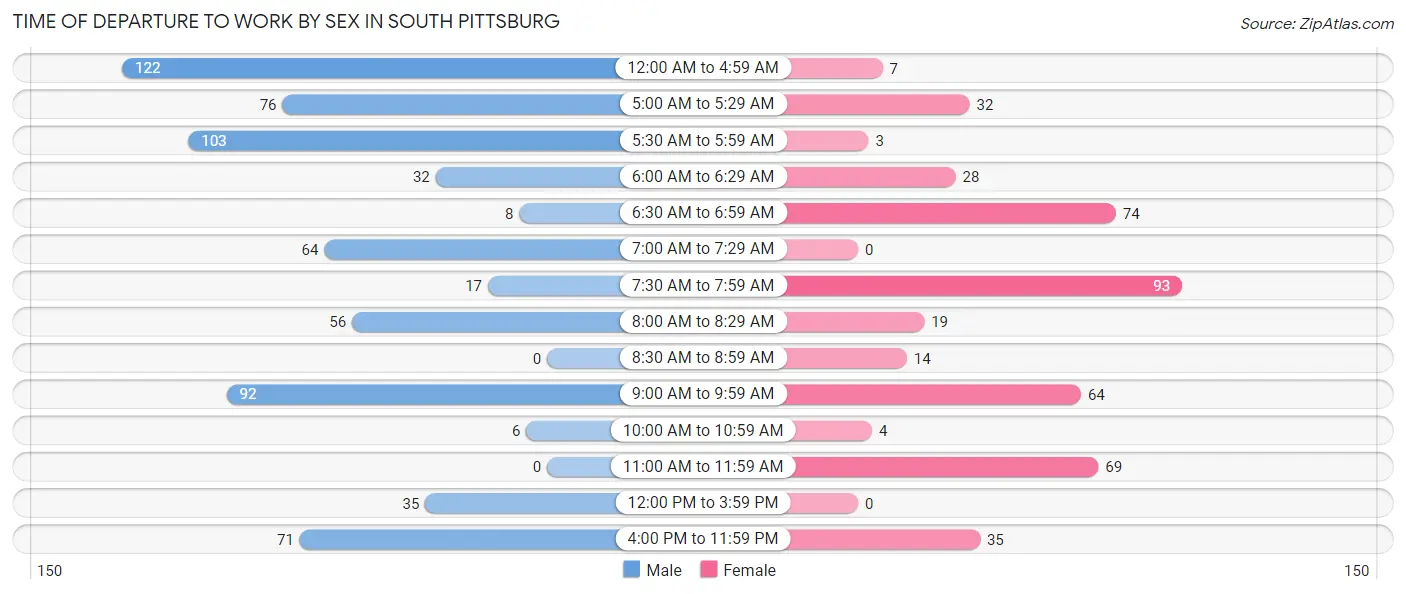
| Time of Departure | Male | Female |
| 12:00 AM to 4:59 AM | 122 (17.9%) | 7 (1.6%) |
| 5:00 AM to 5:29 AM | 76 (11.1%) | 32 (7.2%) |
| 5:30 AM to 5:59 AM | 103 (15.1%) | 3 (0.7%) |
| 6:00 AM to 6:29 AM | 32 (4.7%) | 28 (6.3%) |
| 6:30 AM to 6:59 AM | 8 (1.2%) | 74 (16.7%) |
| 7:00 AM to 7:29 AM | 64 (9.4%) | 0 (0.0%) |
| 7:30 AM to 7:59 AM | 17 (2.5%) | 93 (21.0%) |
| 8:00 AM to 8:29 AM | 56 (8.2%) | 19 (4.3%) |
| 8:30 AM to 8:59 AM | 0 (0.0%) | 14 (3.2%) |
| 9:00 AM to 9:59 AM | 92 (13.5%) | 64 (14.5%) |
| 10:00 AM to 10:59 AM | 6 (0.9%) | 4 (0.9%) |
| 11:00 AM to 11:59 AM | 0 (0.0%) | 69 (15.6%) |
| 12:00 PM to 3:59 PM | 35 (5.1%) | 0 (0.0%) |
| 4:00 PM to 11:59 PM | 71 (10.4%) | 35 (7.9%) |
| Total | 682 (100.0%) | 442 (100.0%) |
Housing Occupancy in South Pittsburg
Occupancy by Ownership in South Pittsburg
Of the total 1,233 dwellings in South Pittsburg, owner-occupied units account for 801 (65.0%), while renter-occupied units make up 432 (35.0%).
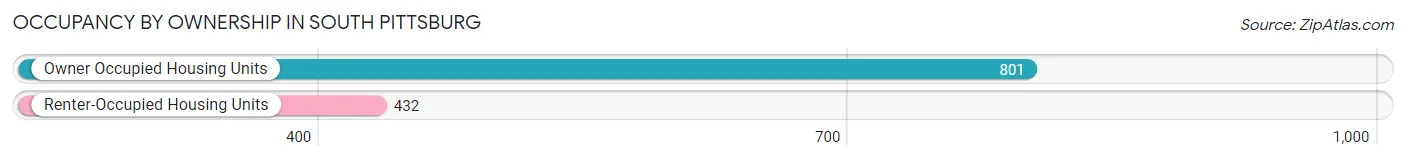
| Occupancy | # Housing Units | % Housing Units |
| Owner Occupied Housing Units | 801 | 65.0% |
| Renter-Occupied Housing Units | 432 | 35.0% |
| Total Occupied Housing Units | 1,233 | 100.0% |
Occupancy by Household Size in South Pittsburg
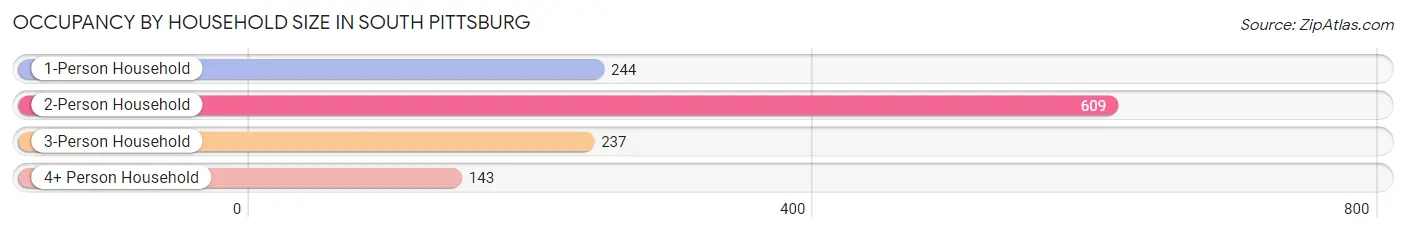
| Household Size | # Housing Units | % Housing Units |
| 1-Person Household | 244 | 19.8% |
| 2-Person Household | 609 | 49.4% |
| 3-Person Household | 237 | 19.2% |
| 4+ Person Household | 143 | 11.6% |
| Total Housing Units | 1,233 | 100.0% |
Occupancy by Ownership by Household Size in South Pittsburg
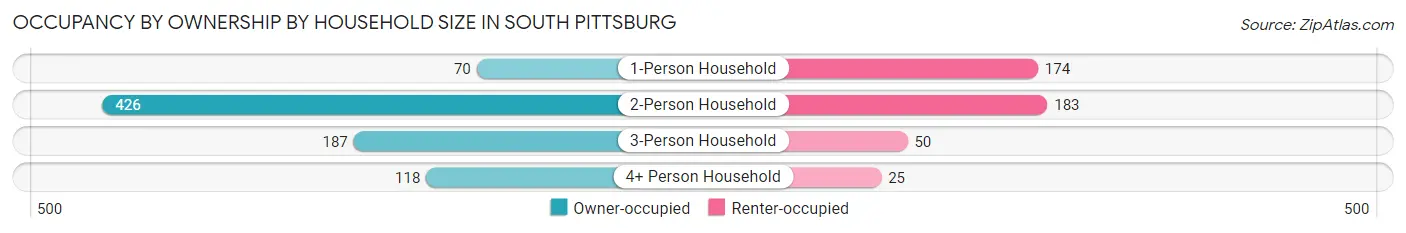
| Household Size | Owner-occupied | Renter-occupied |
| 1-Person Household | 70 (28.7%) | 174 (71.3%) |
| 2-Person Household | 426 (70.0%) | 183 (30.0%) |
| 3-Person Household | 187 (78.9%) | 50 (21.1%) |
| 4+ Person Household | 118 (82.5%) | 25 (17.5%) |
| Total Housing Units | 801 (65.0%) | 432 (35.0%) |
Occupancy by Educational Attainment in South Pittsburg
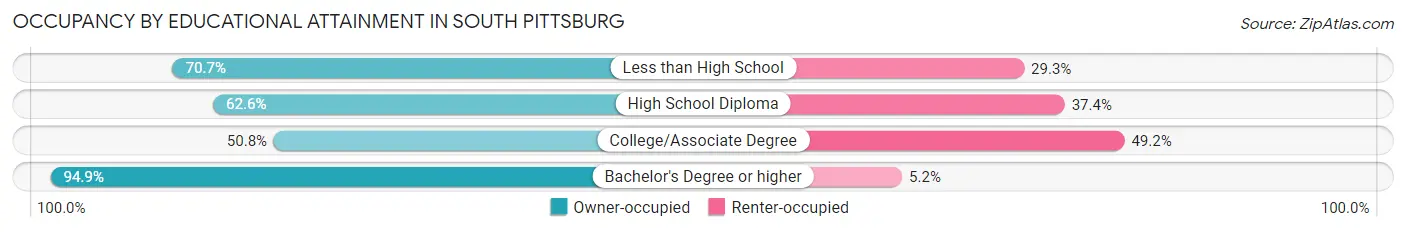
| Household Size | Owner-occupied | Renter-occupied |
| Less than High School | 183 (70.7%) | 76 (29.3%) |
| High School Diploma | 427 (62.6%) | 255 (37.4%) |
| College/Associate Degree | 99 (50.8%) | 96 (49.2%) |
| Bachelor's Degree or higher | 92 (94.9%) | 5 (5.1%) |
Occupancy by Age of Householder in South Pittsburg
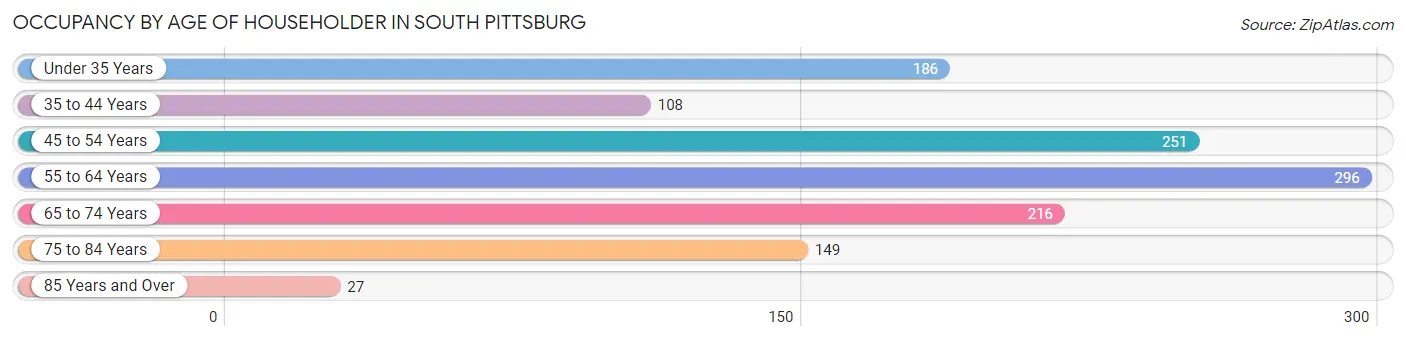
| Age Bracket | # Households | % Households |
| Under 35 Years | 186 | 15.1% |
| 35 to 44 Years | 108 | 8.8% |
| 45 to 54 Years | 251 | 20.4% |
| 55 to 64 Years | 296 | 24.0% |
| 65 to 74 Years | 216 | 17.5% |
| 75 to 84 Years | 149 | 12.1% |
| 85 Years and Over | 27 | 2.2% |
| Total | 1,233 | 100.0% |
Housing Finances in South Pittsburg
Median Income by Occupancy in South Pittsburg
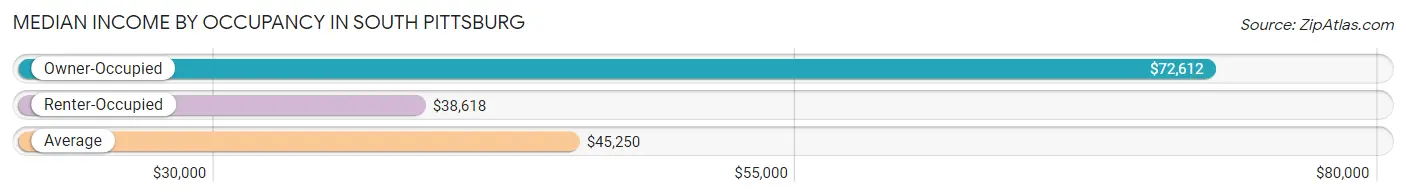
| Occupancy Type | # Households | Median Income |
| Owner-Occupied | 801 (65.0%) | $72,612 |
| Renter-Occupied | 432 (35.0%) | $38,618 |
| Average | 1,233 (100.0%) | $45,250 |
Occupancy by Householder Income Bracket in South Pittsburg
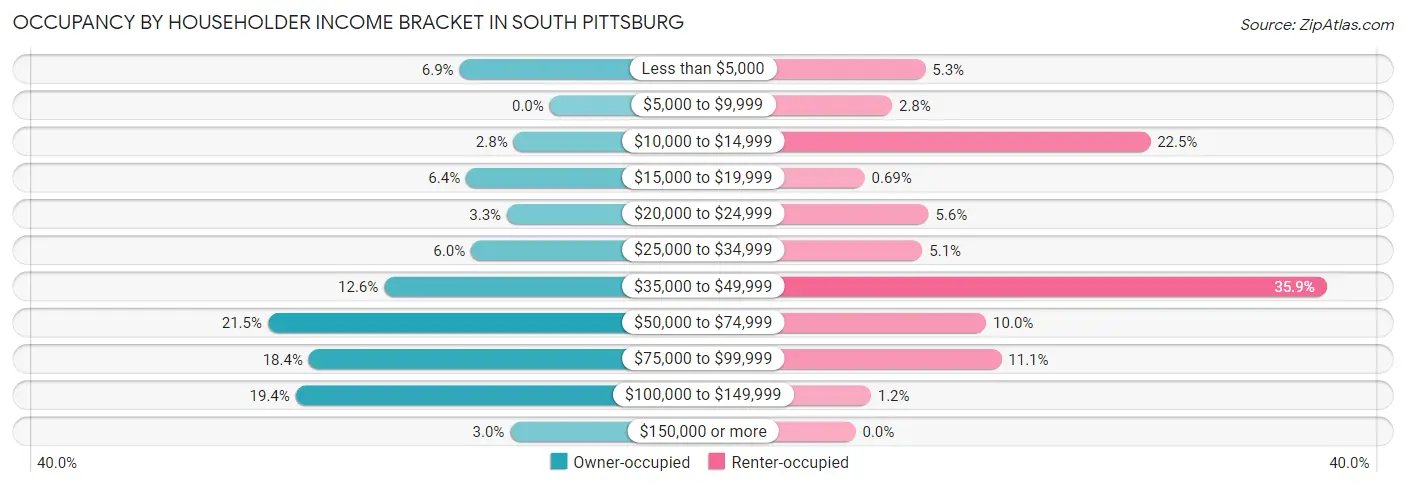
| Income Bracket | Owner-occupied | Renter-occupied |
| Less than $5,000 | 55 (6.9%) | 23 (5.3%) |
| $5,000 to $9,999 | 0 (0.0%) | 12 (2.8%) |
| $10,000 to $14,999 | 22 (2.8%) | 97 (22.5%) |
| $15,000 to $19,999 | 51 (6.4%) | 3 (0.7%) |
| $20,000 to $24,999 | 26 (3.3%) | 24 (5.6%) |
| $25,000 to $34,999 | 48 (6.0%) | 22 (5.1%) |
| $35,000 to $49,999 | 101 (12.6%) | 155 (35.9%) |
| $50,000 to $74,999 | 172 (21.5%) | 43 (10.0%) |
| $75,000 to $99,999 | 147 (18.3%) | 48 (11.1%) |
| $100,000 to $149,999 | 155 (19.4%) | 5 (1.2%) |
| $150,000 or more | 24 (3.0%) | 0 (0.0%) |
| Total | 801 (100.0%) | 432 (100.0%) |
Monthly Housing Cost Tiers in South Pittsburg
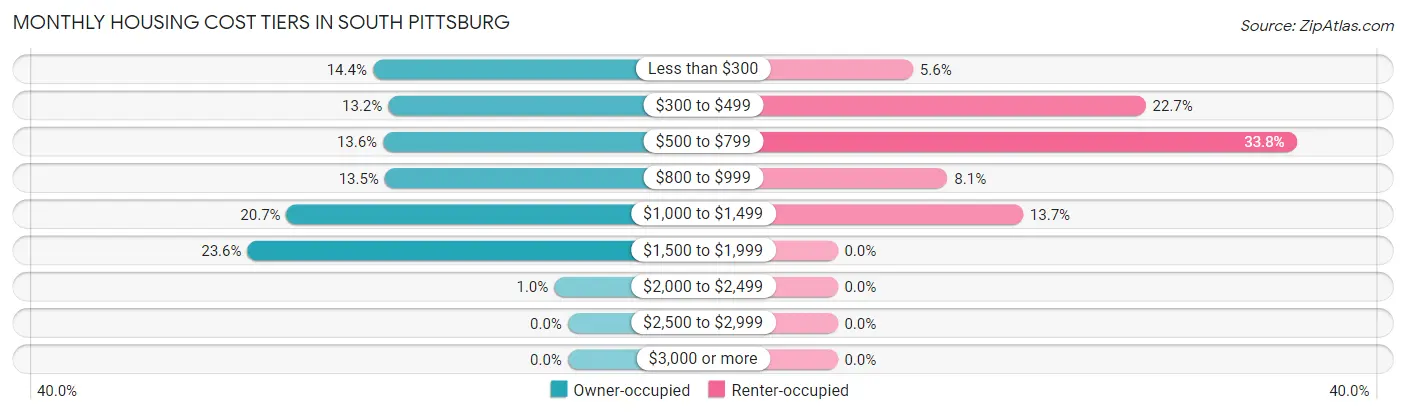
| Monthly Cost | Owner-occupied | Renter-occupied |
| Less than $300 | 115 (14.4%) | 24 (5.6%) |
| $300 to $499 | 106 (13.2%) | 98 (22.7%) |
| $500 to $799 | 109 (13.6%) | 146 (33.8%) |
| $800 to $999 | 108 (13.5%) | 35 (8.1%) |
| $1,000 to $1,499 | 166 (20.7%) | 59 (13.7%) |
| $1,500 to $1,999 | 189 (23.6%) | 0 (0.0%) |
| $2,000 to $2,499 | 8 (1.0%) | 0 (0.0%) |
| $2,500 to $2,999 | 0 (0.0%) | 0 (0.0%) |
| $3,000 or more | 0 (0.0%) | 0 (0.0%) |
| Total | 801 (100.0%) | 432 (100.0%) |
Physical Housing Characteristics in South Pittsburg
Housing Structures in South Pittsburg
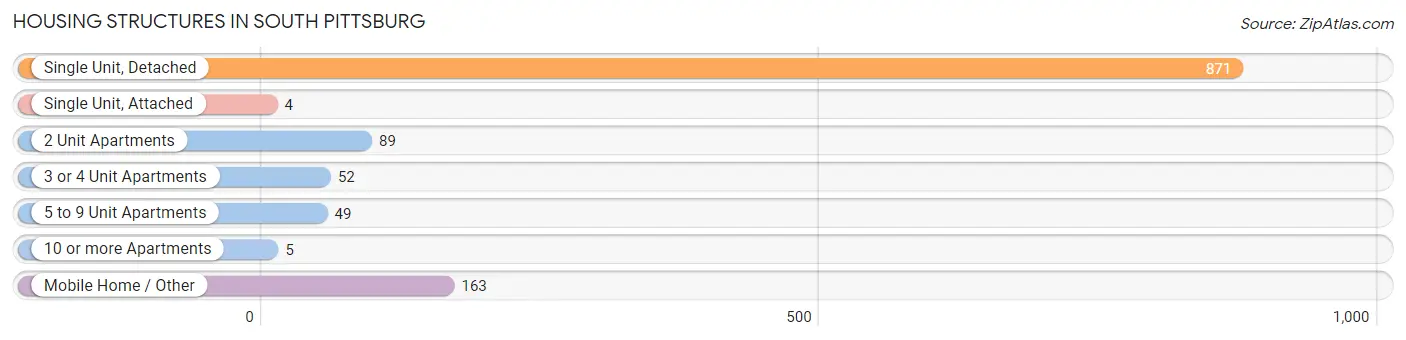
| Structure Type | # Housing Units | % Housing Units |
| Single Unit, Detached | 871 | 70.6% |
| Single Unit, Attached | 4 | 0.3% |
| 2 Unit Apartments | 89 | 7.2% |
| 3 or 4 Unit Apartments | 52 | 4.2% |
| 5 to 9 Unit Apartments | 49 | 4.0% |
| 10 or more Apartments | 5 | 0.4% |
| Mobile Home / Other | 163 | 13.2% |
| Total | 1,233 | 100.0% |
Housing Structures by Occupancy in South Pittsburg
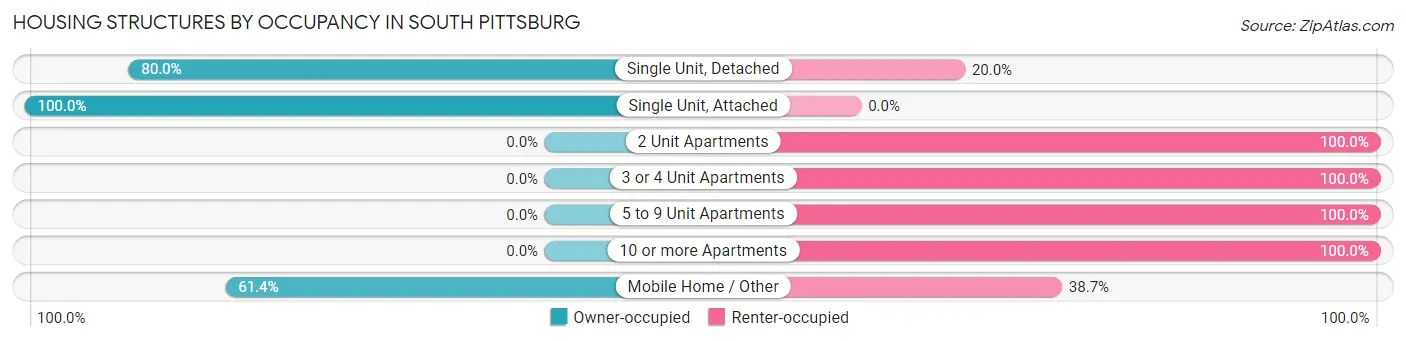
| Structure Type | Owner-occupied | Renter-occupied |
| Single Unit, Detached | 697 (80.0%) | 174 (20.0%) |
| Single Unit, Attached | 4 (100.0%) | 0 (0.0%) |
| 2 Unit Apartments | 0 (0.0%) | 89 (100.0%) |
| 3 or 4 Unit Apartments | 0 (0.0%) | 52 (100.0%) |
| 5 to 9 Unit Apartments | 0 (0.0%) | 49 (100.0%) |
| 10 or more Apartments | 0 (0.0%) | 5 (100.0%) |
| Mobile Home / Other | 100 (61.4%) | 63 (38.7%) |
| Total | 801 (65.0%) | 432 (35.0%) |
Housing Structures by Number of Rooms in South Pittsburg
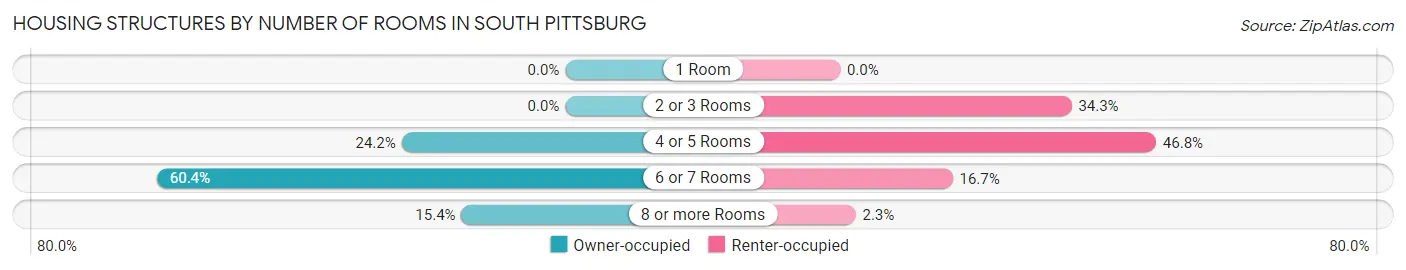
| Number of Rooms | Owner-occupied | Renter-occupied |
| 1 Room | 0 (0.0%) | 0 (0.0%) |
| 2 or 3 Rooms | 0 (0.0%) | 148 (34.3%) |
| 4 or 5 Rooms | 194 (24.2%) | 202 (46.8%) |
| 6 or 7 Rooms | 484 (60.4%) | 72 (16.7%) |
| 8 or more Rooms | 123 (15.4%) | 10 (2.3%) |
| Total | 801 (100.0%) | 432 (100.0%) |
Housing Structure by Heating Type in South Pittsburg
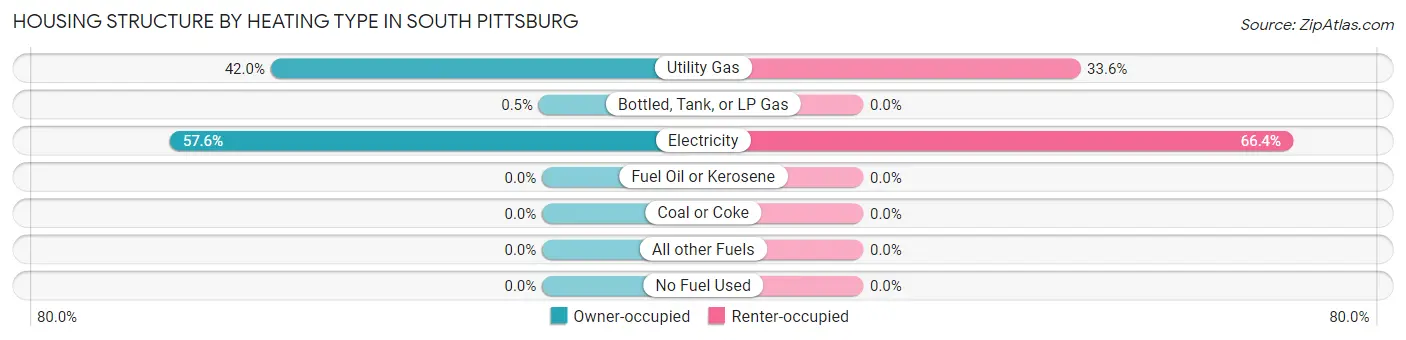
| Heating Type | Owner-occupied | Renter-occupied |
| Utility Gas | 336 (41.9%) | 145 (33.6%) |
| Bottled, Tank, or LP Gas | 4 (0.5%) | 0 (0.0%) |
| Electricity | 461 (57.6%) | 287 (66.4%) |
| Fuel Oil or Kerosene | 0 (0.0%) | 0 (0.0%) |
| Coal or Coke | 0 (0.0%) | 0 (0.0%) |
| All other Fuels | 0 (0.0%) | 0 (0.0%) |
| No Fuel Used | 0 (0.0%) | 0 (0.0%) |
| Total | 801 (100.0%) | 432 (100.0%) |
Household Vehicle Usage in South Pittsburg
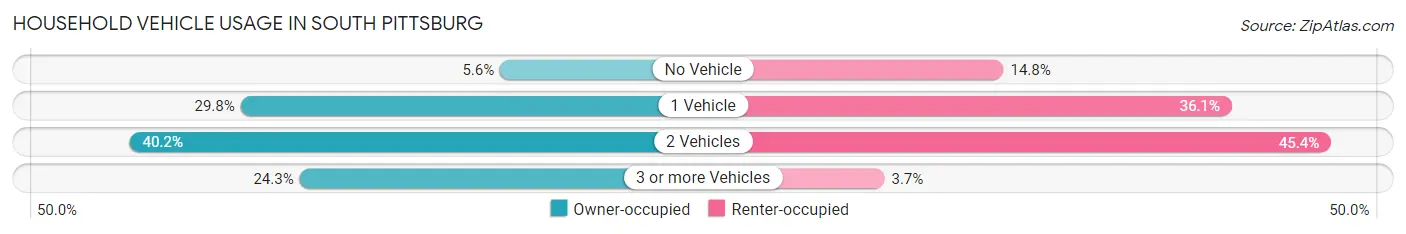
| Vehicles per Household | Owner-occupied | Renter-occupied |
| No Vehicle | 45 (5.6%) | 64 (14.8%) |
| 1 Vehicle | 239 (29.8%) | 156 (36.1%) |
| 2 Vehicles | 322 (40.2%) | 196 (45.4%) |
| 3 or more Vehicles | 195 (24.3%) | 16 (3.7%) |
| Total | 801 (100.0%) | 432 (100.0%) |
Real Estate & Mortgages in South Pittsburg
Real Estate and Mortgage Overview in South Pittsburg
| Characteristic | Without Mortgage | With Mortgage |
| Housing Units | 342 | 459 |
| Median Property Value | $145,000 | $135,800 |
| Median Household Income | $56,042 | $24 |
| Monthly Housing Costs | $373 | $0 |
| Real Estate Taxes | $725 | $18 |
Property Value by Mortgage Status in South Pittsburg
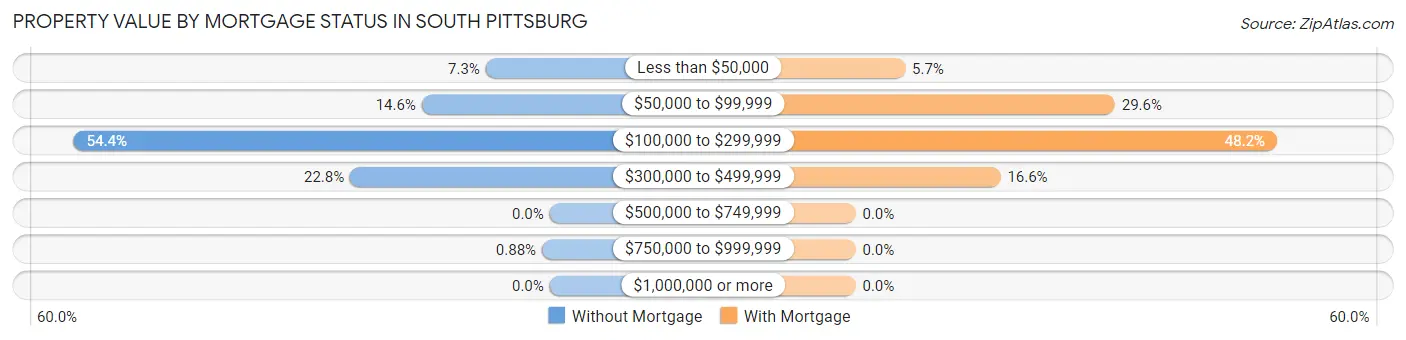
| Property Value | Without Mortgage | With Mortgage |
| Less than $50,000 | 25 (7.3%) | 26 (5.7%) |
| $50,000 to $99,999 | 50 (14.6%) | 136 (29.6%) |
| $100,000 to $299,999 | 186 (54.4%) | 221 (48.1%) |
| $300,000 to $499,999 | 78 (22.8%) | 76 (16.6%) |
| $500,000 to $749,999 | 0 (0.0%) | 0 (0.0%) |
| $750,000 to $999,999 | 3 (0.9%) | 0 (0.0%) |
| $1,000,000 or more | 0 (0.0%) | 0 (0.0%) |
| Total | 342 (100.0%) | 459 (100.0%) |
Household Income by Mortgage Status in South Pittsburg
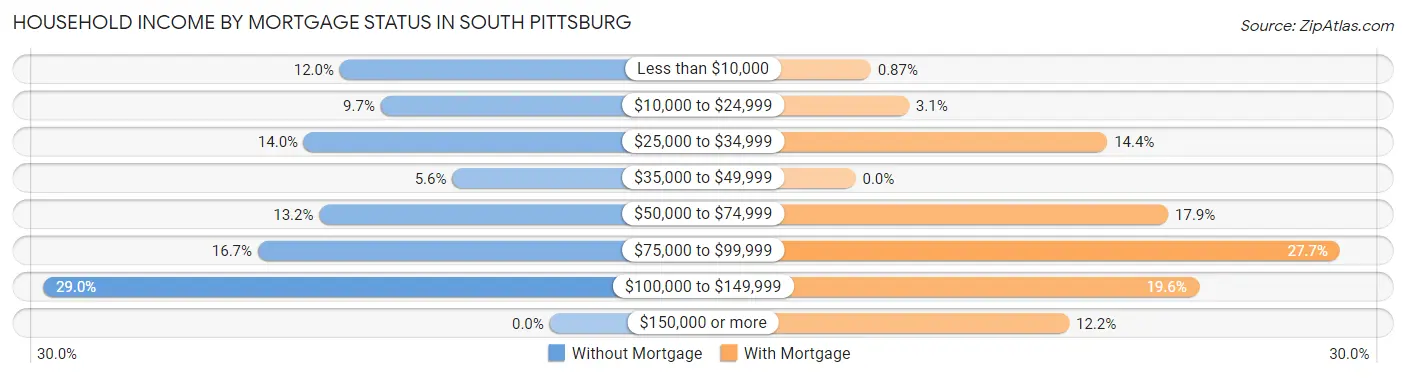
| Household Income | Without Mortgage | With Mortgage |
| Less than $10,000 | 41 (12.0%) | 4 (0.9%) |
| $10,000 to $24,999 | 33 (9.7%) | 14 (3.0%) |
| $25,000 to $34,999 | 48 (14.0%) | 66 (14.4%) |
| $35,000 to $49,999 | 19 (5.6%) | 0 (0.0%) |
| $50,000 to $74,999 | 45 (13.2%) | 82 (17.9%) |
| $75,000 to $99,999 | 57 (16.7%) | 127 (27.7%) |
| $100,000 to $149,999 | 99 (28.9%) | 90 (19.6%) |
| $150,000 or more | 0 (0.0%) | 56 (12.2%) |
| Total | 342 (100.0%) | 459 (100.0%) |
Property Value to Household Income Ratio in South Pittsburg
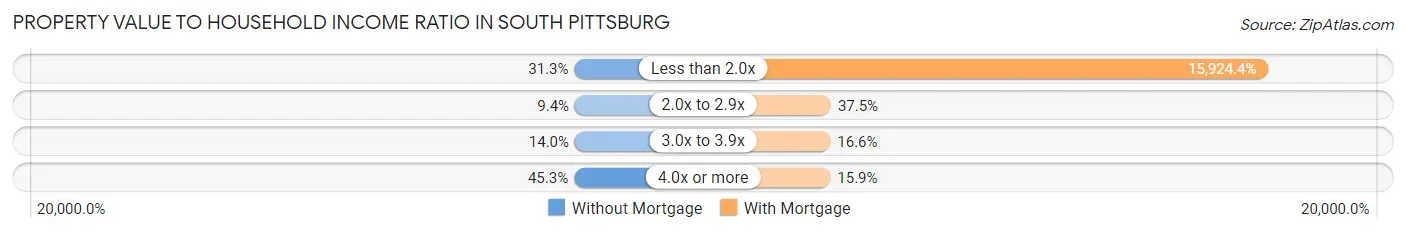
| Value-to-Income Ratio | Without Mortgage | With Mortgage |
| Less than 2.0x | 107 (31.3%) | 73,093 (15,924.4%) |
| 2.0x to 2.9x | 32 (9.4%) | 172 (37.5%) |
| 3.0x to 3.9x | 48 (14.0%) | 76 (16.6%) |
| 4.0x or more | 155 (45.3%) | 73 (15.9%) |
| Total | 342 (100.0%) | 459 (100.0%) |
Real Estate Taxes by Mortgage Status in South Pittsburg
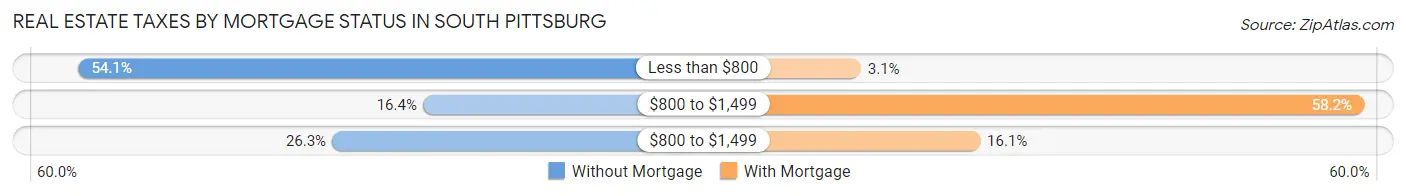
| Property Taxes | Without Mortgage | With Mortgage |
| Less than $800 | 185 (54.1%) | 14 (3.0%) |
| $800 to $1,499 | 56 (16.4%) | 267 (58.2%) |
| $800 to $1,499 | 90 (26.3%) | 74 (16.1%) |
| Total | 342 (100.0%) | 459 (100.0%) |
Health & Disability in South Pittsburg
Health Insurance Coverage by Age in South Pittsburg
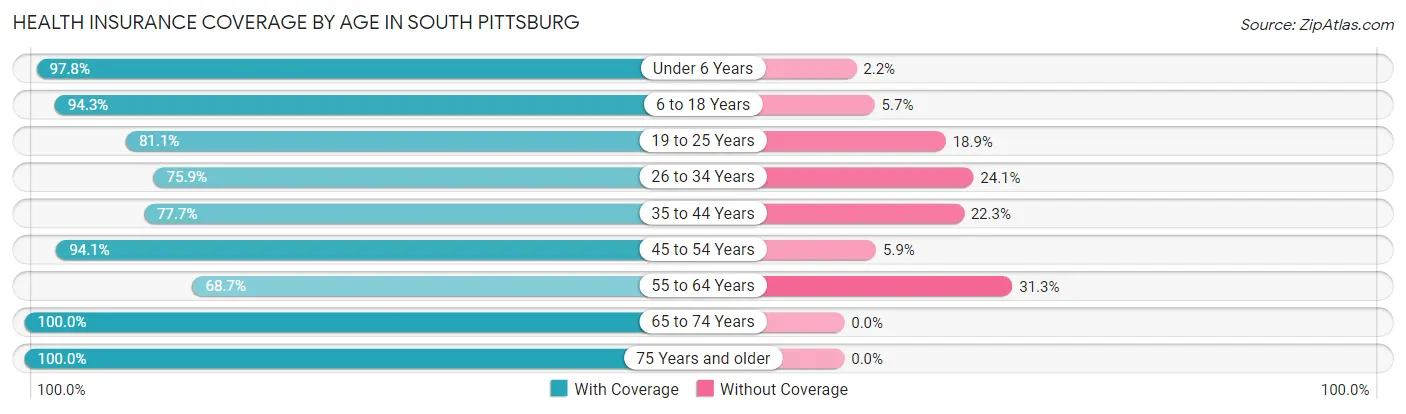
| Age Bracket | With Coverage | Without Coverage |
| Under 6 Years | 131 (97.8%) | 3 (2.2%) |
| 6 to 18 Years | 417 (94.3%) | 25 (5.7%) |
| 19 to 25 Years | 193 (81.1%) | 45 (18.9%) |
| 26 to 34 Years | 183 (75.9%) | 58 (24.1%) |
| 35 to 44 Years | 199 (77.7%) | 57 (22.3%) |
| 45 to 54 Years | 428 (94.1%) | 27 (5.9%) |
| 55 to 64 Years | 423 (68.7%) | 193 (31.3%) |
| 65 to 74 Years | 347 (100.0%) | 0 (0.0%) |
| 75 Years and older | 224 (100.0%) | 0 (0.0%) |
| Total | 2,545 (86.2%) | 408 (13.8%) |
Health Insurance Coverage by Citizenship Status in South Pittsburg
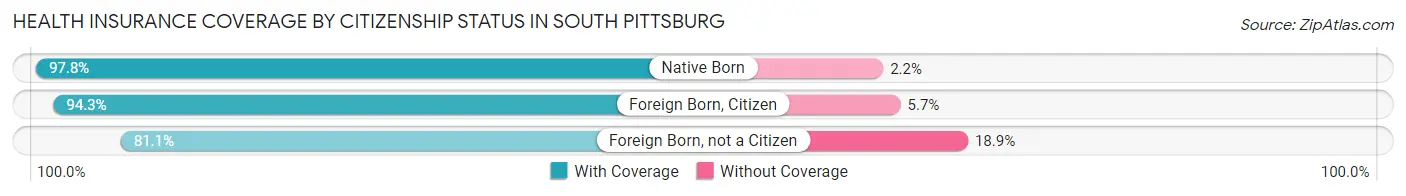
| Citizenship Status | With Coverage | Without Coverage |
| Native Born | 131 (97.8%) | 3 (2.2%) |
| Foreign Born, Citizen | 417 (94.3%) | 25 (5.7%) |
| Foreign Born, not a Citizen | 193 (81.1%) | 45 (18.9%) |
Health Insurance Coverage by Household Income in South Pittsburg
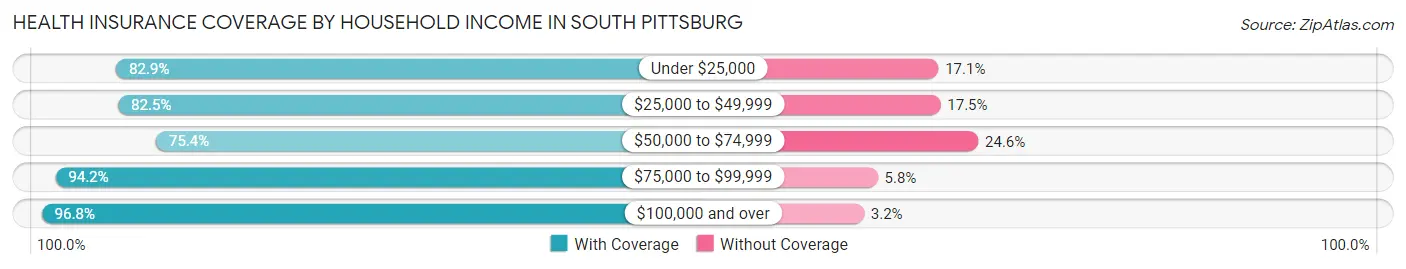
| Household Income | With Coverage | Without Coverage |
| Under $25,000 | 445 (82.9%) | 92 (17.1%) |
| $25,000 to $49,999 | 621 (82.5%) | 132 (17.5%) |
| $50,000 to $74,999 | 420 (75.4%) | 137 (24.6%) |
| $75,000 to $99,999 | 441 (94.2%) | 27 (5.8%) |
| $100,000 and over | 606 (96.8%) | 20 (3.2%) |
Public vs Private Health Insurance Coverage by Age in South Pittsburg
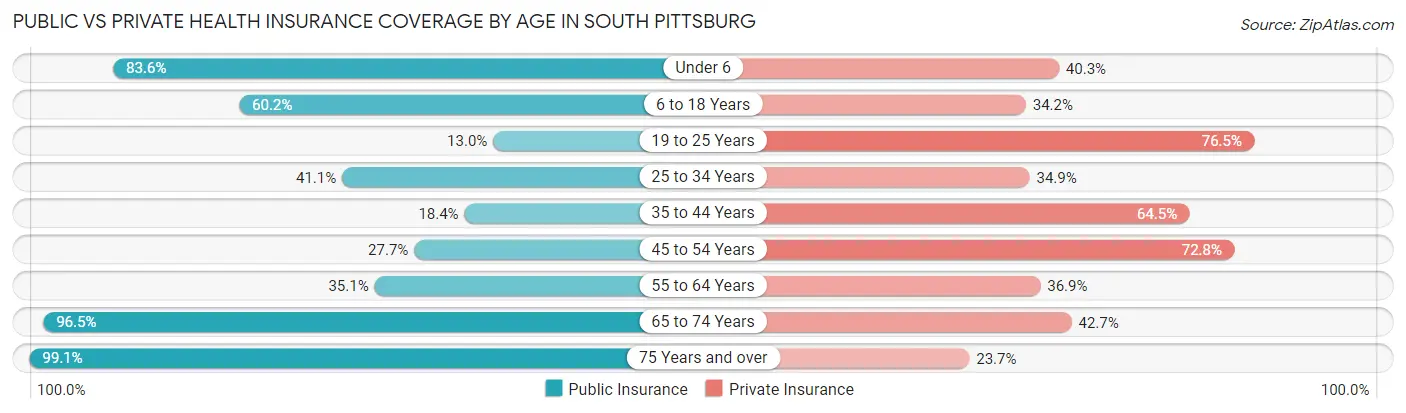
| Age Bracket | Public Insurance | Private Insurance |
| Under 6 | 112 (83.6%) | 54 (40.3%) |
| 6 to 18 Years | 266 (60.2%) | 151 (34.2%) |
| 19 to 25 Years | 31 (13.0%) | 182 (76.5%) |
| 25 to 34 Years | 99 (41.1%) | 84 (34.8%) |
| 35 to 44 Years | 47 (18.4%) | 165 (64.4%) |
| 45 to 54 Years | 126 (27.7%) | 331 (72.8%) |
| 55 to 64 Years | 216 (35.1%) | 227 (36.8%) |
| 65 to 74 Years | 335 (96.5%) | 148 (42.6%) |
| 75 Years and over | 222 (99.1%) | 53 (23.7%) |
| Total | 1,454 (49.2%) | 1,395 (47.2%) |
Disability Status by Sex by Age in South Pittsburg
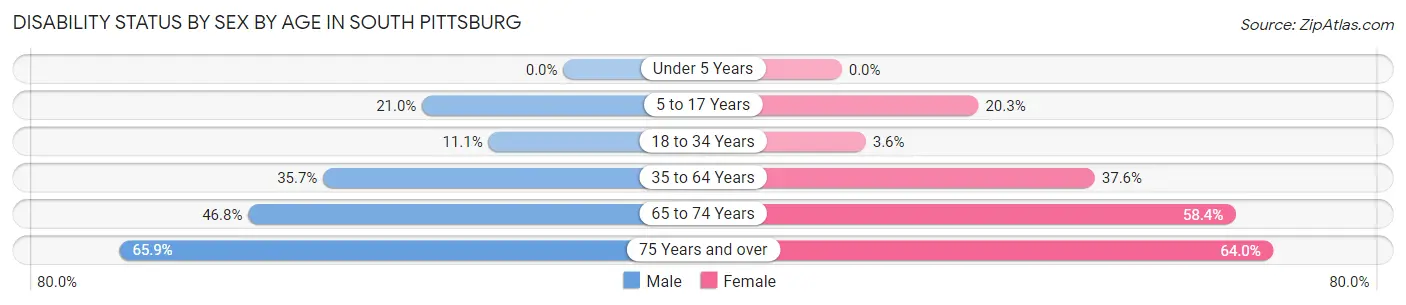
| Age Bracket | Male | Female |
| Under 5 Years | 0 (0.0%) | 0 (0.0%) |
| 5 to 17 Years | 57 (21.0%) | 40 (20.3%) |
| 18 to 34 Years | 28 (11.1%) | 9 (3.6%) |
| 35 to 64 Years | 255 (35.7%) | 230 (37.6%) |
| 65 to 74 Years | 51 (46.8%) | 139 (58.4%) |
| 75 Years and over | 58 (65.9%) | 87 (64.0%) |
Disability Class by Sex by Age in South Pittsburg
Disability Class: Hearing Difficulty
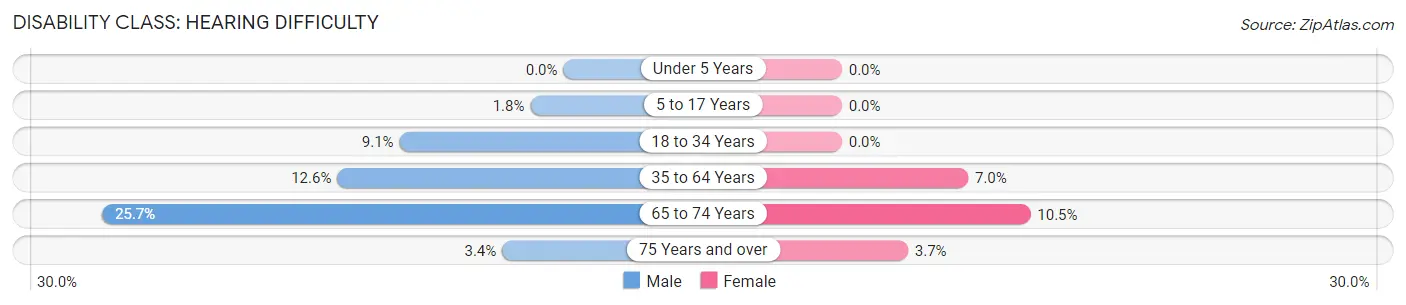
| Age Bracket | Male | Female |
| Under 5 Years | 0 (0.0%) | 0 (0.0%) |
| 5 to 17 Years | 5 (1.8%) | 0 (0.0%) |
| 18 to 34 Years | 23 (9.1%) | 0 (0.0%) |
| 35 to 64 Years | 90 (12.6%) | 43 (7.0%) |
| 65 to 74 Years | 28 (25.7%) | 25 (10.5%) |
| 75 Years and over | 3 (3.4%) | 5 (3.7%) |
Disability Class: Vision Difficulty
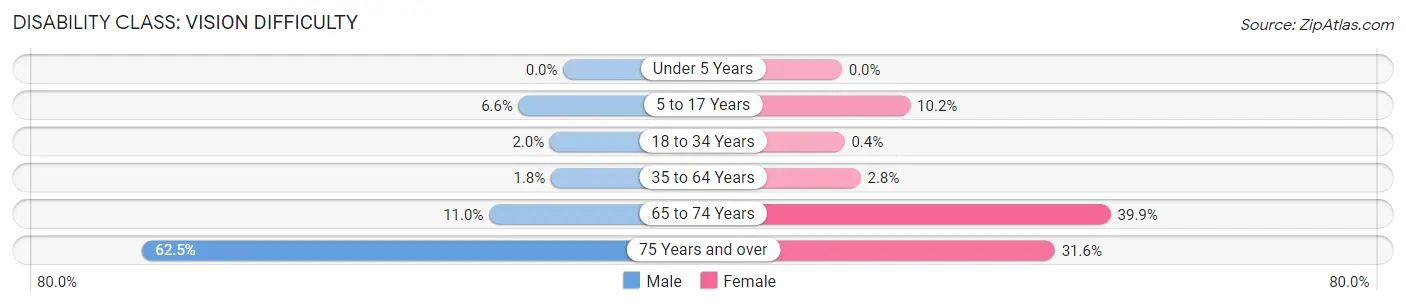
| Age Bracket | Male | Female |
| Under 5 Years | 0 (0.0%) | 0 (0.0%) |
| 5 to 17 Years | 18 (6.6%) | 20 (10.2%) |
| 18 to 34 Years | 5 (2.0%) | 1 (0.4%) |
| 35 to 64 Years | 13 (1.8%) | 17 (2.8%) |
| 65 to 74 Years | 12 (11.0%) | 95 (39.9%) |
| 75 Years and over | 55 (62.5%) | 43 (31.6%) |
Disability Class: Cognitive Difficulty
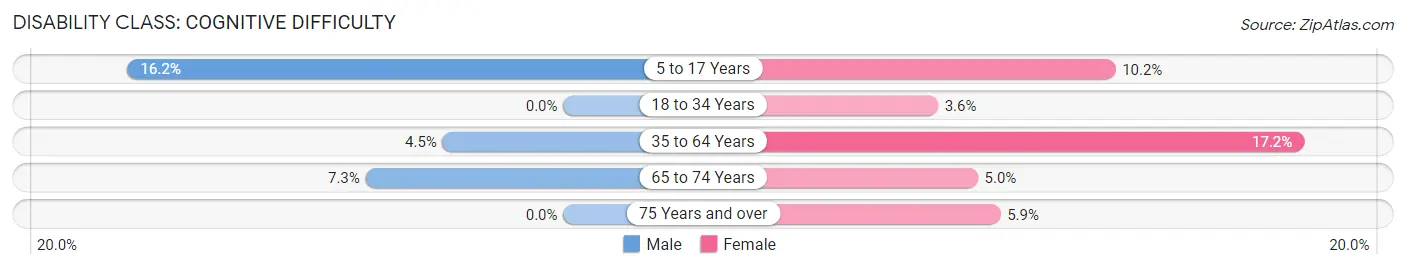
| Age Bracket | Male | Female |
| 5 to 17 Years | 44 (16.2%) | 20 (10.2%) |
| 18 to 34 Years | 0 (0.0%) | 9 (3.6%) |
| 35 to 64 Years | 32 (4.5%) | 105 (17.2%) |
| 65 to 74 Years | 8 (7.3%) | 12 (5.0%) |
| 75 Years and over | 0 (0.0%) | 8 (5.9%) |
Disability Class: Ambulatory Difficulty
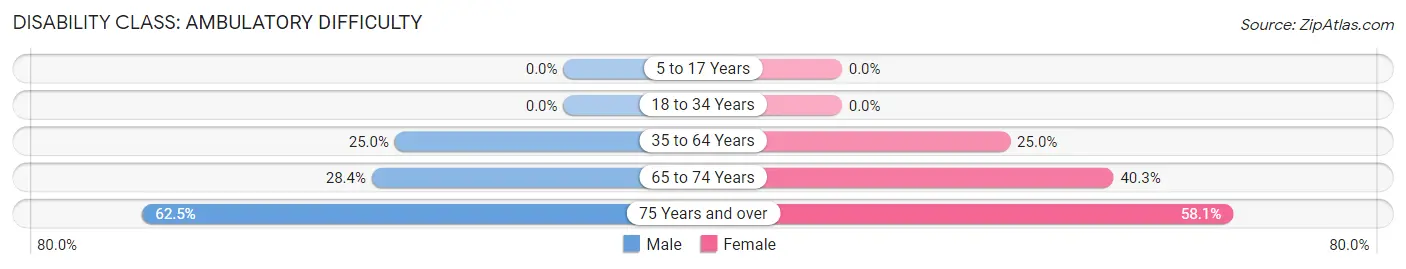
| Age Bracket | Male | Female |
| 5 to 17 Years | 0 (0.0%) | 0 (0.0%) |
| 18 to 34 Years | 0 (0.0%) | 0 (0.0%) |
| 35 to 64 Years | 179 (25.0%) | 153 (25.0%) |
| 65 to 74 Years | 31 (28.4%) | 96 (40.3%) |
| 75 Years and over | 55 (62.5%) | 79 (58.1%) |
Disability Class: Self-Care Difficulty
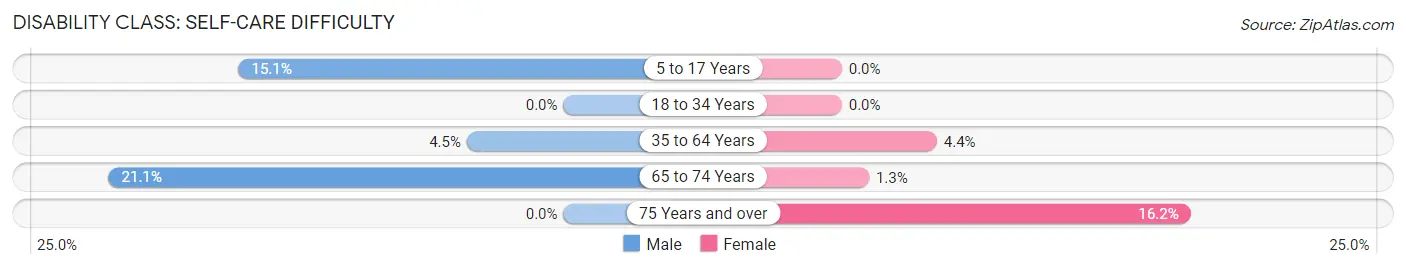
| Age Bracket | Male | Female |
| 5 to 17 Years | 41 (15.1%) | 0 (0.0%) |
| 18 to 34 Years | 0 (0.0%) | 0 (0.0%) |
| 35 to 64 Years | 32 (4.5%) | 27 (4.4%) |
| 65 to 74 Years | 23 (21.1%) | 3 (1.3%) |
| 75 Years and over | 0 (0.0%) | 22 (16.2%) |
Technology Access in South Pittsburg
Computing Device Access in South Pittsburg
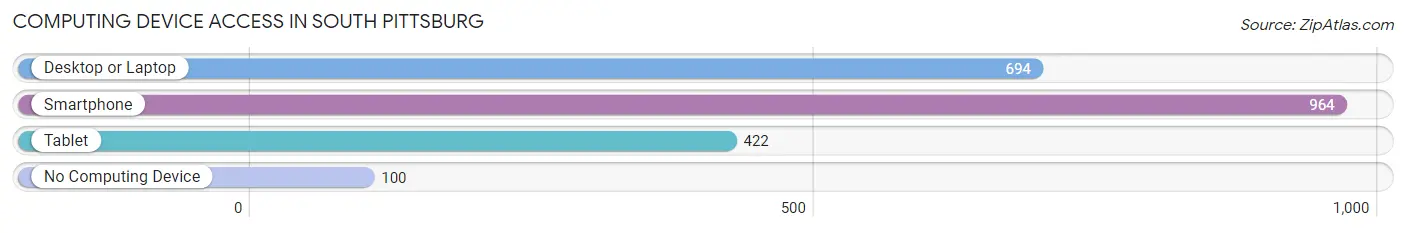
| Device Type | # Households | % Households |
| Desktop or Laptop | 694 | 56.3% |
| Smartphone | 964 | 78.2% |
| Tablet | 422 | 34.2% |
| No Computing Device | 100 | 8.1% |
| Total | 1,233 | 100.0% |
Internet Access in South Pittsburg
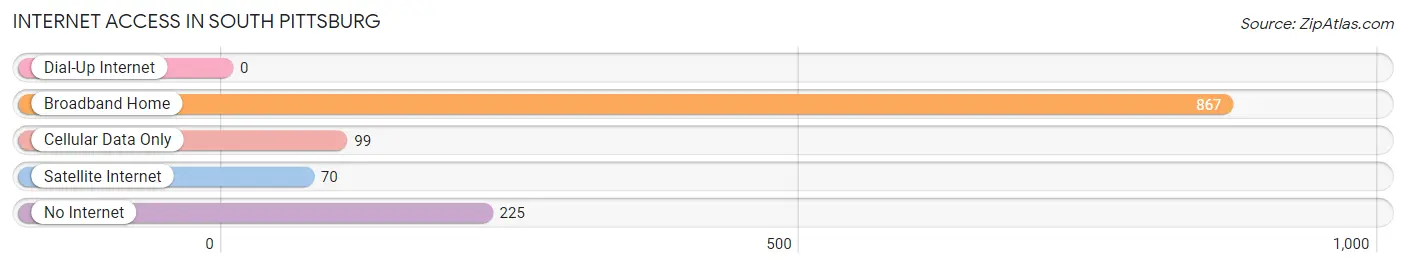
| Internet Type | # Households | % Households |
| Dial-Up Internet | 0 | 0.0% |
| Broadband Home | 867 | 70.3% |
| Cellular Data Only | 99 | 8.0% |
| Satellite Internet | 70 | 5.7% |
| No Internet | 225 | 18.2% |
| Total | 1,233 | 100.0% |
South Pittsburg Summary
Pittsburg, Tennessee is a small town located in the southeastern corner of the state, in Marion County. It is situated on the banks of the Tennessee River, and is home to a population of just over 3,000 people. The town was founded in 1839, and has a rich history that is deeply rooted in the Civil War.
Pittsburg is located in the foothills of the Cumberland Mountains, and is surrounded by lush forests and rolling hills. The town is situated at the intersection of two major highways, US-41 and US-64, making it easily accessible from nearby cities such as Chattanooga and Nashville. The town is also home to several small businesses, including a few restaurants, a grocery store, and a few other retail stores.
The economy of Pittsburg is largely based on agriculture and manufacturing. The town is home to several large farms, which produce a variety of crops, including corn, soybeans, and cotton. The town is also home to several manufacturing plants, which produce a variety of products, including furniture, clothing, and automotive parts.
The demographics of Pittsburg are largely white, with a small African American population. The median household income is around $30,000, and the median age is around 40. The town is home to several churches, and is served by the Marion County School District.
Pittsburg is a small town with a rich history and a vibrant economy. It is home to a diverse population, and is a great place to live and work. The town is easily accessible from nearby cities, and is home to several small businesses. The town is also home to several churches, and is served by the Marion County School District. Pittsburg is a great place to call home, and is a great place to visit.
Common Questions
What is Per Capita Income in South Pittsburg?
Per Capita income in South Pittsburg is $24,156.
What is the Median Family Income in South Pittsburg?
Median Family Income in South Pittsburg is $53,288.
What is the Median Household income in South Pittsburg?
Median Household Income in South Pittsburg is $45,250.
What is Income or Wage Gap in South Pittsburg?
Income or Wage Gap in South Pittsburg is 43.5%.
Women in South Pittsburg earn 56.5 cents for every dollar earned by a man.
What is Inequality or Gini Index in South Pittsburg?
Inequality or Gini Index in South Pittsburg is 0.39.
What is the Total Population of South Pittsburg?
Total Population of South Pittsburg is 3,068.
What is the Total Male Population of South Pittsburg?
Total Male Population of South Pittsburg is 1,494.
What is the Total Female Population of South Pittsburg?
Total Female Population of South Pittsburg is 1,574.
What is the Ratio of Males per 100 Females in South Pittsburg?
There are 94.92 Males per 100 Females in South Pittsburg.
What is the Ratio of Females per 100 Males in South Pittsburg?
There are 105.35 Females per 100 Males in South Pittsburg.
What is the Median Population Age in South Pittsburg?
Median Population Age in South Pittsburg is 49.7 Years.
What is the Average Family Size in South Pittsburg
Average Family Size in South Pittsburg is 2.6 People.
What is the Average Household Size in South Pittsburg
Average Household Size in South Pittsburg is 2.4 People.
How Large is the Labor Force in South Pittsburg?
There are 1,243 People in the Labor Forcein in South Pittsburg.
What is the Percentage of People in the Labor Force in South Pittsburg?
47.0% of People are in the Labor Force in South Pittsburg.
What is the Unemployment Rate in South Pittsburg?
Unemployment Rate in South Pittsburg is 5.3%.