Zip Codes with the Highest Percentage of Population Employed in Security & Protection in Clarksville, TN
RELATED REPORTS & OPTIONS
Security & Protection
Clarksville
Compare Zip Codes
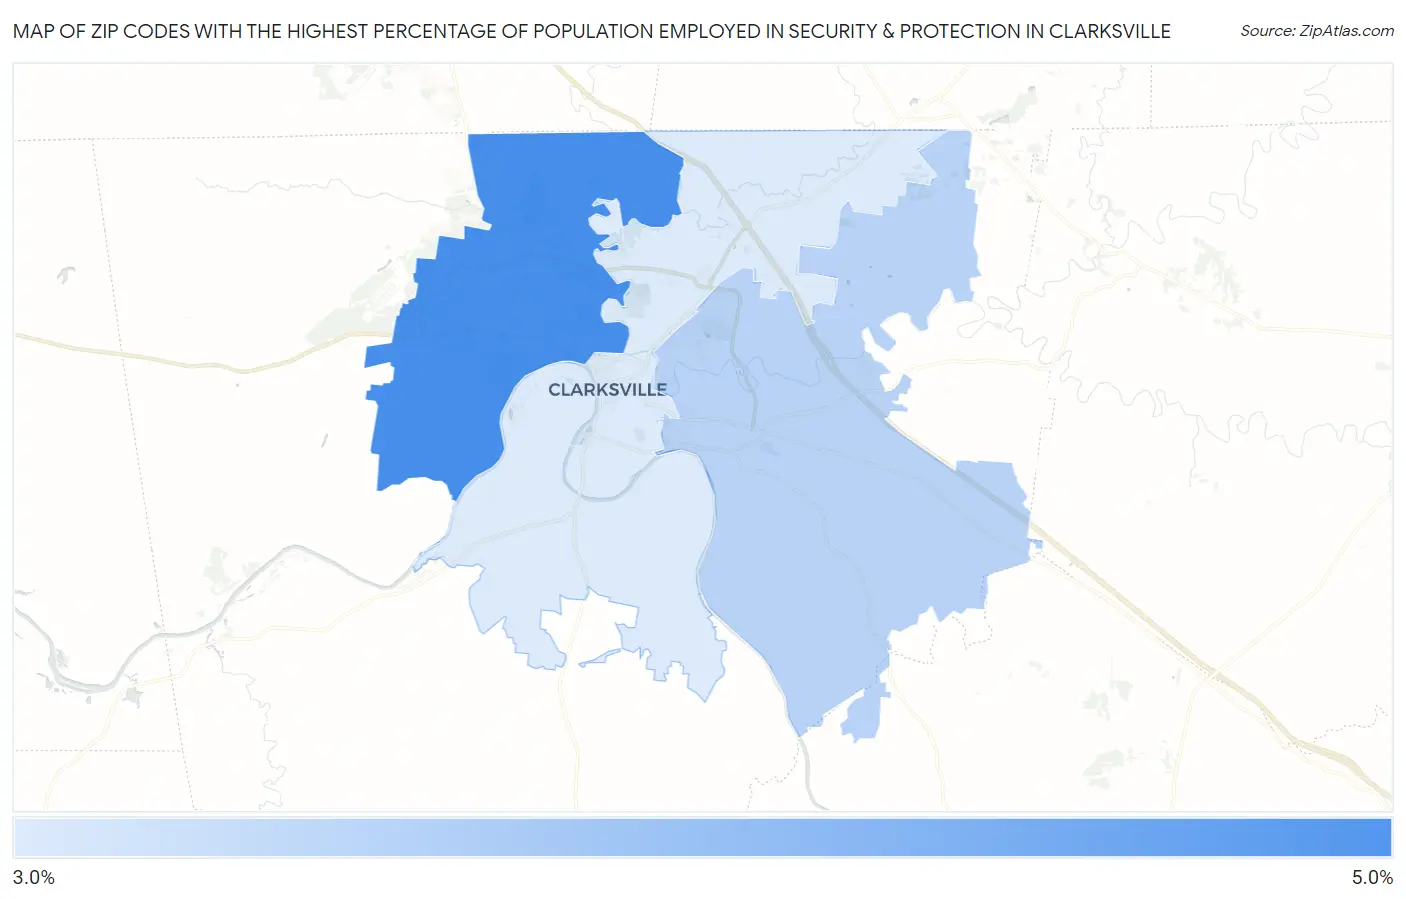
Map of Zip Codes with the Highest Percentage of Population Employed in Security & Protection in Clarksville
3.0%
4.2%
Zip Codes with the Highest Percentage of Population Employed in Security & Protection in Clarksville, TN
| Zip Code | % Employed | vs State | vs National | |
| 1. | 37042 | 4.2% | 2.1%(+2.15)#75 | 2.1%(+2.09)#4,041 |
| 2. | 37043 | 3.3% | 2.1%(+1.24)#120 | 2.1%(+1.19)#6,144 |
| 3. | 37040 | 3.0% | 2.1%(+0.952)#132 | 2.1%(+0.897)#7,058 |
1
Common Questions
What are the Top Zip Codes with the Highest Percentage of Population Employed in Security & Protection in Clarksville, TN?
Top Zip Codes with the Highest Percentage of Population Employed in Security & Protection in Clarksville, TN are:
What zip code has the Highest Percentage of Population Employed in Security & Protection in Clarksville, TN?
37042 has the Highest Percentage of Population Employed in Security & Protection in Clarksville, TN with 4.2%.
What is the Percentage of Population Employed in Security & Protection in Clarksville, TN?
Percentage of Population Employed in Security & Protection in Clarksville is 3.6%.
What is the Percentage of Population Employed in Security & Protection in Tennessee?
Percentage of Population Employed in Security & Protection in Tennessee is 2.1%.
What is the Percentage of Population Employed in Security & Protection in the United States?
Percentage of Population Employed in Security & Protection in the United States is 2.1%.