Zip Codes with the Highest Percentage of Population Employed in Security & Protection in Greeneville, TN
RELATED REPORTS & OPTIONS
Security & Protection
Greeneville
Compare Zip Codes
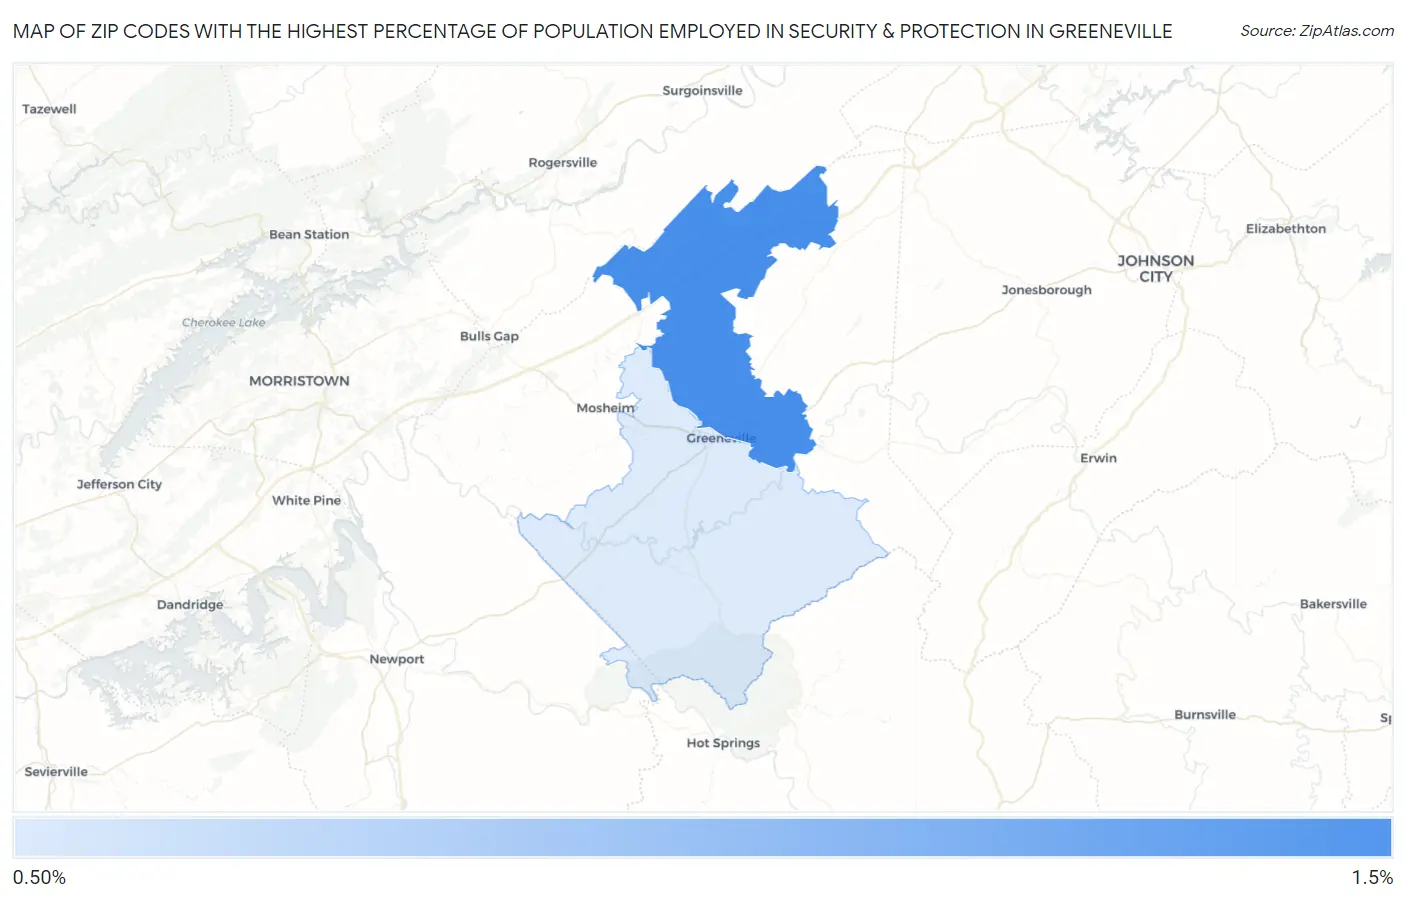
Map of Zip Codes with the Highest Percentage of Population Employed in Security & Protection in Greeneville
0.80%
1.4%
Zip Codes with the Highest Percentage of Population Employed in Security & Protection in Greeneville, TN
| Zip Code | % Employed | vs State | vs National | |
| 1. | 37745 | 1.4% | 2.1%(-0.690)#341 | 2.1%(-0.744)#16,914 |
| 2. | 37743 | 0.80% | 2.1%(-1.29)#428 | 2.1%(-1.35)#21,402 |
1
Common Questions
What are the Top Zip Codes with the Highest Percentage of Population Employed in Security & Protection in Greeneville, TN?
Top Zip Codes with the Highest Percentage of Population Employed in Security & Protection in Greeneville, TN are:
What zip code has the Highest Percentage of Population Employed in Security & Protection in Greeneville, TN?
37745 has the Highest Percentage of Population Employed in Security & Protection in Greeneville, TN with 1.4%.
What is the Percentage of Population Employed in Security & Protection in Greeneville, TN?
Percentage of Population Employed in Security & Protection in Greeneville is 0.73%.
What is the Percentage of Population Employed in Security & Protection in Tennessee?
Percentage of Population Employed in Security & Protection in Tennessee is 2.1%.
What is the Percentage of Population Employed in Security & Protection in the United States?
Percentage of Population Employed in Security & Protection in the United States is 2.1%.