Zip Codes with the Highest Percentage of Population Employed in Security & Protection in Memphis, TN
RELATED REPORTS & OPTIONS
Security & Protection
Memphis
Compare Zip Codes
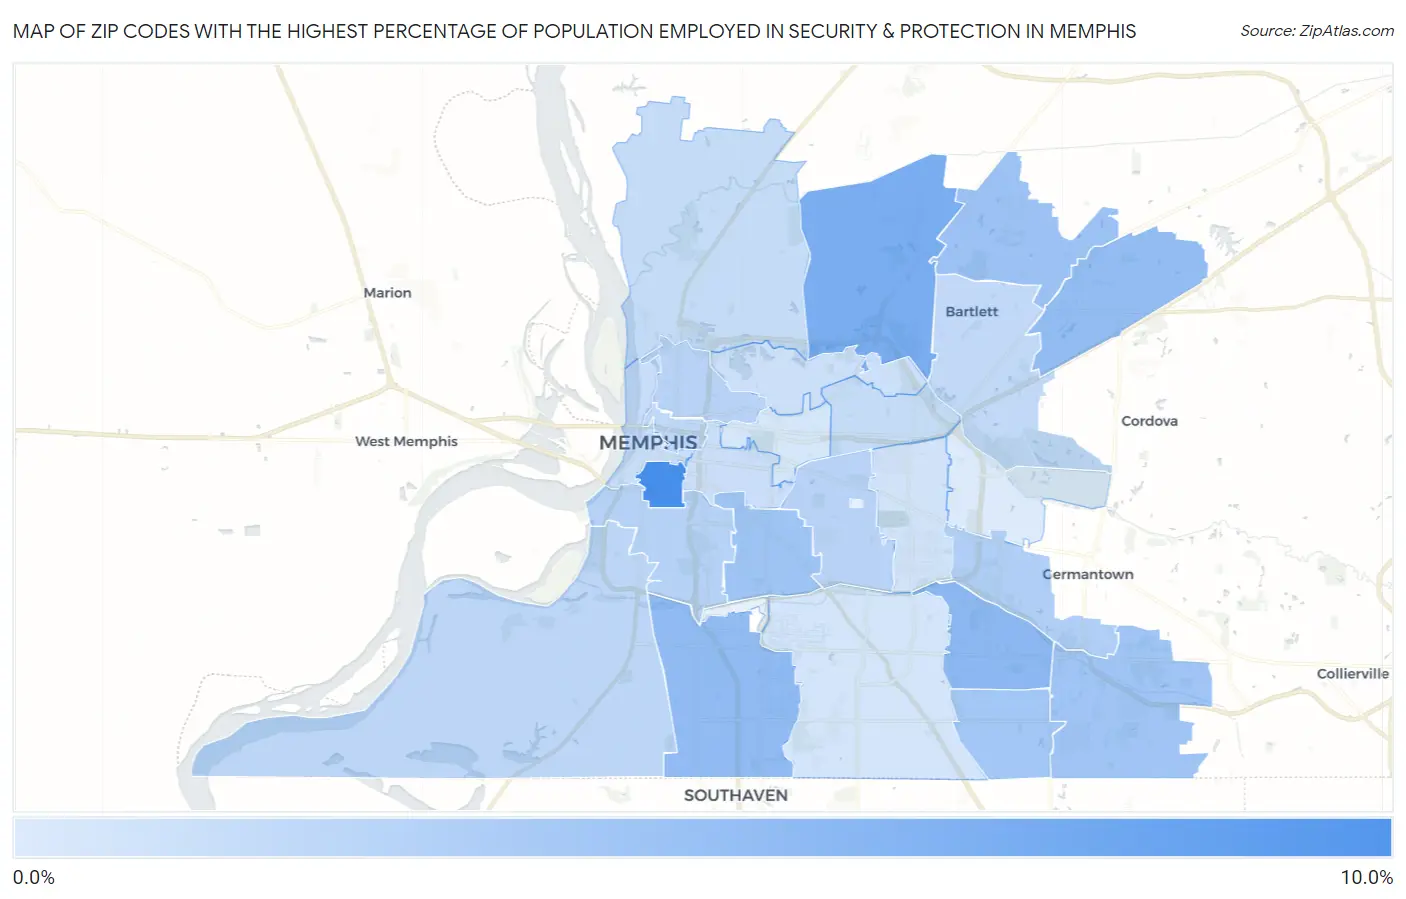
Map of Zip Codes with the Highest Percentage of Population Employed in Security & Protection in Memphis
0.80%
8.4%
Zip Codes with the Highest Percentage of Population Employed in Security & Protection in Memphis, TN
| Zip Code | % Employed | vs State | vs National | |
| 1. | 38126 | 8.4% | 2.1%(+6.27)#18 | 2.1%(+6.22)#1,055 |
| 2. | 38128 | 5.7% | 2.1%(+3.59)#34 | 2.1%(+3.54)#2,293 |
| 3. | 38115 | 4.7% | 2.1%(+2.65)#57 | 2.1%(+2.60)#3,241 |
| 4. | 38116 | 4.5% | 2.1%(+2.44)#64 | 2.1%(+2.39)#3,554 |
| 5. | 38133 | 4.5% | 2.1%(+2.38)#66 | 2.1%(+2.33)#3,647 |
| 6. | 38135 | 4.1% | 2.1%(+2.05)#79 | 2.1%(+1.99)#4,225 |
| 7. | 38114 | 3.9% | 2.1%(+1.77)#89 | 2.1%(+1.72)#4,761 |
| 8. | 38125 | 3.7% | 2.1%(+1.65)#100 | 2.1%(+1.60)#5,042 |
| 9. | 38141 | 3.7% | 2.1%(+1.57)#103 | 2.1%(+1.52)#5,220 |
| 10. | 38119 | 2.9% | 2.1%(+0.854)#140 | 2.1%(+0.799)#7,444 |
| 11. | 38106 | 2.7% | 2.1%(+0.587)#168 | 2.1%(+0.532)#8,627 |
| 12. | 38111 | 2.6% | 2.1%(+0.507)#177 | 2.1%(+0.453)#8,996 |
| 13. | 38107 | 2.6% | 2.1%(+0.462)#184 | 2.1%(+0.408)#9,219 |
| 14. | 38109 | 2.4% | 2.1%(+0.282)#209 | 2.1%(+0.227)#10,190 |
| 15. | 38105 | 2.3% | 2.1%(+0.194)#221 | 2.1%(+0.139)#10,718 |
| 16. | 38134 | 2.1% | 2.1%(+0.008)#245 | 2.1%(-0.047)#11,891 |
| 17. | 38122 | 1.9% | 2.1%(-0.150)#262 | 2.1%(-0.205)#12,924 |
| 18. | 38127 | 1.9% | 2.1%(-0.153)#263 | 2.1%(-0.208)#12,949 |
| 19. | 38103 | 1.8% | 2.1%(-0.264)#280 | 2.1%(-0.319)#13,712 |
| 20. | 38104 | 1.6% | 2.1%(-0.451)#311 | 2.1%(-0.506)#15,100 |
| 21. | 38108 | 1.6% | 2.1%(-0.521)#324 | 2.1%(-0.575)#15,621 |
| 22. | 38117 | 1.4% | 2.1%(-0.682)#338 | 2.1%(-0.736)#16,859 |
| 23. | 38118 | 1.3% | 2.1%(-0.798)#357 | 2.1%(-0.852)#17,764 |
| 24. | 38112 | 1.2% | 2.1%(-0.916)#374 | 2.1%(-0.971)#18,684 |
| 25. | 38120 | 0.80% | 2.1%(-1.30)#429 | 2.1%(-1.35)#21,431 |
1
Common Questions
What are the Top 10 Zip Codes with the Highest Percentage of Population Employed in Security & Protection in Memphis, TN?
Top 10 Zip Codes with the Highest Percentage of Population Employed in Security & Protection in Memphis, TN are:
What zip code has the Highest Percentage of Population Employed in Security & Protection in Memphis, TN?
38126 has the Highest Percentage of Population Employed in Security & Protection in Memphis, TN with 8.4%.
What is the Percentage of Population Employed in Security & Protection in Memphis, TN?
Percentage of Population Employed in Security & Protection in Memphis is 2.8%.
What is the Percentage of Population Employed in Security & Protection in Tennessee?
Percentage of Population Employed in Security & Protection in Tennessee is 2.1%.
What is the Percentage of Population Employed in Security & Protection in the United States?
Percentage of Population Employed in Security & Protection in the United States is 2.1%.