Gates, TN Map & Demographics
Gates Map
Gates Overview
$19,543
PER CAPITA INCOME
$39,241
AVG FAMILY INCOME
$39,145
AVG HOUSEHOLD INCOME
14.3%
WAGE / INCOME GAP [ % ]
85.7¢/ $1
WAGE / INCOME GAP [ $ ]
0.35
INEQUALITY / GINI INDEX
693
TOTAL POPULATION
340
MALE POPULATION
353
FEMALE POPULATION
96.32
MALES / 100 FEMALES
103.82
FEMALES / 100 MALES
37.3
MEDIAN AGE
3.0
AVG FAMILY SIZE
2.9
AVG HOUSEHOLD SIZE
276
LABOR FORCE [ PEOPLE ]
48.9%
PERCENT IN LABOR FORCE
19.2%
UNEMPLOYMENT RATE
Gates Zip Codes
Income in Gates
Income Overview in Gates
Per Capita Income in Gates is $19,543, while median incomes of families and households are $39,241 and $39,145 respectively.
| Characteristic | Number | Measure |
| Per Capita Income | 693 | $19,543 |
| Median Family Income | 207 | $39,241 |
| Mean Family Income | 207 | $50,323 |
| Median Household Income | 241 | $39,145 |
| Mean Household Income | 241 | $50,789 |
| Income Deficit | 207 | $0 |
| Wage / Income Gap (%) | 693 | 14.29% |
| Wage / Income Gap ($) | 693 | 85.71¢ per $1 |
| Gini / Inequality Index | 693 | 0.35 |
Earnings by Sex in Gates
Average Earnings in Gates are $33,929, $35,000 for men and $30,000 for women, a difference of 14.3%.
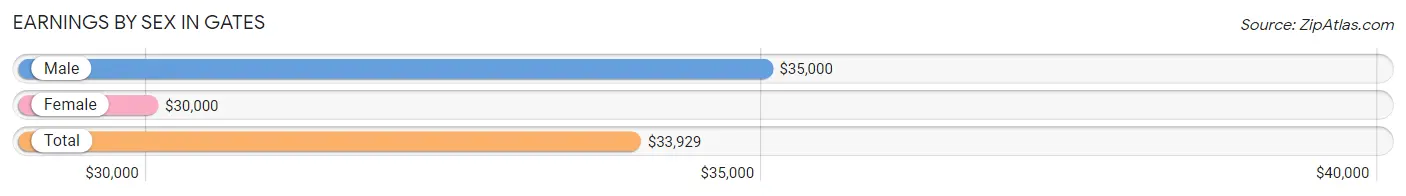
| Sex | Number | Average Earnings |
| Male | 160 (58.0%) | $35,000 |
| Female | 116 (42.0%) | $30,000 |
| Total | 276 (100.0%) | $33,929 |
Earnings by Sex by Income Bracket in Gates
The most common earnings brackets in Gates are $55,000 to $64,999 for men (27 | 16.9%) and $7,500 to $9,999 for women (22 | 19.0%).
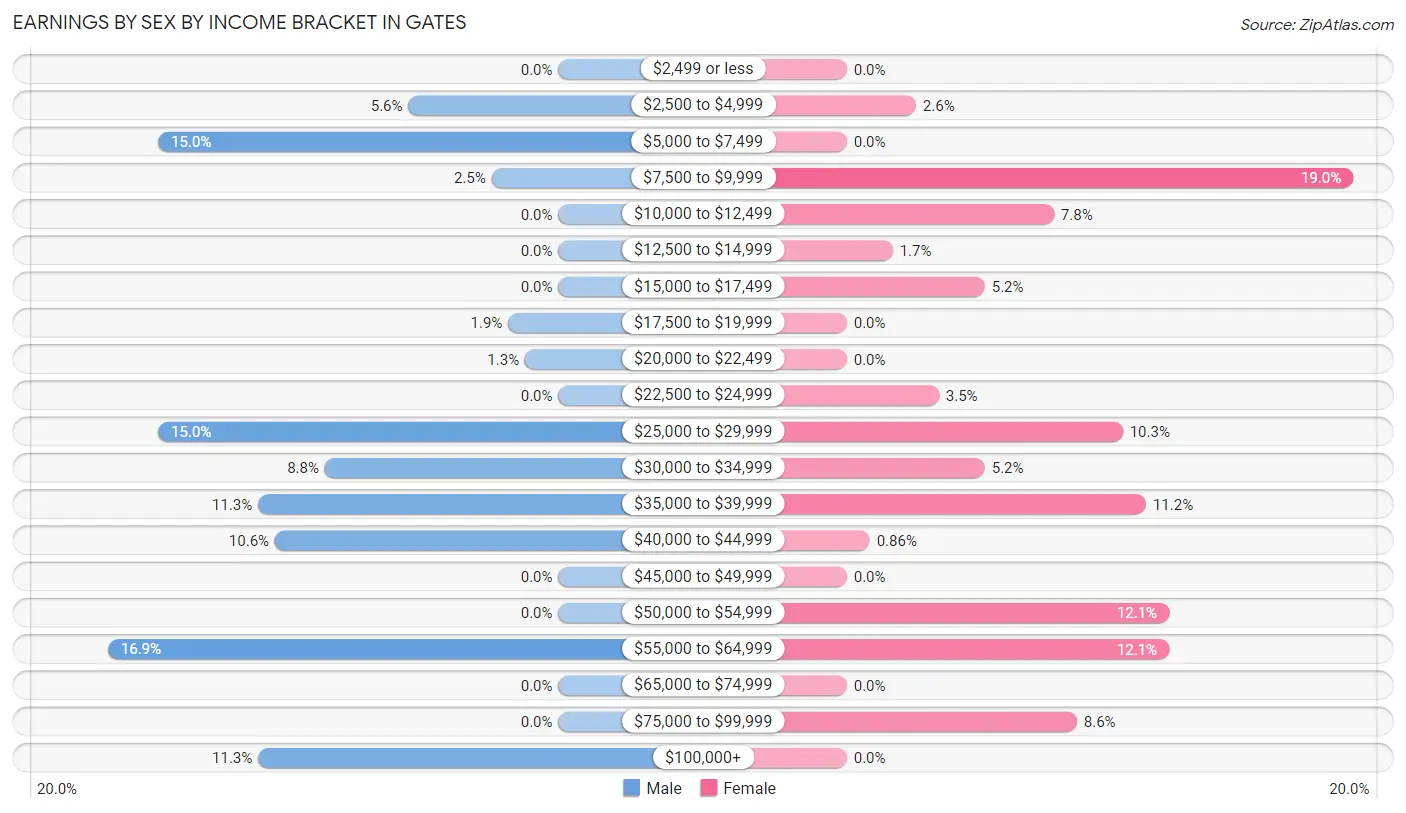
| Income | Male | Female |
| $2,499 or less | 0 (0.0%) | 0 (0.0%) |
| $2,500 to $4,999 | 9 (5.6%) | 3 (2.6%) |
| $5,000 to $7,499 | 24 (15.0%) | 0 (0.0%) |
| $7,500 to $9,999 | 4 (2.5%) | 22 (19.0%) |
| $10,000 to $12,499 | 0 (0.0%) | 9 (7.8%) |
| $12,500 to $14,999 | 0 (0.0%) | 2 (1.7%) |
| $15,000 to $17,499 | 0 (0.0%) | 6 (5.2%) |
| $17,500 to $19,999 | 3 (1.9%) | 0 (0.0%) |
| $20,000 to $22,499 | 2 (1.3%) | 0 (0.0%) |
| $22,500 to $24,999 | 0 (0.0%) | 4 (3.5%) |
| $25,000 to $29,999 | 24 (15.0%) | 12 (10.3%) |
| $30,000 to $34,999 | 14 (8.7%) | 6 (5.2%) |
| $35,000 to $39,999 | 18 (11.3%) | 13 (11.2%) |
| $40,000 to $44,999 | 17 (10.6%) | 1 (0.9%) |
| $45,000 to $49,999 | 0 (0.0%) | 0 (0.0%) |
| $50,000 to $54,999 | 0 (0.0%) | 14 (12.1%) |
| $55,000 to $64,999 | 27 (16.9%) | 14 (12.1%) |
| $65,000 to $74,999 | 0 (0.0%) | 0 (0.0%) |
| $75,000 to $99,999 | 0 (0.0%) | 10 (8.6%) |
| $100,000+ | 18 (11.3%) | 0 (0.0%) |
| Total | 160 (100.0%) | 116 (100.0%) |
Earnings by Sex by Educational Attainment in Gates
Average earnings in Gates are $41,125 for men and $35,833 for women, a difference of 12.9%. Men with an educational attainment of less than high school enjoy the highest average annual earnings of $40,625, while those with less than high school education earn the least with $40,625. Women with an educational attainment of high school diploma earn the most with the average annual earnings of $50,446, while those with bachelor's degree education have the smallest earnings of $30,625.
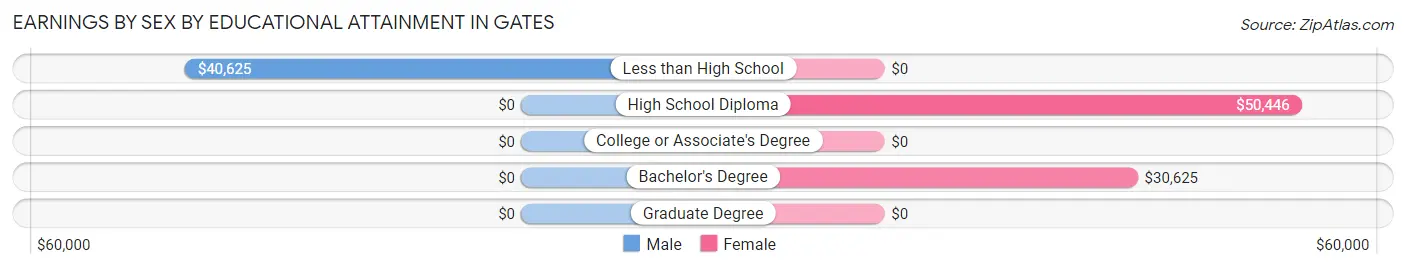
| Educational Attainment | Male Income | Female Income |
| Less than High School | $40,625 | $0 |
| High School Diploma | - | - |
| College or Associate's Degree | - | - |
| Bachelor's Degree | - | - |
| Graduate Degree | - | - |
| Total | $41,125 | $35,833 |
Family Income in Gates
Family Income Brackets in Gates
According to the Gates family income data, there are 57 families falling into the $50,000 to $74,999 income range, which is the most common income bracket and makes up 27.5% of all families.
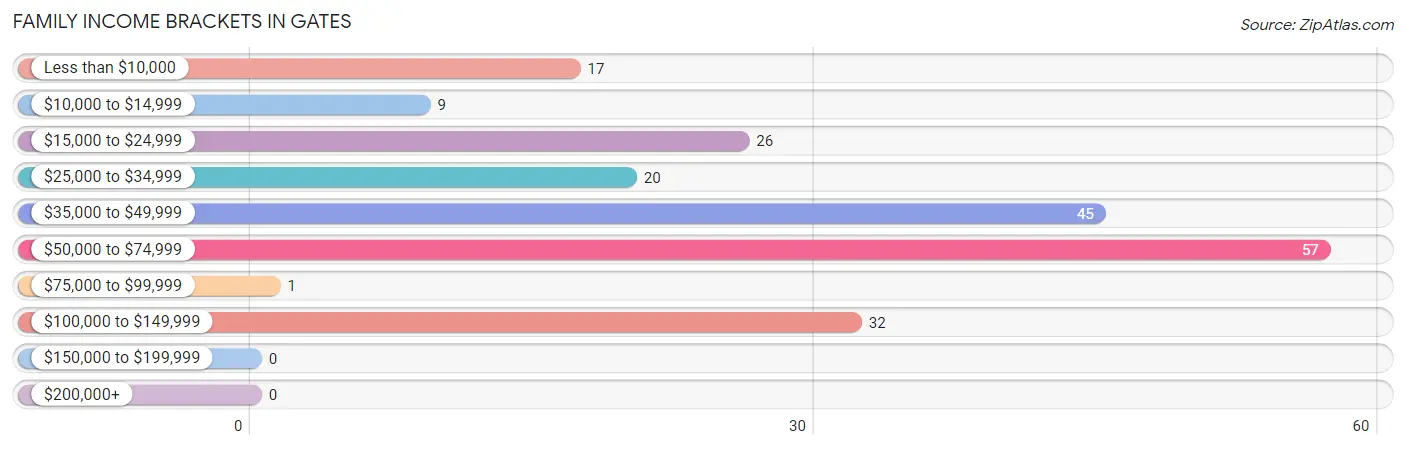
| Income Bracket | # Families | % Families |
| Less than $10,000 | 17 | 8.2% |
| $10,000 to $14,999 | 9 | 4.3% |
| $15,000 to $24,999 | 26 | 12.6% |
| $25,000 to $34,999 | 20 | 9.7% |
| $35,000 to $49,999 | 45 | 21.7% |
| $50,000 to $74,999 | 57 | 27.5% |
| $75,000 to $99,999 | 1 | 0.5% |
| $100,000 to $149,999 | 32 | 15.5% |
| $150,000 to $199,999 | 0 | 0.0% |
| $200,000+ | 0 | 0.0% |
Family Income by Famaliy Size in Gates
3-person families (33 | 15.9%) account for the highest median family income in Gates with $57,679 per family, while 2-person families (116 | 56.0%) have the highest median income of $25,156 per family member.
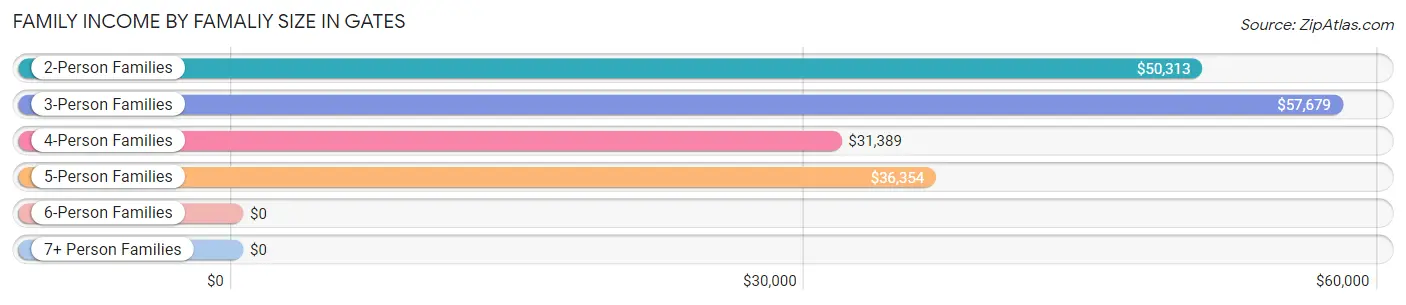
| Income Bracket | # Families | Median Income |
| 2-Person Families | 116 (56.0%) | $50,313 |
| 3-Person Families | 33 (15.9%) | $57,679 |
| 4-Person Families | 38 (18.4%) | $31,389 |
| 5-Person Families | 19 (9.2%) | $36,354 |
| 6-Person Families | 0 (0.0%) | $0 |
| 7+ Person Families | 1 (0.5%) | $0 |
| Total | 207 (100.0%) | $39,241 |
Family Income by Number of Earners in Gates
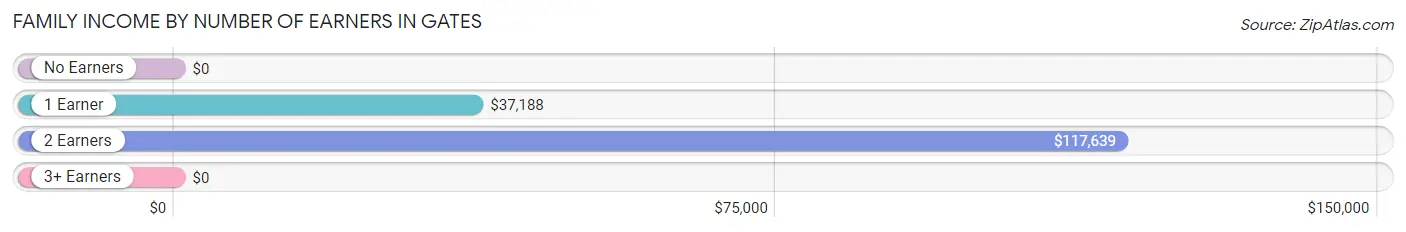
| Number of Earners | # Families | Median Income |
| No Earners | 50 (24.1%) | $0 |
| 1 Earner | 95 (45.9%) | $37,188 |
| 2 Earners | 61 (29.5%) | $117,639 |
| 3+ Earners | 1 (0.5%) | $0 |
| Total | 207 (100.0%) | $39,241 |
Household Income in Gates
Household Income Brackets in Gates
With 62 households falling in the category, the $50,000 to $74,999 income range is the most frequent in Gates, accounting for 25.7% of all households.
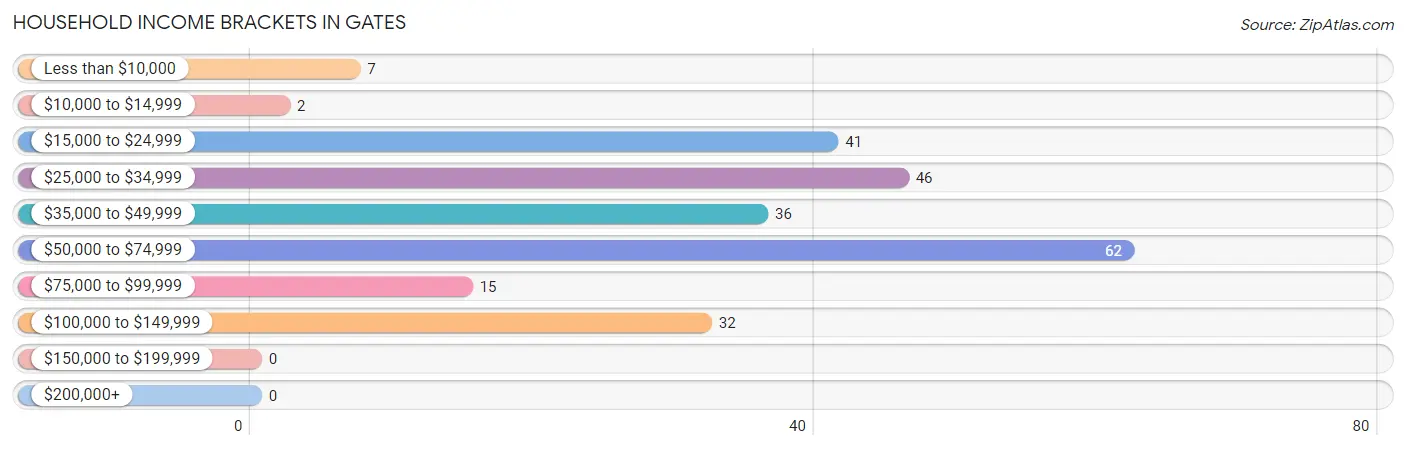
| Income Bracket | # Households | % Households |
| Less than $10,000 | 7 | 2.9% |
| $10,000 to $14,999 | 2 | 0.8% |
| $15,000 to $24,999 | 41 | 17.0% |
| $25,000 to $34,999 | 46 | 19.1% |
| $35,000 to $49,999 | 36 | 14.9% |
| $50,000 to $74,999 | 62 | 25.7% |
| $75,000 to $99,999 | 15 | 6.2% |
| $100,000 to $149,999 | 32 | 13.3% |
| $150,000 to $199,999 | 0 | 0.0% |
| $200,000+ | 0 | 0.0% |
Household Income by Householder Age in Gates
The median household income in Gates is $39,145, with the highest median household income of $49,375 found in the 45 to 64 years age bracket for the primary householder. A total of 91 households (37.8%) fall into this category. Meanwhile, the 15 to 24 years age bracket for the primary householder has the lowest median household income of $0, with 12 households (5.0%) in this group.
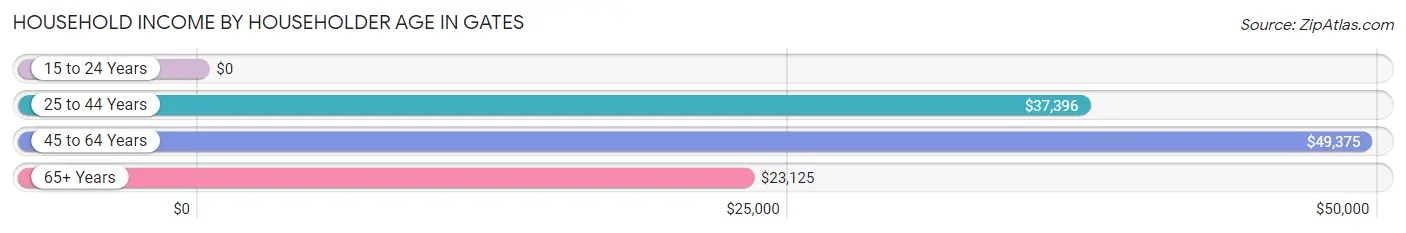
| Income Bracket | # Households | Median Income |
| 15 to 24 Years | 12 (5.0%) | $0 |
| 25 to 44 Years | 93 (38.6%) | $37,396 |
| 45 to 64 Years | 91 (37.8%) | $49,375 |
| 65+ Years | 45 (18.7%) | $23,125 |
| Total | 241 (100.0%) | $39,145 |
Poverty in Gates
Income Below Poverty by Sex and Age in Gates
With 20.9% poverty level for males and 17.3% for females among the residents of Gates, 5 year old males and 12 to 14 year old females are the most vulnerable to poverty, with 2 males (100.0%) and 5 females (83.3%) in their respective age groups living below the poverty level.
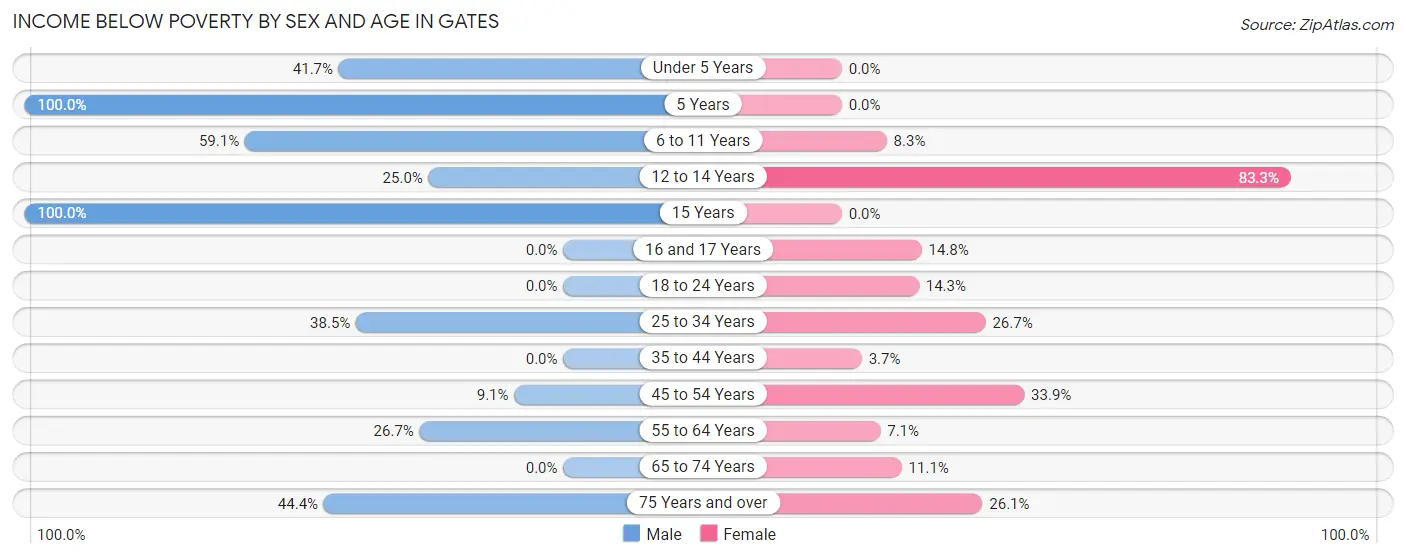
| Age Bracket | Male | Female |
| Under 5 Years | 15 (41.7%) | 0 (0.0%) |
| 5 Years | 2 (100.0%) | 0 (0.0%) |
| 6 to 11 Years | 13 (59.1%) | 2 (8.3%) |
| 12 to 14 Years | 1 (25.0%) | 5 (83.3%) |
| 15 Years | 1 (100.0%) | 0 (0.0%) |
| 16 and 17 Years | 0 (0.0%) | 4 (14.8%) |
| 18 to 24 Years | 0 (0.0%) | 1 (14.3%) |
| 25 to 34 Years | 20 (38.5%) | 8 (26.7%) |
| 35 to 44 Years | 0 (0.0%) | 2 (3.7%) |
| 45 to 54 Years | 3 (9.1%) | 22 (33.9%) |
| 55 to 64 Years | 12 (26.7%) | 3 (7.1%) |
| 65 to 74 Years | 0 (0.0%) | 2 (11.1%) |
| 75 Years and over | 4 (44.4%) | 12 (26.1%) |
| Total | 71 (20.9%) | 61 (17.3%) |
Income Above Poverty by Sex and Age in Gates
According to the poverty statistics in Gates, males aged 18 to 24 years and females aged under 5 years are the age groups that are most secure financially, with 100.0% of males and 100.0% of females in these age groups living above the poverty line.
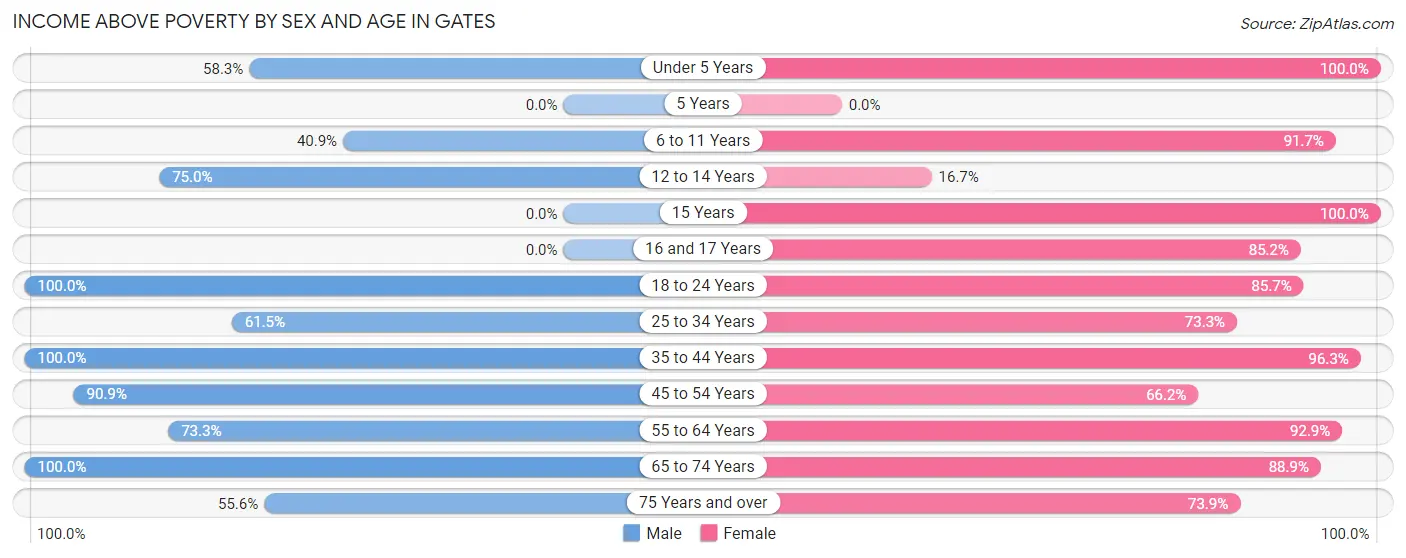
| Age Bracket | Male | Female |
| Under 5 Years | 21 (58.3%) | 18 (100.0%) |
| 5 Years | 0 (0.0%) | 0 (0.0%) |
| 6 to 11 Years | 9 (40.9%) | 22 (91.7%) |
| 12 to 14 Years | 3 (75.0%) | 1 (16.7%) |
| 15 Years | 0 (0.0%) | 16 (100.0%) |
| 16 and 17 Years | 0 (0.0%) | 23 (85.2%) |
| 18 to 24 Years | 85 (100.0%) | 6 (85.7%) |
| 25 to 34 Years | 32 (61.5%) | 22 (73.3%) |
| 35 to 44 Years | 30 (100.0%) | 52 (96.3%) |
| 45 to 54 Years | 30 (90.9%) | 43 (66.1%) |
| 55 to 64 Years | 33 (73.3%) | 39 (92.9%) |
| 65 to 74 Years | 21 (100.0%) | 16 (88.9%) |
| 75 Years and over | 5 (55.6%) | 34 (73.9%) |
| Total | 269 (79.1%) | 292 (82.7%) |
Income Below Poverty Among Married-Couple Families in Gates
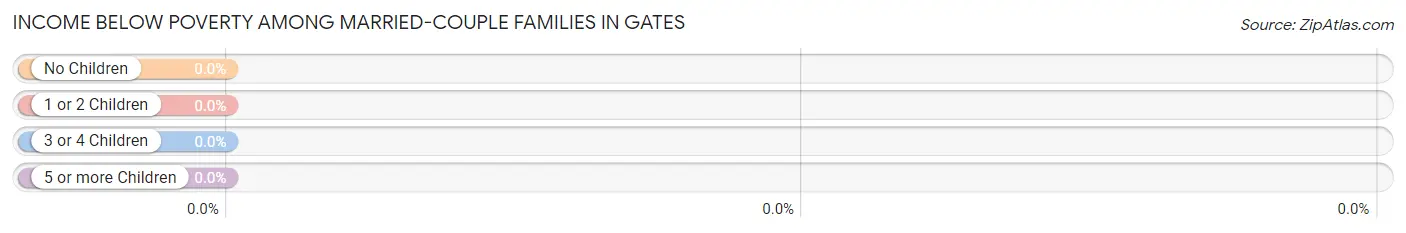
| Children | Above Poverty | Below Poverty |
| No Children | 79 (100.0%) | 0 (0.0%) |
| 1 or 2 Children | 5 (100.0%) | 0 (0.0%) |
| 3 or 4 Children | 14 (100.0%) | 0 (0.0%) |
| 5 or more Children | 1 (100.0%) | 0 (0.0%) |
| Total | 99 (100.0%) | 0 (0.0%) |
Income Below Poverty Among Single-Parent Households in Gates
According to the poverty data in Gates, 40.0% or 16 single-father households and 36.8% or 25 single-mother households are living below the poverty line. Among single-father households, those with 1 or 2 children have the highest poverty rate, with 16 households (40.0%) experiencing poverty. Likewise, among single-mother households, those with 3 or 4 children have the highest poverty rate, with 3 households (100.0%) falling below the poverty line.
| Children | Single Father | Single Mother |
| No Children | 0 (0.0%) | 0 (0.0%) |
| 1 or 2 Children | 16 (40.0%) | 22 (50.0%) |
| 3 or 4 Children | 0 (0.0%) | 3 (100.0%) |
| 5 or more Children | 0 (0.0%) | 0 (0.0%) |
| Total | 16 (40.0%) | 25 (36.8%) |
Income Below Poverty Among Married-Couple vs Single-Parent Households in Gates
| Children | Married-Couple Families | Single-Parent Households |
| No Children | 0 (0.0%) | 0 (0.0%) |
| 1 or 2 Children | 0 (0.0%) | 38 (45.2%) |
| 3 or 4 Children | 0 (0.0%) | 3 (100.0%) |
| 5 or more Children | 0 (0.0%) | 0 (0.0%) |
| Total | 0 (0.0%) | 41 (38.0%) |
Race in Gates
The most populous races in Gates are Black / African American (387 | 55.8%), White / Caucasian (265 | 38.2%), and Hispanic or Latino (40 | 5.8%).
| Race | # Population | % Population |
| Asian | 0 | 0.0% |
| Black / African American | 387 | 55.8% |
| Hawaiian / Pacific | 0 | 0.0% |
| Hispanic or Latino | 40 | 5.8% |
| Native / Alaskan | 0 | 0.0% |
| White / Caucasian | 265 | 38.2% |
| Two or more Races | 21 | 3.0% |
| Some other Race | 20 | 2.9% |
| Total | 693 | 100.0% |
Ancestry in Gates
The most populous ancestries reported in Gates are Irish (104 | 15.0%), Mexican (40 | 5.8%), American (39 | 5.6%), German (27 | 3.9%), and Italian (12 | 1.7%), together accounting for 32.0% of all Gates residents.
| Ancestry | # Population | % Population |
| American | 39 | 5.6% |
| English | 10 | 1.4% |
| German | 27 | 3.9% |
| Irish | 104 | 15.0% |
| Italian | 12 | 1.7% |
| Mexican | 40 | 5.8% |
| Scotch-Irish | 2 | 0.3% | View All 7 Rows |
Immigrants in Gates

| Immigration Origin | # Population | % Population | View All 0 Rows |
Sex and Age in Gates
Sex and Age in Gates
The most populous age groups in Gates are 20 to 24 Years (52 | 15.3%) for men and 15 to 19 Years (50 | 14.2%) for women.
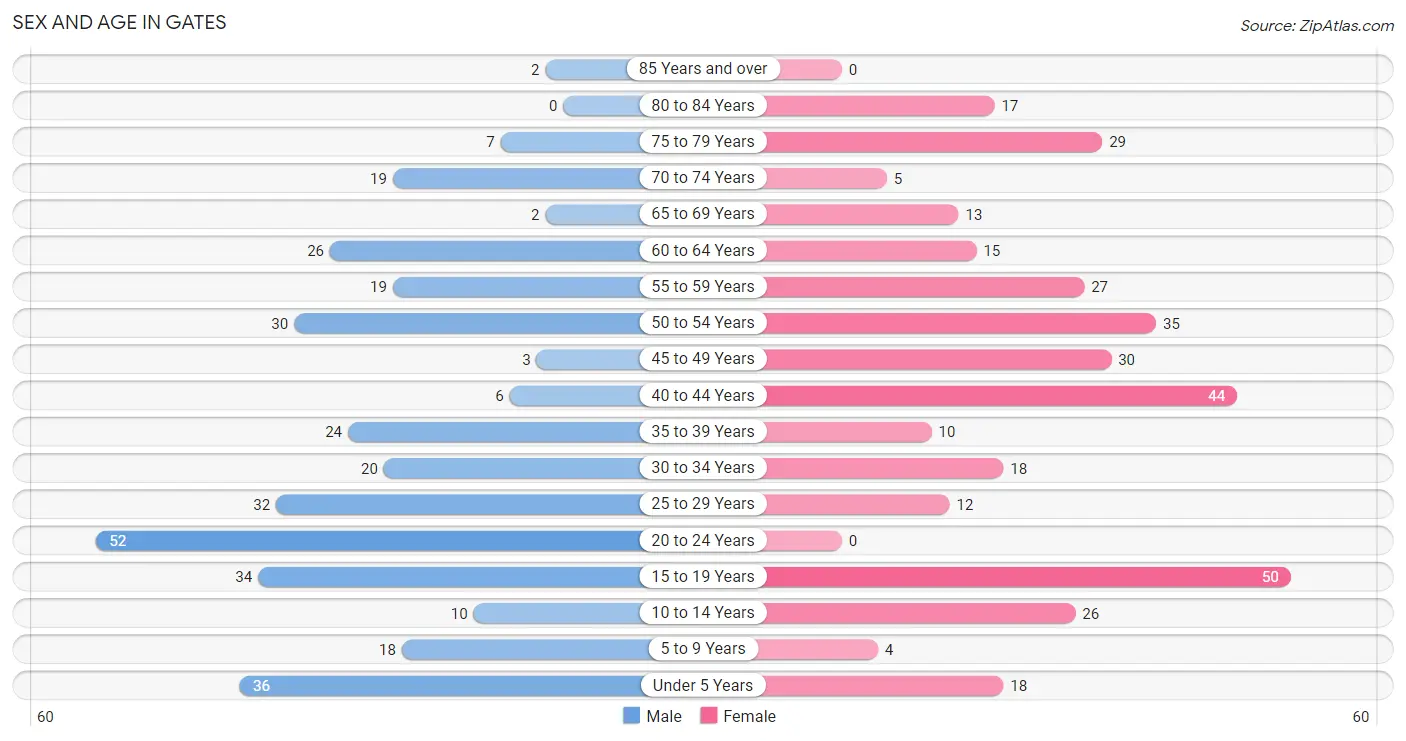
| Age Bracket | Male | Female |
| Under 5 Years | 36 (10.6%) | 18 (5.1%) |
| 5 to 9 Years | 18 (5.3%) | 4 (1.1%) |
| 10 to 14 Years | 10 (2.9%) | 26 (7.4%) |
| 15 to 19 Years | 34 (10.0%) | 50 (14.2%) |
| 20 to 24 Years | 52 (15.3%) | 0 (0.0%) |
| 25 to 29 Years | 32 (9.4%) | 12 (3.4%) |
| 30 to 34 Years | 20 (5.9%) | 18 (5.1%) |
| 35 to 39 Years | 24 (7.1%) | 10 (2.8%) |
| 40 to 44 Years | 6 (1.8%) | 44 (12.5%) |
| 45 to 49 Years | 3 (0.9%) | 30 (8.5%) |
| 50 to 54 Years | 30 (8.8%) | 35 (9.9%) |
| 55 to 59 Years | 19 (5.6%) | 27 (7.6%) |
| 60 to 64 Years | 26 (7.6%) | 15 (4.3%) |
| 65 to 69 Years | 2 (0.6%) | 13 (3.7%) |
| 70 to 74 Years | 19 (5.6%) | 5 (1.4%) |
| 75 to 79 Years | 7 (2.1%) | 29 (8.2%) |
| 80 to 84 Years | 0 (0.0%) | 17 (4.8%) |
| 85 Years and over | 2 (0.6%) | 0 (0.0%) |
| Total | 340 (100.0%) | 353 (100.0%) |
Families and Households in Gates
Median Family Size in Gates
The median family size in Gates is 3.05 persons per family, with single female/mother families (68 | 32.9%) accounting for the largest median family size of 3.5 persons per family. On the other hand, married-couple families (99 | 47.8%) represent the smallest median family size with 2.77 persons per family.
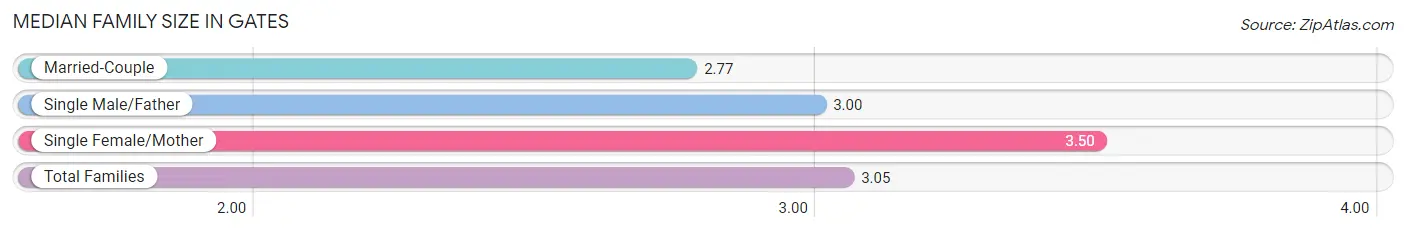
| Family Type | # Families | Family Size |
| Married-Couple | 99 (47.8%) | 2.77 |
| Single Male/Father | 40 (19.3%) | 3.00 |
| Single Female/Mother | 68 (32.9%) | 3.50 |
| Total Families | 207 (100.0%) | 3.05 |
Median Household Size in Gates
The median household size in Gates is 2.88 persons per household, with single female/mother households (68 | 28.2%) accounting for the largest median household size of 3.57 persons per household. non-family households (34 | 14.1%) represent the smallest median household size with 1.09 persons per household.
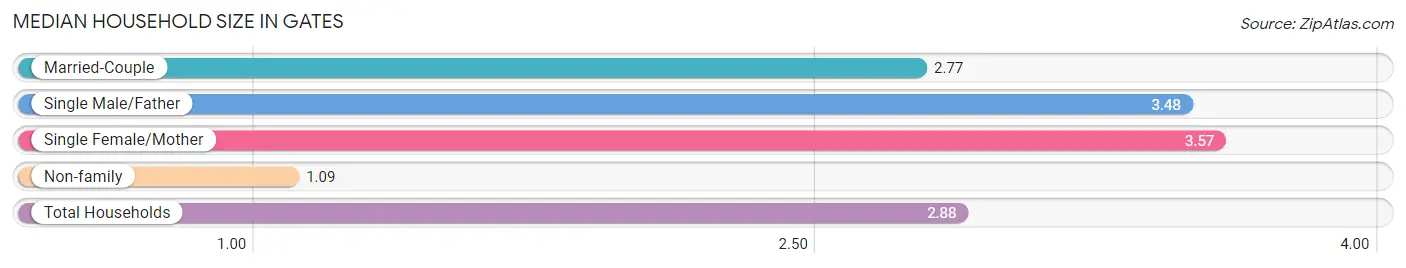
| Household Type | # Households | Household Size |
| Married-Couple | 99 (41.1%) | 2.77 |
| Single Male/Father | 40 (16.6%) | 3.48 |
| Single Female/Mother | 68 (28.2%) | 3.57 |
| Non-family | 34 (14.1%) | 1.09 |
| Total Households | 241 (100.0%) | 2.88 |
Household Size by Marriage Status in Gates
Out of a total of 241 households in Gates, 207 (85.9%) are family households, while 34 (14.1%) are nonfamily households. The most numerous type of family households are 2-person households, comprising 93, and the most common type of nonfamily households are 1-person households, comprising 32.
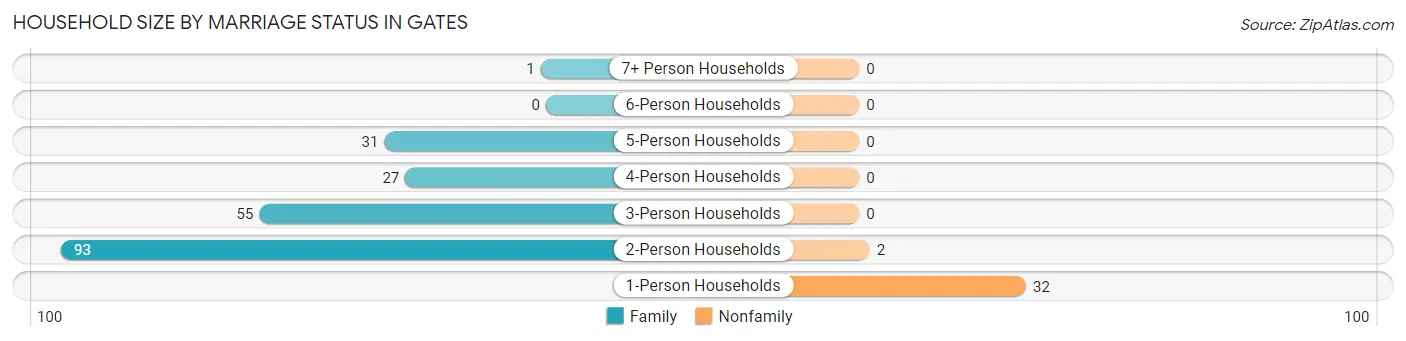
| Household Size | Family Households | Nonfamily Households |
| 1-Person Households | - | 32 (13.3%) |
| 2-Person Households | 93 (38.6%) | 2 (0.8%) |
| 3-Person Households | 55 (22.8%) | 0 (0.0%) |
| 4-Person Households | 27 (11.2%) | 0 (0.0%) |
| 5-Person Households | 31 (12.9%) | 0 (0.0%) |
| 6-Person Households | 0 (0.0%) | 0 (0.0%) |
| 7+ Person Households | 1 (0.4%) | 0 (0.0%) |
| Total | 207 (85.9%) | 34 (14.1%) |
Female Fertility in Gates
Fertility by Age in Gates
Average fertility rate in Gates is 40.0 births per 1,000 women. Women in the age bracket of 20 to 34 years have the highest fertility rate with 233.0 births per 1,000 women. Women in the age bracket of 20 to 34 years acount for 100.0% of all women with births.
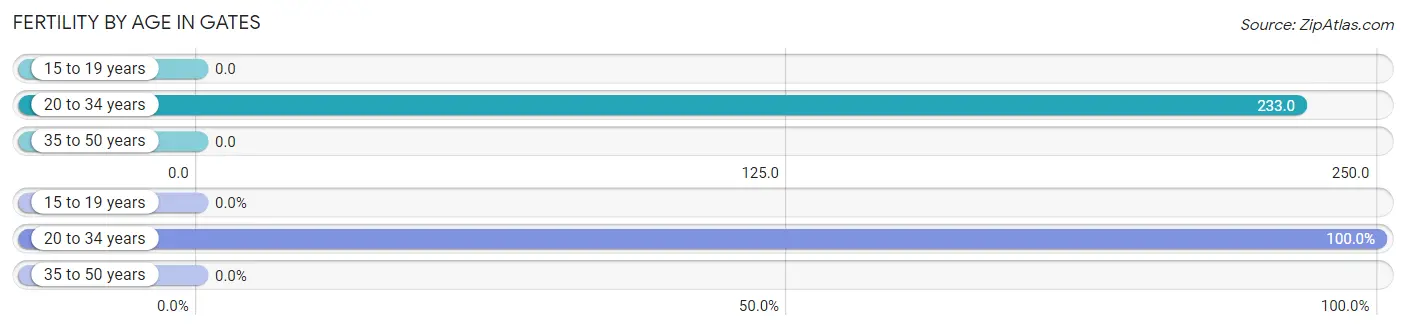
| Age Bracket | Women with Births | Births / 1,000 Women |
| 15 to 19 years | 0 (0.0%) | 0.0 |
| 20 to 34 years | 7 (100.0%) | 233.0 |
| 35 to 50 years | 0 (0.0%) | 0.0 |
| Total | 7 (100.0%) | 40.0 |
Fertility by Age by Marriage Status in Gates
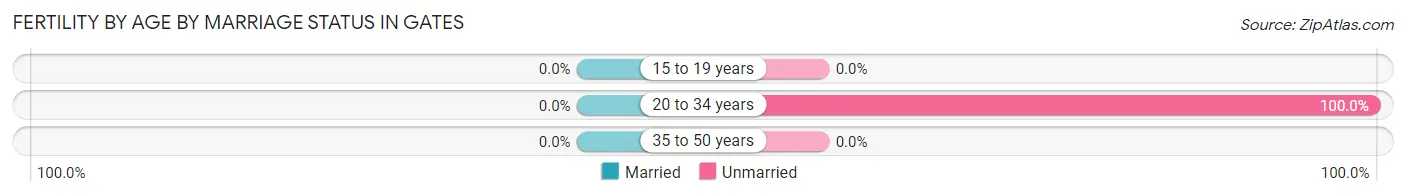
| Age Bracket | Married | Unmarried |
| 15 to 19 years | 0 (0.0%) | 0 (0.0%) |
| 20 to 34 years | 0 (0.0%) | 7 (100.0%) |
| 35 to 50 years | 0 (0.0%) | 0 (0.0%) |
| Total | 0 (0.0%) | 7 (100.0%) |
Fertility by Education in Gates
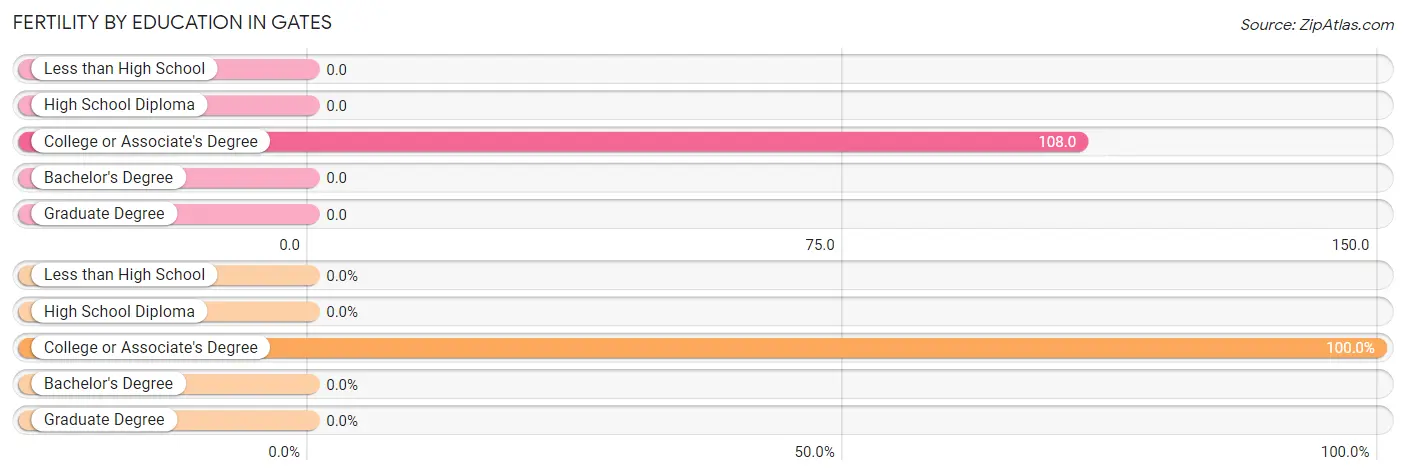
| Educational Attainment | Women with Births | Births / 1,000 Women |
| Less than High School | 0 (0.0%) | 0.0 |
| High School Diploma | 0 (0.0%) | 0.0 |
| College or Associate's Degree | 7 (100.0%) | 108.0 |
| Bachelor's Degree | 0 (0.0%) | 0.0 |
| Graduate Degree | 0 (0.0%) | 0.0 |
| Total | 7 (100.0%) | 40.0 |
Fertility by Education by Marriage Status in Gates
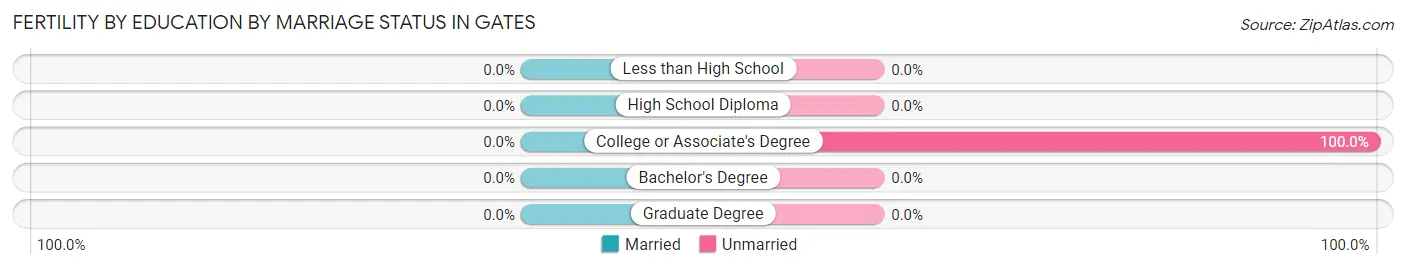
| Educational Attainment | Married | Unmarried |
| Less than High School | 0 (0.0%) | 0 (0.0%) |
| High School Diploma | 0 (0.0%) | 0 (0.0%) |
| College or Associate's Degree | 0 (0.0%) | 7 (100.0%) |
| Bachelor's Degree | 0 (0.0%) | 0 (0.0%) |
| Graduate Degree | 0 (0.0%) | 0 (0.0%) |
| Total | 0 (0.0%) | 7 (100.0%) |
Employment Characteristics in Gates
Employment by Class of Employer in Gates
Among the 218 employed individuals in Gates, private company employees (145 | 66.5%), self-employed (not incorporated) (34 | 15.6%), and self-employed (incorporated) (18 | 8.3%) make up the most common classes of employment.
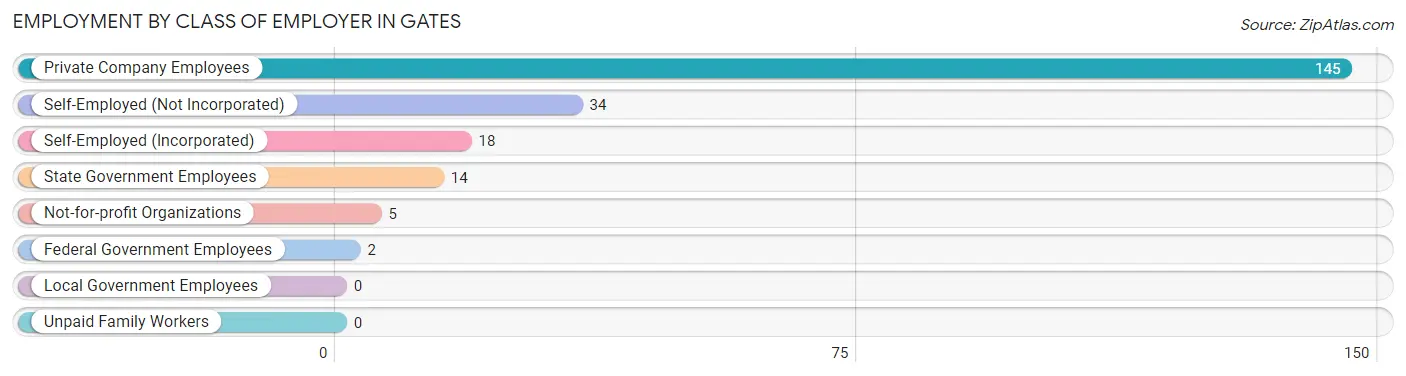
| Employer Class | # Employees | % Employees |
| Private Company Employees | 145 | 66.5% |
| Self-Employed (Incorporated) | 18 | 8.3% |
| Self-Employed (Not Incorporated) | 34 | 15.6% |
| Not-for-profit Organizations | 5 | 2.3% |
| Local Government Employees | 0 | 0.0% |
| State Government Employees | 14 | 6.4% |
| Federal Government Employees | 2 | 0.9% |
| Unpaid Family Workers | 0 | 0.0% |
| Total | 218 | 100.0% |
Employment Status by Age in Gates
According to the labor force statistics for Gates, out of the total population over 16 years of age (564), 48.9% or 276 individuals are in the labor force, with 19.2% or 53 of them unemployed. The age group with the highest labor force participation rate is 35 to 44 years, with 82.1% or 69 individuals in the labor force. Within the labor force, the 20 to 24 years age range has the highest percentage of unemployed individuals, with 61.9% or 26 of them being unemployed.
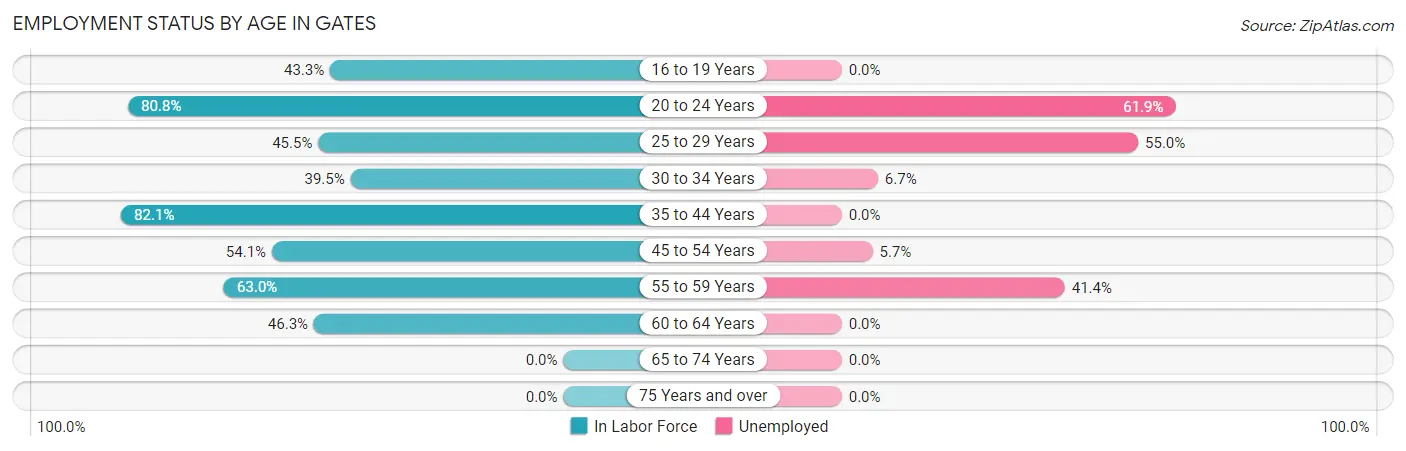
| Age Bracket | In Labor Force | Unemployed |
| 16 to 19 Years | 29 (43.3%) | 0 (0.0%) |
| 20 to 24 Years | 42 (80.8%) | 26 (61.9%) |
| 25 to 29 Years | 20 (45.5%) | 11 (55.0%) |
| 30 to 34 Years | 15 (39.5%) | 1 (6.7%) |
| 35 to 44 Years | 69 (82.1%) | 0 (0.0%) |
| 45 to 54 Years | 53 (54.1%) | 3 (5.7%) |
| 55 to 59 Years | 29 (63.0%) | 12 (41.4%) |
| 60 to 64 Years | 19 (46.3%) | 0 (0.0%) |
| 65 to 74 Years | 0 (0.0%) | 0 (0.0%) |
| 75 Years and over | 0 (0.0%) | 0 (0.0%) |
| Total | 276 (48.9%) | 53 (19.2%) |
Employment Status by Educational Attainment in Gates
According to labor force statistics for Gates, 58.4% of individuals (205) out of the total population between 25 and 64 years of age (351) are in the labor force, with 13.2% or 27 of them being unemployed. The group with the highest labor force participation rate are those with the educational attainment of bachelor's degree or higher, with 92.7% or 38 individuals in the labor force. Within the labor force, individuals with college / associate degree education have the highest percentage of unemployment, with 27.6% or 24 of them being unemployed.
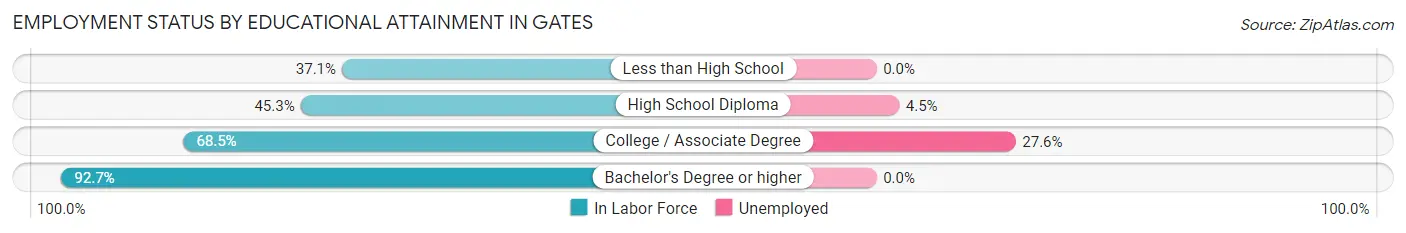
| Educational Attainment | In Labor Force | Unemployed |
| Less than High School | 13 (37.1%) | 0 (0.0%) |
| High School Diploma | 67 (45.3%) | 7 (4.5%) |
| College / Associate Degree | 87 (68.5%) | 35 (27.6%) |
| Bachelor's Degree or higher | 38 (92.7%) | 0 (0.0%) |
| Total | 205 (58.4%) | 46 (13.2%) |
Employment Occupations by Sex in Gates
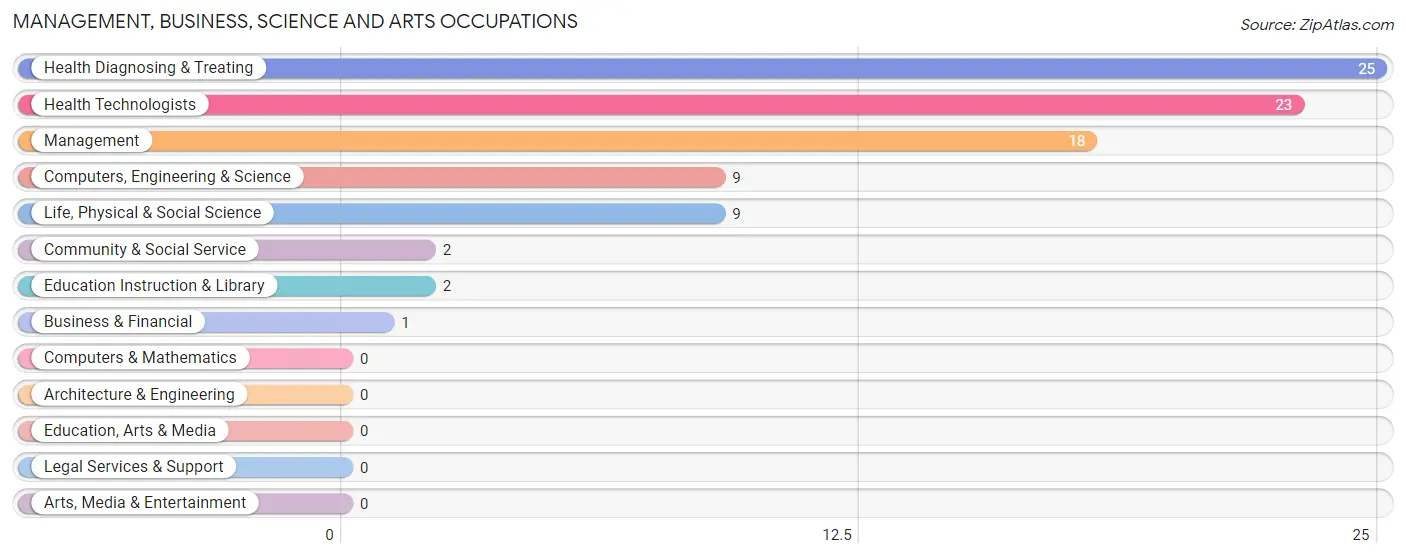
Management, Business, Science and Arts Occupations
The most common Management, Business, Science and Arts occupations in Gates are Health Diagnosing & Treating (25 | 11.2%), Health Technologists (23 | 10.3%), Management (18 | 8.1%), Computers, Engineering & Science (9 | 4.0%), and Life, Physical & Social Science (9 | 4.0%).
Management, Business, Science and Arts Occupations by Sex
Within the Management, Business, Science and Arts occupations in Gates, the most male-oriented occupations are Management (100.0%), Computers, Engineering & Science (100.0%), and Life, Physical & Social Science (100.0%), while the most female-oriented occupations are Business & Financial (100.0%), Community & Social Service (100.0%), and Education Instruction & Library (100.0%).
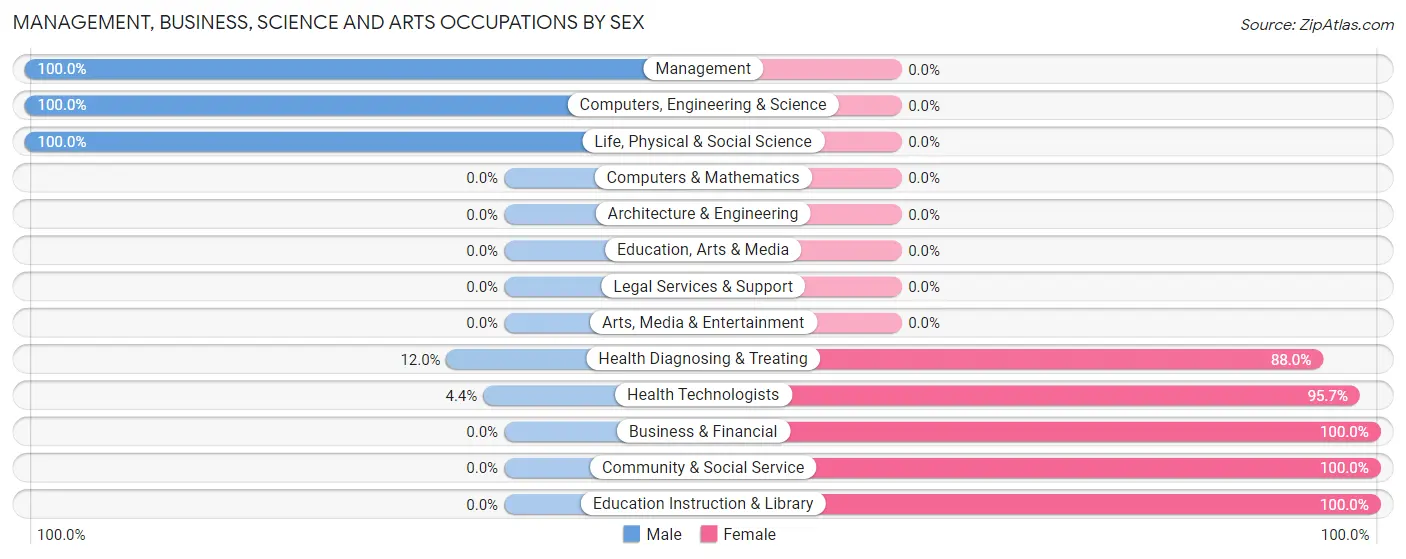
| Occupation | Male | Female |
| Management | 18 (100.0%) | 0 (0.0%) |
| Business & Financial | 0 (0.0%) | 1 (100.0%) |
| Computers, Engineering & Science | 9 (100.0%) | 0 (0.0%) |
| Computers & Mathematics | 0 (0.0%) | 0 (0.0%) |
| Architecture & Engineering | 0 (0.0%) | 0 (0.0%) |
| Life, Physical & Social Science | 9 (100.0%) | 0 (0.0%) |
| Community & Social Service | 0 (0.0%) | 2 (100.0%) |
| Education, Arts & Media | 0 (0.0%) | 0 (0.0%) |
| Legal Services & Support | 0 (0.0%) | 0 (0.0%) |
| Education Instruction & Library | 0 (0.0%) | 2 (100.0%) |
| Arts, Media & Entertainment | 0 (0.0%) | 0 (0.0%) |
| Health Diagnosing & Treating | 3 (12.0%) | 22 (88.0%) |
| Health Technologists | 1 (4.3%) | 22 (95.7%) |
| Total (Category) | 30 (54.5%) | 25 (45.5%) |
| Total (Overall) | 111 (49.8%) | 112 (50.2%) |
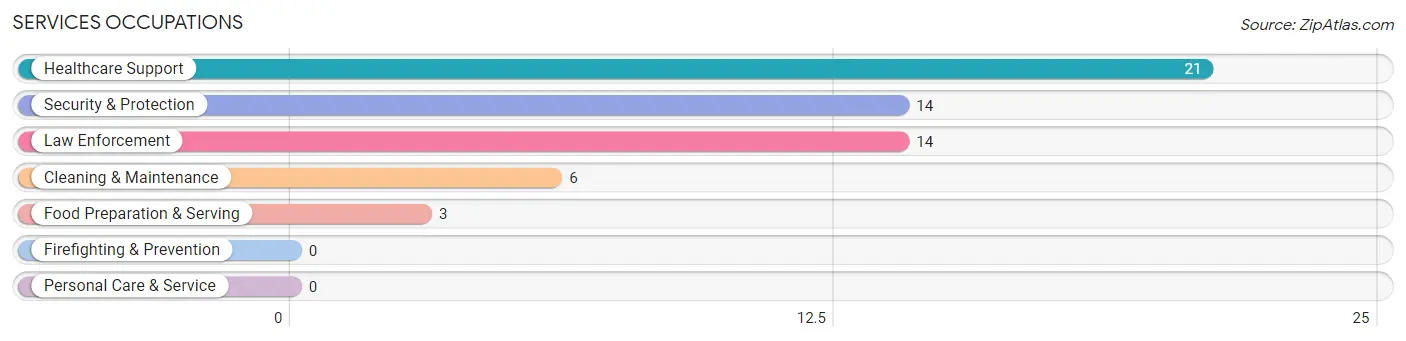
Services Occupations
The most common Services occupations in Gates are Healthcare Support (21 | 9.4%), Security & Protection (14 | 6.3%), Law Enforcement (14 | 6.3%), Cleaning & Maintenance (6 | 2.7%), and Food Preparation & Serving (3 | 1.3%).
Services Occupations by Sex
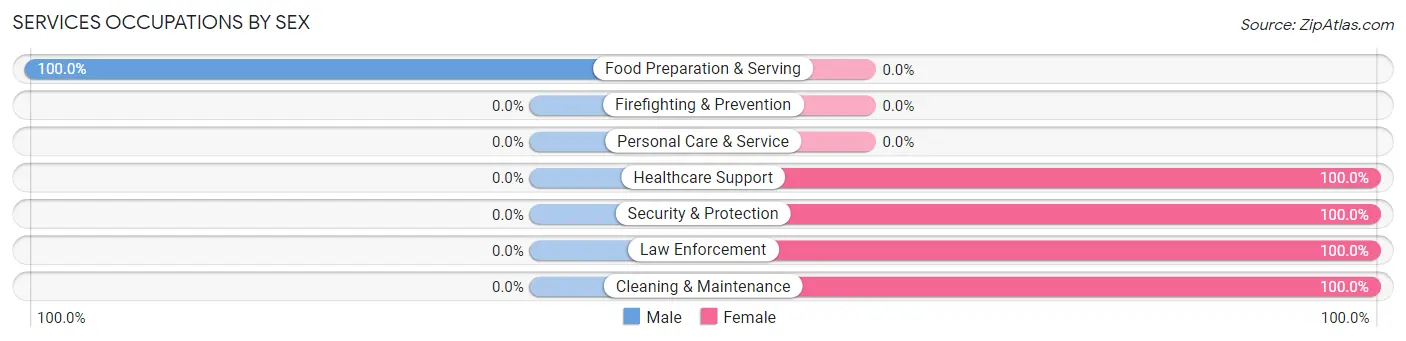
| Occupation | Male | Female |
| Healthcare Support | 0 (0.0%) | 21 (100.0%) |
| Security & Protection | 0 (0.0%) | 14 (100.0%) |
| Firefighting & Prevention | 0 (0.0%) | 0 (0.0%) |
| Law Enforcement | 0 (0.0%) | 14 (100.0%) |
| Food Preparation & Serving | 3 (100.0%) | 0 (0.0%) |
| Cleaning & Maintenance | 0 (0.0%) | 6 (100.0%) |
| Personal Care & Service | 0 (0.0%) | 0 (0.0%) |
| Total (Category) | 3 (6.8%) | 41 (93.2%) |
| Total (Overall) | 111 (49.8%) | 112 (50.2%) |
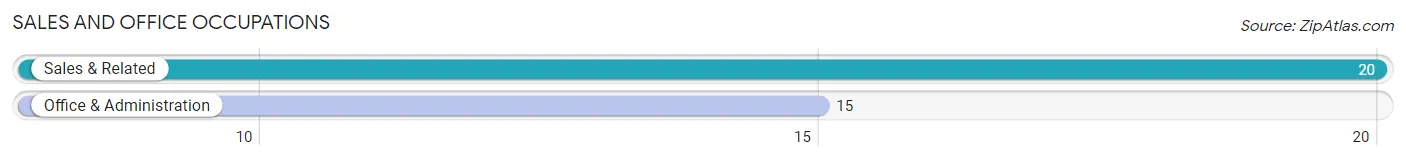
Sales and Office Occupations
The most common Sales and Office occupations in Gates are Sales & Related (20 | 9.0%), and Office & Administration (15 | 6.7%).
Sales and Office Occupations by Sex
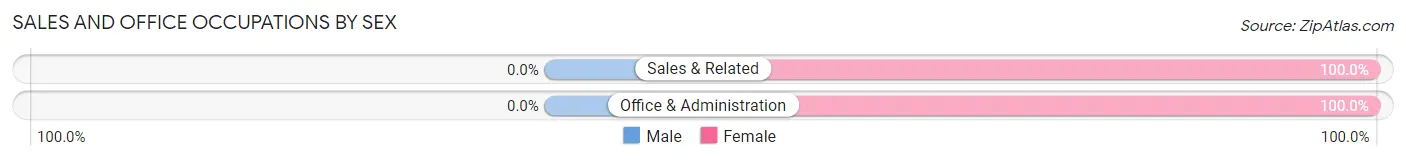
| Occupation | Male | Female |
| Sales & Related | 0 (0.0%) | 20 (100.0%) |
| Office & Administration | 0 (0.0%) | 15 (100.0%) |
| Total (Category) | 0 (0.0%) | 35 (100.0%) |
| Total (Overall) | 111 (49.8%) | 112 (50.2%) |
Natural Resources, Construction and Maintenance Occupations
The most common Natural Resources, Construction and Maintenance occupations in Gates are Construction & Extraction (6 | 2.7%), and Farming, Fishing & Forestry (2 | 0.9%).
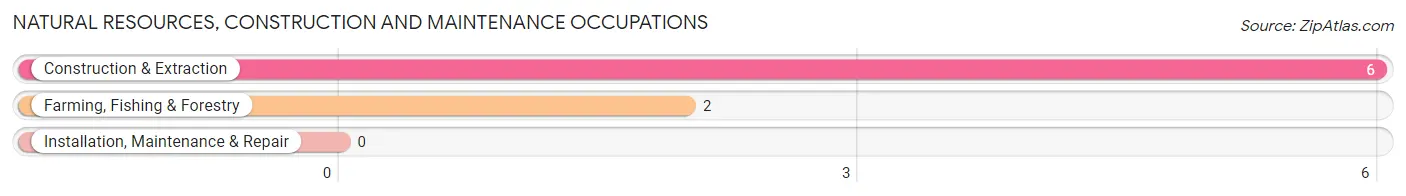
Natural Resources, Construction and Maintenance Occupations by Sex
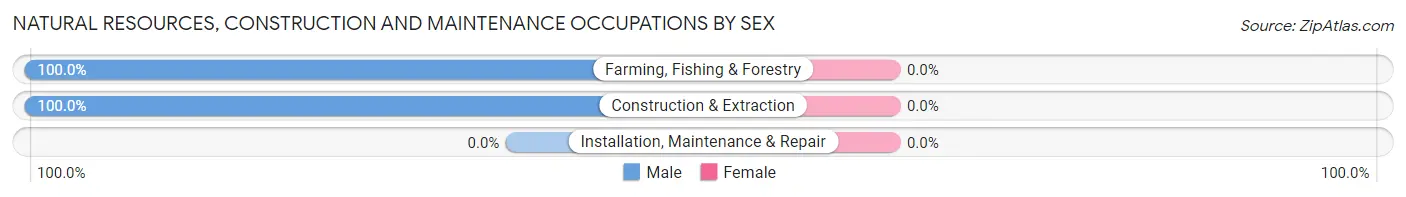
| Occupation | Male | Female |
| Farming, Fishing & Forestry | 2 (100.0%) | 0 (0.0%) |
| Construction & Extraction | 6 (100.0%) | 0 (0.0%) |
| Installation, Maintenance & Repair | 0 (0.0%) | 0 (0.0%) |
| Total (Category) | 8 (100.0%) | 0 (0.0%) |
| Total (Overall) | 111 (49.8%) | 112 (50.2%) |
Production, Transportation and Moving Occupations
The most common Production, Transportation and Moving occupations in Gates are Production (35 | 15.7%), Transportation (30 | 13.5%), and Material Moving (16 | 7.2%).
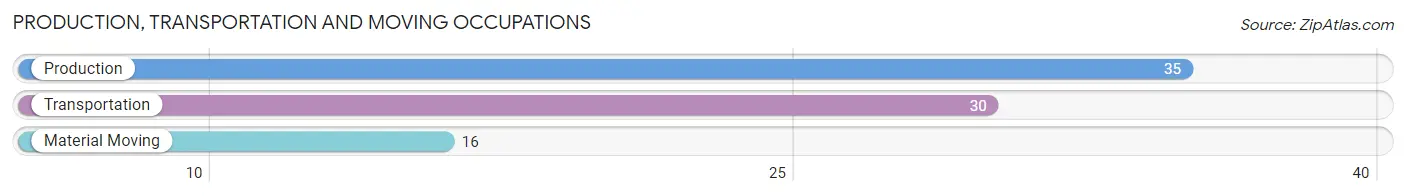
Production, Transportation and Moving Occupations by Sex
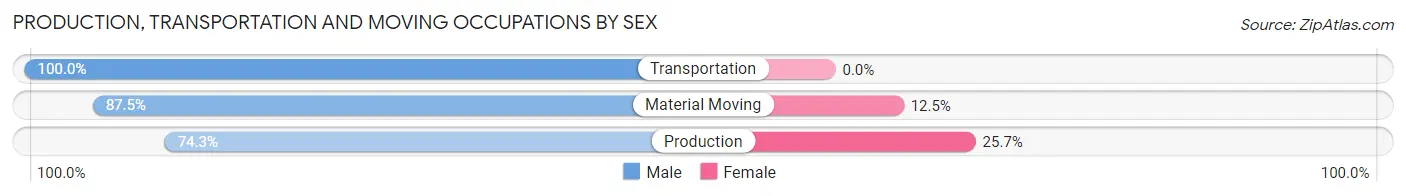
| Occupation | Male | Female |
| Production | 26 (74.3%) | 9 (25.7%) |
| Transportation | 30 (100.0%) | 0 (0.0%) |
| Material Moving | 14 (87.5%) | 2 (12.5%) |
| Total (Category) | 70 (86.4%) | 11 (13.6%) |
| Total (Overall) | 111 (49.8%) | 112 (50.2%) |
Employment Industries by Sex in Gates
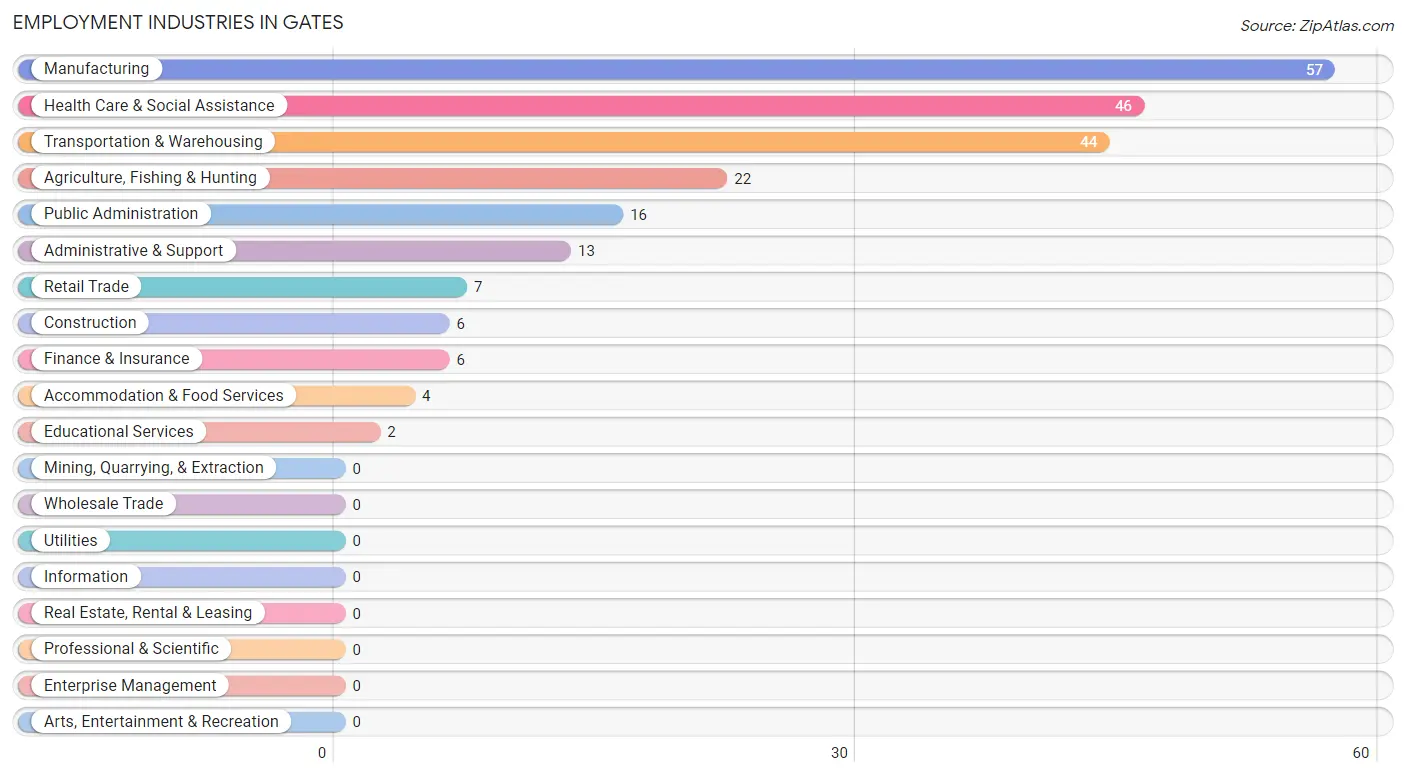
Employment Industries in Gates
The major employment industries in Gates include Manufacturing (57 | 25.6%), Health Care & Social Assistance (46 | 20.6%), Transportation & Warehousing (44 | 19.7%), Agriculture, Fishing & Hunting (22 | 9.9%), and Public Administration (16 | 7.2%).
Employment Industries by Sex in Gates
The Gates industries that see more men than women are Construction (100.0%), Transportation & Warehousing (86.4%), and Manufacturing (84.2%), whereas the industries that tend to have a higher number of women are Finance & Insurance (100.0%), Educational Services (100.0%), and Public Administration (100.0%).
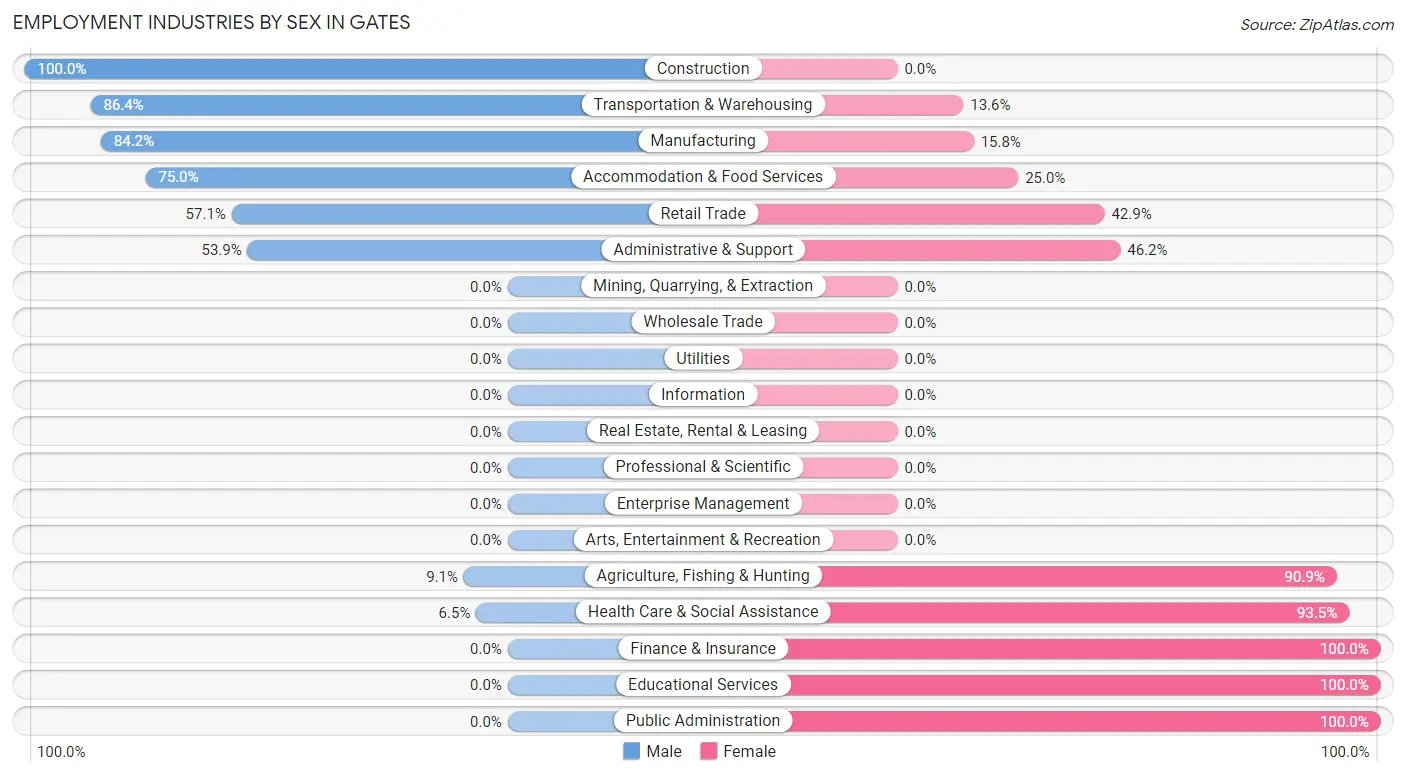
| Industry | Male | Female |
| Agriculture, Fishing & Hunting | 2 (9.1%) | 20 (90.9%) |
| Mining, Quarrying, & Extraction | 0 (0.0%) | 0 (0.0%) |
| Construction | 6 (100.0%) | 0 (0.0%) |
| Manufacturing | 48 (84.2%) | 9 (15.8%) |
| Wholesale Trade | 0 (0.0%) | 0 (0.0%) |
| Retail Trade | 4 (57.1%) | 3 (42.9%) |
| Transportation & Warehousing | 38 (86.4%) | 6 (13.6%) |
| Utilities | 0 (0.0%) | 0 (0.0%) |
| Information | 0 (0.0%) | 0 (0.0%) |
| Finance & Insurance | 0 (0.0%) | 6 (100.0%) |
| Real Estate, Rental & Leasing | 0 (0.0%) | 0 (0.0%) |
| Professional & Scientific | 0 (0.0%) | 0 (0.0%) |
| Enterprise Management | 0 (0.0%) | 0 (0.0%) |
| Administrative & Support | 7 (53.8%) | 6 (46.2%) |
| Educational Services | 0 (0.0%) | 2 (100.0%) |
| Health Care & Social Assistance | 3 (6.5%) | 43 (93.5%) |
| Arts, Entertainment & Recreation | 0 (0.0%) | 0 (0.0%) |
| Accommodation & Food Services | 3 (75.0%) | 1 (25.0%) |
| Public Administration | 0 (0.0%) | 16 (100.0%) |
| Total | 111 (49.8%) | 112 (50.2%) |
Education in Gates
School Enrollment in Gates
The most common levels of schooling among the 139 students in Gates are high school (49 | 35.2%), college / undergraduate (33 | 23.7%), and middle school (30 | 21.6%).
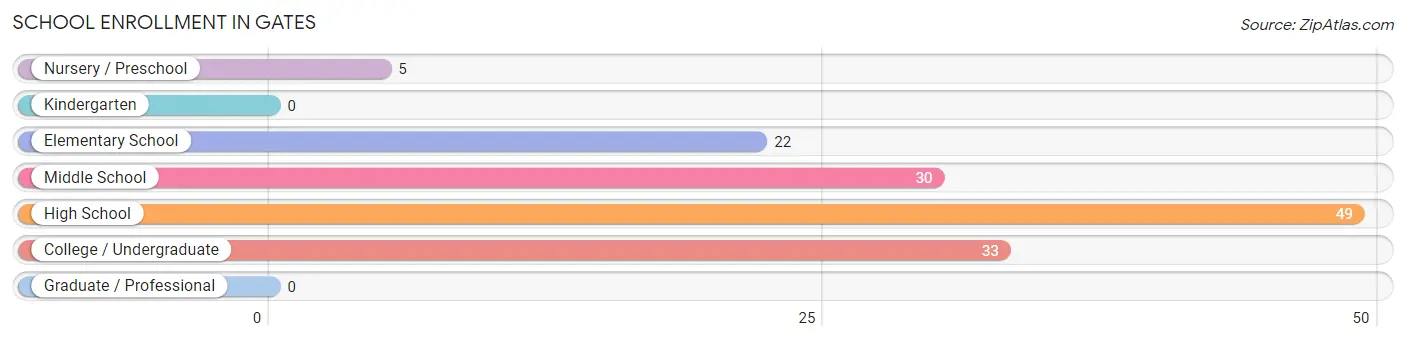
| School Level | # Students | % Students |
| Nursery / Preschool | 5 | 3.6% |
| Kindergarten | 0 | 0.0% |
| Elementary School | 22 | 15.8% |
| Middle School | 30 | 21.6% |
| High School | 49 | 35.2% |
| College / Undergraduate | 33 | 23.7% |
| Graduate / Professional | 0 | 0.0% |
| Total | 139 | 100.0% |
School Enrollment by Age by Funding Source in Gates
Out of a total of 139 students who are enrolled in schools in Gates, 21 (15.1%) attend a private institution, while the remaining 118 (84.9%) are enrolled in public schools. The age group of 5 to 9 year old has the highest likelihood of being enrolled in private schools, with 13 (59.1% in the age bracket) enrolled. Conversely, the age group of 3 to 4 year olds has the lowest likelihood of being enrolled in a private school, with 3 (100.0% in the age bracket) attending a public institution.
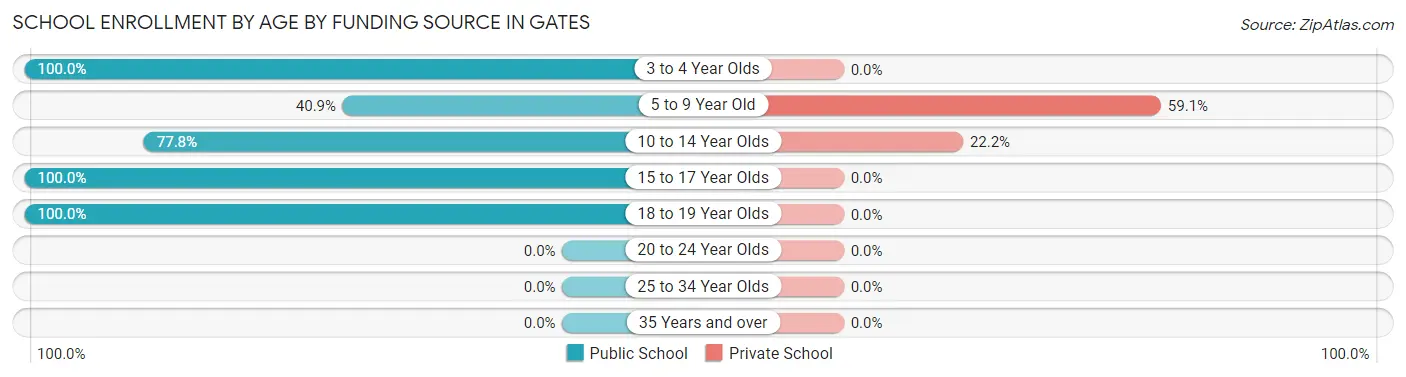
| Age Bracket | Public School | Private School |
| 3 to 4 Year Olds | 3 (100.0%) | 0 (0.0%) |
| 5 to 9 Year Old | 9 (40.9%) | 13 (59.1%) |
| 10 to 14 Year Olds | 28 (77.8%) | 8 (22.2%) |
| 15 to 17 Year Olds | 44 (100.0%) | 0 (0.0%) |
| 18 to 19 Year Olds | 34 (100.0%) | 0 (0.0%) |
| 20 to 24 Year Olds | 0 (0.0%) | 0 (0.0%) |
| 25 to 34 Year Olds | 0 (0.0%) | 0 (0.0%) |
| 35 Years and over | 0 (0.0%) | 0 (0.0%) |
| Total | 118 (84.9%) | 21 (15.1%) |
Educational Attainment by Field of Study in Gates
Science & technology (9 | 20.9%), business (9 | 20.9%), multidisciplinary studies (8 | 18.6%), engineering (7 | 16.3%), and education (6 | 14.0%) are the most common fields of study among 43 individuals in Gates who have obtained a bachelor's degree or higher.
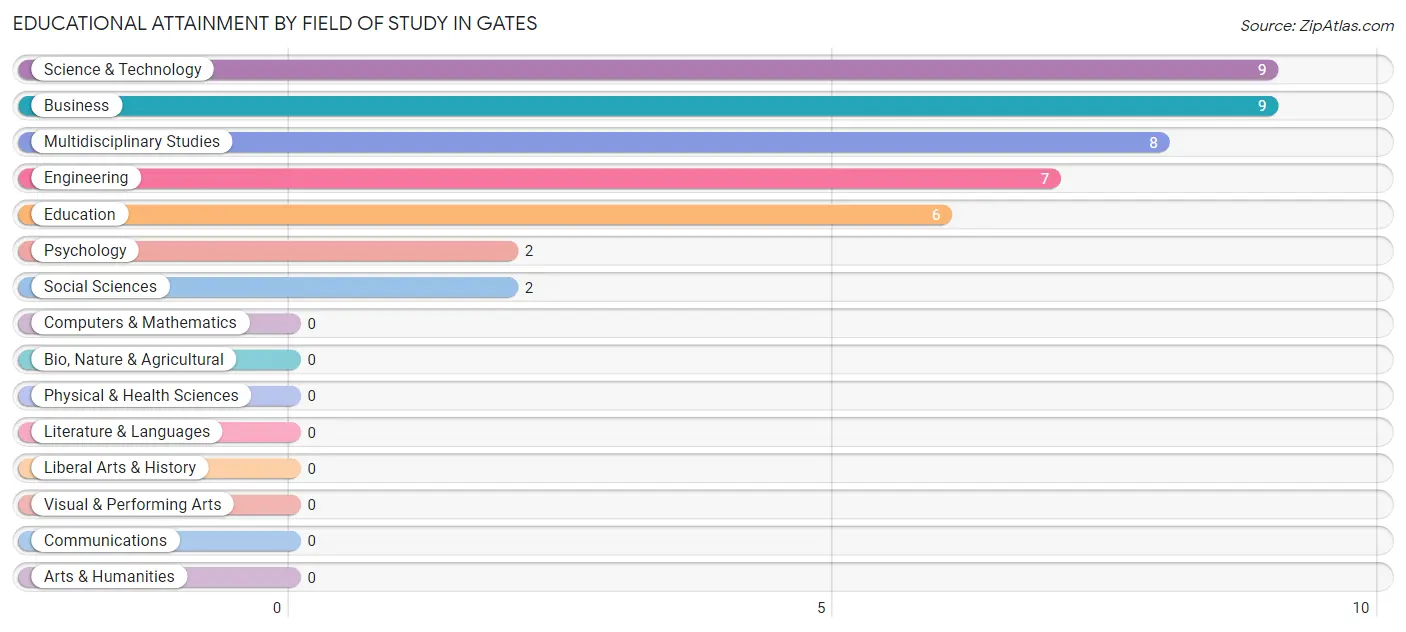
| Field of Study | # Graduates | % Graduates |
| Computers & Mathematics | 0 | 0.0% |
| Bio, Nature & Agricultural | 0 | 0.0% |
| Physical & Health Sciences | 0 | 0.0% |
| Psychology | 2 | 4.6% |
| Social Sciences | 2 | 4.6% |
| Engineering | 7 | 16.3% |
| Multidisciplinary Studies | 8 | 18.6% |
| Science & Technology | 9 | 20.9% |
| Business | 9 | 20.9% |
| Education | 6 | 14.0% |
| Literature & Languages | 0 | 0.0% |
| Liberal Arts & History | 0 | 0.0% |
| Visual & Performing Arts | 0 | 0.0% |
| Communications | 0 | 0.0% |
| Arts & Humanities | 0 | 0.0% |
| Total | 43 | 100.0% |
Transportation & Commute in Gates
Vehicle Availability by Sex in Gates
The most prevalent vehicle ownership categories in Gates are males with 2 vehicles (45, accounting for 42.1%) and females with 2 vehicles (26, making up 40.5%).
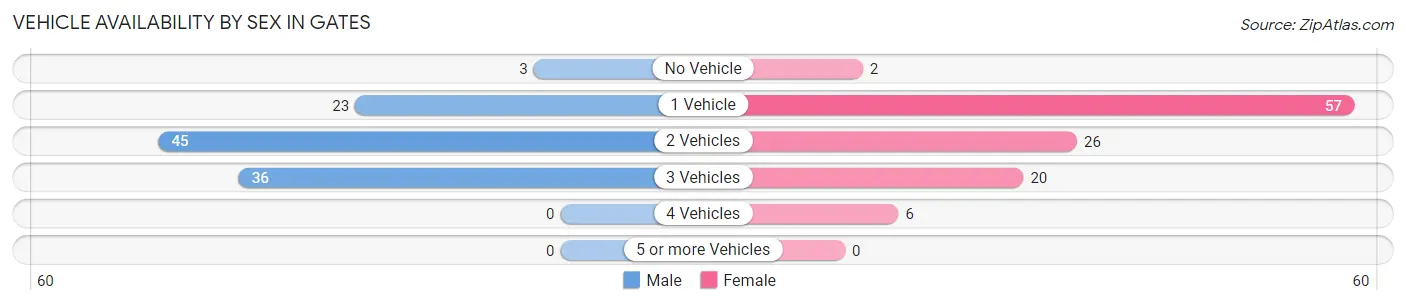
| Vehicles Available | Male | Female |
| No Vehicle | 3 (2.8%) | 2 (1.8%) |
| 1 Vehicle | 23 (21.5%) | 57 (51.3%) |
| 2 Vehicles | 45 (42.1%) | 26 (23.4%) |
| 3 Vehicles | 36 (33.6%) | 20 (18.0%) |
| 4 Vehicles | 0 (0.0%) | 6 (5.4%) |
| 5 or more Vehicles | 0 (0.0%) | 0 (0.0%) |
| Total | 107 (100.0%) | 111 (100.0%) |
Commute Time in Gates
The most frequently occuring commute durations in Gates are 45 to 59 minutes (41 commuters, 19.0%), 15 to 19 minutes (38 commuters, 17.6%), and 30 to 34 minutes (38 commuters, 17.6%).
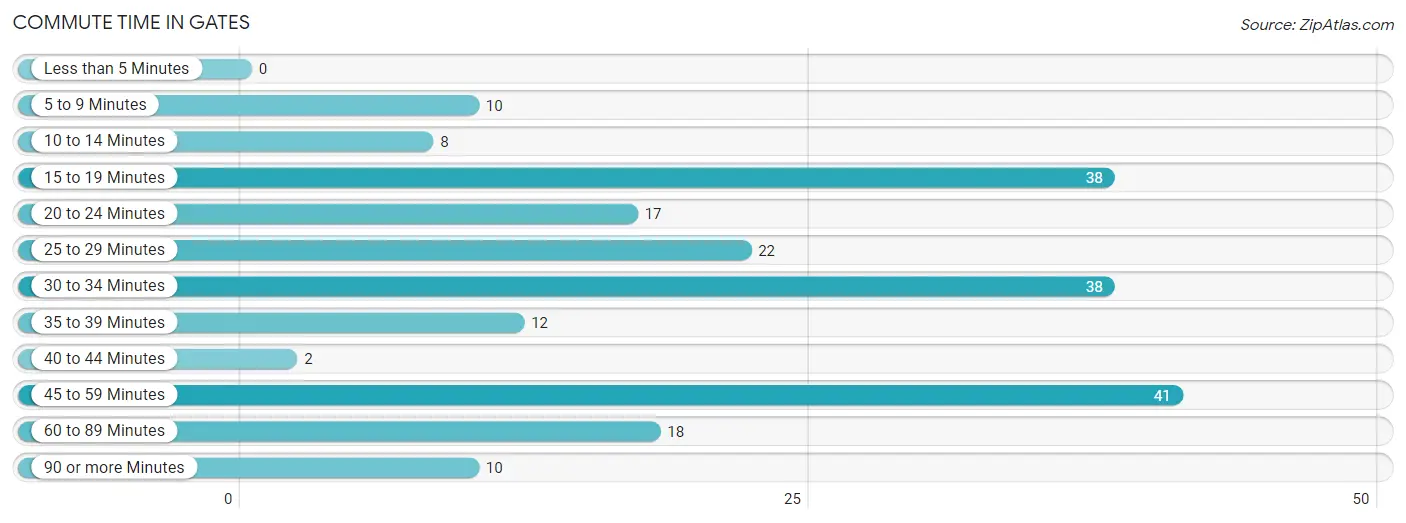
| Commute Time | # Commuters | % Commuters |
| Less than 5 Minutes | 0 | 0.0% |
| 5 to 9 Minutes | 10 | 4.6% |
| 10 to 14 Minutes | 8 | 3.7% |
| 15 to 19 Minutes | 38 | 17.6% |
| 20 to 24 Minutes | 17 | 7.9% |
| 25 to 29 Minutes | 22 | 10.2% |
| 30 to 34 Minutes | 38 | 17.6% |
| 35 to 39 Minutes | 12 | 5.6% |
| 40 to 44 Minutes | 2 | 0.9% |
| 45 to 59 Minutes | 41 | 19.0% |
| 60 to 89 Minutes | 18 | 8.3% |
| 90 or more Minutes | 10 | 4.6% |
Commute Time by Sex in Gates
The most common commute times in Gates are 45 to 59 minutes (38 commuters, 35.5%) for males and 30 to 34 minutes (28 commuters, 25.7%) for females.
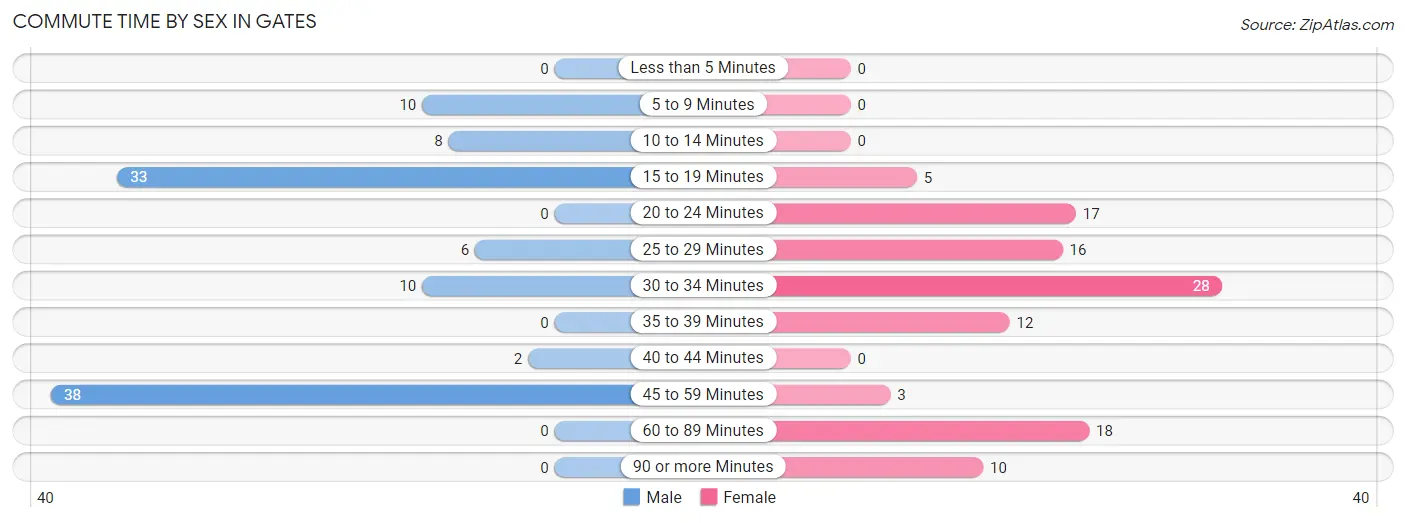
| Commute Time | Male | Female |
| Less than 5 Minutes | 0 (0.0%) | 0 (0.0%) |
| 5 to 9 Minutes | 10 (9.3%) | 0 (0.0%) |
| 10 to 14 Minutes | 8 (7.5%) | 0 (0.0%) |
| 15 to 19 Minutes | 33 (30.8%) | 5 (4.6%) |
| 20 to 24 Minutes | 0 (0.0%) | 17 (15.6%) |
| 25 to 29 Minutes | 6 (5.6%) | 16 (14.7%) |
| 30 to 34 Minutes | 10 (9.3%) | 28 (25.7%) |
| 35 to 39 Minutes | 0 (0.0%) | 12 (11.0%) |
| 40 to 44 Minutes | 2 (1.9%) | 0 (0.0%) |
| 45 to 59 Minutes | 38 (35.5%) | 3 (2.8%) |
| 60 to 89 Minutes | 0 (0.0%) | 18 (16.5%) |
| 90 or more Minutes | 0 (0.0%) | 10 (9.2%) |
Time of Departure to Work by Sex in Gates
The most frequent times of departure to work in Gates are 12:00 AM to 4:59 AM (64, 59.8%) for males and 12:00 AM to 4:59 AM (29, 26.6%) for females.
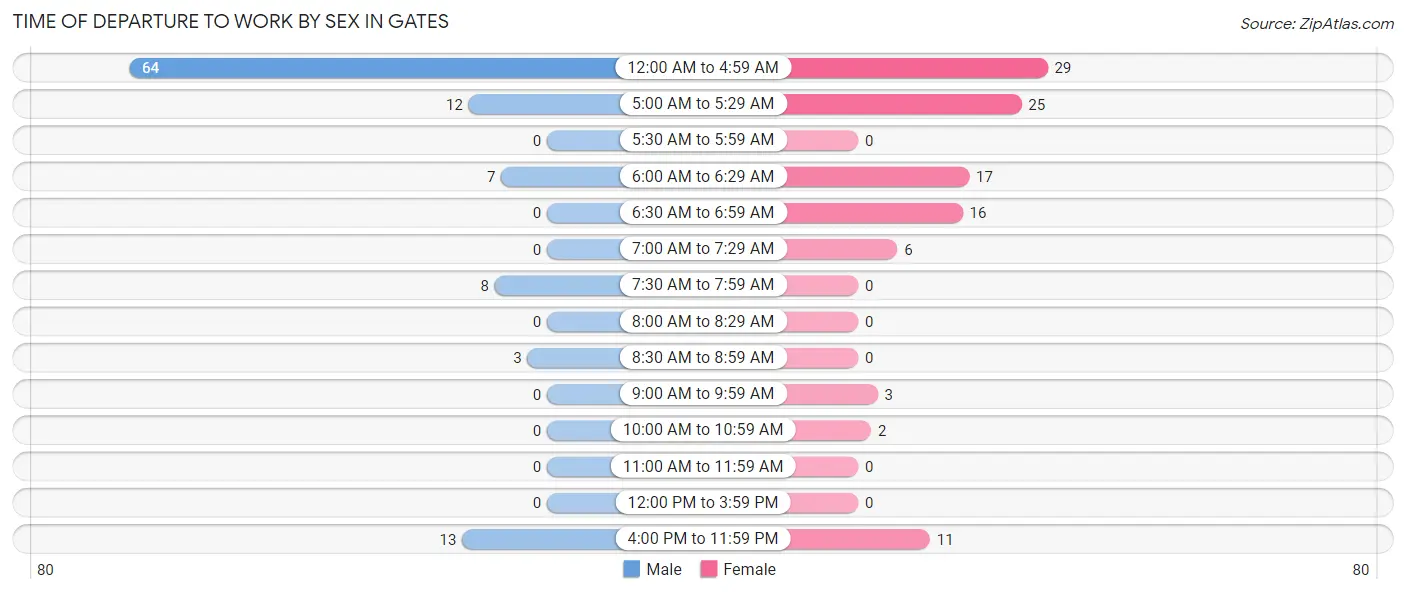
| Time of Departure | Male | Female |
| 12:00 AM to 4:59 AM | 64 (59.8%) | 29 (26.6%) |
| 5:00 AM to 5:29 AM | 12 (11.2%) | 25 (22.9%) |
| 5:30 AM to 5:59 AM | 0 (0.0%) | 0 (0.0%) |
| 6:00 AM to 6:29 AM | 7 (6.5%) | 17 (15.6%) |
| 6:30 AM to 6:59 AM | 0 (0.0%) | 16 (14.7%) |
| 7:00 AM to 7:29 AM | 0 (0.0%) | 6 (5.5%) |
| 7:30 AM to 7:59 AM | 8 (7.5%) | 0 (0.0%) |
| 8:00 AM to 8:29 AM | 0 (0.0%) | 0 (0.0%) |
| 8:30 AM to 8:59 AM | 3 (2.8%) | 0 (0.0%) |
| 9:00 AM to 9:59 AM | 0 (0.0%) | 3 (2.8%) |
| 10:00 AM to 10:59 AM | 0 (0.0%) | 2 (1.8%) |
| 11:00 AM to 11:59 AM | 0 (0.0%) | 0 (0.0%) |
| 12:00 PM to 3:59 PM | 0 (0.0%) | 0 (0.0%) |
| 4:00 PM to 11:59 PM | 13 (12.1%) | 11 (10.1%) |
| Total | 107 (100.0%) | 109 (100.0%) |
Housing Occupancy in Gates
Occupancy by Ownership in Gates
Of the total 241 dwellings in Gates, owner-occupied units account for 114 (47.3%), while renter-occupied units make up 127 (52.7%).
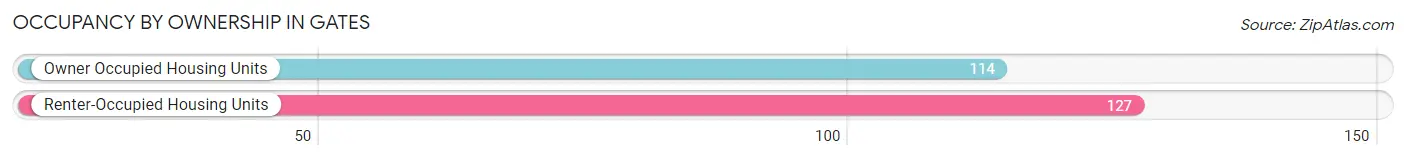
| Occupancy | # Housing Units | % Housing Units |
| Owner Occupied Housing Units | 114 | 47.3% |
| Renter-Occupied Housing Units | 127 | 52.7% |
| Total Occupied Housing Units | 241 | 100.0% |
Occupancy by Household Size in Gates
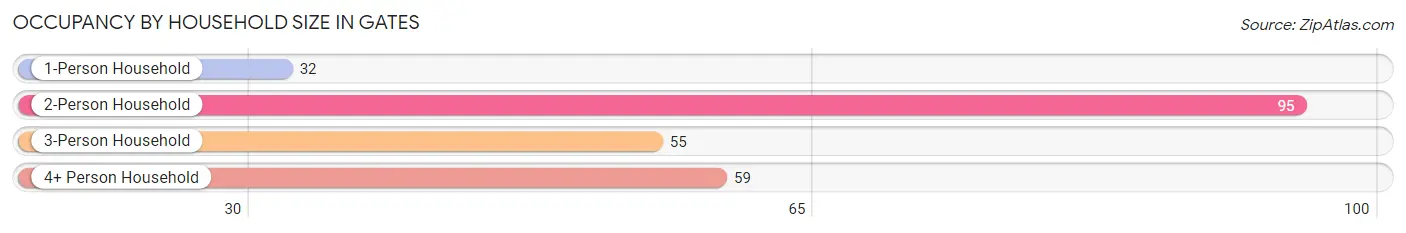
| Household Size | # Housing Units | % Housing Units |
| 1-Person Household | 32 | 13.3% |
| 2-Person Household | 95 | 39.4% |
| 3-Person Household | 55 | 22.8% |
| 4+ Person Household | 59 | 24.5% |
| Total Housing Units | 241 | 100.0% |
Occupancy by Ownership by Household Size in Gates
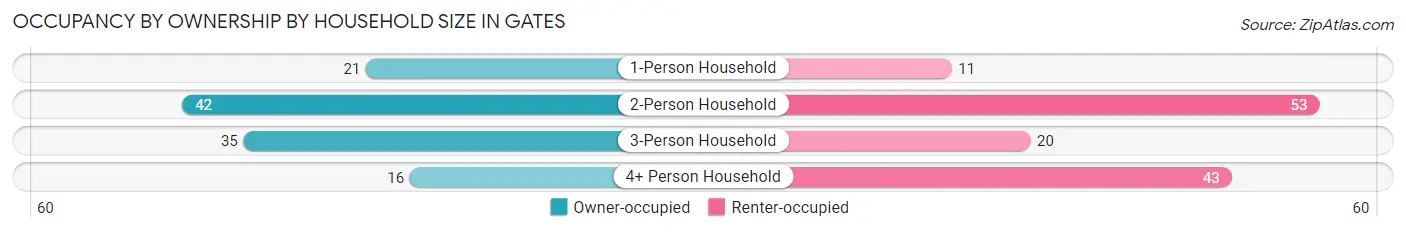
| Household Size | Owner-occupied | Renter-occupied |
| 1-Person Household | 21 (65.6%) | 11 (34.4%) |
| 2-Person Household | 42 (44.2%) | 53 (55.8%) |
| 3-Person Household | 35 (63.6%) | 20 (36.4%) |
| 4+ Person Household | 16 (27.1%) | 43 (72.9%) |
| Total Housing Units | 114 (47.3%) | 127 (52.7%) |
Occupancy by Educational Attainment in Gates
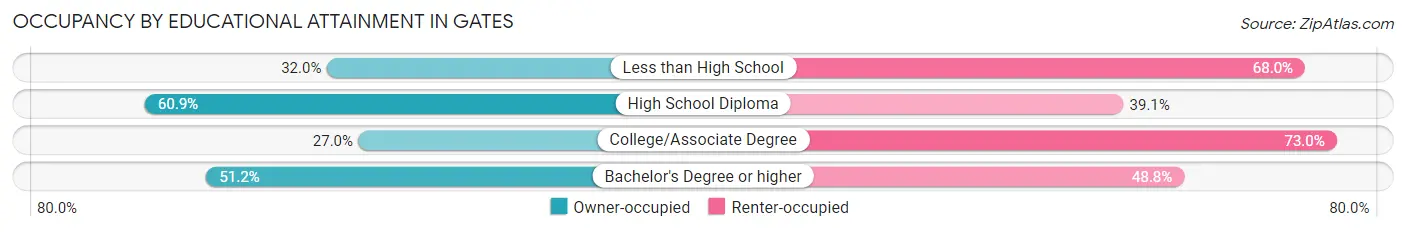
| Household Size | Owner-occupied | Renter-occupied |
| Less than High School | 8 (32.0%) | 17 (68.0%) |
| High School Diploma | 67 (60.9%) | 43 (39.1%) |
| College/Associate Degree | 17 (27.0%) | 46 (73.0%) |
| Bachelor's Degree or higher | 22 (51.2%) | 21 (48.8%) |
Occupancy by Age of Householder in Gates
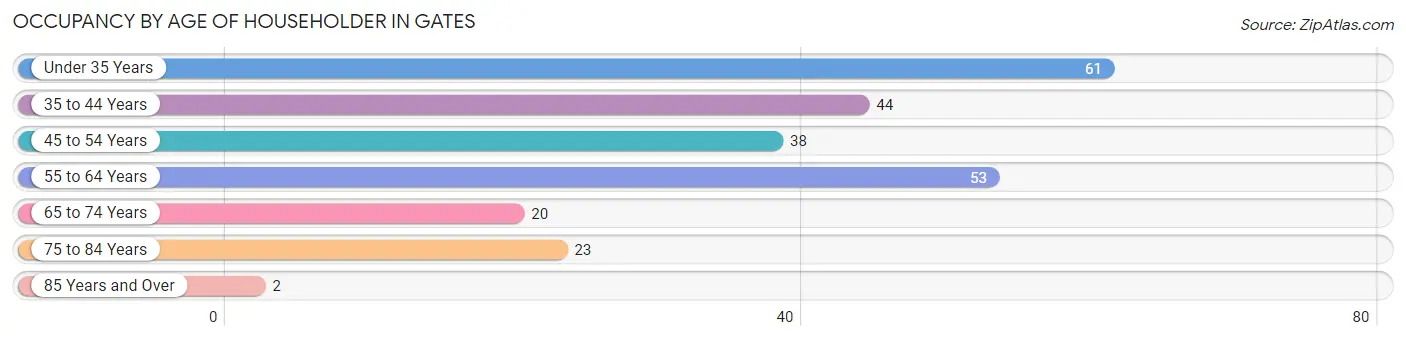
| Age Bracket | # Households | % Households |
| Under 35 Years | 61 | 25.3% |
| 35 to 44 Years | 44 | 18.3% |
| 45 to 54 Years | 38 | 15.8% |
| 55 to 64 Years | 53 | 22.0% |
| 65 to 74 Years | 20 | 8.3% |
| 75 to 84 Years | 23 | 9.5% |
| 85 Years and Over | 2 | 0.8% |
| Total | 241 | 100.0% |
Housing Finances in Gates
Median Income by Occupancy in Gates
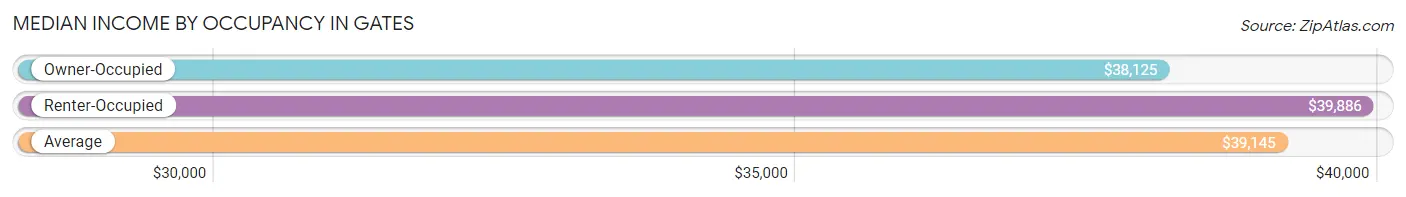
| Occupancy Type | # Households | Median Income |
| Owner-Occupied | 114 (47.3%) | $38,125 |
| Renter-Occupied | 127 (52.7%) | $39,886 |
| Average | 241 (100.0%) | $39,145 |
Occupancy by Householder Income Bracket in Gates
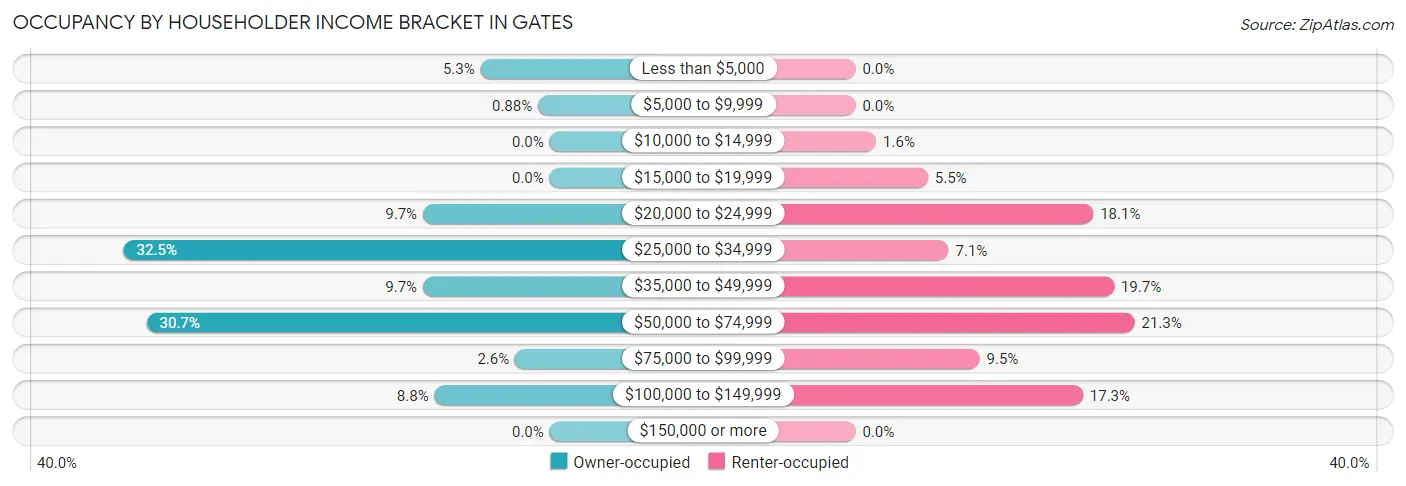
| Income Bracket | Owner-occupied | Renter-occupied |
| Less than $5,000 | 6 (5.3%) | 0 (0.0%) |
| $5,000 to $9,999 | 1 (0.9%) | 0 (0.0%) |
| $10,000 to $14,999 | 0 (0.0%) | 2 (1.6%) |
| $15,000 to $19,999 | 0 (0.0%) | 7 (5.5%) |
| $20,000 to $24,999 | 11 (9.7%) | 23 (18.1%) |
| $25,000 to $34,999 | 37 (32.5%) | 9 (7.1%) |
| $35,000 to $49,999 | 11 (9.7%) | 25 (19.7%) |
| $50,000 to $74,999 | 35 (30.7%) | 27 (21.3%) |
| $75,000 to $99,999 | 3 (2.6%) | 12 (9.5%) |
| $100,000 to $149,999 | 10 (8.8%) | 22 (17.3%) |
| $150,000 or more | 0 (0.0%) | 0 (0.0%) |
| Total | 114 (100.0%) | 127 (100.0%) |
Monthly Housing Cost Tiers in Gates
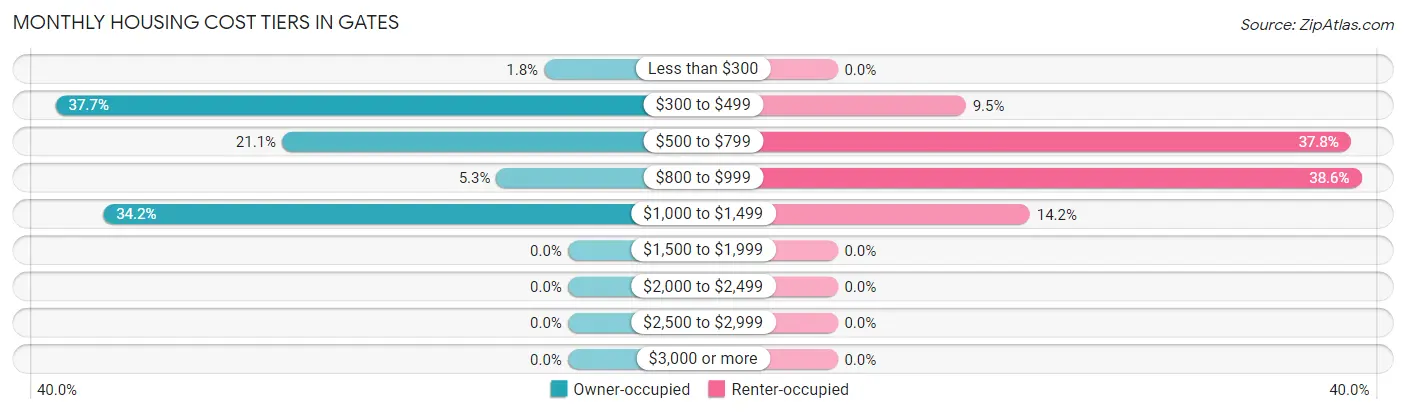
| Monthly Cost | Owner-occupied | Renter-occupied |
| Less than $300 | 2 (1.8%) | 0 (0.0%) |
| $300 to $499 | 43 (37.7%) | 12 (9.5%) |
| $500 to $799 | 24 (21.0%) | 48 (37.8%) |
| $800 to $999 | 6 (5.3%) | 49 (38.6%) |
| $1,000 to $1,499 | 39 (34.2%) | 18 (14.2%) |
| $1,500 to $1,999 | 0 (0.0%) | 0 (0.0%) |
| $2,000 to $2,499 | 0 (0.0%) | 0 (0.0%) |
| $2,500 to $2,999 | 0 (0.0%) | 0 (0.0%) |
| $3,000 or more | 0 (0.0%) | 0 (0.0%) |
| Total | 114 (100.0%) | 127 (100.0%) |
Physical Housing Characteristics in Gates
Housing Structures in Gates
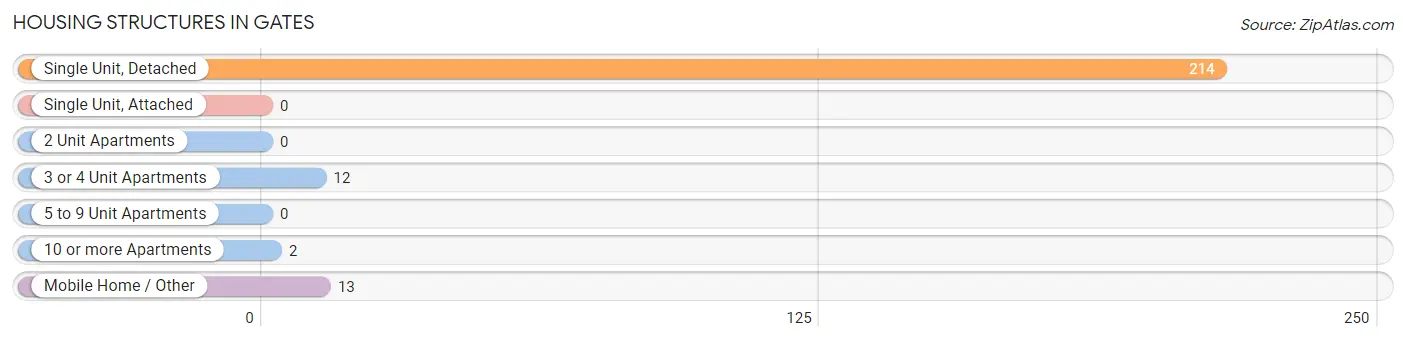
| Structure Type | # Housing Units | % Housing Units |
| Single Unit, Detached | 214 | 88.8% |
| Single Unit, Attached | 0 | 0.0% |
| 2 Unit Apartments | 0 | 0.0% |
| 3 or 4 Unit Apartments | 12 | 5.0% |
| 5 to 9 Unit Apartments | 0 | 0.0% |
| 10 or more Apartments | 2 | 0.8% |
| Mobile Home / Other | 13 | 5.4% |
| Total | 241 | 100.0% |
Housing Structures by Occupancy in Gates
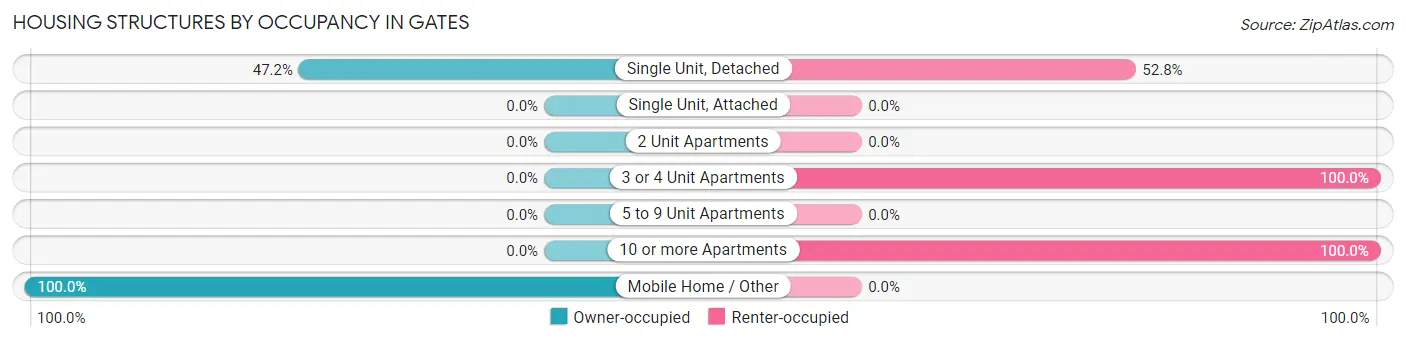
| Structure Type | Owner-occupied | Renter-occupied |
| Single Unit, Detached | 101 (47.2%) | 113 (52.8%) |
| Single Unit, Attached | 0 (0.0%) | 0 (0.0%) |
| 2 Unit Apartments | 0 (0.0%) | 0 (0.0%) |
| 3 or 4 Unit Apartments | 0 (0.0%) | 12 (100.0%) |
| 5 to 9 Unit Apartments | 0 (0.0%) | 0 (0.0%) |
| 10 or more Apartments | 0 (0.0%) | 2 (100.0%) |
| Mobile Home / Other | 13 (100.0%) | 0 (0.0%) |
| Total | 114 (47.3%) | 127 (52.7%) |
Housing Structures by Number of Rooms in Gates
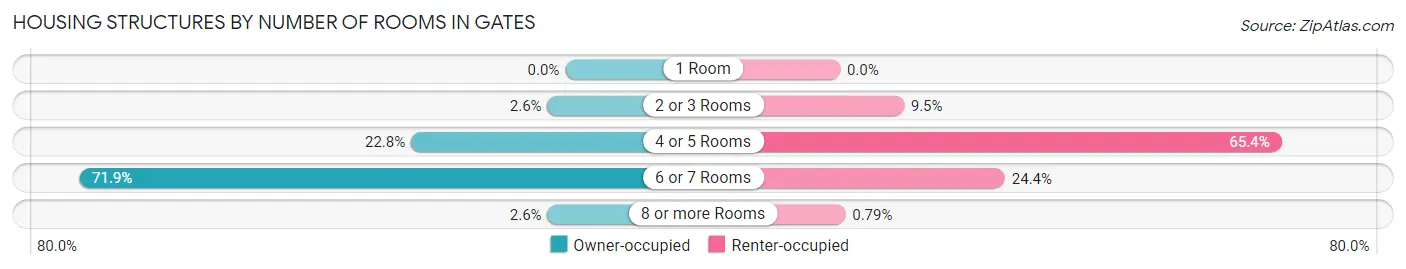
| Number of Rooms | Owner-occupied | Renter-occupied |
| 1 Room | 0 (0.0%) | 0 (0.0%) |
| 2 or 3 Rooms | 3 (2.6%) | 12 (9.5%) |
| 4 or 5 Rooms | 26 (22.8%) | 83 (65.3%) |
| 6 or 7 Rooms | 82 (71.9%) | 31 (24.4%) |
| 8 or more Rooms | 3 (2.6%) | 1 (0.8%) |
| Total | 114 (100.0%) | 127 (100.0%) |
Housing Structure by Heating Type in Gates
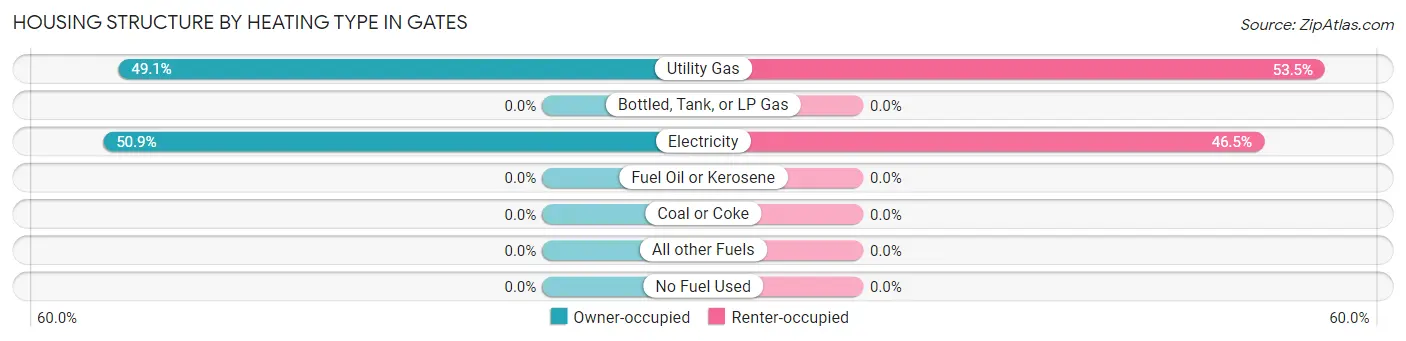
| Heating Type | Owner-occupied | Renter-occupied |
| Utility Gas | 56 (49.1%) | 68 (53.5%) |
| Bottled, Tank, or LP Gas | 0 (0.0%) | 0 (0.0%) |
| Electricity | 58 (50.9%) | 59 (46.5%) |
| Fuel Oil or Kerosene | 0 (0.0%) | 0 (0.0%) |
| Coal or Coke | 0 (0.0%) | 0 (0.0%) |
| All other Fuels | 0 (0.0%) | 0 (0.0%) |
| No Fuel Used | 0 (0.0%) | 0 (0.0%) |
| Total | 114 (100.0%) | 127 (100.0%) |
Household Vehicle Usage in Gates
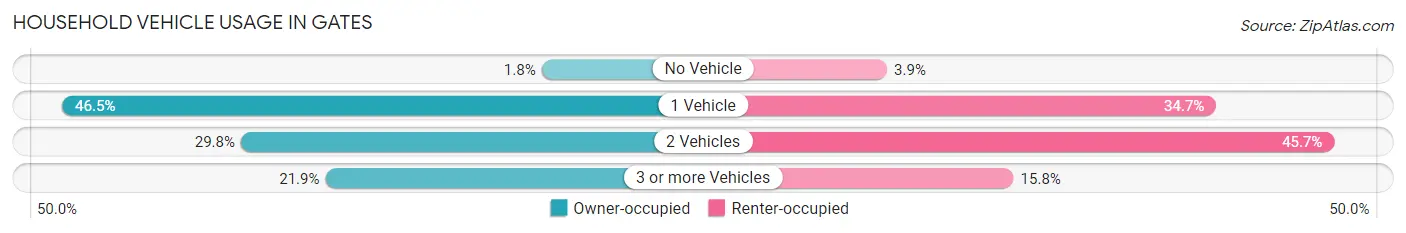
| Vehicles per Household | Owner-occupied | Renter-occupied |
| No Vehicle | 2 (1.8%) | 5 (3.9%) |
| 1 Vehicle | 53 (46.5%) | 44 (34.6%) |
| 2 Vehicles | 34 (29.8%) | 58 (45.7%) |
| 3 or more Vehicles | 25 (21.9%) | 20 (15.8%) |
| Total | 114 (100.0%) | 127 (100.0%) |
Real Estate & Mortgages in Gates
Real Estate and Mortgage Overview in Gates
| Characteristic | Without Mortgage | With Mortgage |
| Housing Units | 53 | 61 |
| Median Property Value | $83,500 | $104,700 |
| Median Household Income | $52,875 | $0 |
| Monthly Housing Costs | $396 | $0 |
| Real Estate Taxes | $584 | $0 |
Property Value by Mortgage Status in Gates
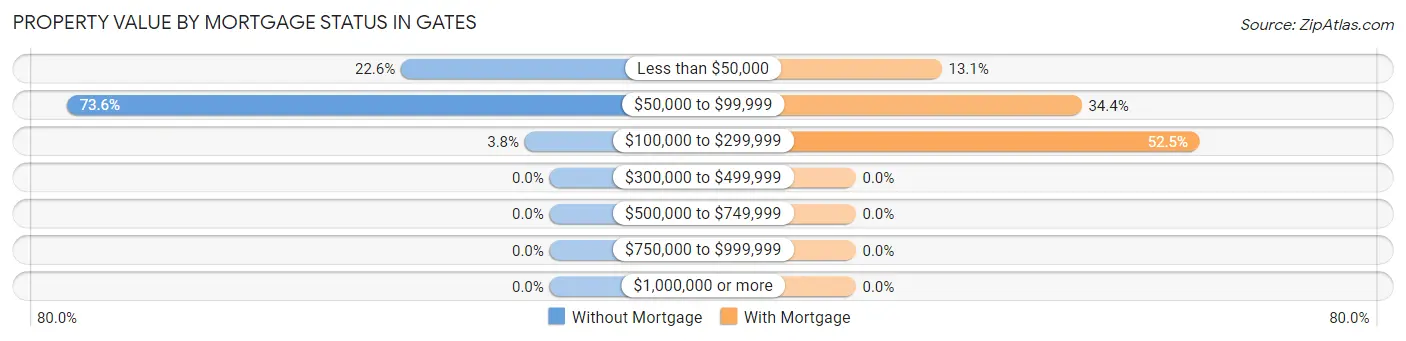
| Property Value | Without Mortgage | With Mortgage |
| Less than $50,000 | 12 (22.6%) | 8 (13.1%) |
| $50,000 to $99,999 | 39 (73.6%) | 21 (34.4%) |
| $100,000 to $299,999 | 2 (3.8%) | 32 (52.5%) |
| $300,000 to $499,999 | 0 (0.0%) | 0 (0.0%) |
| $500,000 to $749,999 | 0 (0.0%) | 0 (0.0%) |
| $750,000 to $999,999 | 0 (0.0%) | 0 (0.0%) |
| $1,000,000 or more | 0 (0.0%) | 0 (0.0%) |
| Total | 53 (100.0%) | 61 (100.0%) |
Household Income by Mortgage Status in Gates
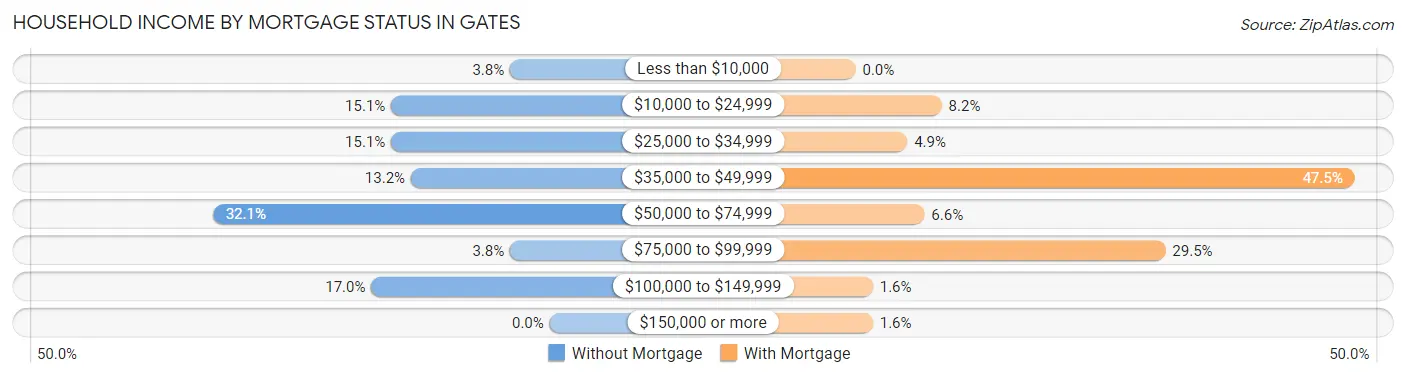
| Household Income | Without Mortgage | With Mortgage |
| Less than $10,000 | 2 (3.8%) | 0 (0.0%) |
| $10,000 to $24,999 | 8 (15.1%) | 5 (8.2%) |
| $25,000 to $34,999 | 8 (15.1%) | 3 (4.9%) |
| $35,000 to $49,999 | 7 (13.2%) | 29 (47.5%) |
| $50,000 to $74,999 | 17 (32.1%) | 4 (6.6%) |
| $75,000 to $99,999 | 2 (3.8%) | 18 (29.5%) |
| $100,000 to $149,999 | 9 (17.0%) | 1 (1.6%) |
| $150,000 or more | 0 (0.0%) | 1 (1.6%) |
| Total | 53 (100.0%) | 61 (100.0%) |
Property Value to Household Income Ratio in Gates
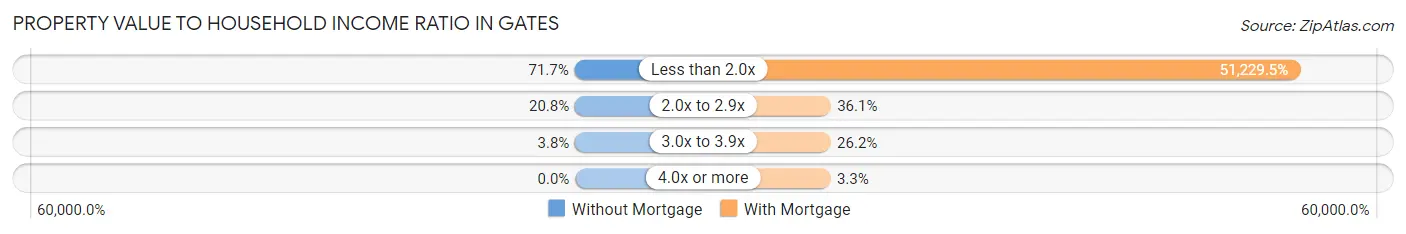
| Value-to-Income Ratio | Without Mortgage | With Mortgage |
| Less than 2.0x | 38 (71.7%) | 31,250 (51,229.5%) |
| 2.0x to 2.9x | 11 (20.7%) | 22 (36.1%) |
| 3.0x to 3.9x | 2 (3.8%) | 16 (26.2%) |
| 4.0x or more | 0 (0.0%) | 2 (3.3%) |
| Total | 53 (100.0%) | 61 (100.0%) |
Real Estate Taxes by Mortgage Status in Gates
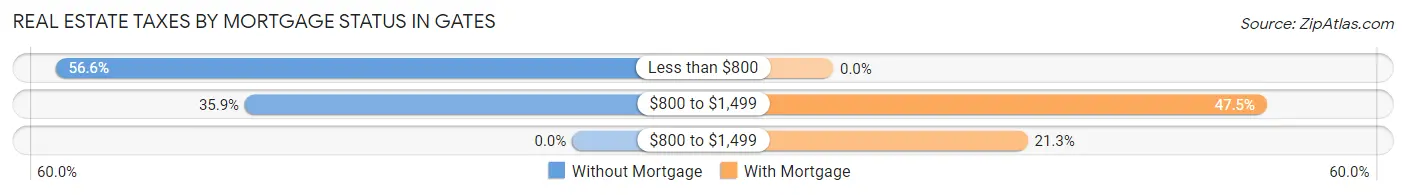
| Property Taxes | Without Mortgage | With Mortgage |
| Less than $800 | 30 (56.6%) | 0 (0.0%) |
| $800 to $1,499 | 19 (35.8%) | 29 (47.5%) |
| $800 to $1,499 | 0 (0.0%) | 13 (21.3%) |
| Total | 53 (100.0%) | 61 (100.0%) |
Health & Disability in Gates
Health Insurance Coverage by Age in Gates
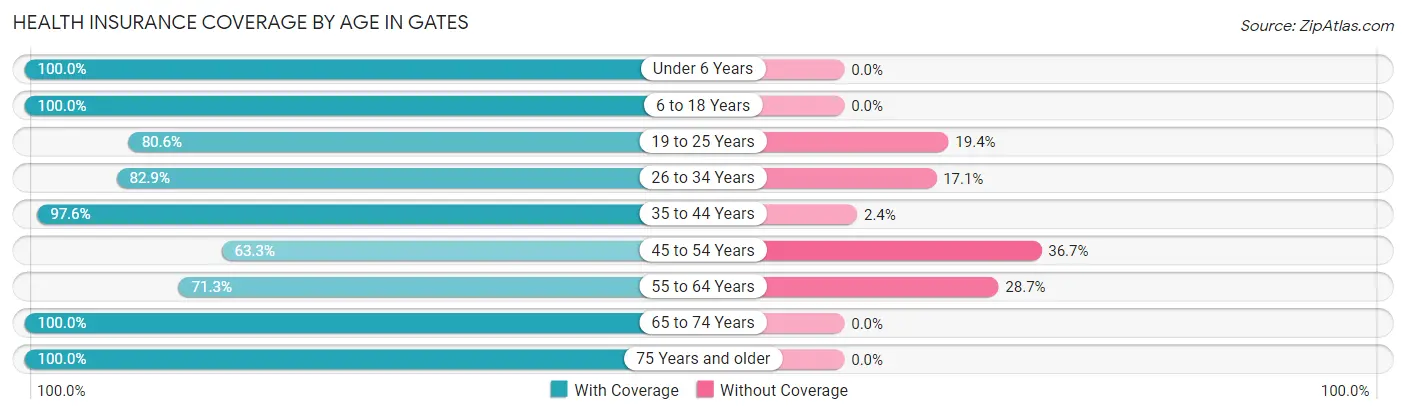
| Age Bracket | With Coverage | Without Coverage |
| Under 6 Years | 56 (100.0%) | 0 (0.0%) |
| 6 to 18 Years | 101 (100.0%) | 0 (0.0%) |
| 19 to 25 Years | 83 (80.6%) | 20 (19.4%) |
| 26 to 34 Years | 58 (82.9%) | 12 (17.1%) |
| 35 to 44 Years | 82 (97.6%) | 2 (2.4%) |
| 45 to 54 Years | 62 (63.3%) | 36 (36.7%) |
| 55 to 64 Years | 62 (71.3%) | 25 (28.7%) |
| 65 to 74 Years | 39 (100.0%) | 0 (0.0%) |
| 75 Years and older | 55 (100.0%) | 0 (0.0%) |
| Total | 598 (86.3%) | 95 (13.7%) |
Health Insurance Coverage by Citizenship Status in Gates
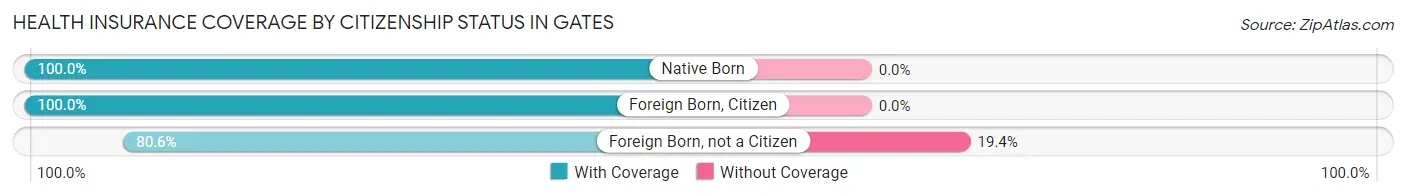
| Citizenship Status | With Coverage | Without Coverage |
| Native Born | 56 (100.0%) | 0 (0.0%) |
| Foreign Born, Citizen | 101 (100.0%) | 0 (0.0%) |
| Foreign Born, not a Citizen | 83 (80.6%) | 20 (19.4%) |
Health Insurance Coverage by Household Income in Gates
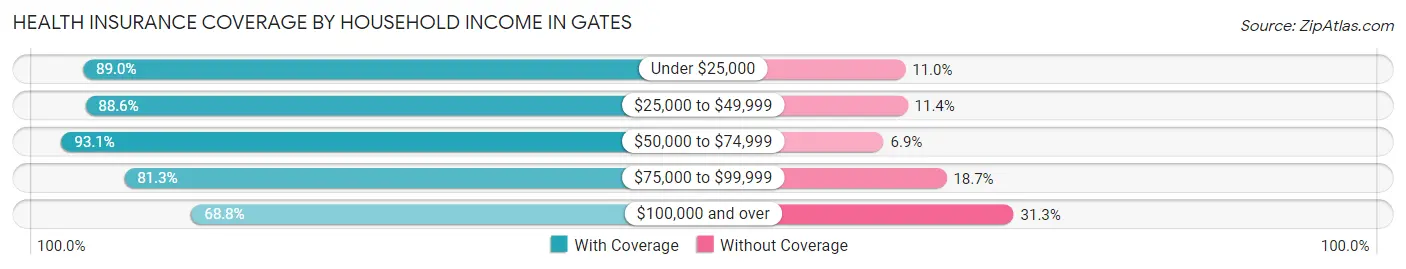
| Household Income | With Coverage | Without Coverage |
| Under $25,000 | 130 (89.0%) | 16 (11.0%) |
| $25,000 to $49,999 | 179 (88.6%) | 23 (11.4%) |
| $50,000 to $74,999 | 162 (93.1%) | 12 (6.9%) |
| $75,000 to $99,999 | 61 (81.3%) | 14 (18.7%) |
| $100,000 and over | 66 (68.8%) | 30 (31.2%) |
Public vs Private Health Insurance Coverage by Age in Gates
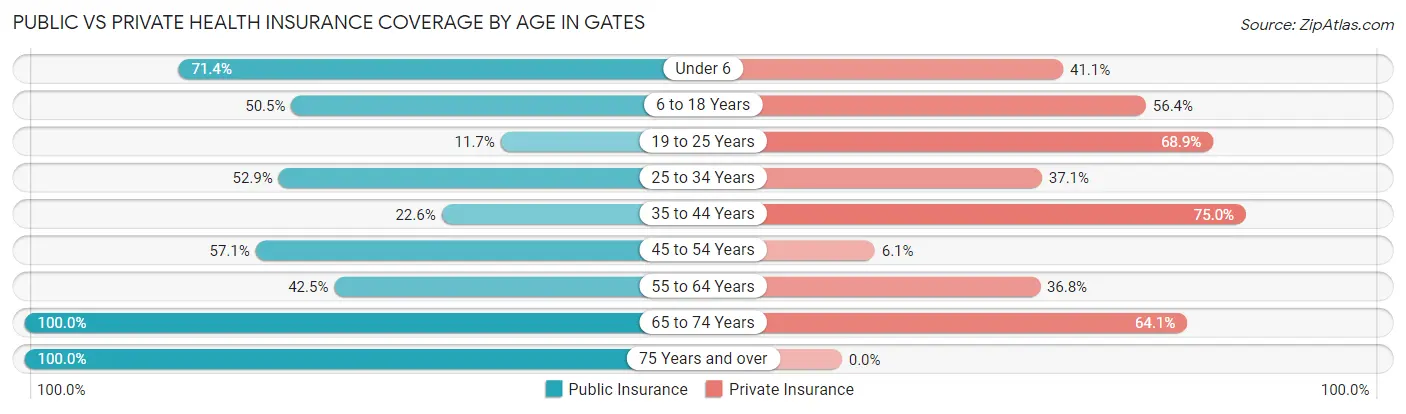
| Age Bracket | Public Insurance | Private Insurance |
| Under 6 | 40 (71.4%) | 23 (41.1%) |
| 6 to 18 Years | 51 (50.5%) | 57 (56.4%) |
| 19 to 25 Years | 12 (11.7%) | 71 (68.9%) |
| 25 to 34 Years | 37 (52.9%) | 26 (37.1%) |
| 35 to 44 Years | 19 (22.6%) | 63 (75.0%) |
| 45 to 54 Years | 56 (57.1%) | 6 (6.1%) |
| 55 to 64 Years | 37 (42.5%) | 32 (36.8%) |
| 65 to 74 Years | 39 (100.0%) | 25 (64.1%) |
| 75 Years and over | 55 (100.0%) | 0 (0.0%) |
| Total | 346 (49.9%) | 303 (43.7%) |
Disability Status by Sex by Age in Gates
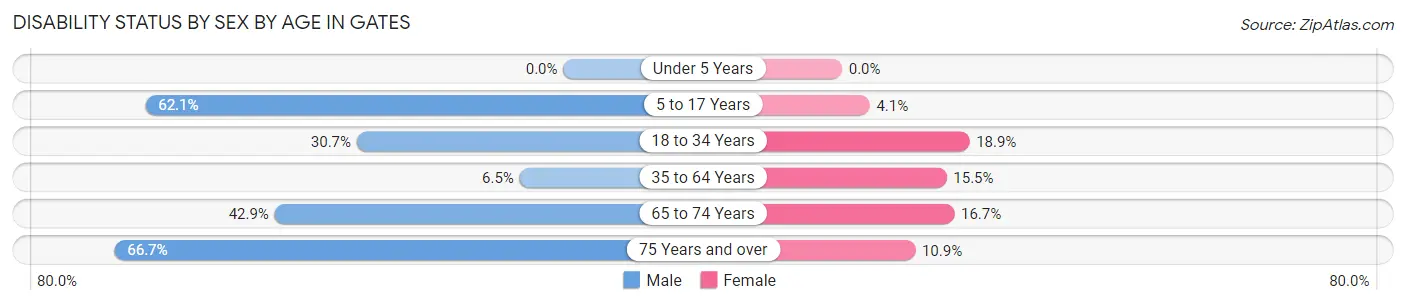
| Age Bracket | Male | Female |
| Under 5 Years | 0 (0.0%) | 0 (0.0%) |
| 5 to 17 Years | 18 (62.1%) | 3 (4.1%) |
| 18 to 34 Years | 42 (30.7%) | 7 (18.9%) |
| 35 to 64 Years | 7 (6.5%) | 25 (15.5%) |
| 65 to 74 Years | 9 (42.9%) | 3 (16.7%) |
| 75 Years and over | 6 (66.7%) | 5 (10.9%) |
Disability Class by Sex by Age in Gates
Disability Class: Hearing Difficulty
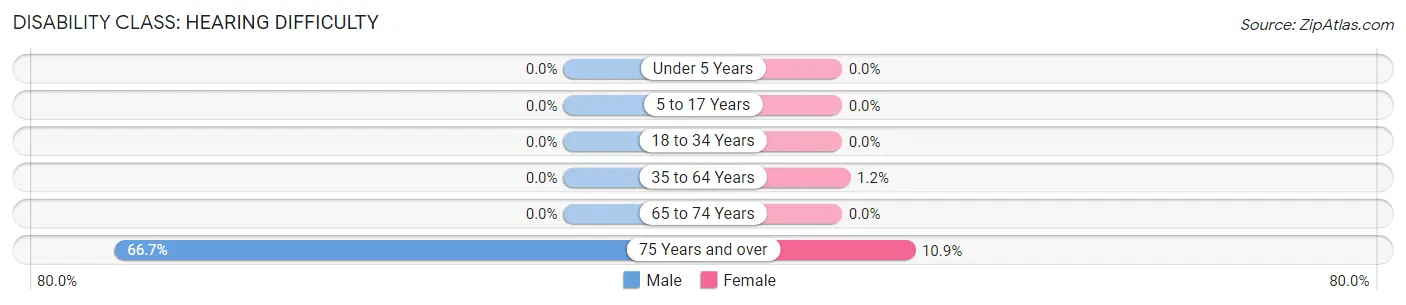
| Age Bracket | Male | Female |
| Under 5 Years | 0 (0.0%) | 0 (0.0%) |
| 5 to 17 Years | 0 (0.0%) | 0 (0.0%) |
| 18 to 34 Years | 0 (0.0%) | 0 (0.0%) |
| 35 to 64 Years | 0 (0.0%) | 2 (1.2%) |
| 65 to 74 Years | 0 (0.0%) | 0 (0.0%) |
| 75 Years and over | 6 (66.7%) | 5 (10.9%) |
Disability Class: Vision Difficulty
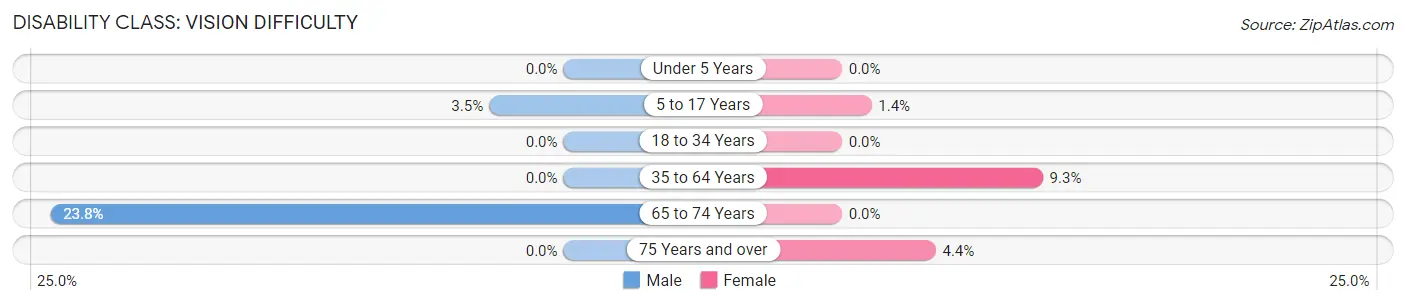
| Age Bracket | Male | Female |
| Under 5 Years | 0 (0.0%) | 0 (0.0%) |
| 5 to 17 Years | 1 (3.5%) | 1 (1.4%) |
| 18 to 34 Years | 0 (0.0%) | 0 (0.0%) |
| 35 to 64 Years | 0 (0.0%) | 15 (9.3%) |
| 65 to 74 Years | 5 (23.8%) | 0 (0.0%) |
| 75 Years and over | 0 (0.0%) | 2 (4.3%) |
Disability Class: Cognitive Difficulty
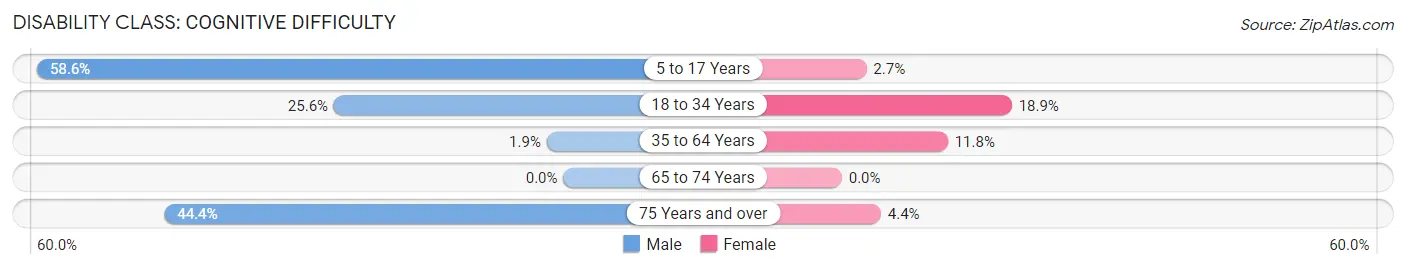
| Age Bracket | Male | Female |
| 5 to 17 Years | 17 (58.6%) | 2 (2.7%) |
| 18 to 34 Years | 35 (25.6%) | 7 (18.9%) |
| 35 to 64 Years | 2 (1.8%) | 19 (11.8%) |
| 65 to 74 Years | 0 (0.0%) | 0 (0.0%) |
| 75 Years and over | 4 (44.4%) | 2 (4.3%) |
Disability Class: Ambulatory Difficulty
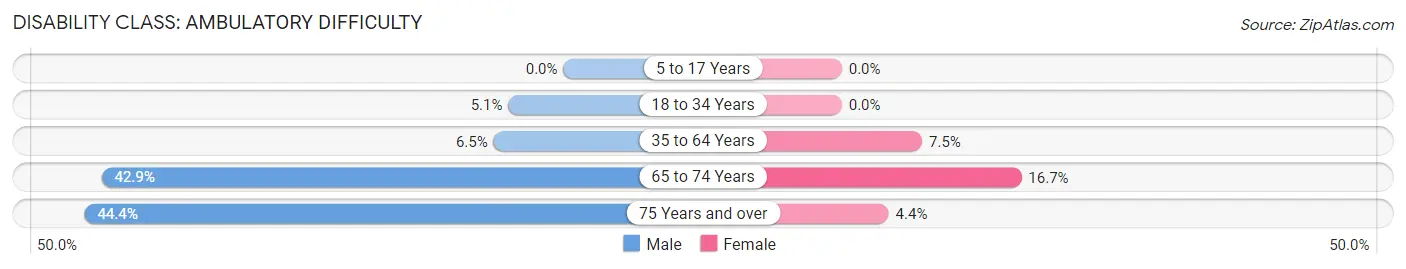
| Age Bracket | Male | Female |
| 5 to 17 Years | 0 (0.0%) | 0 (0.0%) |
| 18 to 34 Years | 7 (5.1%) | 0 (0.0%) |
| 35 to 64 Years | 7 (6.5%) | 12 (7.4%) |
| 65 to 74 Years | 9 (42.9%) | 3 (16.7%) |
| 75 Years and over | 4 (44.4%) | 2 (4.3%) |
Disability Class: Self-Care Difficulty
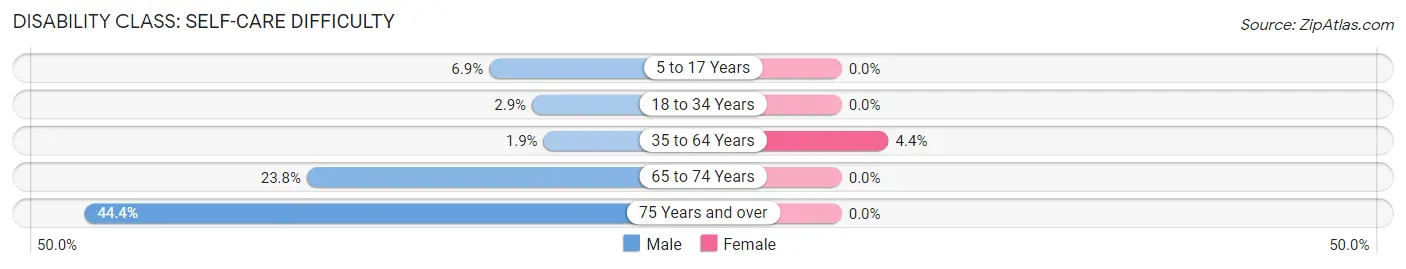
| Age Bracket | Male | Female |
| 5 to 17 Years | 2 (6.9%) | 0 (0.0%) |
| 18 to 34 Years | 4 (2.9%) | 0 (0.0%) |
| 35 to 64 Years | 2 (1.8%) | 7 (4.3%) |
| 65 to 74 Years | 5 (23.8%) | 0 (0.0%) |
| 75 Years and over | 4 (44.4%) | 0 (0.0%) |
Technology Access in Gates
Computing Device Access in Gates
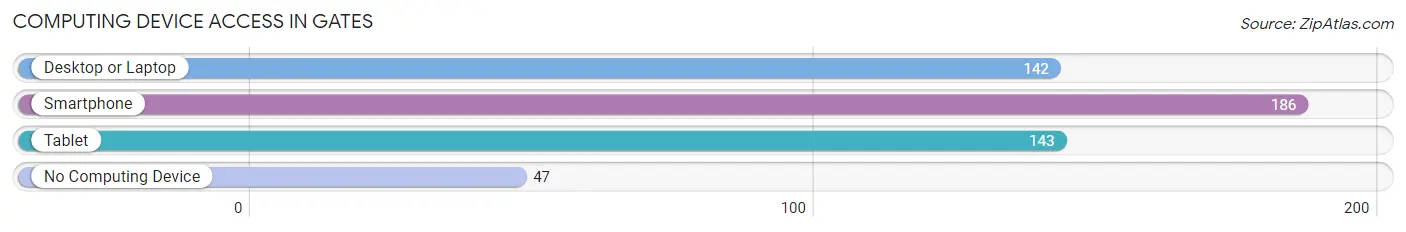
| Device Type | # Households | % Households |
| Desktop or Laptop | 142 | 58.9% |
| Smartphone | 186 | 77.2% |
| Tablet | 143 | 59.3% |
| No Computing Device | 47 | 19.5% |
| Total | 241 | 100.0% |
Internet Access in Gates
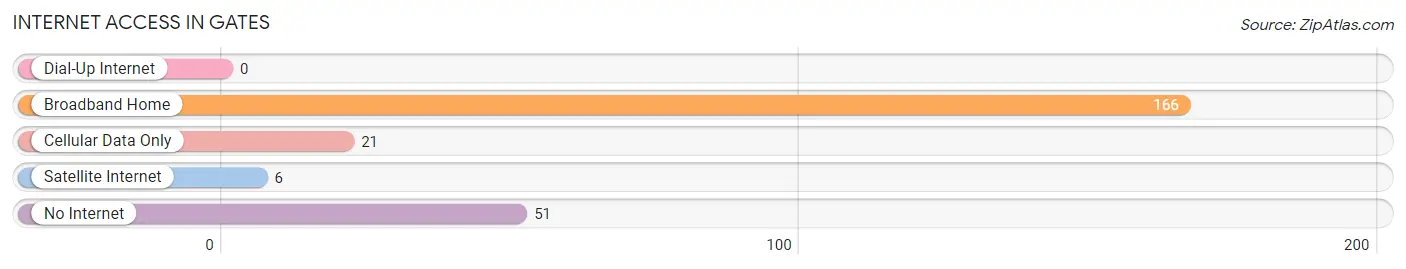
| Internet Type | # Households | % Households |
| Dial-Up Internet | 0 | 0.0% |
| Broadband Home | 166 | 68.9% |
| Cellular Data Only | 21 | 8.7% |
| Satellite Internet | 6 | 2.5% |
| No Internet | 51 | 21.2% |
| Total | 241 | 100.0% |
Gates Summary
Gates is a small town located in Lauderdale County, Tennessee. It is situated on the banks of the Tennessee River, approximately 20 miles north of the state capital of Nashville. The town has a population of just over 1,000 people and is part of the Memphis metropolitan area.
History
Gates was founded in 1820 by William Gates, a settler from North Carolina. The town was originally known as Gatesville, but the name was changed to Gates in 1871. The town was incorporated in 1875 and has remained relatively unchanged since then.
Gates was an important stop on the Memphis and Charleston Railroad, which ran through the town from 1857 to 1871. The railroad was a major factor in the town's growth and development.
Geography
Gates is located in Lauderdale County, Tennessee, approximately 20 miles north of the state capital of Nashville. The town is situated on the banks of the Tennessee River and is part of the Memphis metropolitan area. The town has a total area of 1.2 square miles, all of which is land.
Economy
Gates is a small, rural town with a limited economy. The town's main industries are agriculture and tourism. The town is home to several small businesses, including a grocery store, a hardware store, and a few restaurants.
Demographics
As of the 2010 census, Gates had a population of 1,072 people. The racial makeup of the town was 95.3% White, 2.2% African American, 0.3% Native American, 0.2% Asian, 0.1% Pacific Islander, 0.7% from other races, and 1.2% from two or more races. Hispanic or Latino of any race were 1.7% of the population.
The median income for a household in Gates was $30,938, and the median income for a family was $37,500. The per capita income for the town was $15,945. About 17.2% of families and 20.2% of the population were below the poverty line, including 28.3% of those under age 18 and 11.3% of those age 65 or over.
Common Questions
What is Per Capita Income in Gates?
Per Capita income in Gates is $19,543.
What is the Median Family Income in Gates?
Median Family Income in Gates is $39,241.
What is the Median Household income in Gates?
Median Household Income in Gates is $39,145.
What is Income or Wage Gap in Gates?
Income or Wage Gap in Gates is 14.3%.
Women in Gates earn 85.7 cents for every dollar earned by a man.
What is Inequality or Gini Index in Gates?
Inequality or Gini Index in Gates is 0.35.
What is the Total Population of Gates?
Total Population of Gates is 693.
What is the Total Male Population of Gates?
Total Male Population of Gates is 340.
What is the Total Female Population of Gates?
Total Female Population of Gates is 353.
What is the Ratio of Males per 100 Females in Gates?
There are 96.32 Males per 100 Females in Gates.
What is the Ratio of Females per 100 Males in Gates?
There are 103.82 Females per 100 Males in Gates.
What is the Median Population Age in Gates?
Median Population Age in Gates is 37.3 Years.
What is the Average Family Size in Gates
Average Family Size in Gates is 3.0 People.
What is the Average Household Size in Gates
Average Household Size in Gates is 2.9 People.
How Large is the Labor Force in Gates?
There are 276 People in the Labor Forcein in Gates.
What is the Percentage of People in the Labor Force in Gates?
48.9% of People are in the Labor Force in Gates.
What is the Unemployment Rate in Gates?
Unemployment Rate in Gates is 19.2%.