Waverly, TN Map & Demographics
Waverly Map
Waverly Overview
$29,611
PER CAPITA INCOME
$54,948
AVG FAMILY INCOME
$43,750
AVG HOUSEHOLD INCOME
44.7%
WAGE / INCOME GAP [ % ]
55.3¢/ $1
WAGE / INCOME GAP [ $ ]
0.41
INEQUALITY / GINI INDEX
4,284
TOTAL POPULATION
1,881
MALE POPULATION
2,403
FEMALE POPULATION
78.28
MALES / 100 FEMALES
127.75
FEMALES / 100 MALES
46.7
MEDIAN AGE
2.9
AVG FAMILY SIZE
2.2
AVG HOUSEHOLD SIZE
2,222
LABOR FORCE [ PEOPLE ]
57.5%
PERCENT IN LABOR FORCE
20.8%
UNEMPLOYMENT RATE
Waverly Zip Codes
Waverly Area Codes
Income in Waverly
Income Overview in Waverly
Per Capita Income in Waverly is $29,611, while median incomes of families and households are $54,948 and $43,750 respectively.
| Characteristic | Number | Measure |
| Per Capita Income | 4,284 | $29,611 |
| Median Family Income | 1,090 | $54,948 |
| Mean Family Income | 1,090 | $82,682 |
| Median Household Income | 1,861 | $43,750 |
| Mean Household Income | 1,861 | $63,479 |
| Income Deficit | 1,090 | $0 |
| Wage / Income Gap (%) | 4,284 | 44.70% |
| Wage / Income Gap ($) | 4,284 | 55.30¢ per $1 |
| Gini / Inequality Index | 4,284 | 0.41 |
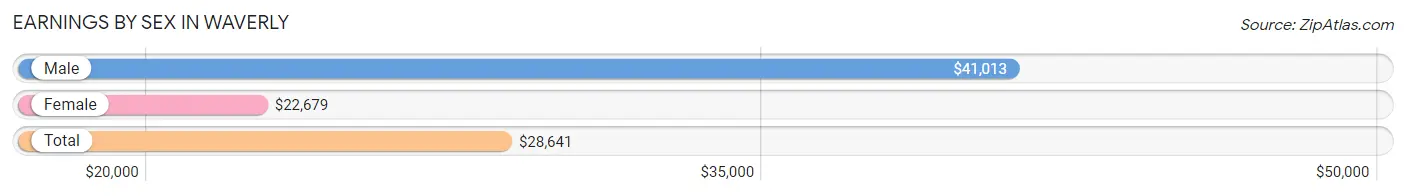
Earnings by Sex in Waverly
Average Earnings in Waverly are $28,641, $41,013 for men and $22,679 for women, a difference of 44.7%.
| Sex | Number | Average Earnings |
| Male | 1,037 (49.0%) | $41,013 |
| Female | 1,080 (51.0%) | $22,679 |
| Total | 2,117 (100.0%) | $28,641 |
Earnings by Sex by Income Bracket in Waverly
The most common earnings brackets in Waverly are $40,000 to $44,999 for men (275 | 26.5%) and $5,000 to $7,499 for women (225 | 20.8%).
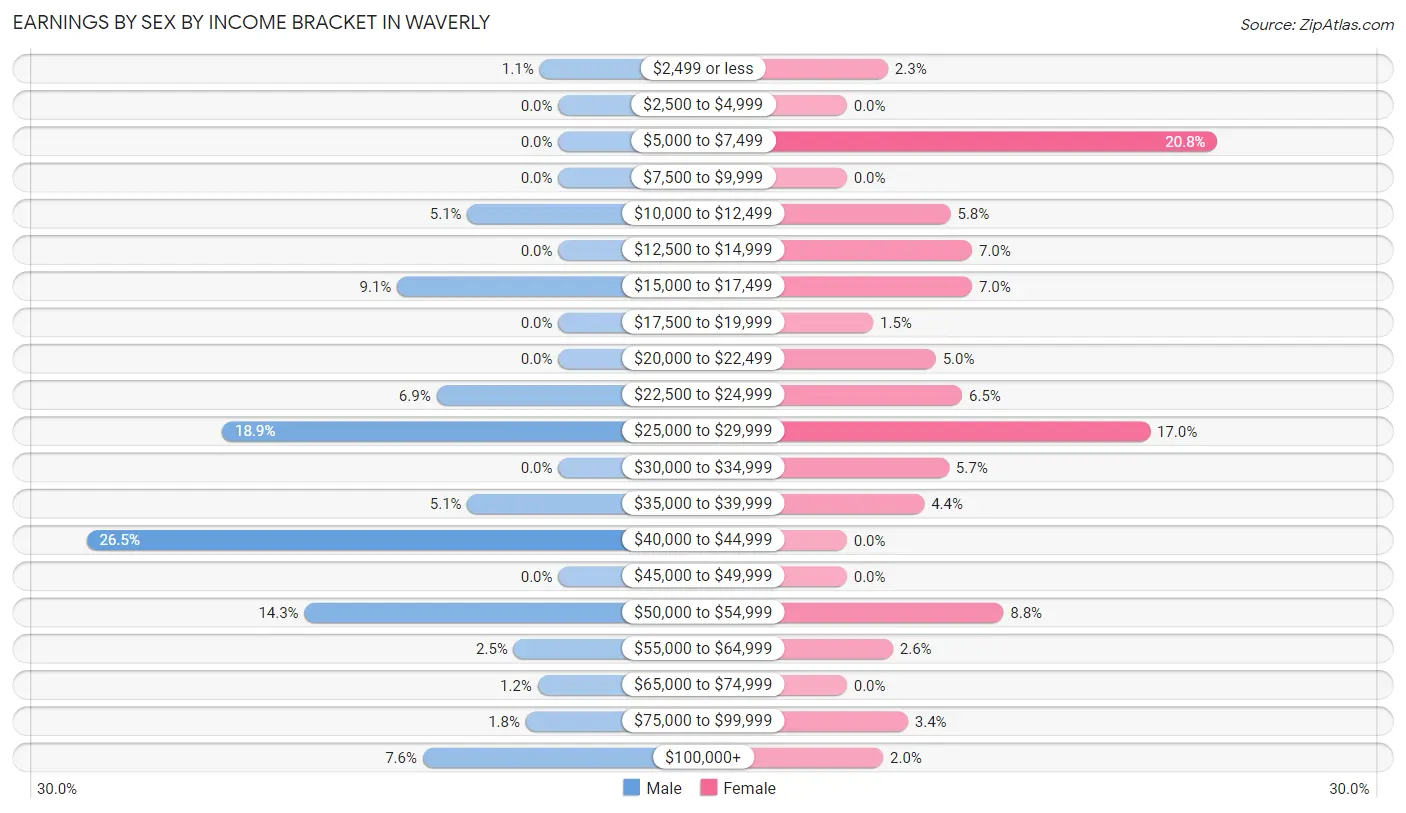
| Income | Male | Female |
| $2,499 or less | 11 (1.1%) | 25 (2.3%) |
| $2,500 to $4,999 | 0 (0.0%) | 0 (0.0%) |
| $5,000 to $7,499 | 0 (0.0%) | 225 (20.8%) |
| $7,500 to $9,999 | 0 (0.0%) | 0 (0.0%) |
| $10,000 to $12,499 | 53 (5.1%) | 63 (5.8%) |
| $12,500 to $14,999 | 0 (0.0%) | 76 (7.0%) |
| $15,000 to $17,499 | 94 (9.1%) | 76 (7.0%) |
| $17,500 to $19,999 | 0 (0.0%) | 16 (1.5%) |
| $20,000 to $22,499 | 0 (0.0%) | 54 (5.0%) |
| $22,500 to $24,999 | 71 (6.9%) | 70 (6.5%) |
| $25,000 to $29,999 | 196 (18.9%) | 184 (17.0%) |
| $30,000 to $34,999 | 0 (0.0%) | 62 (5.7%) |
| $35,000 to $39,999 | 53 (5.1%) | 47 (4.3%) |
| $40,000 to $44,999 | 275 (26.5%) | 0 (0.0%) |
| $45,000 to $49,999 | 0 (0.0%) | 0 (0.0%) |
| $50,000 to $54,999 | 148 (14.3%) | 95 (8.8%) |
| $55,000 to $64,999 | 26 (2.5%) | 28 (2.6%) |
| $65,000 to $74,999 | 12 (1.2%) | 0 (0.0%) |
| $75,000 to $99,999 | 19 (1.8%) | 37 (3.4%) |
| $100,000+ | 79 (7.6%) | 22 (2.0%) |
| Total | 1,037 (100.0%) | 1,080 (100.0%) |
Earnings by Sex by Educational Attainment in Waverly
Average earnings in Waverly are $42,857 for men and $24,482 for women, a difference of 42.9%. Men with an educational attainment of college or associate's degree enjoy the highest average annual earnings of $44,588, while those with high school diploma education earn the least with $41,863. Women with an educational attainment of high school diploma earn the most with the average annual earnings of $27,887, while those with college or associate's degree education have the smallest earnings of $21,250.
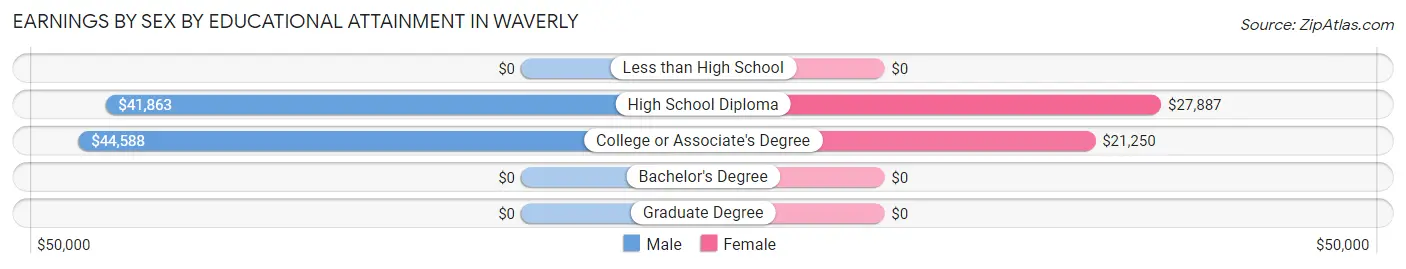
| Educational Attainment | Male Income | Female Income |
| Less than High School | - | - |
| High School Diploma | $41,863 | $27,887 |
| College or Associate's Degree | $44,588 | $21,250 |
| Bachelor's Degree | - | - |
| Graduate Degree | - | - |
| Total | $42,857 | $24,482 |
Family Income in Waverly
Family Income Brackets in Waverly
According to the Waverly family income data, there are 407 families falling into the $50,000 to $74,999 income range, which is the most common income bracket and makes up 37.3% of all families.
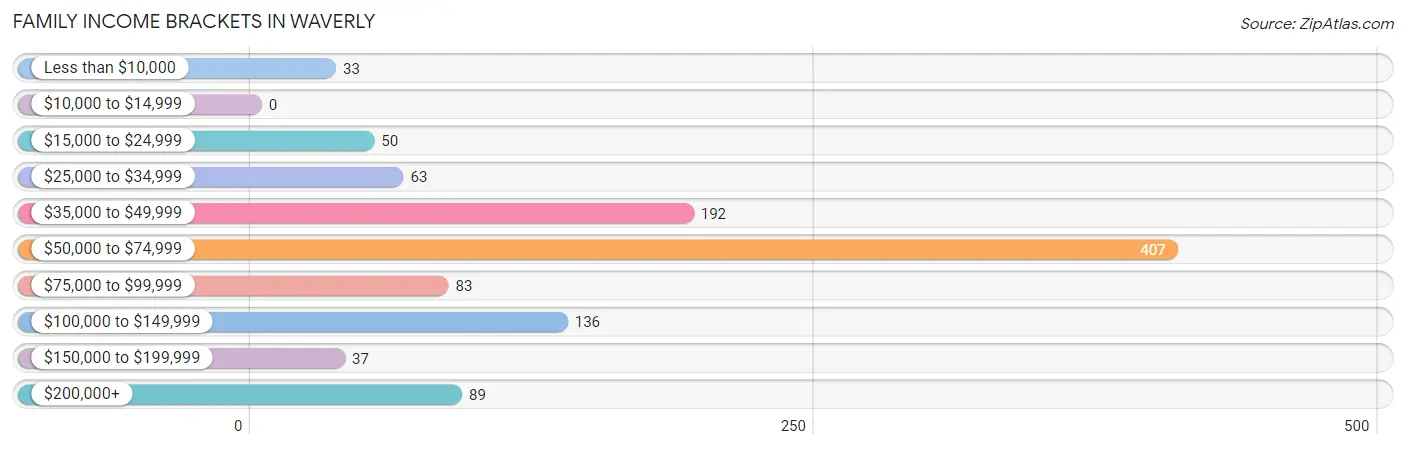
| Income Bracket | # Families | % Families |
| Less than $10,000 | 33 | 3.0% |
| $10,000 to $14,999 | 0 | 0.0% |
| $15,000 to $24,999 | 50 | 4.6% |
| $25,000 to $34,999 | 63 | 5.8% |
| $35,000 to $49,999 | 192 | 17.6% |
| $50,000 to $74,999 | 407 | 37.3% |
| $75,000 to $99,999 | 83 | 7.6% |
| $100,000 to $149,999 | 136 | 12.5% |
| $150,000 to $199,999 | 37 | 3.4% |
| $200,000+ | 89 | 8.2% |
Family Income by Famaliy Size in Waverly
3-person families (152 | 13.9%) account for the highest median family income in Waverly with $117,845 per family, while 3-person families (152 | 13.9%) have the highest median income of $39,282 per family member.
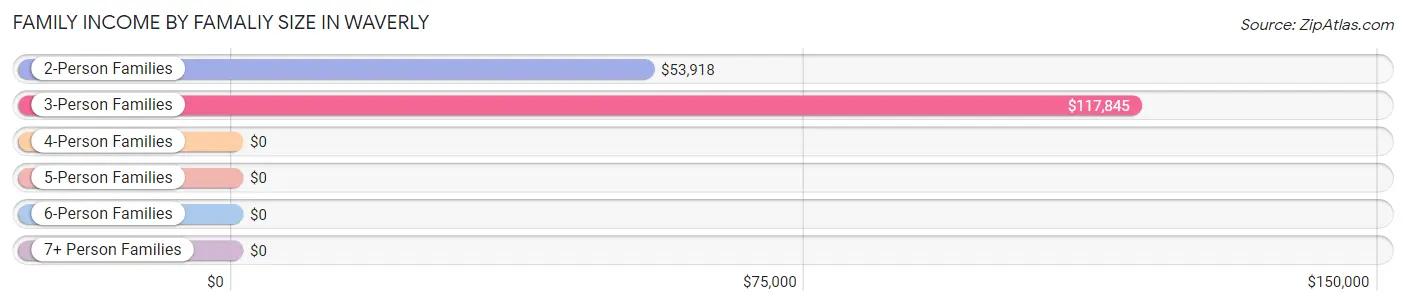
| Income Bracket | # Families | Median Income |
| 2-Person Families | 828 (76.0%) | $53,918 |
| 3-Person Families | 152 (13.9%) | $117,845 |
| 4-Person Families | 21 (1.9%) | $0 |
| 5-Person Families | 71 (6.5%) | $0 |
| 6-Person Families | 18 (1.7%) | $0 |
| 7+ Person Families | 0 (0.0%) | $0 |
| Total | 1,090 (100.0%) | $54,948 |
Family Income by Number of Earners in Waverly
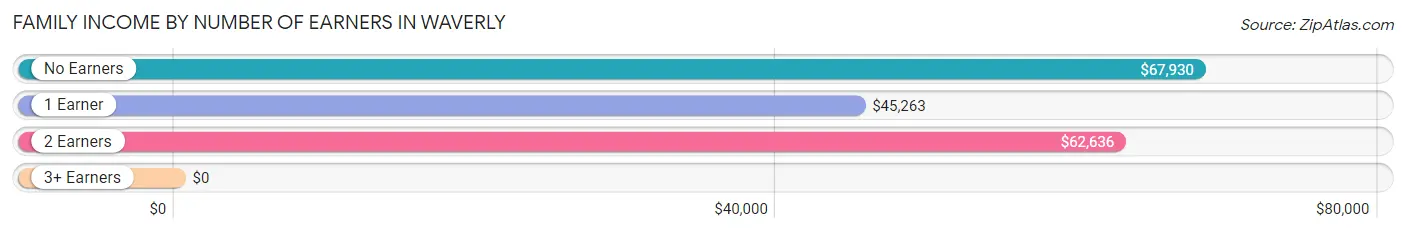
| Number of Earners | # Families | Median Income |
| No Earners | 219 (20.1%) | $67,930 |
| 1 Earner | 434 (39.8%) | $45,263 |
| 2 Earners | 388 (35.6%) | $62,636 |
| 3+ Earners | 49 (4.5%) | $0 |
| Total | 1,090 (100.0%) | $54,948 |
Household Income in Waverly
Household Income Brackets in Waverly
With 534 households falling in the category, the $35,000 to $49,999 income range is the most frequent in Waverly, accounting for 28.7% of all households. In contrast, only 22 households (1.2%) fall into the $10,000 to $14,999 income bracket, making it the least populous group.
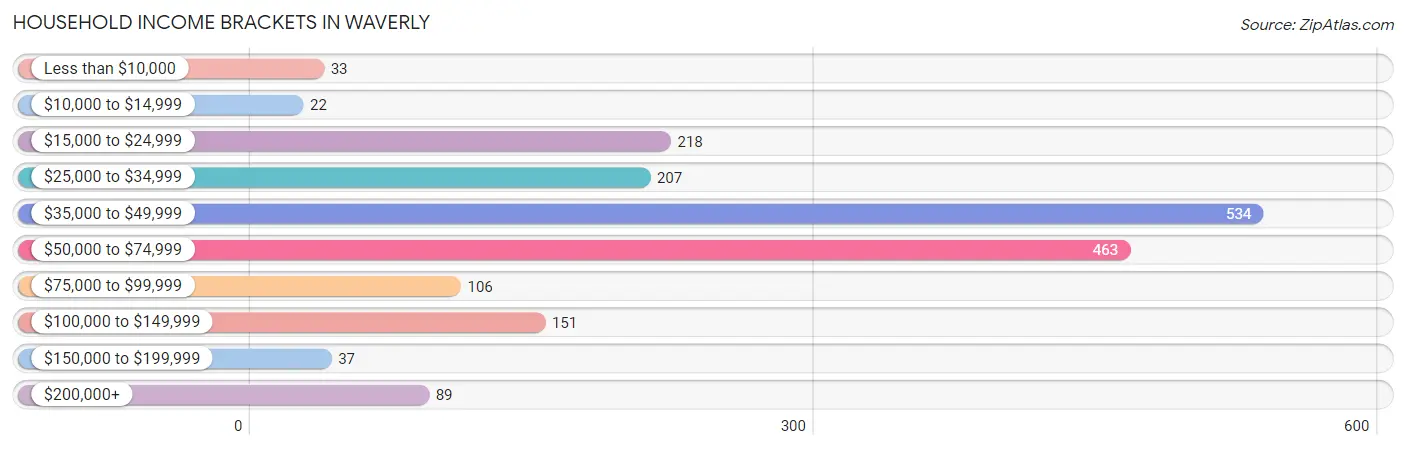
| Income Bracket | # Households | % Households |
| Less than $10,000 | 33 | 1.8% |
| $10,000 to $14,999 | 22 | 1.2% |
| $15,000 to $24,999 | 218 | 11.7% |
| $25,000 to $34,999 | 207 | 11.1% |
| $35,000 to $49,999 | 534 | 28.7% |
| $50,000 to $74,999 | 463 | 24.9% |
| $75,000 to $99,999 | 106 | 5.7% |
| $100,000 to $149,999 | 151 | 8.1% |
| $150,000 to $199,999 | 37 | 2.0% |
| $200,000+ | 89 | 4.8% |
Household Income by Householder Age in Waverly
The median household income in Waverly is $43,750, with the highest median household income of $53,853 found in the 25 to 44 years age bracket for the primary householder. A total of 501 households (26.9%) fall into this category. Meanwhile, the 15 to 24 years age bracket for the primary householder has the lowest median household income of $35,637, with 133 households (7.1%) in this group.
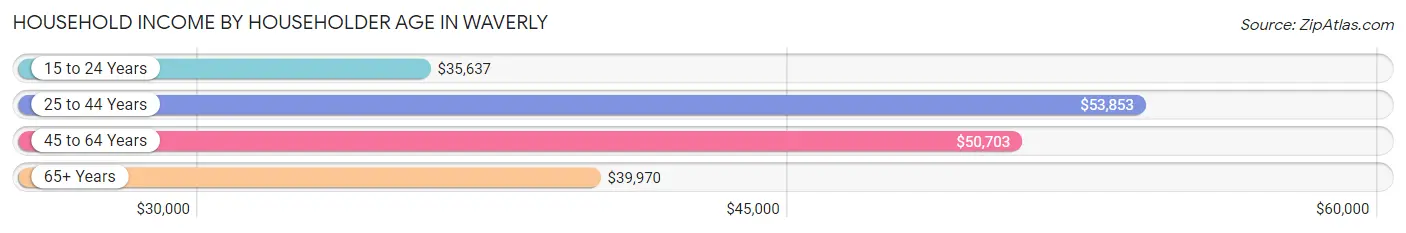
| Income Bracket | # Households | Median Income |
| 15 to 24 Years | 133 (7.1%) | $35,637 |
| 25 to 44 Years | 501 (26.9%) | $53,853 |
| 45 to 64 Years | 409 (22.0%) | $50,703 |
| 65+ Years | 818 (44.0%) | $39,970 |
| Total | 1,861 (100.0%) | $43,750 |
Poverty in Waverly
Income Below Poverty by Sex and Age in Waverly
With 16.2% poverty level for males and 8.4% for females among the residents of Waverly, under 5 year old males and 5 year old females are the most vulnerable to poverty, with 31 males (100.0%) and 16 females (100.0%) in their respective age groups living below the poverty level.
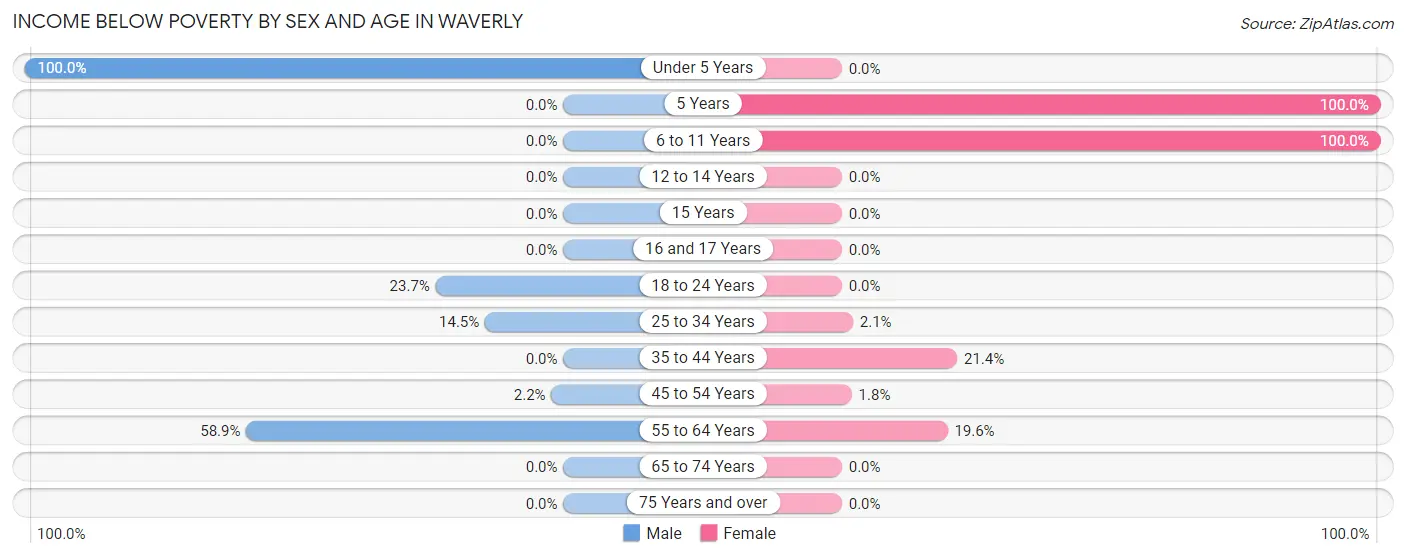
| Age Bracket | Male | Female |
| Under 5 Years | 31 (100.0%) | 0 (0.0%) |
| 5 Years | 0 (0.0%) | 16 (100.0%) |
| 6 to 11 Years | 0 (0.0%) | 15 (100.0%) |
| 12 to 14 Years | 0 (0.0%) | 0 (0.0%) |
| 15 Years | 0 (0.0%) | 0 (0.0%) |
| 16 and 17 Years | 0 (0.0%) | 0 (0.0%) |
| 18 to 24 Years | 64 (23.7%) | 0 (0.0%) |
| 25 to 34 Years | 61 (14.5%) | 5 (2.1%) |
| 35 to 44 Years | 0 (0.0%) | 74 (21.4%) |
| 45 to 54 Years | 4 (2.2%) | 4 (1.8%) |
| 55 to 64 Years | 133 (58.9%) | 81 (19.6%) |
| 65 to 74 Years | 0 (0.0%) | 0 (0.0%) |
| 75 Years and over | 0 (0.0%) | 0 (0.0%) |
| Total | 293 (16.2%) | 195 (8.4%) |
Income Above Poverty by Sex and Age in Waverly
According to the poverty statistics in Waverly, males aged 6 to 11 years and females aged under 5 years are the age groups that are most secure financially, with 100.0% of males and 100.0% of females in these age groups living above the poverty line.
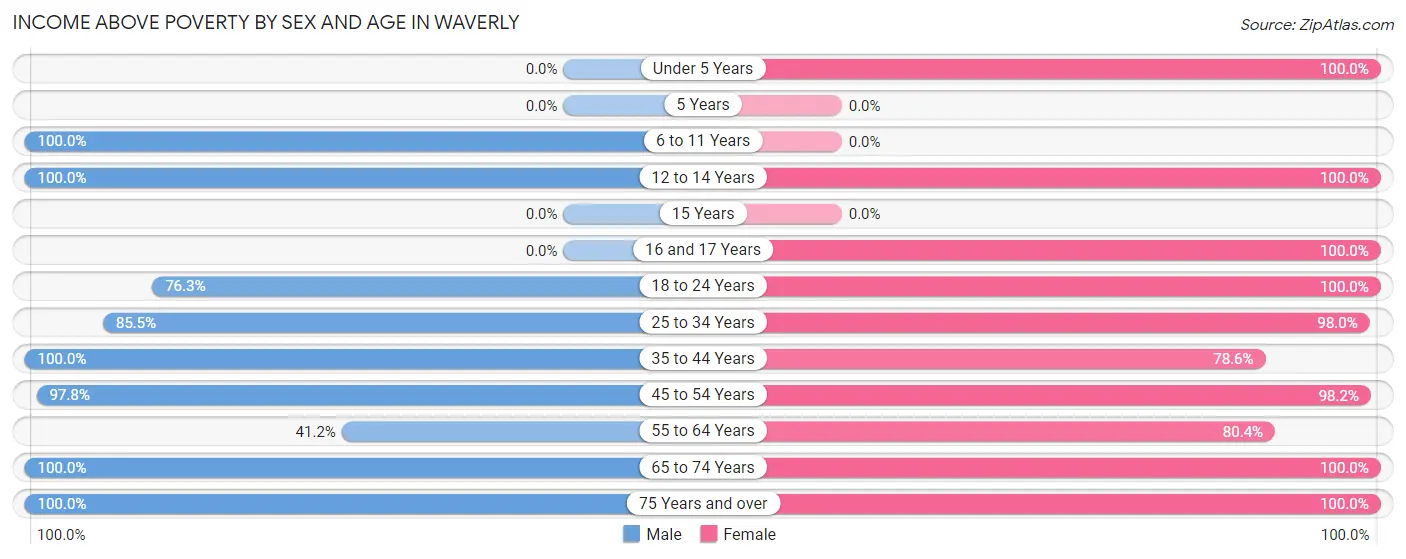
| Age Bracket | Male | Female |
| Under 5 Years | 0 (0.0%) | 192 (100.0%) |
| 5 Years | 0 (0.0%) | 0 (0.0%) |
| 6 to 11 Years | 100 (100.0%) | 0 (0.0%) |
| 12 to 14 Years | 37 (100.0%) | 29 (100.0%) |
| 15 Years | 0 (0.0%) | 0 (0.0%) |
| 16 and 17 Years | 0 (0.0%) | 25 (100.0%) |
| 18 to 24 Years | 206 (76.3%) | 133 (100.0%) |
| 25 to 34 Years | 359 (85.5%) | 239 (98.0%) |
| 35 to 44 Years | 126 (100.0%) | 272 (78.6%) |
| 45 to 54 Years | 177 (97.8%) | 214 (98.2%) |
| 55 to 64 Years | 93 (41.1%) | 332 (80.4%) |
| 65 to 74 Years | 200 (100.0%) | 369 (100.0%) |
| 75 Years and over | 217 (100.0%) | 332 (100.0%) |
| Total | 1,515 (83.8%) | 2,137 (91.6%) |
Income Below Poverty Among Married-Couple Families in Waverly
The poverty statistics for married-couple families in Waverly show that 2.6% or 18 of the total 688 families live below the poverty line. Families with 3 or 4 children have the highest poverty rate of 25.4%, comprising of 18 families. On the other hand, families with no children have the lowest poverty rate of 0.0%, which includes 0 families.
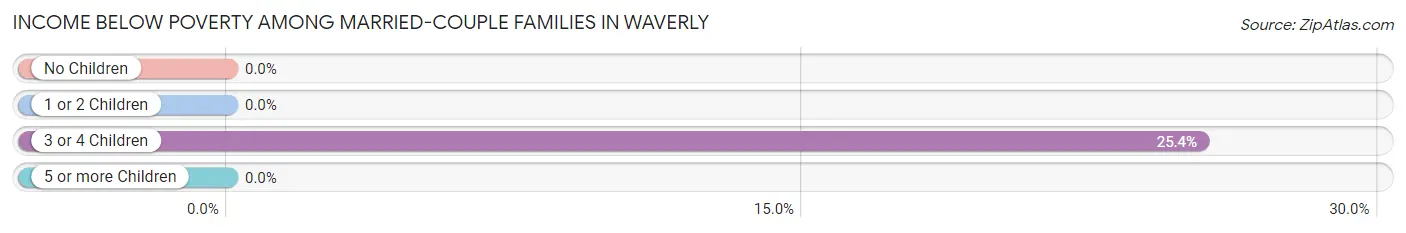
| Children | Above Poverty | Below Poverty |
| No Children | 545 (100.0%) | 0 (0.0%) |
| 1 or 2 Children | 72 (100.0%) | 0 (0.0%) |
| 3 or 4 Children | 53 (74.7%) | 18 (25.4%) |
| 5 or more Children | 0 (0.0%) | 0 (0.0%) |
| Total | 670 (97.4%) | 18 (2.6%) |
Income Below Poverty Among Single-Parent Households in Waverly
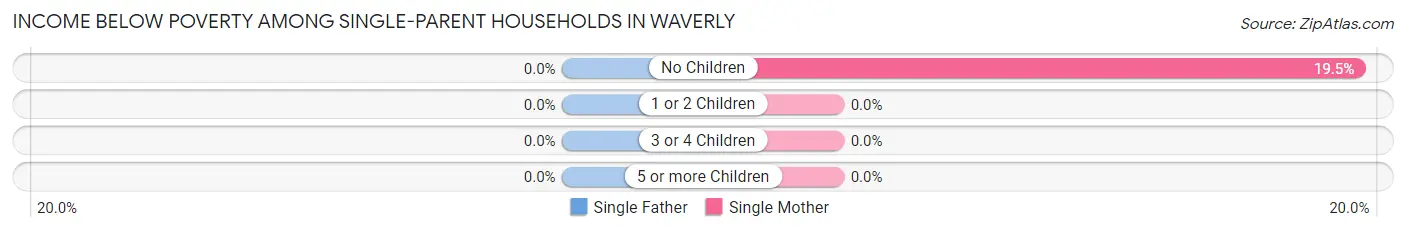
| Children | Single Father | Single Mother |
| No Children | 0 (0.0%) | 50 (19.5%) |
| 1 or 2 Children | 0 (0.0%) | 0 (0.0%) |
| 3 or 4 Children | 0 (0.0%) | 0 (0.0%) |
| 5 or more Children | 0 (0.0%) | 0 (0.0%) |
| Total | 0 (0.0%) | 50 (16.7%) |
Income Below Poverty Among Married-Couple vs Single-Parent Households in Waverly
The poverty data for Waverly shows that 18 of the married-couple family households (2.6%) and 50 of the single-parent households (12.4%) are living below the poverty level. Within the married-couple family households, those with 3 or 4 children have the highest poverty rate, with 18 households (25.4%) falling below the poverty line. Among the single-parent households, those with no children have the highest poverty rate, with 50 household (16.0%) living below poverty.
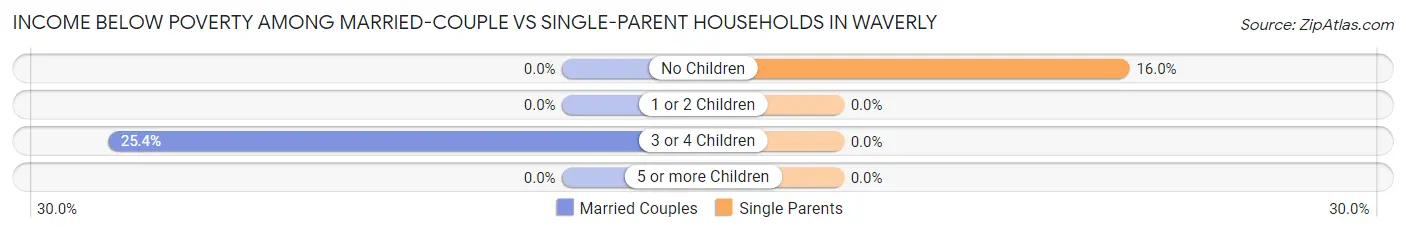
| Children | Married-Couple Families | Single-Parent Households |
| No Children | 0 (0.0%) | 50 (16.0%) |
| 1 or 2 Children | 0 (0.0%) | 0 (0.0%) |
| 3 or 4 Children | 18 (25.4%) | 0 (0.0%) |
| 5 or more Children | 0 (0.0%) | 0 (0.0%) |
| Total | 18 (2.6%) | 50 (12.4%) |
Race in Waverly
The most populous races in Waverly are White / Caucasian (3,975 | 92.8%), Two or more Races (224 | 5.2%), and Black / African American (83 | 1.9%).
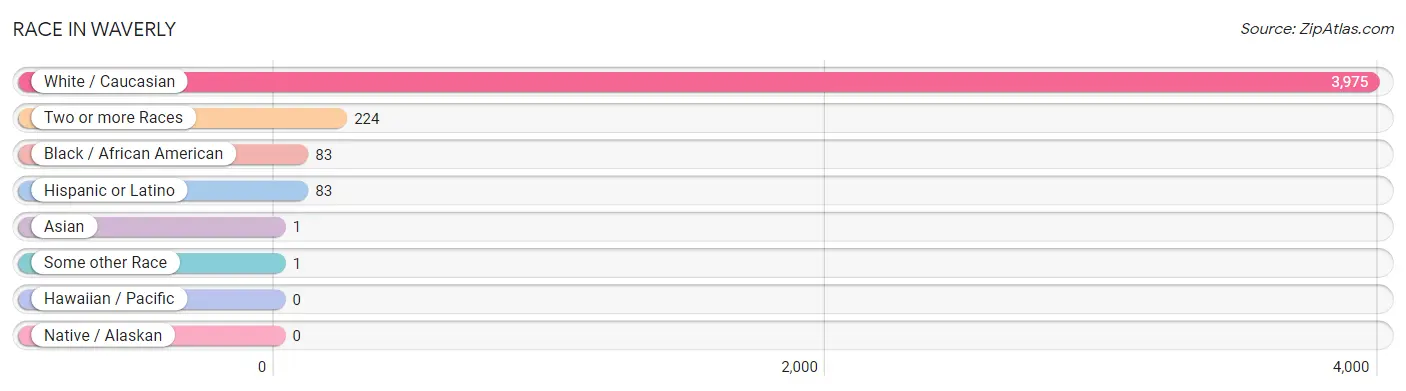
| Race | # Population | % Population |
| Asian | 1 | 0.0% |
| Black / African American | 83 | 1.9% |
| Hawaiian / Pacific | 0 | 0.0% |
| Hispanic or Latino | 83 | 1.9% |
| Native / Alaskan | 0 | 0.0% |
| White / Caucasian | 3,975 | 92.8% |
| Two or more Races | 224 | 5.2% |
| Some other Race | 1 | 0.0% |
| Total | 4,284 | 100.0% |
Ancestry in Waverly
The most populous ancestries reported in Waverly are American (791 | 18.5%), Irish (695 | 16.2%), German (337 | 7.9%), English (304 | 7.1%), and Scottish (194 | 4.5%), together accounting for 54.2% of all Waverly residents.
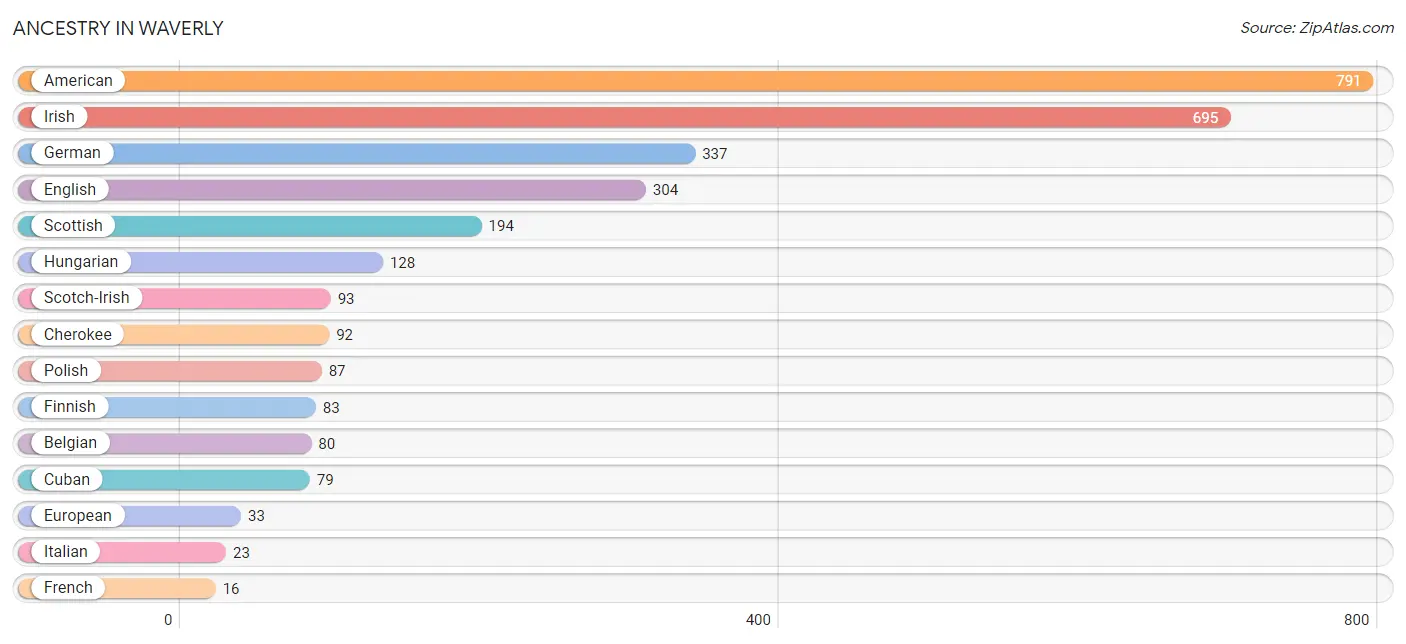
| Ancestry | # Population | % Population |
| American | 791 | 18.5% |
| Belgian | 80 | 1.9% |
| Bhutanese | 1 | 0.0% |
| Central American | 4 | 0.1% |
| Cherokee | 92 | 2.1% |
| Cuban | 79 | 1.8% |
| Dutch | 4 | 0.1% |
| English | 304 | 7.1% |
| European | 33 | 0.8% |
| Finnish | 83 | 1.9% |
| French | 16 | 0.4% |
| German | 337 | 7.9% |
| Haitian | 9 | 0.2% |
| Honduran | 4 | 0.1% |
| Hungarian | 128 | 3.0% |
| Irish | 695 | 16.2% |
| Italian | 23 | 0.5% |
| Polish | 87 | 2.0% |
| Scotch-Irish | 93 | 2.2% |
| Scottish | 194 | 4.5% |
| Welsh | 15 | 0.4% | View All 21 Rows |
Immigrants in Waverly
The most numerous immigrant groups reported in Waverly came from Europe (58 | 1.3%), Germany (58 | 1.3%), Western Europe (58 | 1.3%), and Canada (40 | 0.9%), together accounting for 5.0% of all Waverly residents.
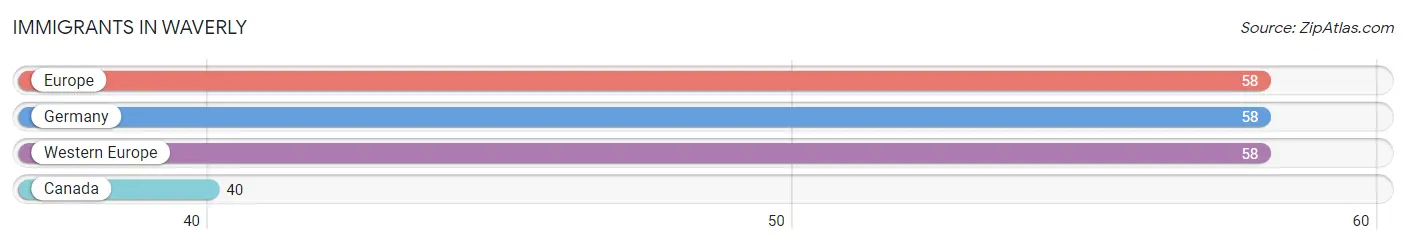
| Immigration Origin | # Population | % Population |
| Canada | 40 | 0.9% |
| Europe | 58 | 1.3% |
| Germany | 58 | 1.3% |
| Western Europe | 58 | 1.3% | View All 4 Rows |
Sex and Age in Waverly
Sex and Age in Waverly
The most populous age groups in Waverly are 25 to 29 Years (323 | 17.2%) for men and 65 to 69 Years (325 | 13.5%) for women.
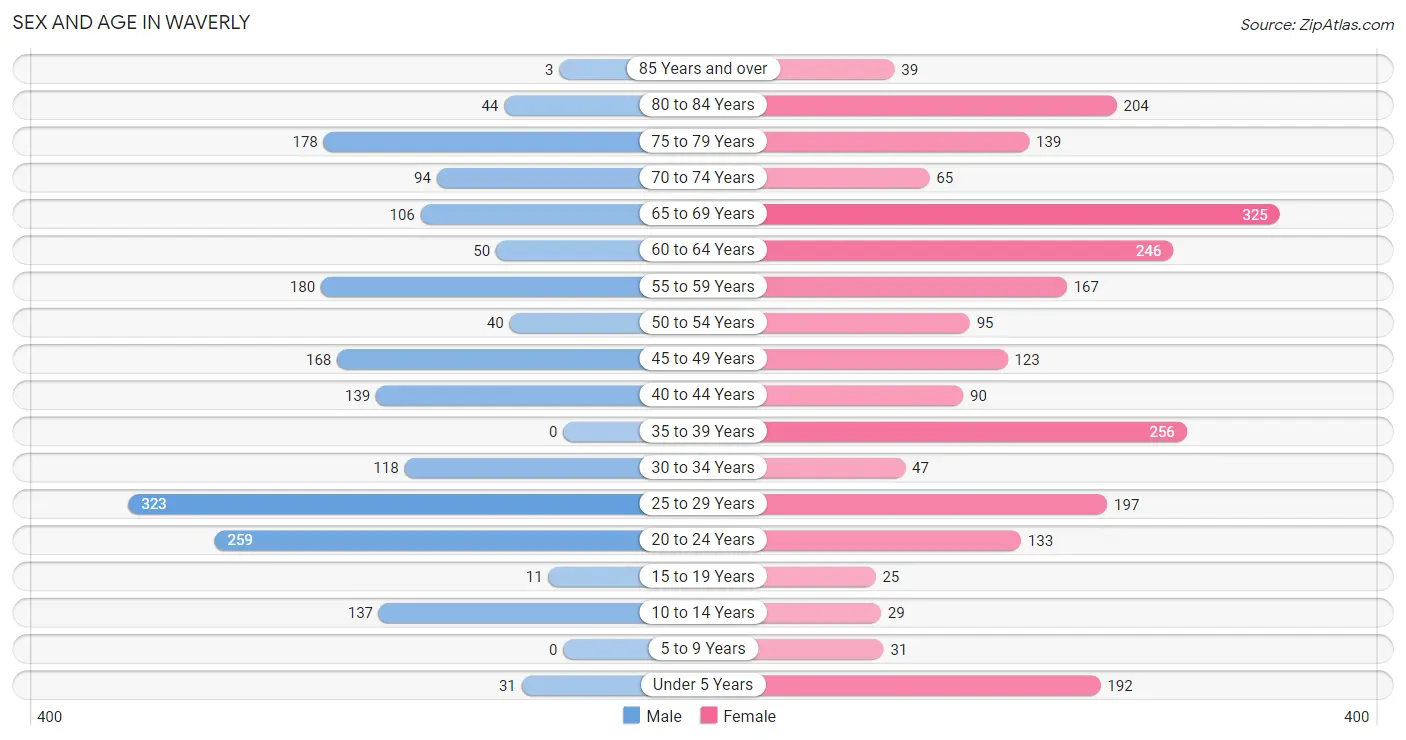
| Age Bracket | Male | Female |
| Under 5 Years | 31 (1.7%) | 192 (8.0%) |
| 5 to 9 Years | 0 (0.0%) | 31 (1.3%) |
| 10 to 14 Years | 137 (7.3%) | 29 (1.2%) |
| 15 to 19 Years | 11 (0.6%) | 25 (1.0%) |
| 20 to 24 Years | 259 (13.8%) | 133 (5.5%) |
| 25 to 29 Years | 323 (17.2%) | 197 (8.2%) |
| 30 to 34 Years | 118 (6.3%) | 47 (2.0%) |
| 35 to 39 Years | 0 (0.0%) | 256 (10.6%) |
| 40 to 44 Years | 139 (7.4%) | 90 (3.7%) |
| 45 to 49 Years | 168 (8.9%) | 123 (5.1%) |
| 50 to 54 Years | 40 (2.1%) | 95 (4.0%) |
| 55 to 59 Years | 180 (9.6%) | 167 (7.0%) |
| 60 to 64 Years | 50 (2.7%) | 246 (10.2%) |
| 65 to 69 Years | 106 (5.6%) | 325 (13.5%) |
| 70 to 74 Years | 94 (5.0%) | 65 (2.7%) |
| 75 to 79 Years | 178 (9.5%) | 139 (5.8%) |
| 80 to 84 Years | 44 (2.3%) | 204 (8.5%) |
| 85 Years and over | 3 (0.2%) | 39 (1.6%) |
| Total | 1,881 (100.0%) | 2,403 (100.0%) |
Families and Households in Waverly
Median Family Size in Waverly
The median family size in Waverly is 2.90 persons per family, with single female/mother families (299 | 27.4%) accounting for the largest median family size of 4.31 persons per family. On the other hand, married-couple families (688 | 63.1%) represent the smallest median family size with 2.30 persons per family.
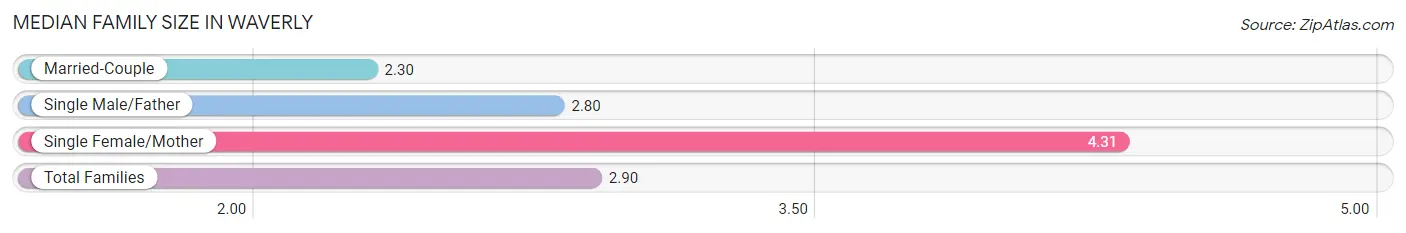
| Family Type | # Families | Family Size |
| Married-Couple | 688 (63.1%) | 2.30 |
| Single Male/Father | 103 (9.5%) | 2.80 |
| Single Female/Mother | 299 (27.4%) | 4.31 |
| Total Families | 1,090 (100.0%) | 2.90 |
Median Household Size in Waverly
The median household size in Waverly is 2.21 persons per household, with single female/mother households (299 | 16.1%) accounting for the largest median household size of 4.31 persons per household. non-family households (771 | 41.4%) represent the smallest median household size with 1.24 persons per household.
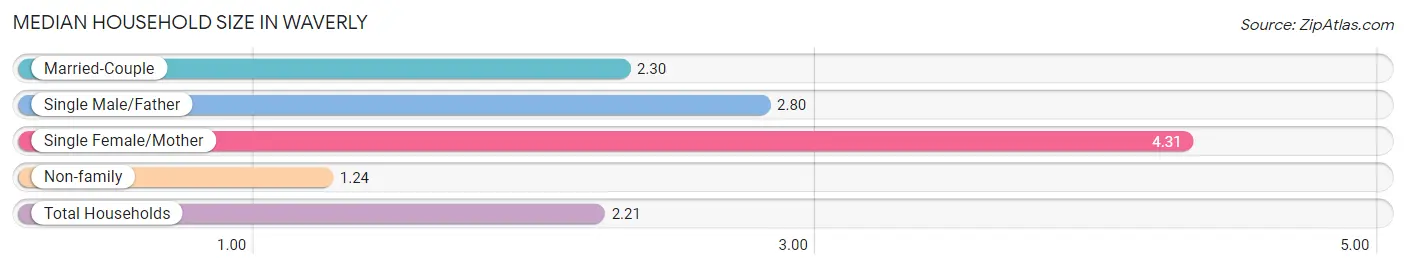
| Household Type | # Households | Household Size |
| Married-Couple | 688 (37.0%) | 2.30 |
| Single Male/Father | 103 (5.5%) | 2.80 |
| Single Female/Mother | 299 (16.1%) | 4.31 |
| Non-family | 771 (41.4%) | 1.24 |
| Total Households | 1,861 (100.0%) | 2.21 |
Household Size by Marriage Status in Waverly
Out of a total of 1,861 households in Waverly, 1,090 (58.6%) are family households, while 771 (41.4%) are nonfamily households. The most numerous type of family households are 2-person households, comprising 828, and the most common type of nonfamily households are 1-person households, comprising 687.
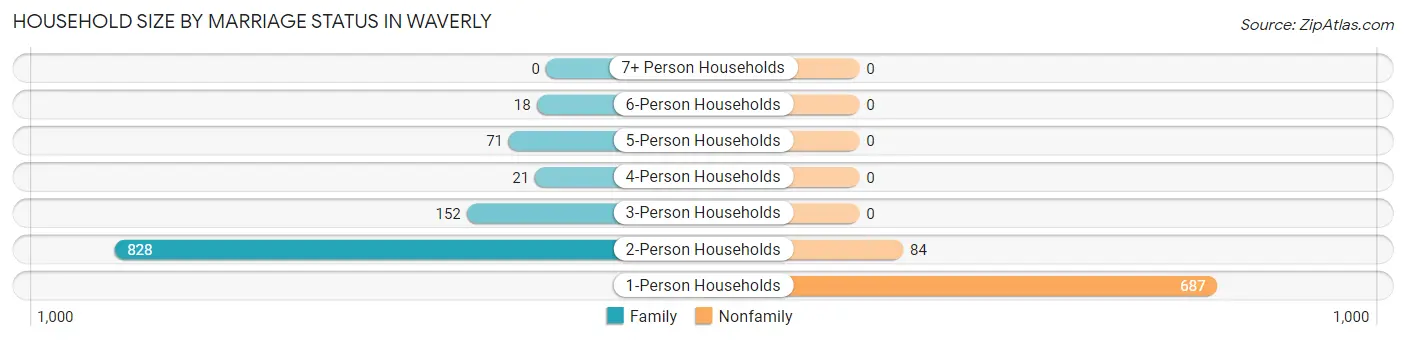
| Household Size | Family Households | Nonfamily Households |
| 1-Person Households | - | 687 (36.9%) |
| 2-Person Households | 828 (44.5%) | 84 (4.5%) |
| 3-Person Households | 152 (8.2%) | 0 (0.0%) |
| 4-Person Households | 21 (1.1%) | 0 (0.0%) |
| 5-Person Households | 71 (3.8%) | 0 (0.0%) |
| 6-Person Households | 18 (1.0%) | 0 (0.0%) |
| 7+ Person Households | 0 (0.0%) | 0 (0.0%) |
| Total | 1,090 (58.6%) | 771 (41.4%) |
Female Fertility in Waverly
Fertility by Age in Waverly
Average fertility rate in Waverly is 67.0 births per 1,000 women. Women in the age bracket of 20 to 34 years have the highest fertility rate with 154.0 births per 1,000 women. Women in the age bracket of 20 to 34 years acount for 100.0% of all women with births.
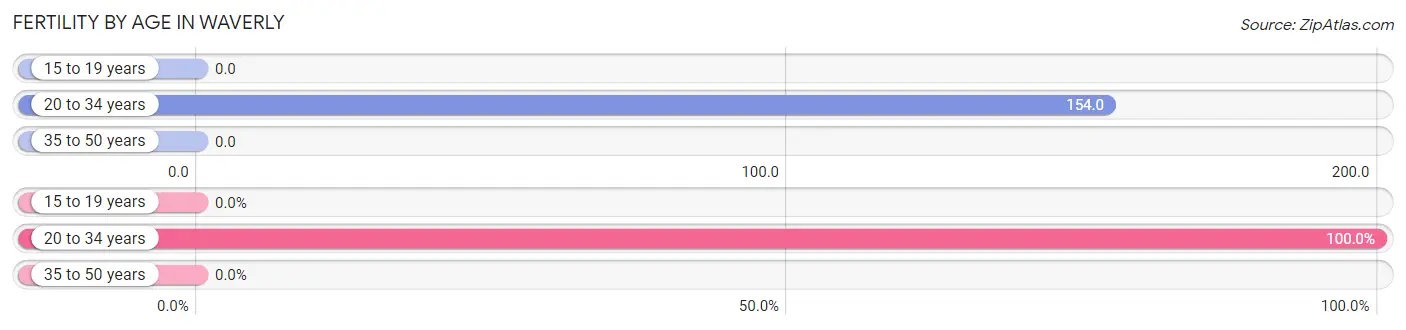
| Age Bracket | Women with Births | Births / 1,000 Women |
| 15 to 19 years | 0 (0.0%) | 0.0 |
| 20 to 34 years | 58 (100.0%) | 154.0 |
| 35 to 50 years | 0 (0.0%) | 0.0 |
| Total | 58 (100.0%) | 67.0 |
Fertility by Age by Marriage Status in Waverly
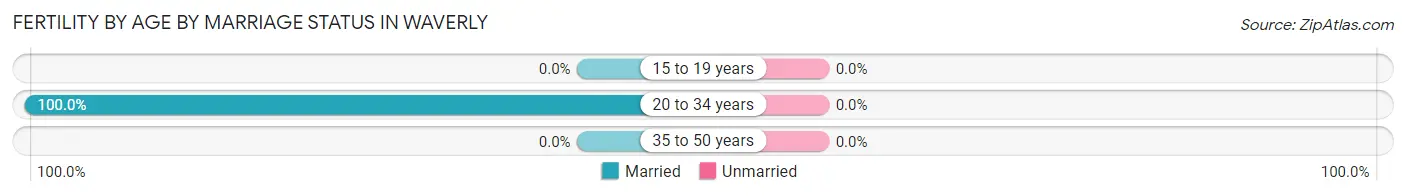
| Age Bracket | Married | Unmarried |
| 15 to 19 years | 0 (0.0%) | 0 (0.0%) |
| 20 to 34 years | 58 (100.0%) | 0 (0.0%) |
| 35 to 50 years | 0 (0.0%) | 0 (0.0%) |
| Total | 58 (100.0%) | 0 (0.0%) |
Fertility by Education in Waverly
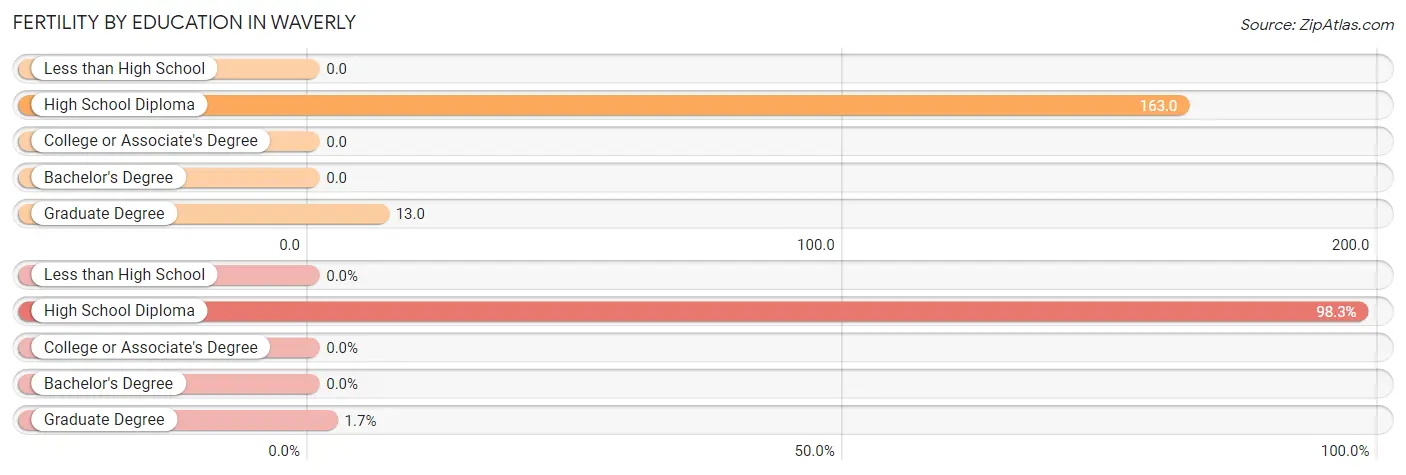
| Educational Attainment | Women with Births | Births / 1,000 Women |
| Less than High School | 0 (0.0%) | 0.0 |
| High School Diploma | 57 (98.3%) | 163.0 |
| College or Associate's Degree | 0 (0.0%) | 0.0 |
| Bachelor's Degree | 0 (0.0%) | 0.0 |
| Graduate Degree | 1 (1.7%) | 13.0 |
| Total | 58 (100.0%) | 67.0 |
Fertility by Education by Marriage Status in Waverly
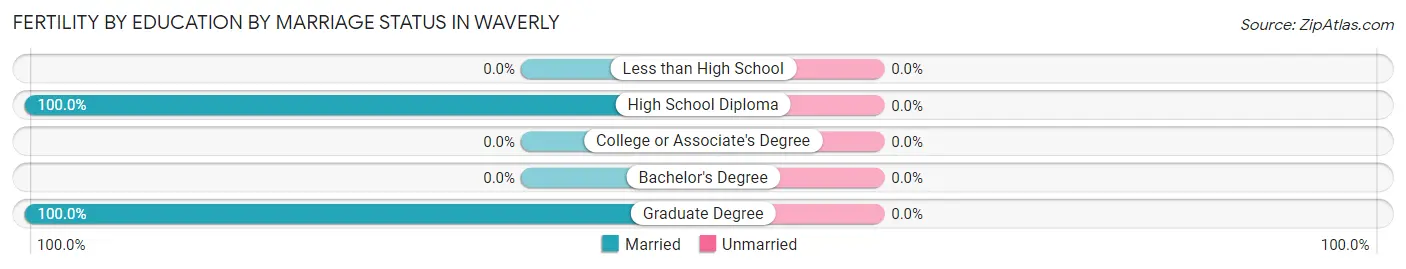
| Educational Attainment | Married | Unmarried |
| Less than High School | 0 (0.0%) | 0 (0.0%) |
| High School Diploma | 57 (100.0%) | 0 (0.0%) |
| College or Associate's Degree | 0 (0.0%) | 0 (0.0%) |
| Bachelor's Degree | 0 (0.0%) | 0 (0.0%) |
| Graduate Degree | 1 (100.0%) | 0 (0.0%) |
| Total | 58 (100.0%) | 0 (0.0%) |
Employment Characteristics in Waverly
Employment by Class of Employer in Waverly
Among the 1,761 employed individuals in Waverly, private company employees (1,155 | 65.6%), self-employed (not incorporated) (208 | 11.8%), and not-for-profit organizations (185 | 10.5%) make up the most common classes of employment.
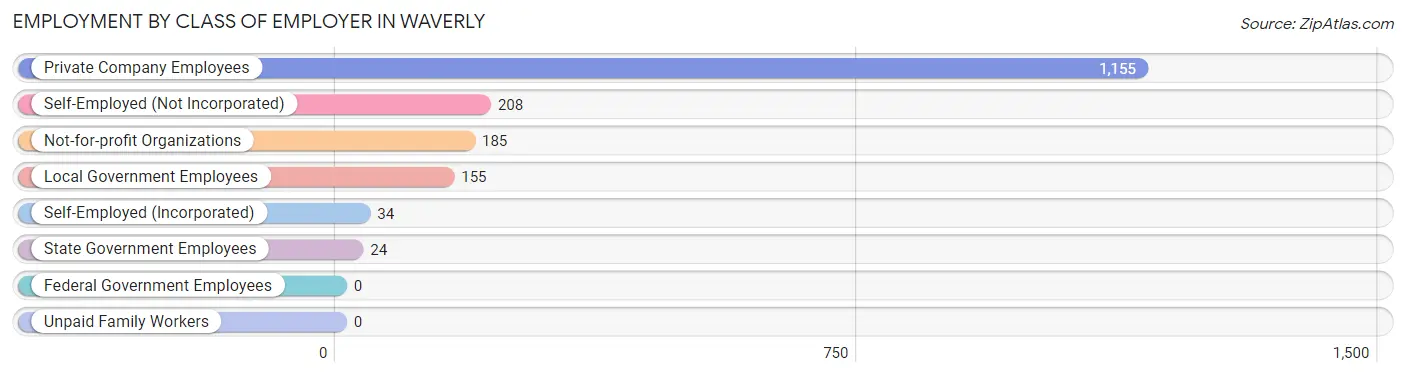
| Employer Class | # Employees | % Employees |
| Private Company Employees | 1,155 | 65.6% |
| Self-Employed (Incorporated) | 34 | 1.9% |
| Self-Employed (Not Incorporated) | 208 | 11.8% |
| Not-for-profit Organizations | 185 | 10.5% |
| Local Government Employees | 155 | 8.8% |
| State Government Employees | 24 | 1.4% |
| Federal Government Employees | 0 | 0.0% |
| Unpaid Family Workers | 0 | 0.0% |
| Total | 1,761 | 100.0% |
Employment Status by Age in Waverly
According to the labor force statistics for Waverly, out of the total population over 16 years of age (3,864), 57.5% or 2,222 individuals are in the labor force, with 20.8% or 462 of them unemployed. The age group with the highest labor force participation rate is 30 to 34 years, with 100.0% or 165 individuals in the labor force. Within the labor force, the 55 to 59 years age range has the highest percentage of unemployed individuals, with 74.7% or 71 of them being unemployed.
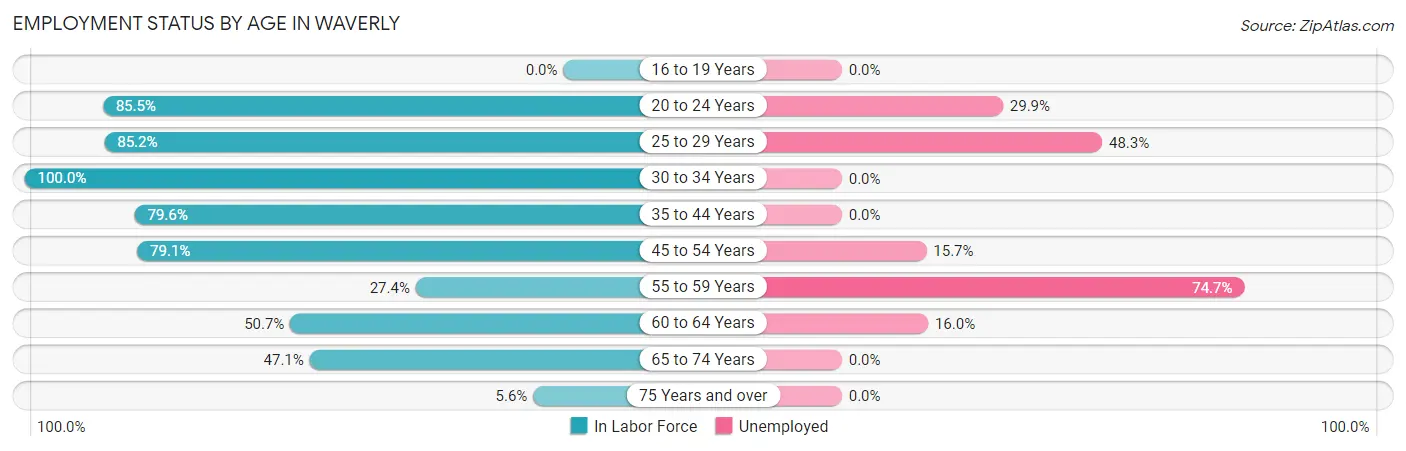
| Age Bracket | In Labor Force | Unemployed |
| 16 to 19 Years | 0 (0.0%) | 0 (0.0%) |
| 20 to 24 Years | 335 (85.5%) | 100 (29.9%) |
| 25 to 29 Years | 443 (85.2%) | 214 (48.3%) |
| 30 to 34 Years | 165 (100.0%) | 0 (0.0%) |
| 35 to 44 Years | 386 (79.6%) | 0 (0.0%) |
| 45 to 54 Years | 337 (79.1%) | 53 (15.7%) |
| 55 to 59 Years | 95 (27.4%) | 71 (74.7%) |
| 60 to 64 Years | 150 (50.7%) | 24 (16.0%) |
| 65 to 74 Years | 278 (47.1%) | 0 (0.0%) |
| 75 Years and over | 34 (5.6%) | 0 (0.0%) |
| Total | 2,222 (57.5%) | 462 (20.8%) |
Employment Status by Educational Attainment in Waverly
According to labor force statistics for Waverly, 70.4% of individuals (1,576) out of the total population between 25 and 64 years of age (2,239) are in the labor force, with 23.0% or 362 of them being unemployed. The group with the highest labor force participation rate are those with the educational attainment of bachelor's degree or higher, with 93.3% or 378 individuals in the labor force. Within the labor force, individuals with high school diploma education have the highest percentage of unemployment, with 39.8% or 249 of them being unemployed.
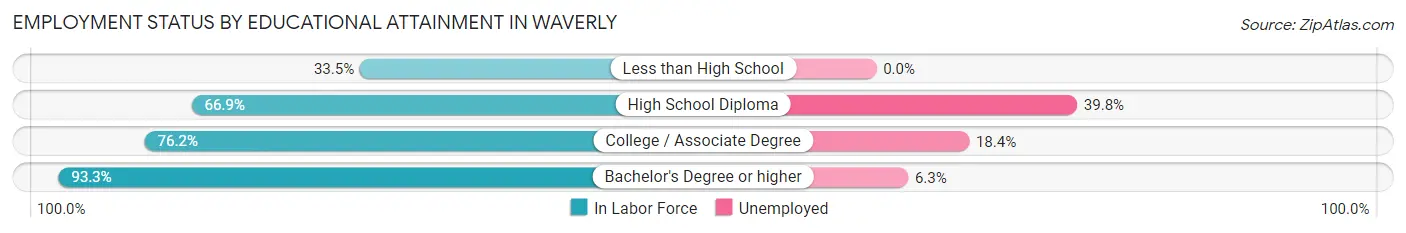
| Educational Attainment | In Labor Force | Unemployed |
| Less than High School | 88 (33.5%) | 0 (0.0%) |
| High School Diploma | 626 (66.9%) | 373 (39.8%) |
| College / Associate Degree | 484 (76.2%) | 117 (18.4%) |
| Bachelor's Degree or higher | 378 (93.3%) | 26 (6.3%) |
| Total | 1,576 (70.4%) | 515 (23.0%) |
Employment Occupations by Sex in Waverly
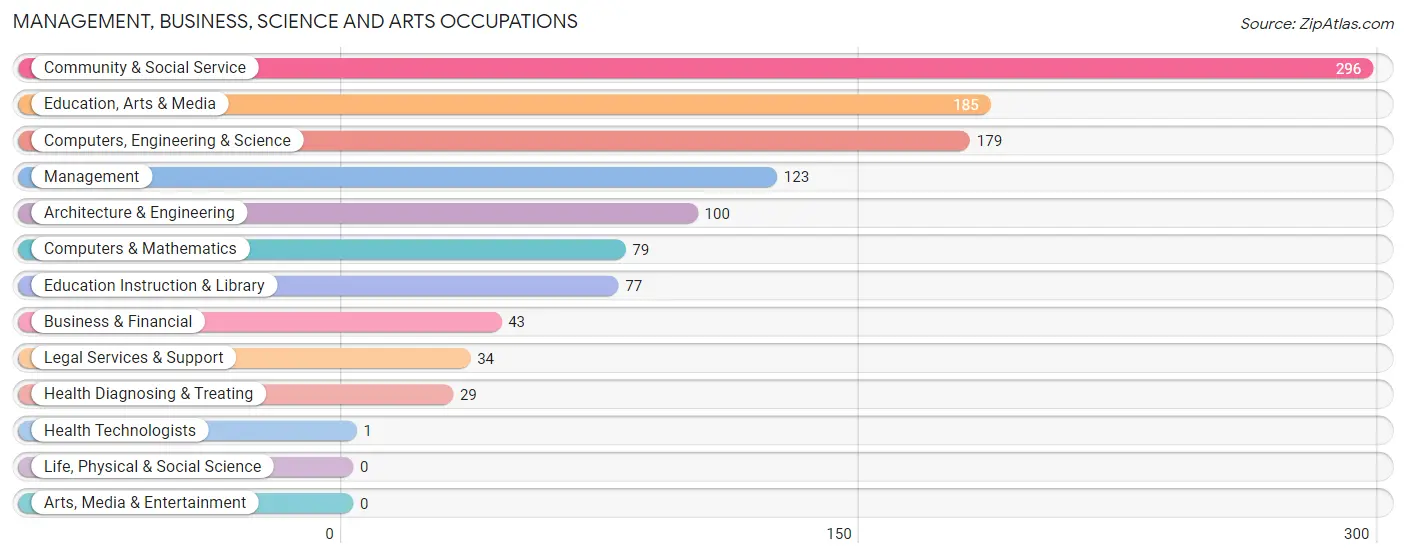
Management, Business, Science and Arts Occupations
The most common Management, Business, Science and Arts occupations in Waverly are Community & Social Service (296 | 16.8%), Education, Arts & Media (185 | 10.5%), Computers, Engineering & Science (179 | 10.2%), Management (123 | 7.0%), and Architecture & Engineering (100 | 5.7%).
Management, Business, Science and Arts Occupations by Sex
Within the Management, Business, Science and Arts occupations in Waverly, the most male-oriented occupations are Business & Financial (100.0%), Computers & Mathematics (100.0%), and Legal Services & Support (100.0%), while the most female-oriented occupations are Education, Arts & Media (100.0%), Education Instruction & Library (100.0%), and Health Diagnosing & Treating (100.0%).
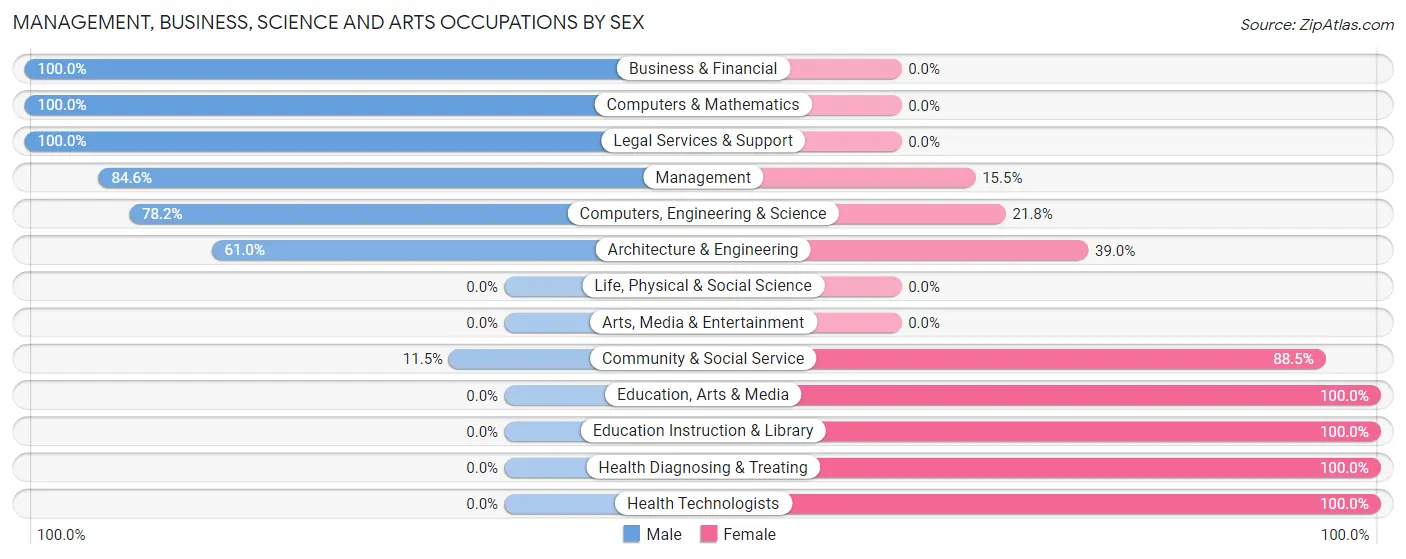
| Occupation | Male | Female |
| Management | 104 (84.6%) | 19 (15.4%) |
| Business & Financial | 43 (100.0%) | 0 (0.0%) |
| Computers, Engineering & Science | 140 (78.2%) | 39 (21.8%) |
| Computers & Mathematics | 79 (100.0%) | 0 (0.0%) |
| Architecture & Engineering | 61 (61.0%) | 39 (39.0%) |
| Life, Physical & Social Science | 0 (0.0%) | 0 (0.0%) |
| Community & Social Service | 34 (11.5%) | 262 (88.5%) |
| Education, Arts & Media | 0 (0.0%) | 185 (100.0%) |
| Legal Services & Support | 34 (100.0%) | 0 (0.0%) |
| Education Instruction & Library | 0 (0.0%) | 77 (100.0%) |
| Arts, Media & Entertainment | 0 (0.0%) | 0 (0.0%) |
| Health Diagnosing & Treating | 0 (0.0%) | 29 (100.0%) |
| Health Technologists | 0 (0.0%) | 1 (100.0%) |
| Total (Category) | 321 (47.9%) | 349 (52.1%) |
| Total (Overall) | 890 (50.5%) | 871 (49.5%) |
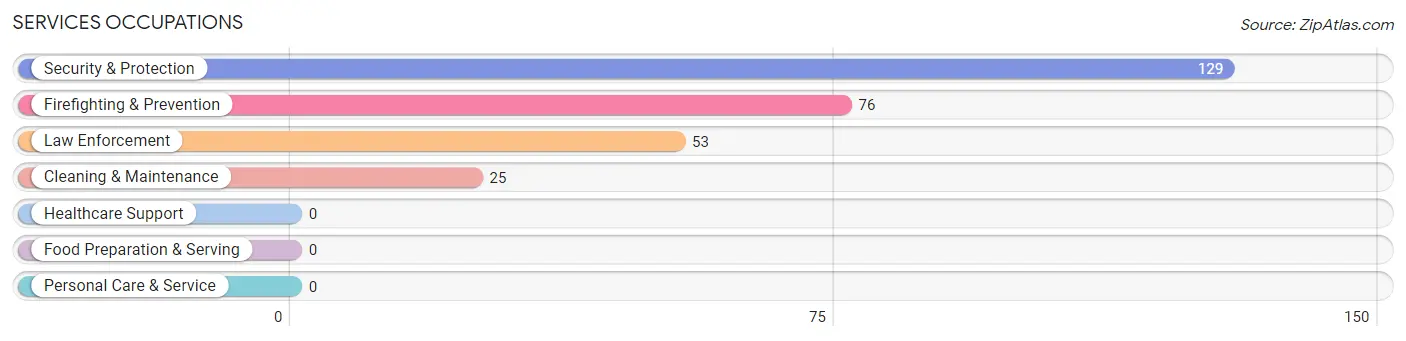
Services Occupations
The most common Services occupations in Waverly are Security & Protection (129 | 7.3%), Firefighting & Prevention (76 | 4.3%), Law Enforcement (53 | 3.0%), and Cleaning & Maintenance (25 | 1.4%).
Services Occupations by Sex
Within the Services occupations in Waverly, the most male-oriented occupations are Law Enforcement (100.0%), Cleaning & Maintenance (100.0%), and Security & Protection (41.1%), while the most female-oriented occupations are Firefighting & Prevention (100.0%), and Security & Protection (58.9%).
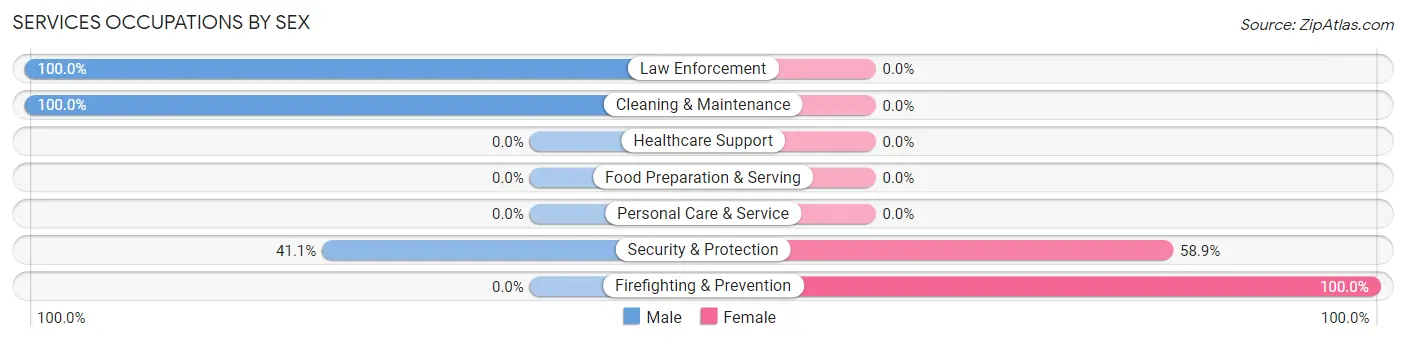
| Occupation | Male | Female |
| Healthcare Support | 0 (0.0%) | 0 (0.0%) |
| Security & Protection | 53 (41.1%) | 76 (58.9%) |
| Firefighting & Prevention | 0 (0.0%) | 76 (100.0%) |
| Law Enforcement | 53 (100.0%) | 0 (0.0%) |
| Food Preparation & Serving | 0 (0.0%) | 0 (0.0%) |
| Cleaning & Maintenance | 25 (100.0%) | 0 (0.0%) |
| Personal Care & Service | 0 (0.0%) | 0 (0.0%) |
| Total (Category) | 78 (50.6%) | 76 (49.3%) |
| Total (Overall) | 890 (50.5%) | 871 (49.5%) |
Sales and Office Occupations
The most common Sales and Office occupations in Waverly are Office & Administration (258 | 14.6%), and Sales & Related (108 | 6.1%).
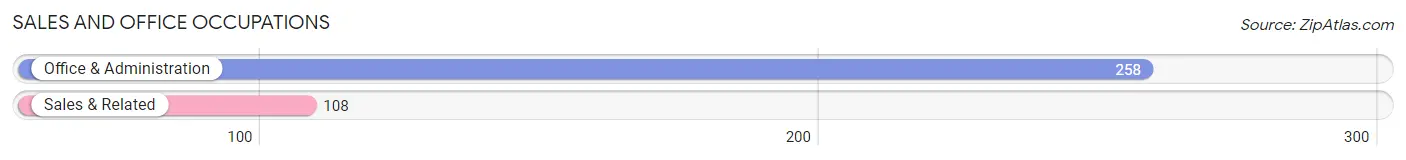
Sales and Office Occupations by Sex

| Occupation | Male | Female |
| Sales & Related | 108 (100.0%) | 0 (0.0%) |
| Office & Administration | 100 (38.8%) | 158 (61.2%) |
| Total (Category) | 208 (56.8%) | 158 (43.2%) |
| Total (Overall) | 890 (50.5%) | 871 (49.5%) |
Natural Resources, Construction and Maintenance Occupations
The most common Natural Resources, Construction and Maintenance occupations in Waverly are Construction & Extraction (67 | 3.8%), and Installation, Maintenance & Repair (45 | 2.6%).
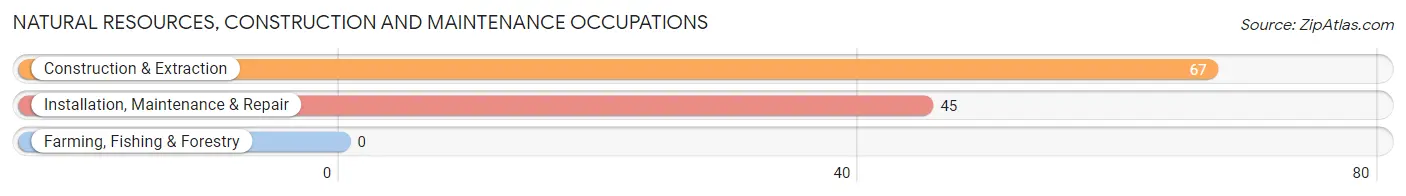
Natural Resources, Construction and Maintenance Occupations by Sex
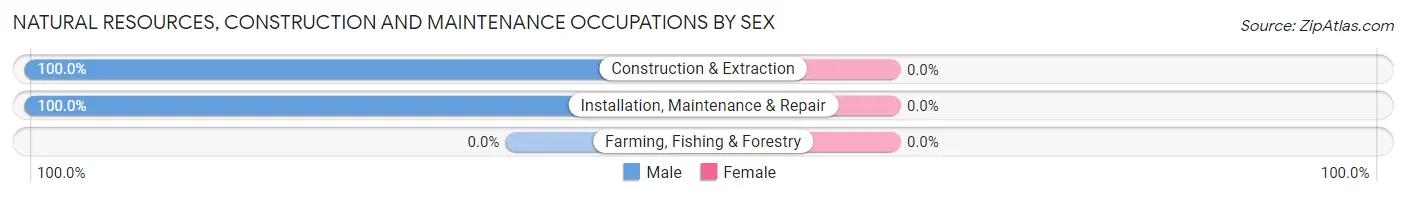
| Occupation | Male | Female |
| Farming, Fishing & Forestry | 0 (0.0%) | 0 (0.0%) |
| Construction & Extraction | 67 (100.0%) | 0 (0.0%) |
| Installation, Maintenance & Repair | 45 (100.0%) | 0 (0.0%) |
| Total (Category) | 112 (100.0%) | 0 (0.0%) |
| Total (Overall) | 890 (50.5%) | 871 (49.5%) |
Production, Transportation and Moving Occupations
The most common Production, Transportation and Moving occupations in Waverly are Production (433 | 24.6%), and Material Moving (26 | 1.5%).
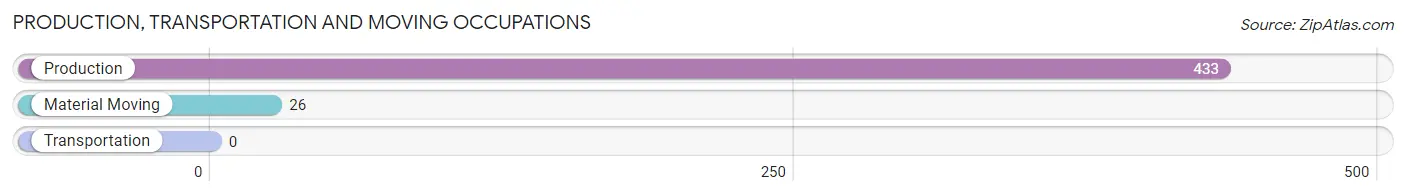
Production, Transportation and Moving Occupations by Sex
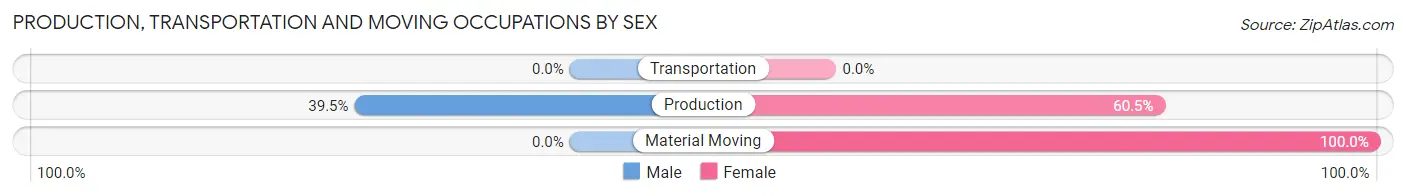
| Occupation | Male | Female |
| Production | 171 (39.5%) | 262 (60.5%) |
| Transportation | 0 (0.0%) | 0 (0.0%) |
| Material Moving | 0 (0.0%) | 26 (100.0%) |
| Total (Category) | 171 (37.2%) | 288 (62.7%) |
| Total (Overall) | 890 (50.5%) | 871 (49.5%) |
Employment Industries by Sex in Waverly
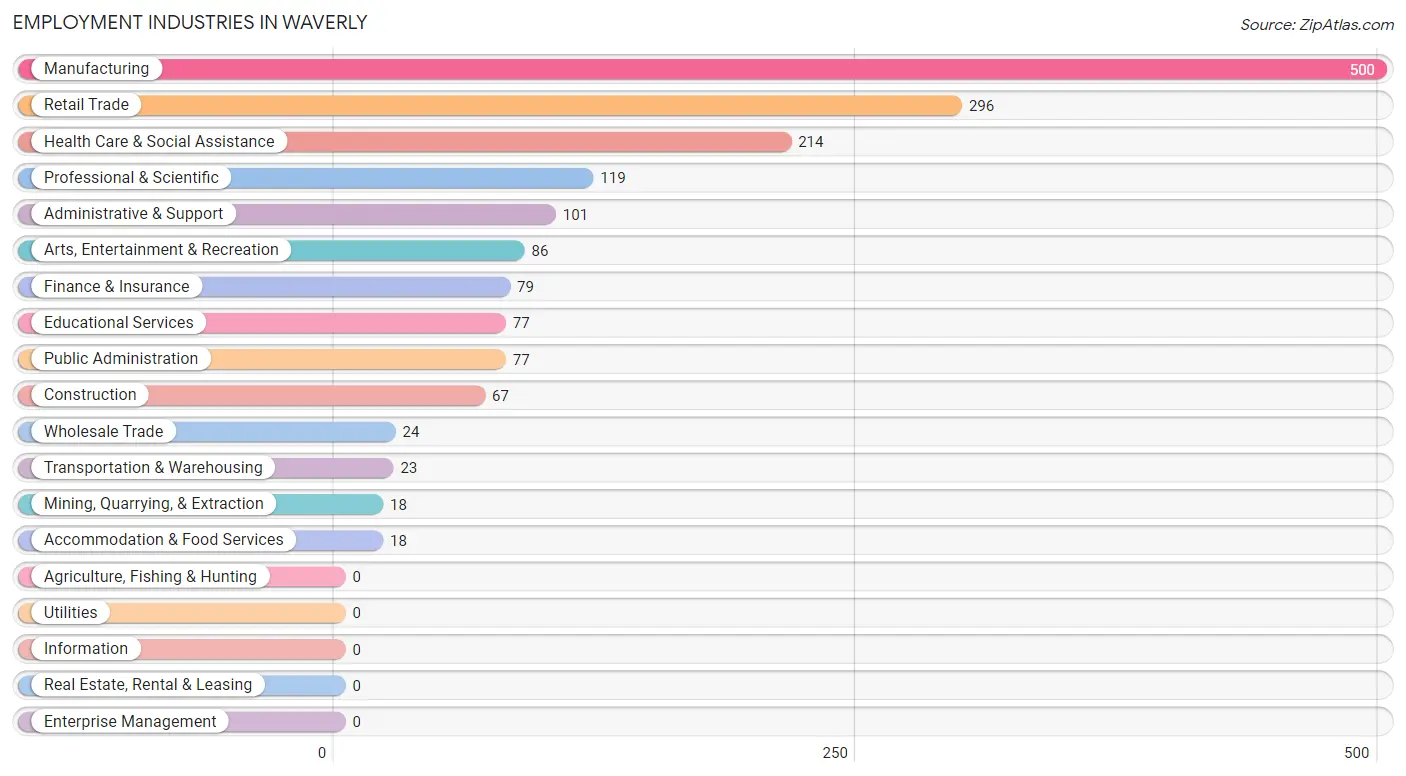
Employment Industries in Waverly
The major employment industries in Waverly include Manufacturing (500 | 28.4%), Retail Trade (296 | 16.8%), Health Care & Social Assistance (214 | 12.1%), Professional & Scientific (119 | 6.8%), and Administrative & Support (101 | 5.7%).
Employment Industries by Sex in Waverly
The Waverly industries that see more men than women are Construction (100.0%), Finance & Insurance (100.0%), and Arts, Entertainment & Recreation (100.0%), whereas the industries that tend to have a higher number of women are Mining, Quarrying, & Extraction (100.0%), Wholesale Trade (100.0%), and Educational Services (100.0%).
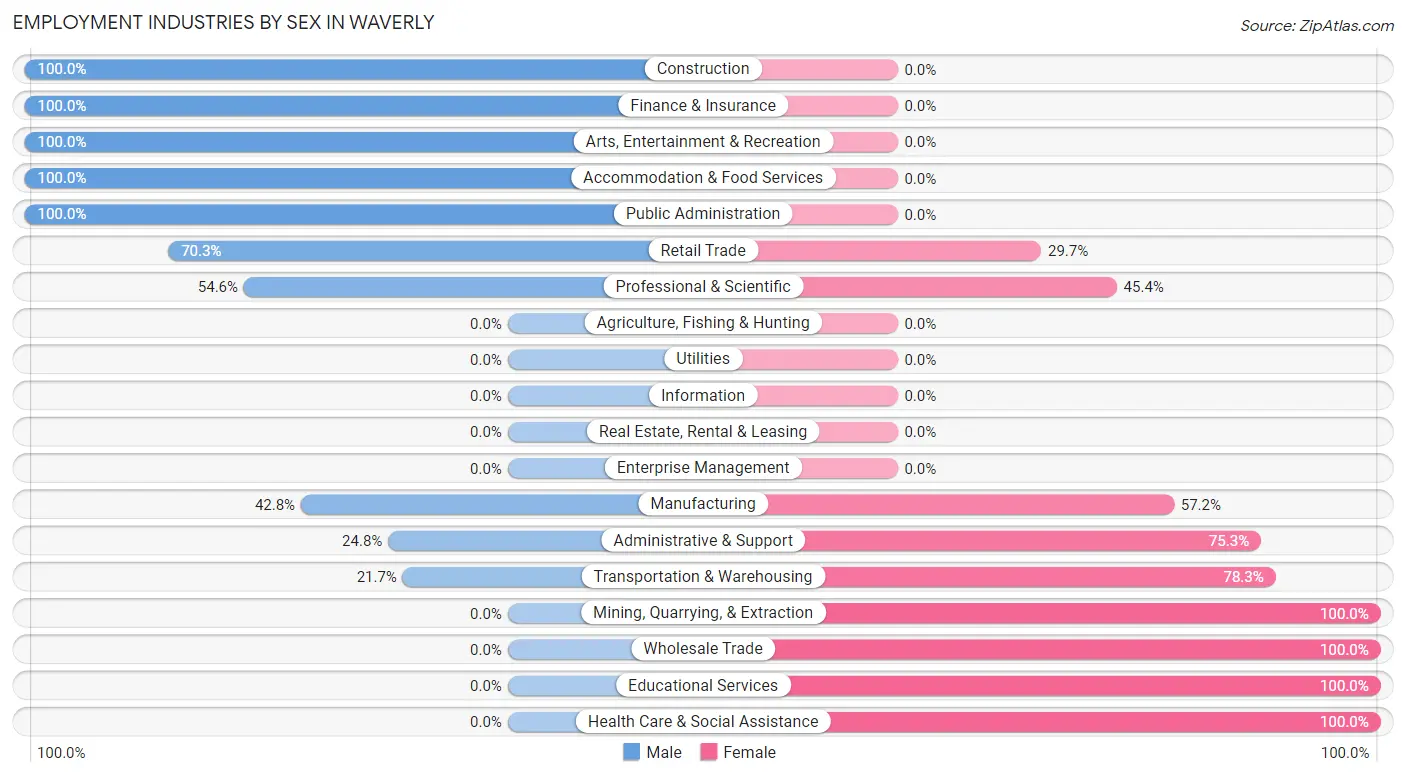
| Industry | Male | Female |
| Agriculture, Fishing & Hunting | 0 (0.0%) | 0 (0.0%) |
| Mining, Quarrying, & Extraction | 0 (0.0%) | 18 (100.0%) |
| Construction | 67 (100.0%) | 0 (0.0%) |
| Manufacturing | 214 (42.8%) | 286 (57.2%) |
| Wholesale Trade | 0 (0.0%) | 24 (100.0%) |
| Retail Trade | 208 (70.3%) | 88 (29.7%) |
| Transportation & Warehousing | 5 (21.7%) | 18 (78.3%) |
| Utilities | 0 (0.0%) | 0 (0.0%) |
| Information | 0 (0.0%) | 0 (0.0%) |
| Finance & Insurance | 79 (100.0%) | 0 (0.0%) |
| Real Estate, Rental & Leasing | 0 (0.0%) | 0 (0.0%) |
| Professional & Scientific | 65 (54.6%) | 54 (45.4%) |
| Enterprise Management | 0 (0.0%) | 0 (0.0%) |
| Administrative & Support | 25 (24.7%) | 76 (75.2%) |
| Educational Services | 0 (0.0%) | 77 (100.0%) |
| Health Care & Social Assistance | 0 (0.0%) | 214 (100.0%) |
| Arts, Entertainment & Recreation | 86 (100.0%) | 0 (0.0%) |
| Accommodation & Food Services | 18 (100.0%) | 0 (0.0%) |
| Public Administration | 77 (100.0%) | 0 (0.0%) |
| Total | 890 (50.5%) | 871 (49.5%) |
Education in Waverly
School Enrollment in Waverly
The most common levels of schooling among the 431 students in Waverly are college / undergraduate (209 | 48.5%), middle school (166 | 38.5%), and high school (25 | 5.8%).
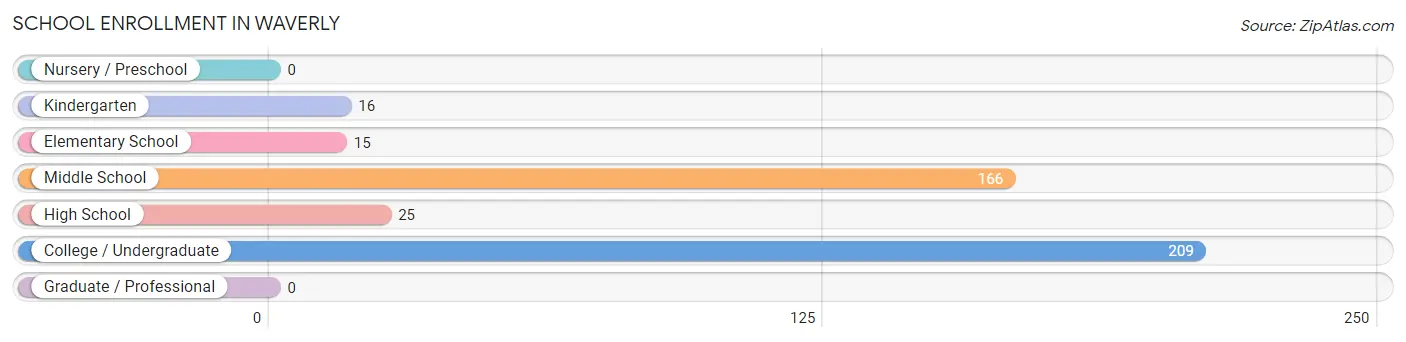
| School Level | # Students | % Students |
| Nursery / Preschool | 0 | 0.0% |
| Kindergarten | 16 | 3.7% |
| Elementary School | 15 | 3.5% |
| Middle School | 166 | 38.5% |
| High School | 25 | 5.8% |
| College / Undergraduate | 209 | 48.5% |
| Graduate / Professional | 0 | 0.0% |
| Total | 431 | 100.0% |
School Enrollment by Age by Funding Source in Waverly
Out of a total of 431 students who are enrolled in schools in Waverly, 113 (26.2%) attend a private institution, while the remaining 318 (73.8%) are enrolled in public schools. The age group of 20 to 24 year olds has the highest likelihood of being enrolled in private schools, with 76 (58.9% in the age bracket) enrolled. Conversely, the age group of 5 to 9 year old has the lowest likelihood of being enrolled in a private school, with 31 (100.0% in the age bracket) attending a public institution.
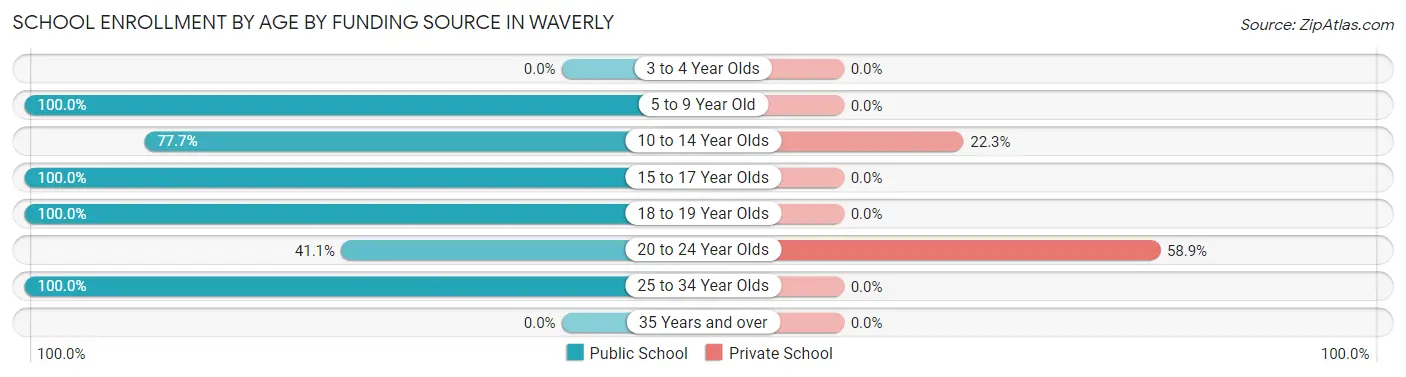
| Age Bracket | Public School | Private School |
| 3 to 4 Year Olds | 0 (0.0%) | 0 (0.0%) |
| 5 to 9 Year Old | 31 (100.0%) | 0 (0.0%) |
| 10 to 14 Year Olds | 129 (77.7%) | 37 (22.3%) |
| 15 to 17 Year Olds | 25 (100.0%) | 0 (0.0%) |
| 18 to 19 Year Olds | 11 (100.0%) | 0 (0.0%) |
| 20 to 24 Year Olds | 53 (41.1%) | 76 (58.9%) |
| 25 to 34 Year Olds | 69 (100.0%) | 0 (0.0%) |
| 35 Years and over | 0 (0.0%) | 0 (0.0%) |
| Total | 318 (73.8%) | 113 (26.2%) |
Educational Attainment by Field of Study in Waverly
Business (217 | 28.7%), science & technology (161 | 21.3%), literature & languages (77 | 10.2%), education (54 | 7.1%), and computers & mathematics (53 | 7.0%) are the most common fields of study among 755 individuals in Waverly who have obtained a bachelor's degree or higher.
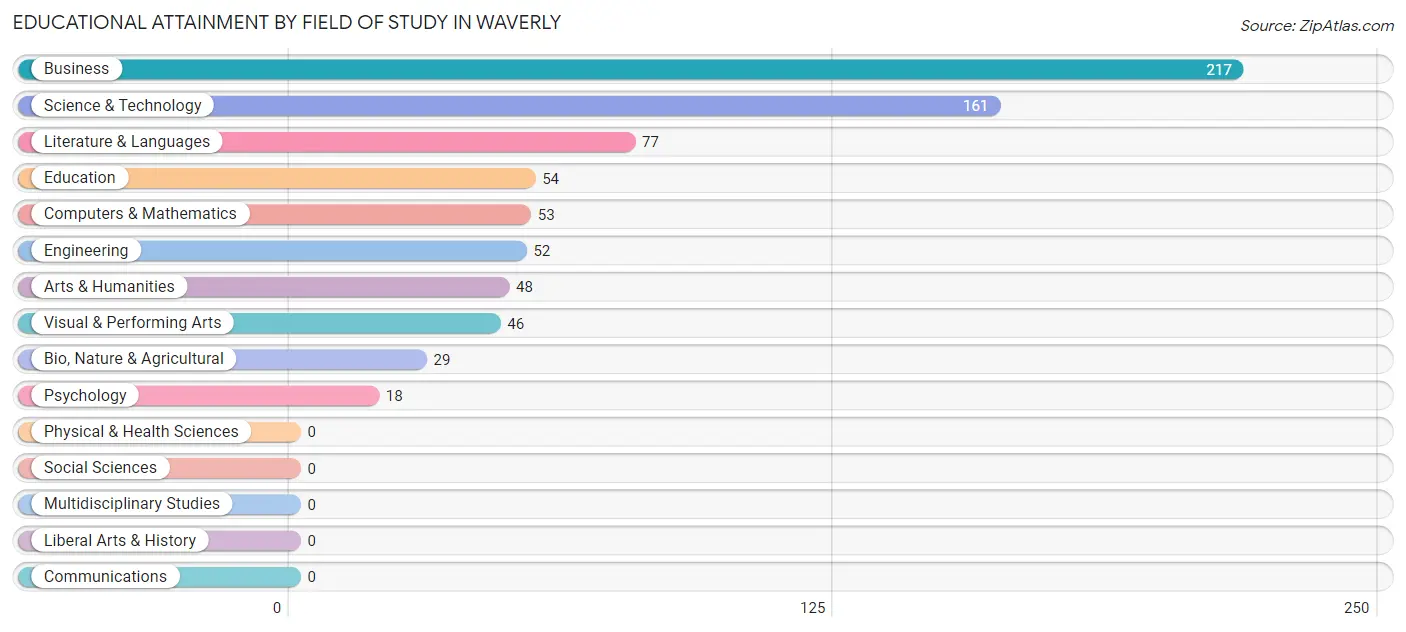
| Field of Study | # Graduates | % Graduates |
| Computers & Mathematics | 53 | 7.0% |
| Bio, Nature & Agricultural | 29 | 3.8% |
| Physical & Health Sciences | 0 | 0.0% |
| Psychology | 18 | 2.4% |
| Social Sciences | 0 | 0.0% |
| Engineering | 52 | 6.9% |
| Multidisciplinary Studies | 0 | 0.0% |
| Science & Technology | 161 | 21.3% |
| Business | 217 | 28.7% |
| Education | 54 | 7.1% |
| Literature & Languages | 77 | 10.2% |
| Liberal Arts & History | 0 | 0.0% |
| Visual & Performing Arts | 46 | 6.1% |
| Communications | 0 | 0.0% |
| Arts & Humanities | 48 | 6.4% |
| Total | 755 | 100.0% |
Transportation & Commute in Waverly
Vehicle Availability by Sex in Waverly
The most prevalent vehicle ownership categories in Waverly are males with 2 vehicles (438, accounting for 49.2%) and females with 2 vehicles (163, making up 50.3%).
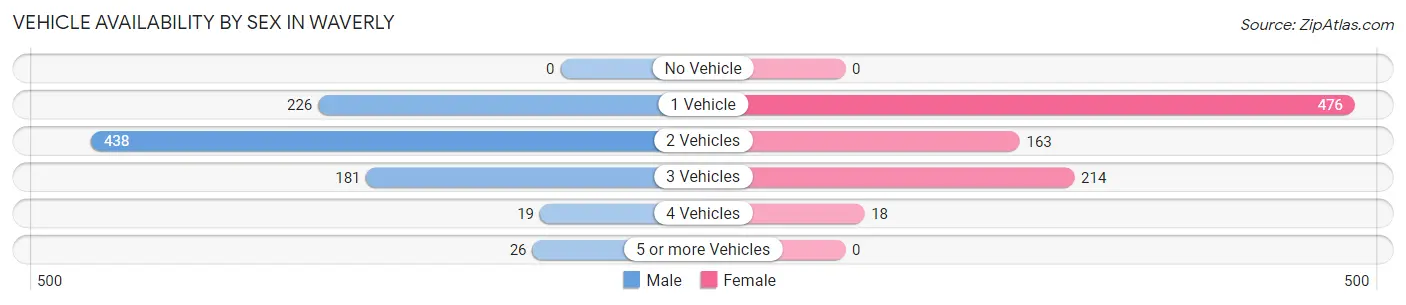
| Vehicles Available | Male | Female |
| No Vehicle | 0 (0.0%) | 0 (0.0%) |
| 1 Vehicle | 226 (25.4%) | 476 (54.6%) |
| 2 Vehicles | 438 (49.2%) | 163 (18.7%) |
| 3 Vehicles | 181 (20.3%) | 214 (24.6%) |
| 4 Vehicles | 19 (2.1%) | 18 (2.1%) |
| 5 or more Vehicles | 26 (2.9%) | 0 (0.0%) |
| Total | 890 (100.0%) | 871 (100.0%) |
Commute Time in Waverly
The most frequently occuring commute durations in Waverly are 5 to 9 minutes (354 commuters, 20.9%), 20 to 24 minutes (319 commuters, 18.8%), and 90 or more minutes (238 commuters, 14.0%).
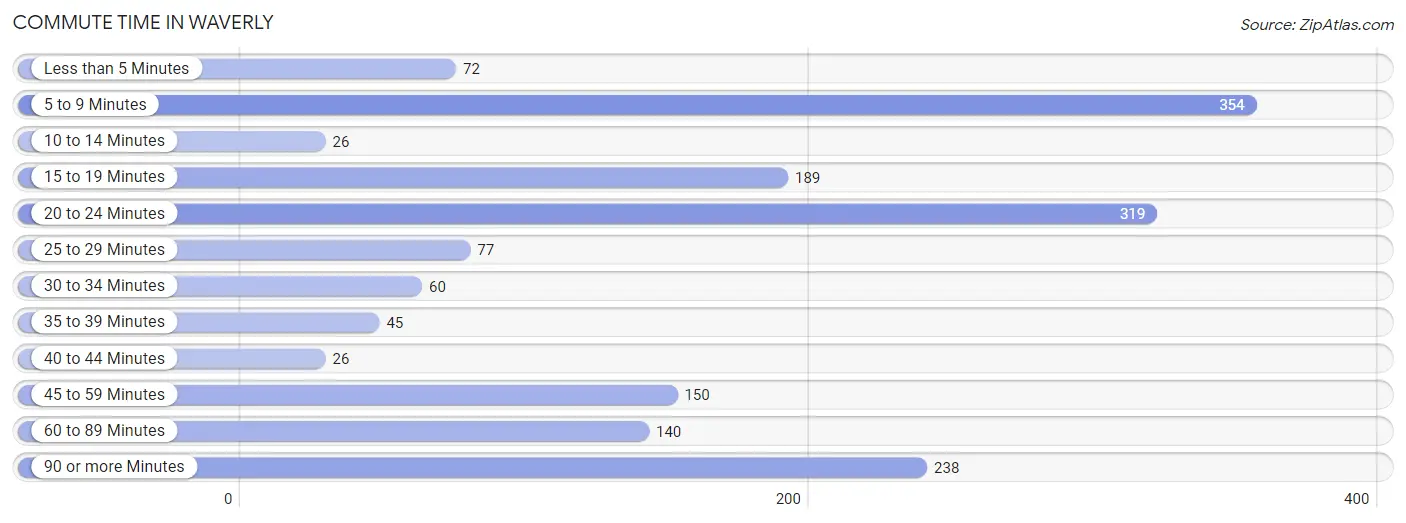
| Commute Time | # Commuters | % Commuters |
| Less than 5 Minutes | 72 | 4.3% |
| 5 to 9 Minutes | 354 | 20.9% |
| 10 to 14 Minutes | 26 | 1.5% |
| 15 to 19 Minutes | 189 | 11.1% |
| 20 to 24 Minutes | 319 | 18.8% |
| 25 to 29 Minutes | 77 | 4.5% |
| 30 to 34 Minutes | 60 | 3.5% |
| 35 to 39 Minutes | 45 | 2.6% |
| 40 to 44 Minutes | 26 | 1.5% |
| 45 to 59 Minutes | 150 | 8.8% |
| 60 to 89 Minutes | 140 | 8.3% |
| 90 or more Minutes | 238 | 14.0% |
Commute Time by Sex in Waverly
The most common commute times in Waverly are 90 or more minutes (192 commuters, 21.6%) for males and 5 to 9 minutes (234 commuters, 29.0%) for females.
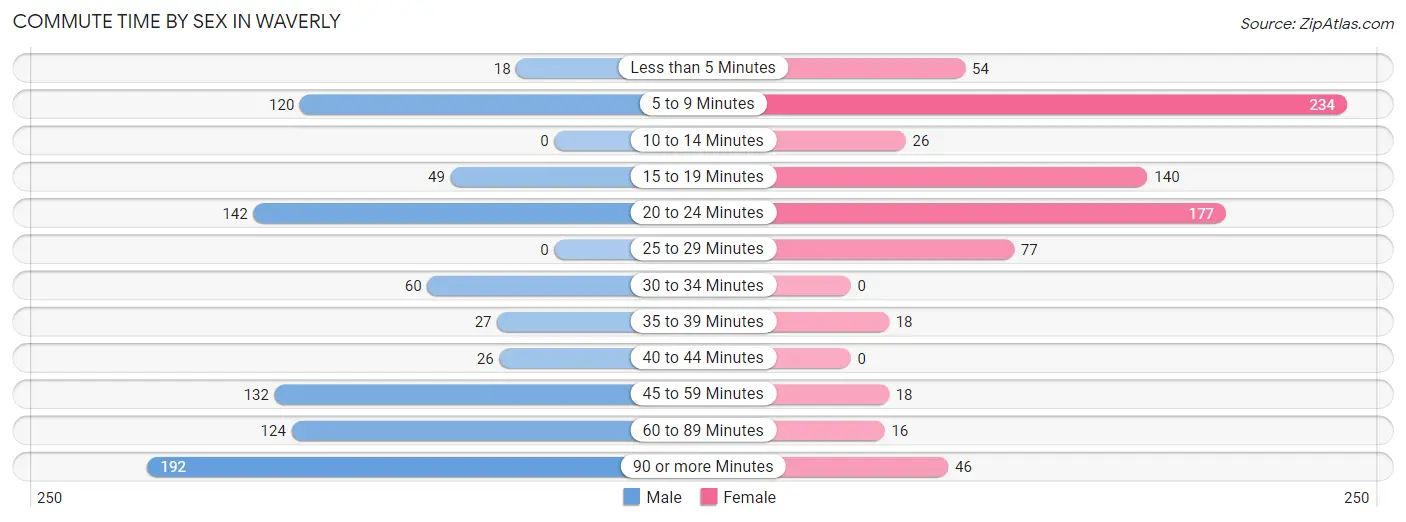
| Commute Time | Male | Female |
| Less than 5 Minutes | 18 (2.0%) | 54 (6.7%) |
| 5 to 9 Minutes | 120 (13.5%) | 234 (29.0%) |
| 10 to 14 Minutes | 0 (0.0%) | 26 (3.2%) |
| 15 to 19 Minutes | 49 (5.5%) | 140 (17.4%) |
| 20 to 24 Minutes | 142 (16.0%) | 177 (22.0%) |
| 25 to 29 Minutes | 0 (0.0%) | 77 (9.6%) |
| 30 to 34 Minutes | 60 (6.7%) | 0 (0.0%) |
| 35 to 39 Minutes | 27 (3.0%) | 18 (2.2%) |
| 40 to 44 Minutes | 26 (2.9%) | 0 (0.0%) |
| 45 to 59 Minutes | 132 (14.8%) | 18 (2.2%) |
| 60 to 89 Minutes | 124 (13.9%) | 16 (2.0%) |
| 90 or more Minutes | 192 (21.6%) | 46 (5.7%) |
Time of Departure to Work by Sex in Waverly
The most frequent times of departure to work in Waverly are 12:00 AM to 4:59 AM (201, 22.6%) for males and 7:30 AM to 7:59 AM (307, 38.1%) for females.
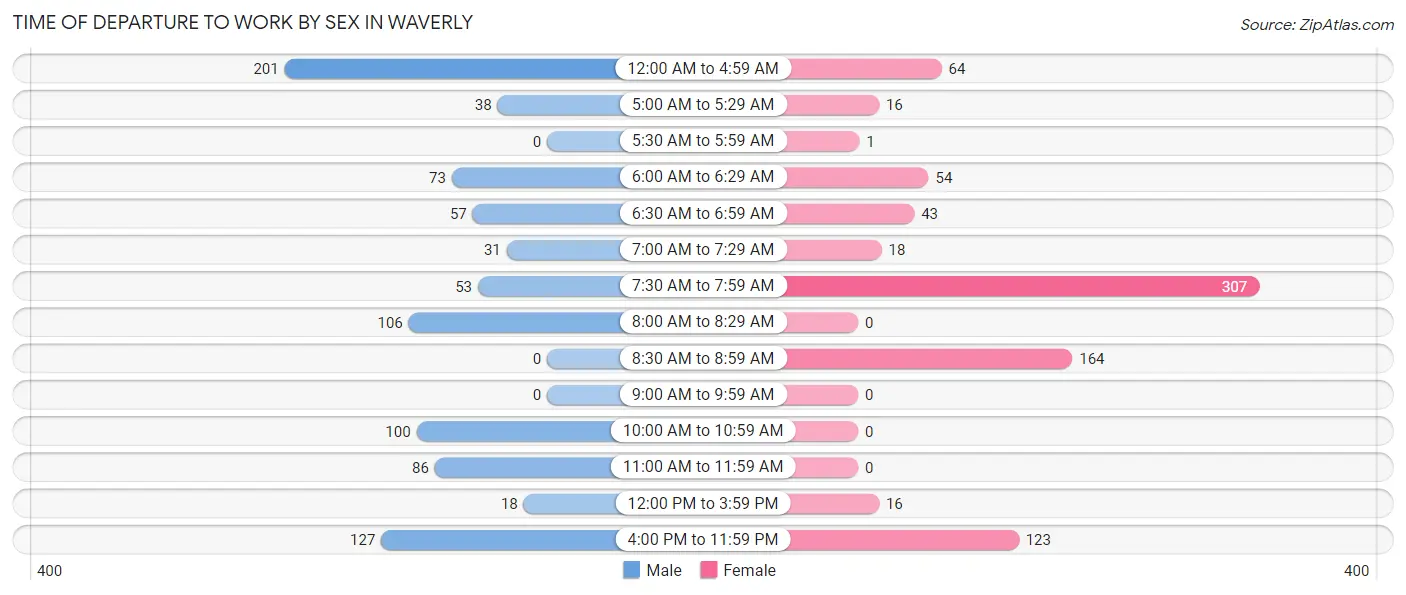
| Time of Departure | Male | Female |
| 12:00 AM to 4:59 AM | 201 (22.6%) | 64 (7.9%) |
| 5:00 AM to 5:29 AM | 38 (4.3%) | 16 (2.0%) |
| 5:30 AM to 5:59 AM | 0 (0.0%) | 1 (0.1%) |
| 6:00 AM to 6:29 AM | 73 (8.2%) | 54 (6.7%) |
| 6:30 AM to 6:59 AM | 57 (6.4%) | 43 (5.3%) |
| 7:00 AM to 7:29 AM | 31 (3.5%) | 18 (2.2%) |
| 7:30 AM to 7:59 AM | 53 (6.0%) | 307 (38.1%) |
| 8:00 AM to 8:29 AM | 106 (11.9%) | 0 (0.0%) |
| 8:30 AM to 8:59 AM | 0 (0.0%) | 164 (20.3%) |
| 9:00 AM to 9:59 AM | 0 (0.0%) | 0 (0.0%) |
| 10:00 AM to 10:59 AM | 100 (11.2%) | 0 (0.0%) |
| 11:00 AM to 11:59 AM | 86 (9.7%) | 0 (0.0%) |
| 12:00 PM to 3:59 PM | 18 (2.0%) | 16 (2.0%) |
| 4:00 PM to 11:59 PM | 127 (14.3%) | 123 (15.3%) |
| Total | 890 (100.0%) | 806 (100.0%) |
Housing Occupancy in Waverly
Occupancy by Ownership in Waverly
Of the total 1,861 dwellings in Waverly, owner-occupied units account for 1,349 (72.5%), while renter-occupied units make up 512 (27.5%).
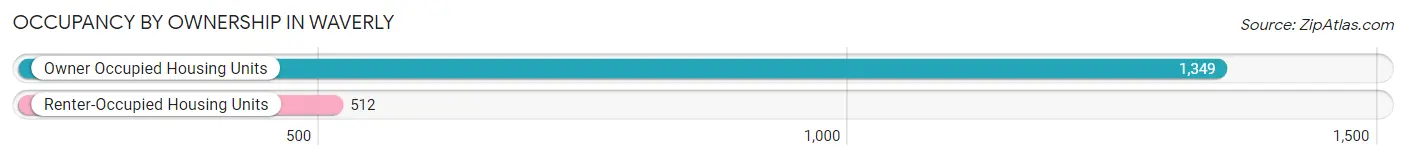
| Occupancy | # Housing Units | % Housing Units |
| Owner Occupied Housing Units | 1,349 | 72.5% |
| Renter-Occupied Housing Units | 512 | 27.5% |
| Total Occupied Housing Units | 1,861 | 100.0% |
Occupancy by Household Size in Waverly
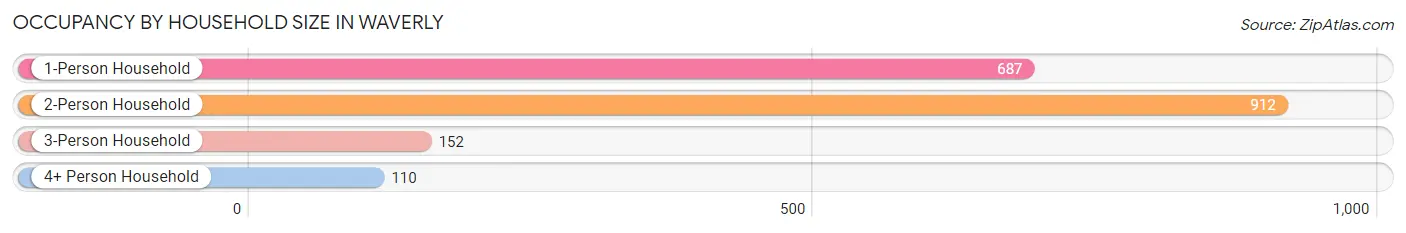
| Household Size | # Housing Units | % Housing Units |
| 1-Person Household | 687 | 36.9% |
| 2-Person Household | 912 | 49.0% |
| 3-Person Household | 152 | 8.2% |
| 4+ Person Household | 110 | 5.9% |
| Total Housing Units | 1,861 | 100.0% |
Occupancy by Ownership by Household Size in Waverly
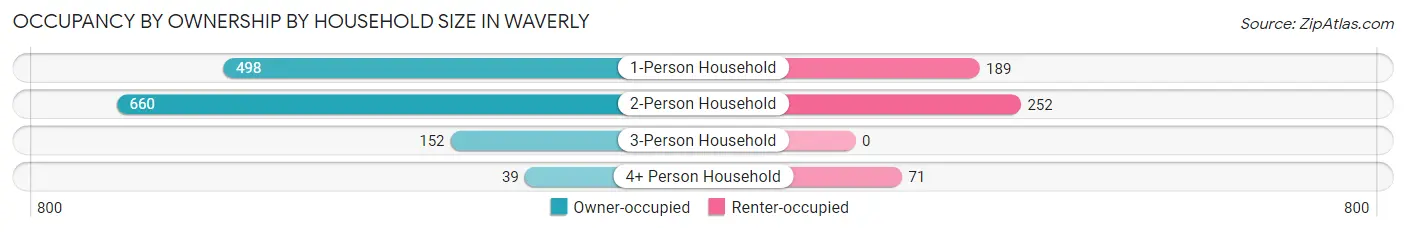
| Household Size | Owner-occupied | Renter-occupied |
| 1-Person Household | 498 (72.5%) | 189 (27.5%) |
| 2-Person Household | 660 (72.4%) | 252 (27.6%) |
| 3-Person Household | 152 (100.0%) | 0 (0.0%) |
| 4+ Person Household | 39 (35.4%) | 71 (64.5%) |
| Total Housing Units | 1,349 (72.5%) | 512 (27.5%) |
Occupancy by Educational Attainment in Waverly
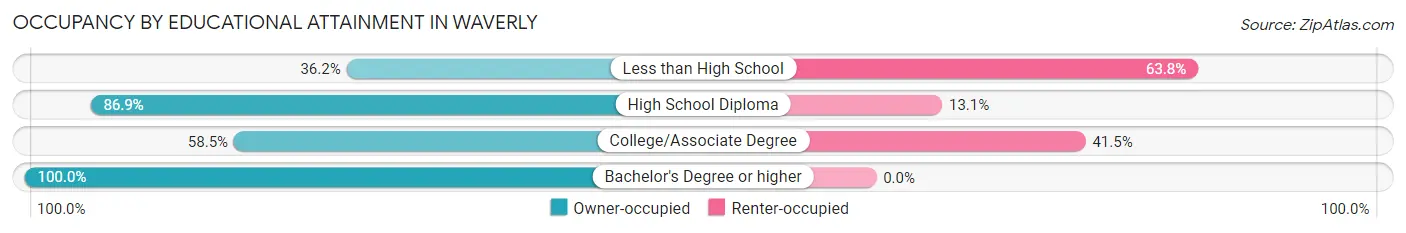
| Household Size | Owner-occupied | Renter-occupied |
| Less than High School | 106 (36.2%) | 187 (63.8%) |
| High School Diploma | 539 (86.9%) | 81 (13.1%) |
| College/Associate Degree | 344 (58.5%) | 244 (41.5%) |
| Bachelor's Degree or higher | 360 (100.0%) | 0 (0.0%) |
Occupancy by Age of Householder in Waverly
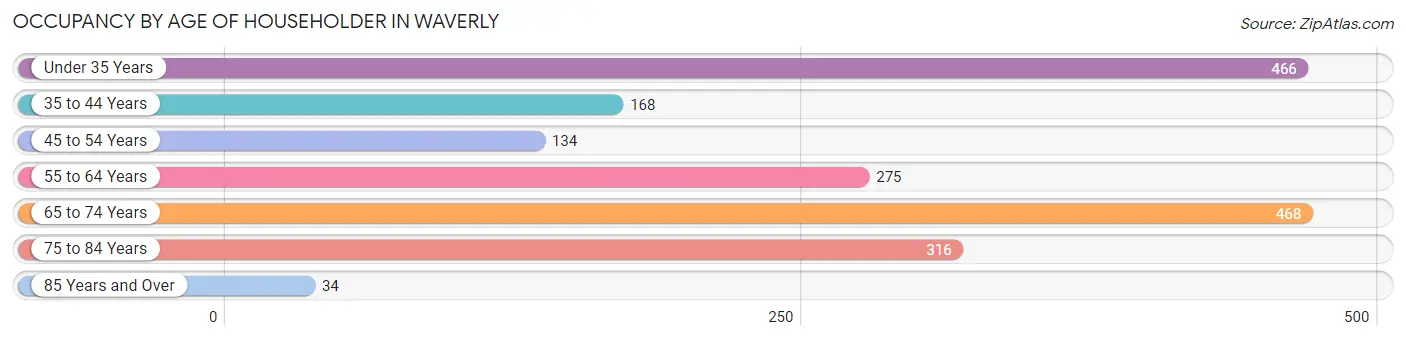
| Age Bracket | # Households | % Households |
| Under 35 Years | 466 | 25.0% |
| 35 to 44 Years | 168 | 9.0% |
| 45 to 54 Years | 134 | 7.2% |
| 55 to 64 Years | 275 | 14.8% |
| 65 to 74 Years | 468 | 25.2% |
| 75 to 84 Years | 316 | 17.0% |
| 85 Years and Over | 34 | 1.8% |
| Total | 1,861 | 100.0% |
Housing Finances in Waverly
Median Income by Occupancy in Waverly
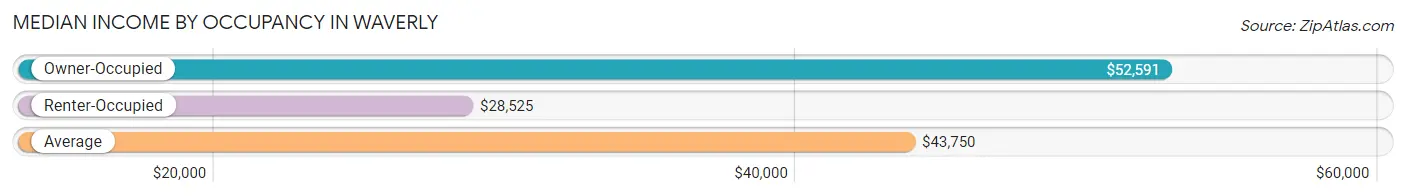
| Occupancy Type | # Households | Median Income |
| Owner-Occupied | 1,349 (72.5%) | $52,591 |
| Renter-Occupied | 512 (27.5%) | $28,525 |
| Average | 1,861 (100.0%) | $43,750 |
Occupancy by Householder Income Bracket in Waverly
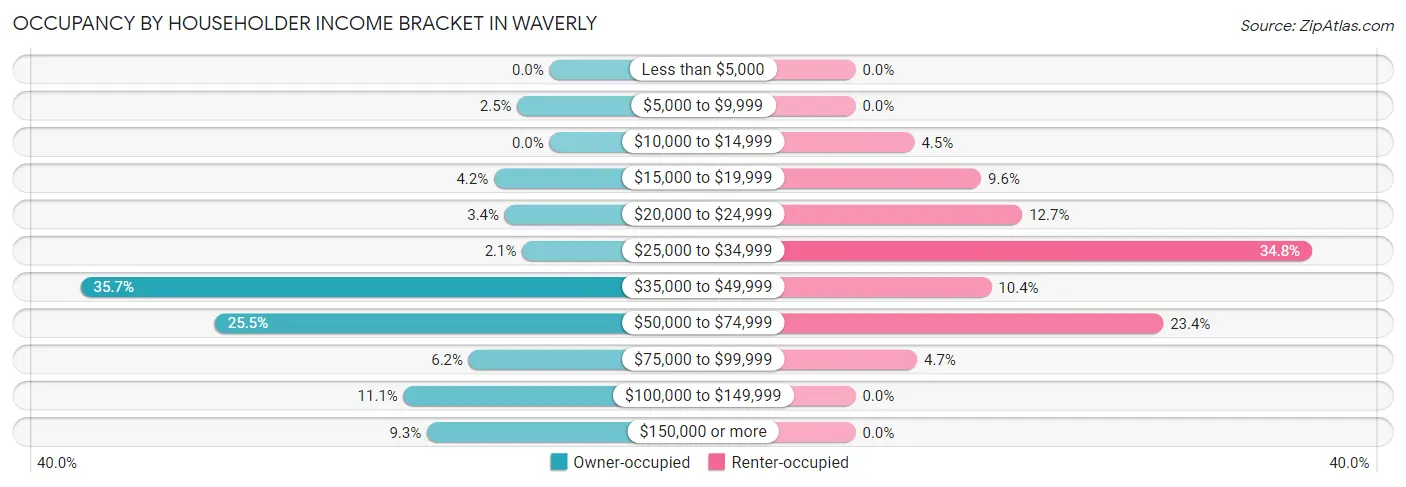
| Income Bracket | Owner-occupied | Renter-occupied |
| Less than $5,000 | 0 (0.0%) | 0 (0.0%) |
| $5,000 to $9,999 | 33 (2.5%) | 0 (0.0%) |
| $10,000 to $14,999 | 0 (0.0%) | 23 (4.5%) |
| $15,000 to $19,999 | 57 (4.2%) | 49 (9.6%) |
| $20,000 to $24,999 | 46 (3.4%) | 65 (12.7%) |
| $25,000 to $34,999 | 28 (2.1%) | 178 (34.8%) |
| $35,000 to $49,999 | 482 (35.7%) | 53 (10.3%) |
| $50,000 to $74,999 | 344 (25.5%) | 120 (23.4%) |
| $75,000 to $99,999 | 83 (6.1%) | 24 (4.7%) |
| $100,000 to $149,999 | 150 (11.1%) | 0 (0.0%) |
| $150,000 or more | 126 (9.3%) | 0 (0.0%) |
| Total | 1,349 (100.0%) | 512 (100.0%) |
Monthly Housing Cost Tiers in Waverly
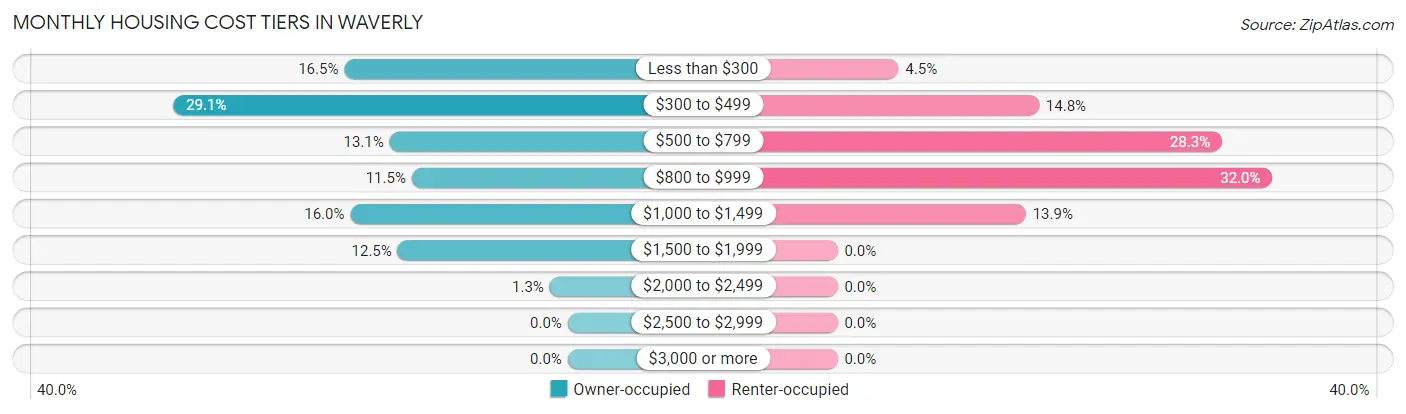
| Monthly Cost | Owner-occupied | Renter-occupied |
| Less than $300 | 222 (16.5%) | 23 (4.5%) |
| $300 to $499 | 392 (29.1%) | 76 (14.8%) |
| $500 to $799 | 177 (13.1%) | 145 (28.3%) |
| $800 to $999 | 155 (11.5%) | 164 (32.0%) |
| $1,000 to $1,499 | 216 (16.0%) | 71 (13.9%) |
| $1,500 to $1,999 | 169 (12.5%) | 0 (0.0%) |
| $2,000 to $2,499 | 18 (1.3%) | 0 (0.0%) |
| $2,500 to $2,999 | 0 (0.0%) | 0 (0.0%) |
| $3,000 or more | 0 (0.0%) | 0 (0.0%) |
| Total | 1,349 (100.0%) | 512 (100.0%) |
Physical Housing Characteristics in Waverly
Housing Structures in Waverly
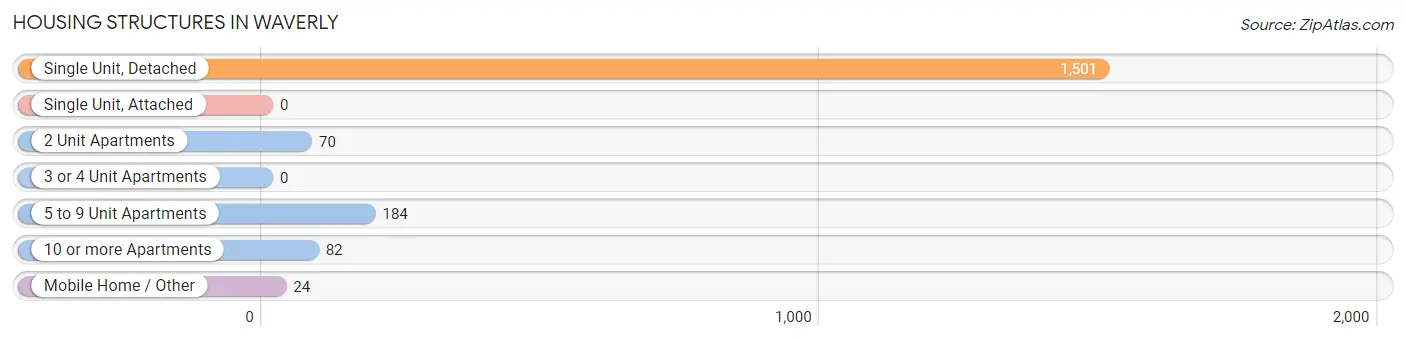
| Structure Type | # Housing Units | % Housing Units |
| Single Unit, Detached | 1,501 | 80.7% |
| Single Unit, Attached | 0 | 0.0% |
| 2 Unit Apartments | 70 | 3.8% |
| 3 or 4 Unit Apartments | 0 | 0.0% |
| 5 to 9 Unit Apartments | 184 | 9.9% |
| 10 or more Apartments | 82 | 4.4% |
| Mobile Home / Other | 24 | 1.3% |
| Total | 1,861 | 100.0% |
Housing Structures by Occupancy in Waverly
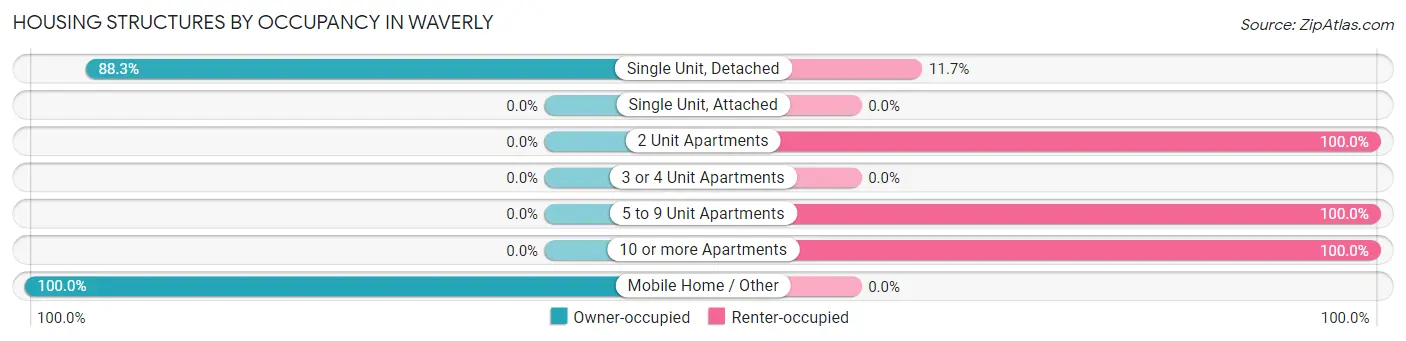
| Structure Type | Owner-occupied | Renter-occupied |
| Single Unit, Detached | 1,325 (88.3%) | 176 (11.7%) |
| Single Unit, Attached | 0 (0.0%) | 0 (0.0%) |
| 2 Unit Apartments | 0 (0.0%) | 70 (100.0%) |
| 3 or 4 Unit Apartments | 0 (0.0%) | 0 (0.0%) |
| 5 to 9 Unit Apartments | 0 (0.0%) | 184 (100.0%) |
| 10 or more Apartments | 0 (0.0%) | 82 (100.0%) |
| Mobile Home / Other | 24 (100.0%) | 0 (0.0%) |
| Total | 1,349 (72.5%) | 512 (27.5%) |
Housing Structures by Number of Rooms in Waverly
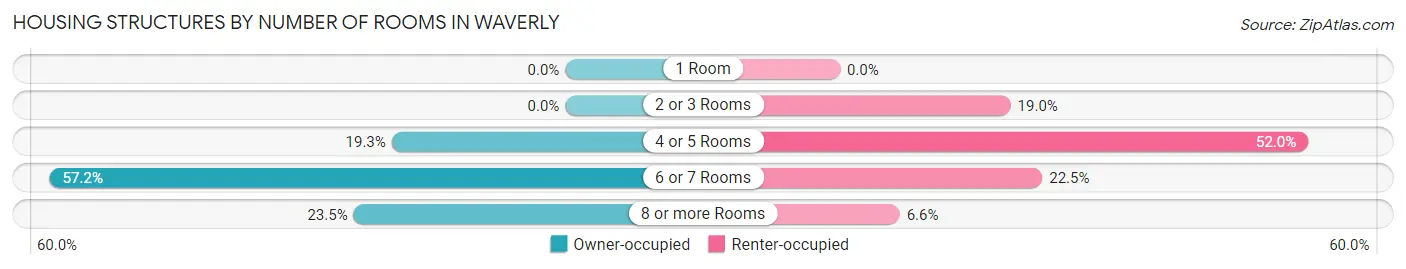
| Number of Rooms | Owner-occupied | Renter-occupied |
| 1 Room | 0 (0.0%) | 0 (0.0%) |
| 2 or 3 Rooms | 0 (0.0%) | 97 (19.0%) |
| 4 or 5 Rooms | 260 (19.3%) | 266 (51.9%) |
| 6 or 7 Rooms | 772 (57.2%) | 115 (22.5%) |
| 8 or more Rooms | 317 (23.5%) | 34 (6.6%) |
| Total | 1,349 (100.0%) | 512 (100.0%) |
Housing Structure by Heating Type in Waverly
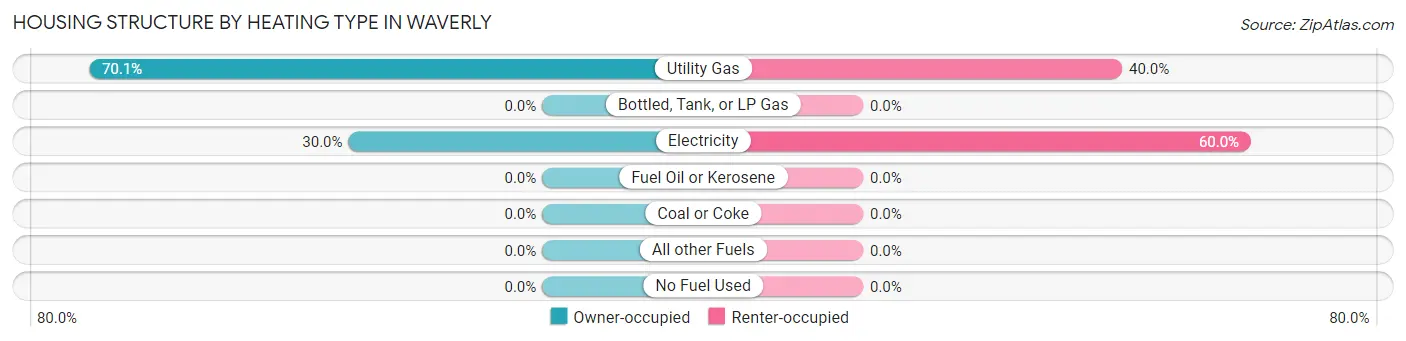
| Heating Type | Owner-occupied | Renter-occupied |
| Utility Gas | 945 (70.1%) | 205 (40.0%) |
| Bottled, Tank, or LP Gas | 0 (0.0%) | 0 (0.0%) |
| Electricity | 404 (29.9%) | 307 (60.0%) |
| Fuel Oil or Kerosene | 0 (0.0%) | 0 (0.0%) |
| Coal or Coke | 0 (0.0%) | 0 (0.0%) |
| All other Fuels | 0 (0.0%) | 0 (0.0%) |
| No Fuel Used | 0 (0.0%) | 0 (0.0%) |
| Total | 1,349 (100.0%) | 512 (100.0%) |
Household Vehicle Usage in Waverly
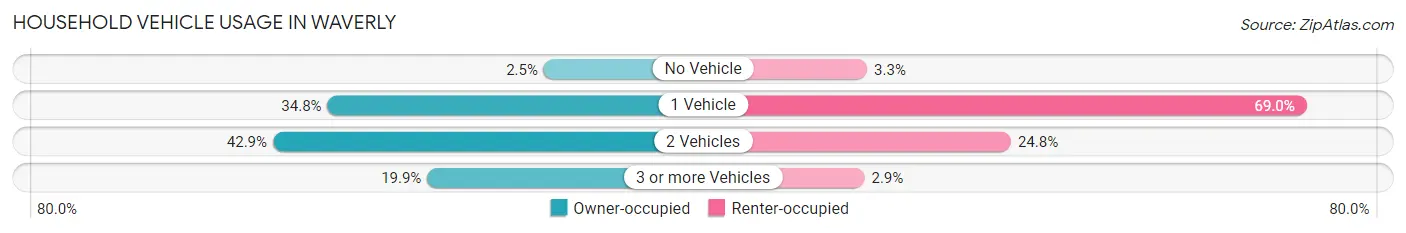
| Vehicles per Household | Owner-occupied | Renter-occupied |
| No Vehicle | 33 (2.5%) | 17 (3.3%) |
| 1 Vehicle | 469 (34.8%) | 353 (69.0%) |
| 2 Vehicles | 579 (42.9%) | 127 (24.8%) |
| 3 or more Vehicles | 268 (19.9%) | 15 (2.9%) |
| Total | 1,349 (100.0%) | 512 (100.0%) |
Real Estate & Mortgages in Waverly
Real Estate and Mortgage Overview in Waverly
| Characteristic | Without Mortgage | With Mortgage |
| Housing Units | 808 | 541 |
| Median Property Value | $135,200 | $177,400 |
| Median Household Income | $48,333 | $69 |
| Monthly Housing Costs | $417 | $0 |
| Real Estate Taxes | $910 | $0 |
Property Value by Mortgage Status in Waverly
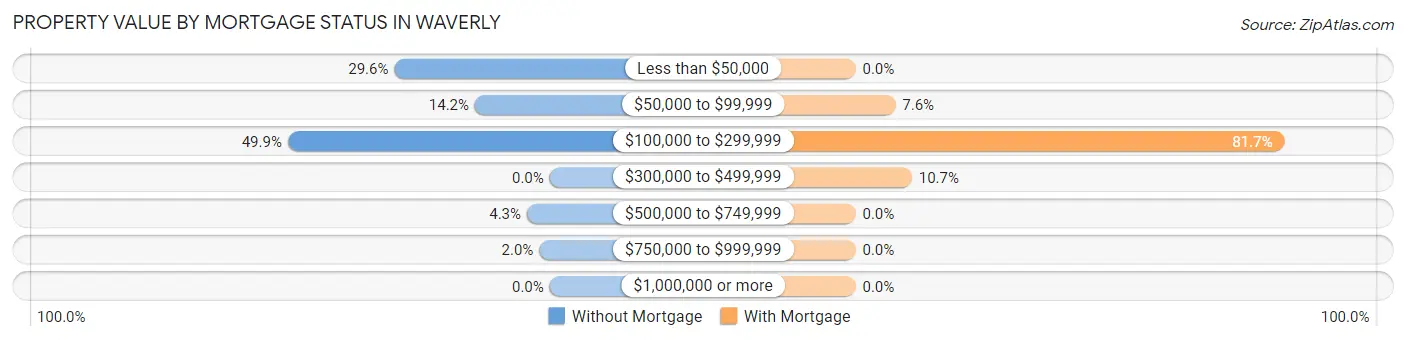
| Property Value | Without Mortgage | With Mortgage |
| Less than $50,000 | 239 (29.6%) | 0 (0.0%) |
| $50,000 to $99,999 | 115 (14.2%) | 41 (7.6%) |
| $100,000 to $299,999 | 403 (49.9%) | 442 (81.7%) |
| $300,000 to $499,999 | 0 (0.0%) | 58 (10.7%) |
| $500,000 to $749,999 | 35 (4.3%) | 0 (0.0%) |
| $750,000 to $999,999 | 16 (2.0%) | 0 (0.0%) |
| $1,000,000 or more | 0 (0.0%) | 0 (0.0%) |
| Total | 808 (100.0%) | 541 (100.0%) |
Household Income by Mortgage Status in Waverly
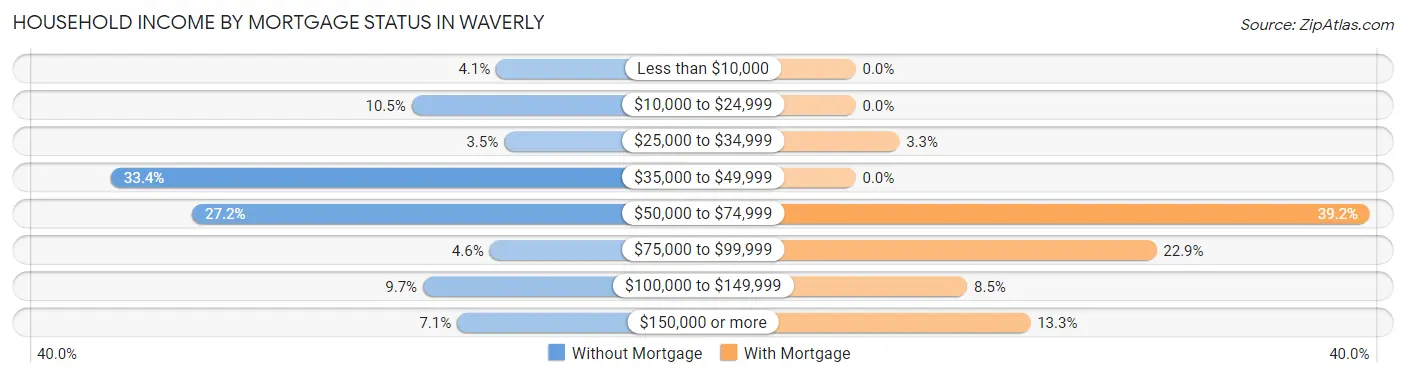
| Household Income | Without Mortgage | With Mortgage |
| Less than $10,000 | 33 (4.1%) | 0 (0.0%) |
| $10,000 to $24,999 | 85 (10.5%) | 0 (0.0%) |
| $25,000 to $34,999 | 28 (3.5%) | 18 (3.3%) |
| $35,000 to $49,999 | 270 (33.4%) | 0 (0.0%) |
| $50,000 to $74,999 | 220 (27.2%) | 212 (39.2%) |
| $75,000 to $99,999 | 37 (4.6%) | 124 (22.9%) |
| $100,000 to $149,999 | 78 (9.7%) | 46 (8.5%) |
| $150,000 or more | 57 (7.0%) | 72 (13.3%) |
| Total | 808 (100.0%) | 541 (100.0%) |
Property Value to Household Income Ratio in Waverly
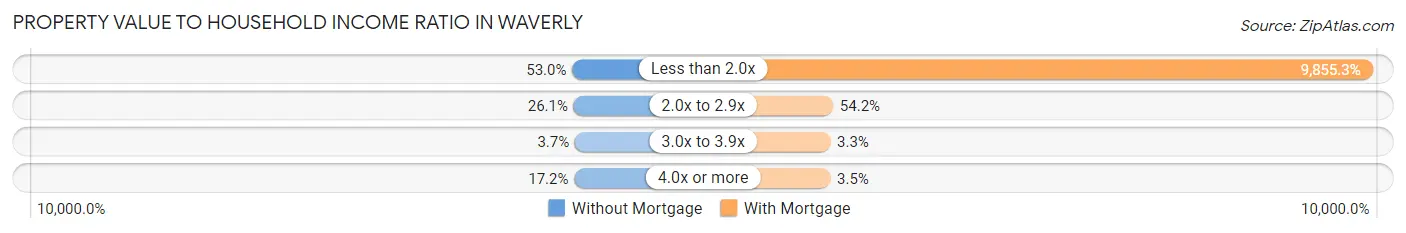
| Value-to-Income Ratio | Without Mortgage | With Mortgage |
| Less than 2.0x | 428 (53.0%) | 53,317 (9,855.3%) |
| 2.0x to 2.9x | 211 (26.1%) | 293 (54.2%) |
| 3.0x to 3.9x | 30 (3.7%) | 18 (3.3%) |
| 4.0x or more | 139 (17.2%) | 19 (3.5%) |
| Total | 808 (100.0%) | 541 (100.0%) |
Real Estate Taxes by Mortgage Status in Waverly
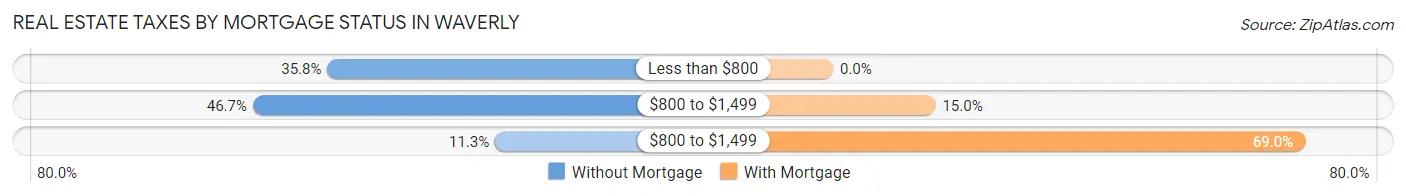
| Property Taxes | Without Mortgage | With Mortgage |
| Less than $800 | 289 (35.8%) | 0 (0.0%) |
| $800 to $1,499 | 377 (46.7%) | 81 (15.0%) |
| $800 to $1,499 | 91 (11.3%) | 373 (69.0%) |
| Total | 808 (100.0%) | 541 (100.0%) |
Health & Disability in Waverly
Health Insurance Coverage by Age in Waverly
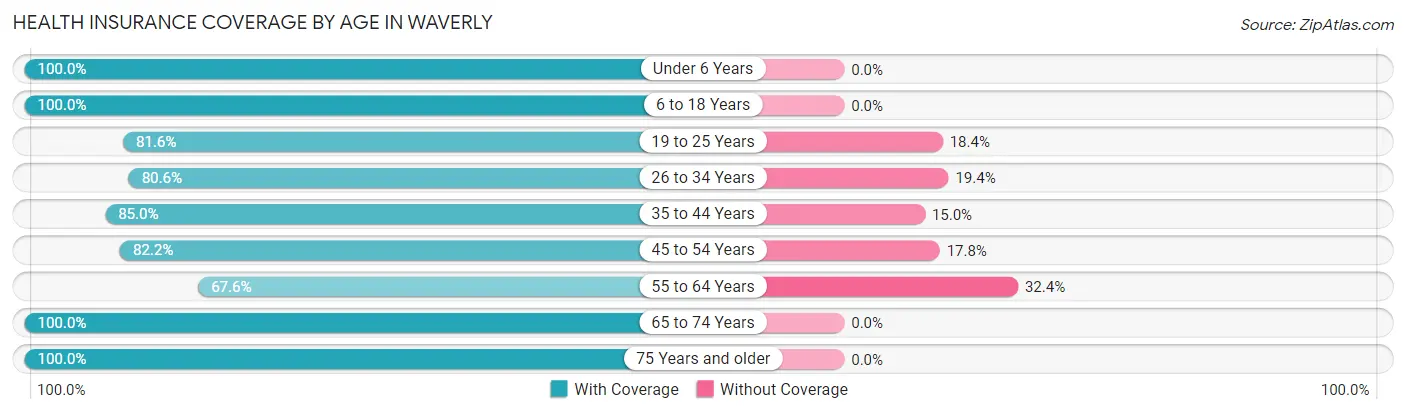
| Age Bracket | With Coverage | Without Coverage |
| Under 6 Years | 239 (100.0%) | 0 (0.0%) |
| 6 to 18 Years | 206 (100.0%) | 0 (0.0%) |
| 19 to 25 Years | 329 (81.6%) | 74 (18.4%) |
| 26 to 34 Years | 535 (80.6%) | 129 (19.4%) |
| 35 to 44 Years | 401 (85.0%) | 71 (15.0%) |
| 45 to 54 Years | 328 (82.2%) | 71 (17.8%) |
| 55 to 64 Years | 432 (67.6%) | 207 (32.4%) |
| 65 to 74 Years | 569 (100.0%) | 0 (0.0%) |
| 75 Years and older | 549 (100.0%) | 0 (0.0%) |
| Total | 3,588 (86.7%) | 552 (13.3%) |
Health Insurance Coverage by Citizenship Status in Waverly
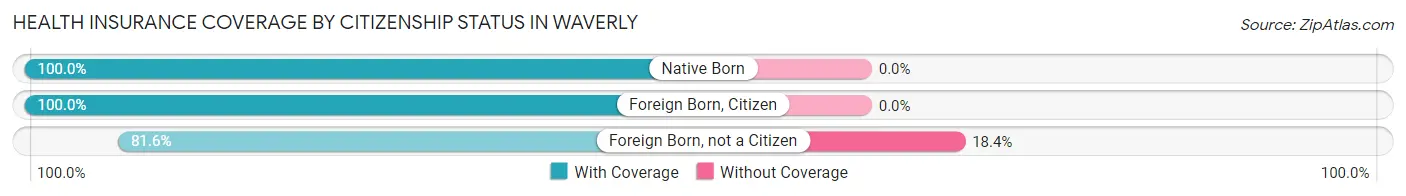
| Citizenship Status | With Coverage | Without Coverage |
| Native Born | 239 (100.0%) | 0 (0.0%) |
| Foreign Born, Citizen | 206 (100.0%) | 0 (0.0%) |
| Foreign Born, not a Citizen | 329 (81.6%) | 74 (18.4%) |
Health Insurance Coverage by Household Income in Waverly
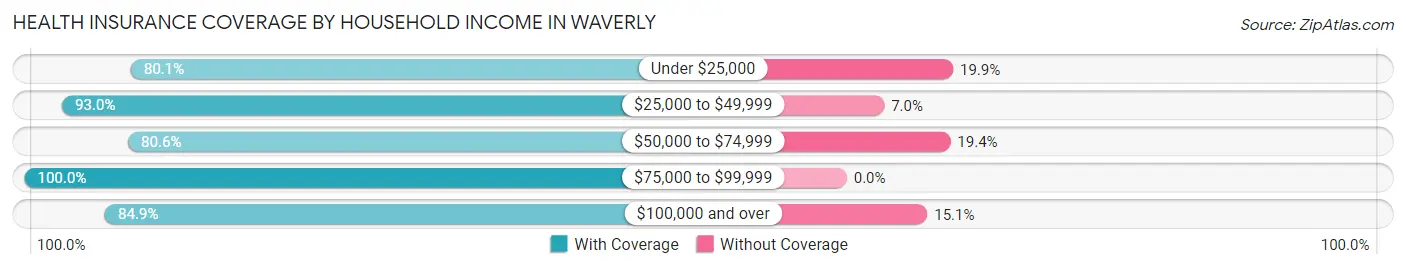
| Household Income | With Coverage | Without Coverage |
| Under $25,000 | 487 (80.1%) | 121 (19.9%) |
| $25,000 to $49,999 | 1,326 (93.0%) | 100 (7.0%) |
| $50,000 to $74,999 | 797 (80.6%) | 192 (19.4%) |
| $75,000 to $99,999 | 173 (100.0%) | 0 (0.0%) |
| $100,000 and over | 782 (84.9%) | 139 (15.1%) |
Public vs Private Health Insurance Coverage by Age in Waverly
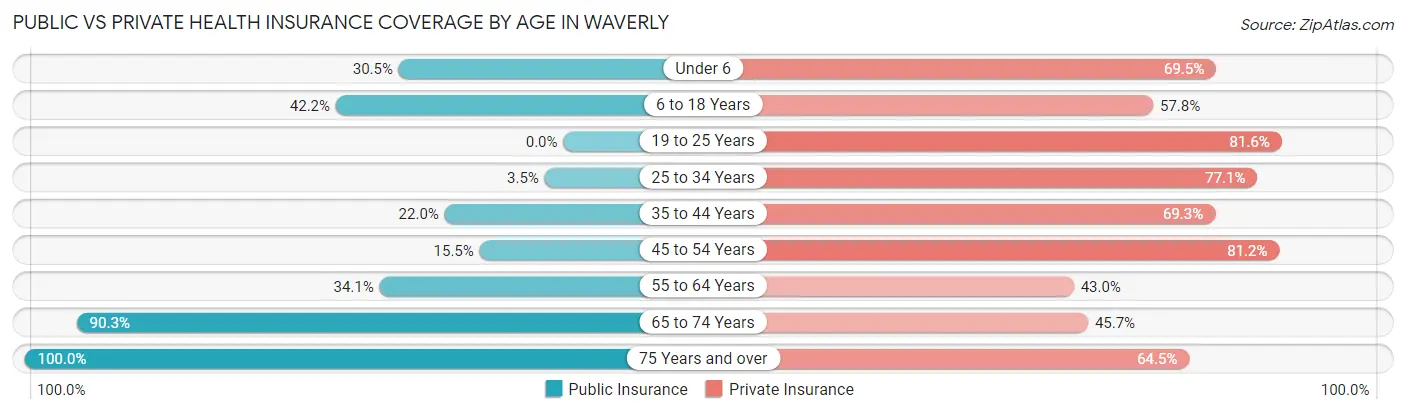
| Age Bracket | Public Insurance | Private Insurance |
| Under 6 | 73 (30.5%) | 166 (69.5%) |
| 6 to 18 Years | 87 (42.2%) | 119 (57.8%) |
| 19 to 25 Years | 0 (0.0%) | 329 (81.6%) |
| 25 to 34 Years | 23 (3.5%) | 512 (77.1%) |
| 35 to 44 Years | 104 (22.0%) | 327 (69.3%) |
| 45 to 54 Years | 62 (15.5%) | 324 (81.2%) |
| 55 to 64 Years | 218 (34.1%) | 275 (43.0%) |
| 65 to 74 Years | 514 (90.3%) | 260 (45.7%) |
| 75 Years and over | 549 (100.0%) | 354 (64.5%) |
| Total | 1,630 (39.4%) | 2,666 (64.4%) |
Disability Status by Sex by Age in Waverly
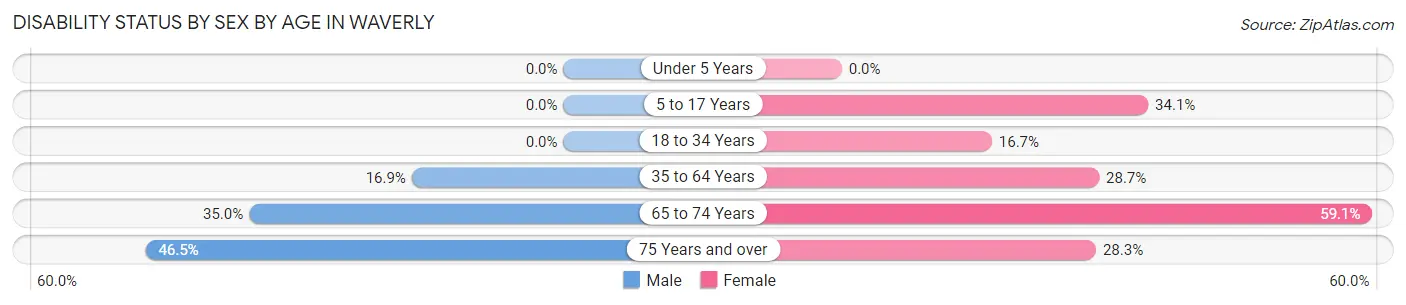
| Age Bracket | Male | Female |
| Under 5 Years | 0 (0.0%) | 0 (0.0%) |
| 5 to 17 Years | 0 (0.0%) | 29 (34.1%) |
| 18 to 34 Years | 0 (0.0%) | 63 (16.7%) |
| 35 to 64 Years | 90 (16.9%) | 280 (28.7%) |
| 65 to 74 Years | 70 (35.0%) | 218 (59.1%) |
| 75 Years and over | 101 (46.5%) | 94 (28.3%) |
Disability Class by Sex by Age in Waverly
Disability Class: Hearing Difficulty
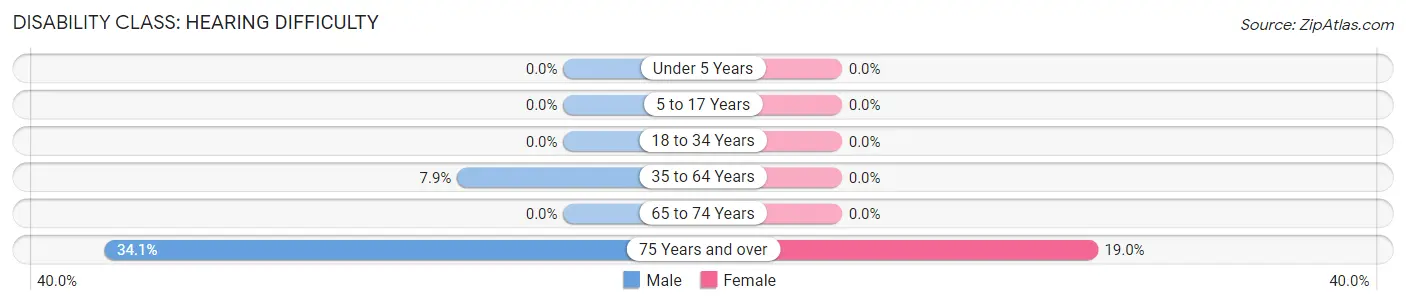
| Age Bracket | Male | Female |
| Under 5 Years | 0 (0.0%) | 0 (0.0%) |
| 5 to 17 Years | 0 (0.0%) | 0 (0.0%) |
| 18 to 34 Years | 0 (0.0%) | 0 (0.0%) |
| 35 to 64 Years | 42 (7.9%) | 0 (0.0%) |
| 65 to 74 Years | 0 (0.0%) | 0 (0.0%) |
| 75 Years and over | 74 (34.1%) | 63 (19.0%) |
Disability Class: Vision Difficulty
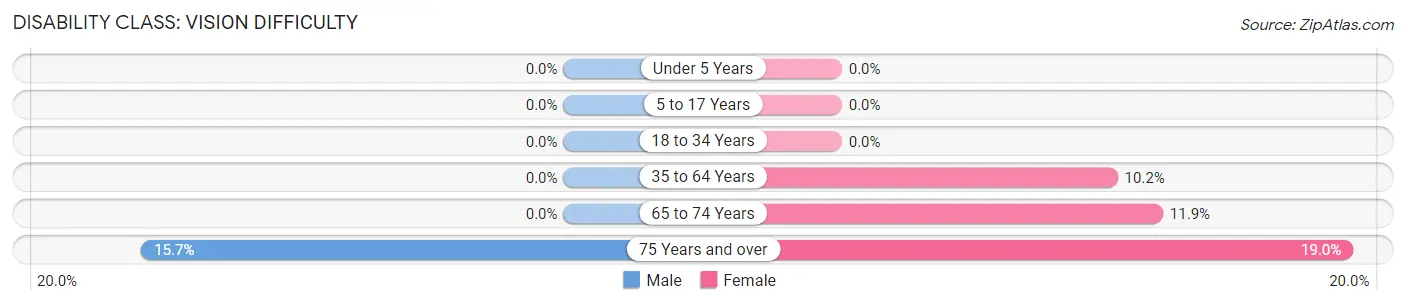
| Age Bracket | Male | Female |
| Under 5 Years | 0 (0.0%) | 0 (0.0%) |
| 5 to 17 Years | 0 (0.0%) | 0 (0.0%) |
| 18 to 34 Years | 0 (0.0%) | 0 (0.0%) |
| 35 to 64 Years | 0 (0.0%) | 100 (10.2%) |
| 65 to 74 Years | 0 (0.0%) | 44 (11.9%) |
| 75 Years and over | 34 (15.7%) | 63 (19.0%) |
Disability Class: Cognitive Difficulty
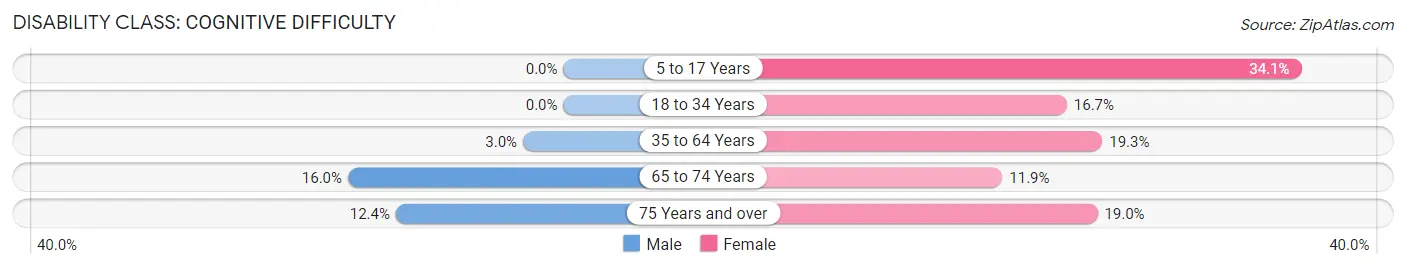
| Age Bracket | Male | Female |
| 5 to 17 Years | 0 (0.0%) | 29 (34.1%) |
| 18 to 34 Years | 0 (0.0%) | 63 (16.7%) |
| 35 to 64 Years | 16 (3.0%) | 189 (19.3%) |
| 65 to 74 Years | 32 (16.0%) | 44 (11.9%) |
| 75 Years and over | 27 (12.4%) | 63 (19.0%) |
Disability Class: Ambulatory Difficulty
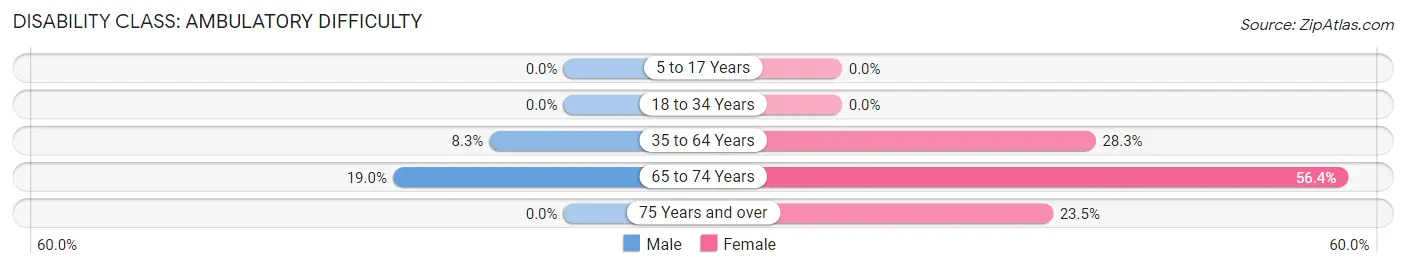
| Age Bracket | Male | Female |
| 5 to 17 Years | 0 (0.0%) | 0 (0.0%) |
| 18 to 34 Years | 0 (0.0%) | 0 (0.0%) |
| 35 to 64 Years | 44 (8.3%) | 276 (28.2%) |
| 65 to 74 Years | 38 (19.0%) | 208 (56.4%) |
| 75 Years and over | 0 (0.0%) | 78 (23.5%) |
Disability Class: Self-Care Difficulty
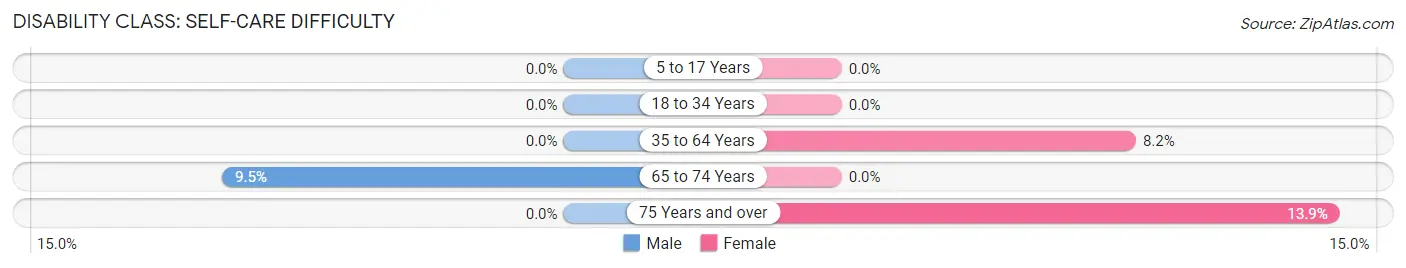
| Age Bracket | Male | Female |
| 5 to 17 Years | 0 (0.0%) | 0 (0.0%) |
| 18 to 34 Years | 0 (0.0%) | 0 (0.0%) |
| 35 to 64 Years | 0 (0.0%) | 80 (8.2%) |
| 65 to 74 Years | 19 (9.5%) | 0 (0.0%) |
| 75 Years and over | 0 (0.0%) | 46 (13.9%) |
Technology Access in Waverly
Computing Device Access in Waverly
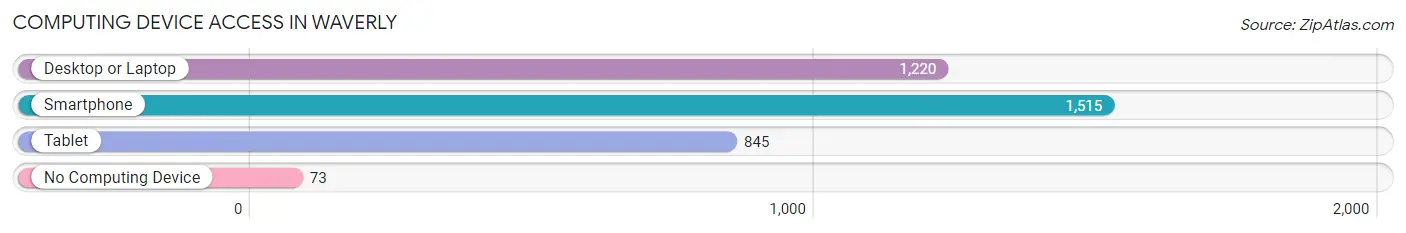
| Device Type | # Households | % Households |
| Desktop or Laptop | 1,220 | 65.6% |
| Smartphone | 1,515 | 81.4% |
| Tablet | 845 | 45.4% |
| No Computing Device | 73 | 3.9% |
| Total | 1,861 | 100.0% |
Internet Access in Waverly
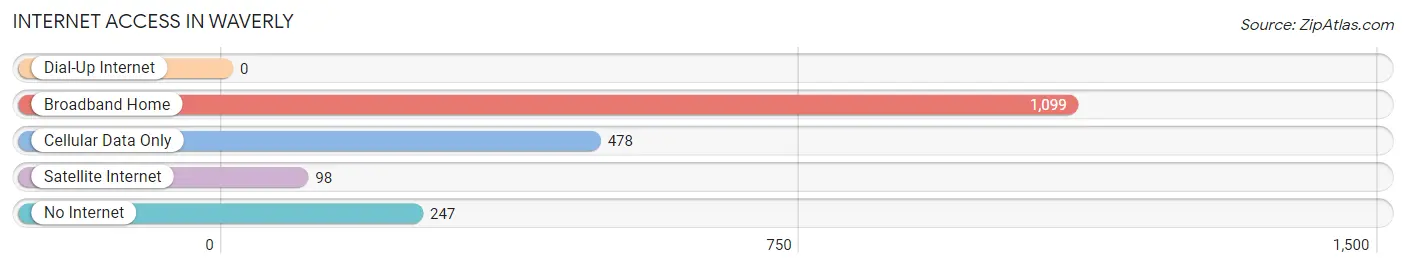
| Internet Type | # Households | % Households |
| Dial-Up Internet | 0 | 0.0% |
| Broadband Home | 1,099 | 59.1% |
| Cellular Data Only | 478 | 25.7% |
| Satellite Internet | 98 | 5.3% |
| No Internet | 247 | 13.3% |
| Total | 1,861 | 100.0% |
Waverly Summary
Waverly, Tennessee is a small town located in Humphreys County, Tennessee. It is situated on the banks of the Tennessee River, approximately 50 miles west of Nashville. The town has a population of approximately 2,500 people and is the county seat of Humphreys County.
History
Waverly was founded in 1820 by William Waverly, a Revolutionary War veteran. The town was named after him and was originally known as Waverly Station. The town was incorporated in 1837 and was the first county seat of Humphreys County.
The town was a major stop on the Nashville and Northwestern Railroad, which ran from Nashville to Memphis. The railroad was a major factor in the growth of the town, as it allowed for the transportation of goods and people.
The town was also a major stop on the Underground Railroad, which was used to help slaves escape to freedom. The town was a safe haven for many slaves and was a major hub for the abolitionist movement.
Geography
Waverly is located in the western part of Humphreys County, Tennessee. It is situated on the banks of the Tennessee River, approximately 50 miles west of Nashville. The town is surrounded by rolling hills and is located in a rural area.
The climate in Waverly is humid subtropical, with hot summers and mild winters. The average annual temperature is around 64 degrees Fahrenheit. The town receives an average of 48 inches of rain per year.
Economy
The economy of Waverly is largely based on agriculture. The town is home to several farms, which produce a variety of crops, including corn, soybeans, wheat, and hay. The town is also home to several manufacturing companies, which produce a variety of products, including furniture, clothing, and automotive parts.
The town is also home to several small businesses, including restaurants, retail stores, and service providers. The town is also home to several tourist attractions, including the Waverly Historic District, which is listed on the National Register of Historic Places.
Demographics
As of the 2010 census, the population of Waverly was 2,500. The racial makeup of the town was 95.2% White, 2.2% African American, 0.4% Native American, 0.2% Asian, 0.2% from other races, and 1.9% from two or more races. Hispanic or Latino of any race were 1.2% of the population.
The median income for a household in Waverly was $31,250, and the median income for a family was $37,500. The per capita income for the town was $15,945. About 17.2% of families and 20.2% of the population were below the poverty line, including 28.3% of those under age 18 and 11.2% of those age 65 or over.
Conclusion
Waverly, Tennessee is a small town located in Humphreys County, Tennessee. It is situated on the banks of the Tennessee River, approximately 50 miles west of Nashville. The town has a population of approximately 2,500 people and is the county seat of Humphreys County. The town was founded in 1820 and was a major stop on the Underground Railroad. The economy of Waverly is largely based on agriculture and manufacturing. The town is also home to several small businesses and tourist attractions. The population of Waverly is predominantly White, with a small percentage of African Americans, Native Americans, and other races. The median income for a household in Waverly is $31,250, and the per capita income is $15,945.
Common Questions
What is Per Capita Income in Waverly?
Per Capita income in Waverly is $29,611.
What is the Median Family Income in Waverly?
Median Family Income in Waverly is $54,948.
What is the Median Household income in Waverly?
Median Household Income in Waverly is $43,750.
What is Income or Wage Gap in Waverly?
Income or Wage Gap in Waverly is 44.7%.
Women in Waverly earn 55.3 cents for every dollar earned by a man.
What is Inequality or Gini Index in Waverly?
Inequality or Gini Index in Waverly is 0.41.
What is the Total Population of Waverly?
Total Population of Waverly is 4,284.
What is the Total Male Population of Waverly?
Total Male Population of Waverly is 1,881.
What is the Total Female Population of Waverly?
Total Female Population of Waverly is 2,403.
What is the Ratio of Males per 100 Females in Waverly?
There are 78.28 Males per 100 Females in Waverly.
What is the Ratio of Females per 100 Males in Waverly?
There are 127.75 Females per 100 Males in Waverly.
What is the Median Population Age in Waverly?
Median Population Age in Waverly is 46.7 Years.
What is the Average Family Size in Waverly
Average Family Size in Waverly is 2.9 People.
What is the Average Household Size in Waverly
Average Household Size in Waverly is 2.2 People.
How Large is the Labor Force in Waverly?
There are 2,222 People in the Labor Forcein in Waverly.
What is the Percentage of People in the Labor Force in Waverly?
57.5% of People are in the Labor Force in Waverly.
What is the Unemployment Rate in Waverly?
Unemployment Rate in Waverly is 20.8%.