Iron City, TN Map & Demographics
Iron City Map
Iron City Overview
$14,283
PER CAPITA INCOME
48.1%
WAGE / INCOME GAP [ % ]
51.9¢/ $1
WAGE / INCOME GAP [ $ ]
0.44
INEQUALITY / GINI INDEX
187
TOTAL POPULATION
121
MALE POPULATION
66
FEMALE POPULATION
183.33
MALES / 100 FEMALES
54.55
FEMALES / 100 MALES
51.4
MEDIAN AGE
3.2
AVG FAMILY SIZE
2.4
AVG HOUSEHOLD SIZE
86
LABOR FORCE [ PEOPLE ]
53.8%
PERCENT IN LABOR FORCE
23.3%
UNEMPLOYMENT RATE
Iron City Zip Codes
Income in Iron City
Income Overview in Iron City
| Characteristic | Number | Measure |
| Per Capita Income | 187 | $14,283 |
| Median Family Income | 38 | $0 |
| Mean Family Income | 38 | $32,545 |
| Median Household Income | 79 | $0 |
| Mean Household Income | 79 | $28,254 |
| Income Deficit | 38 | $0 |
| Wage / Income Gap (%) | 187 | 48.08% |
| Wage / Income Gap ($) | 187 | 51.92¢ per $1 |
| Gini / Inequality Index | 187 | 0.44 |
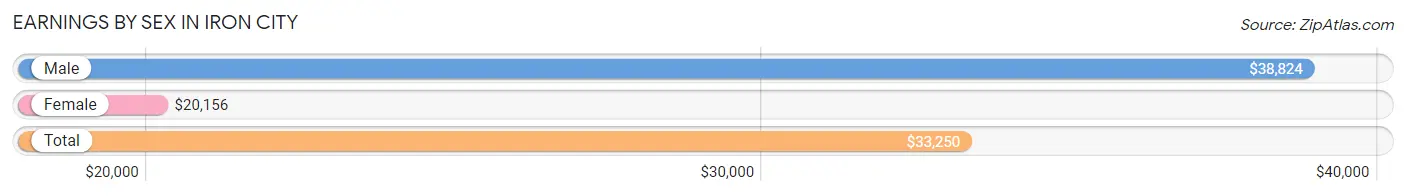
Earnings by Sex in Iron City
Average Earnings in Iron City are $33,250, $38,824 for men and $20,156 for women, a difference of 48.1%.
| Sex | Number | Average Earnings |
| Male | 46 (64.8%) | $38,824 |
| Female | 25 (35.2%) | $20,156 |
| Total | 71 (100.0%) | $33,250 |
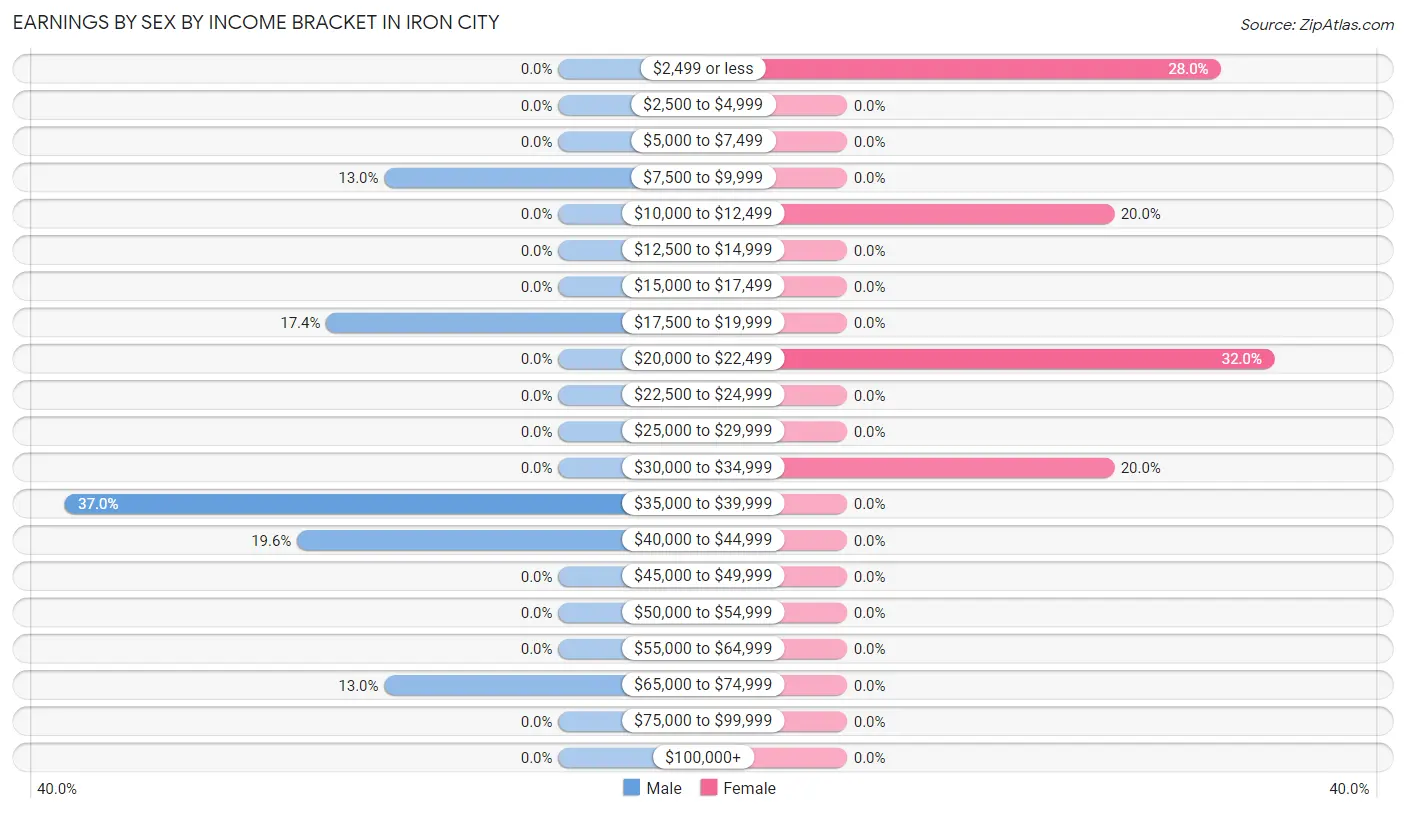
Earnings by Sex by Income Bracket in Iron City
The most common earnings brackets in Iron City are $35,000 to $39,999 for men (17 | 37.0%) and $20,000 to $22,499 for women (8 | 32.0%).
| Income | Male | Female |
| $2,499 or less | 0 (0.0%) | 7 (28.0%) |
| $2,500 to $4,999 | 0 (0.0%) | 0 (0.0%) |
| $5,000 to $7,499 | 0 (0.0%) | 0 (0.0%) |
| $7,500 to $9,999 | 6 (13.0%) | 0 (0.0%) |
| $10,000 to $12,499 | 0 (0.0%) | 5 (20.0%) |
| $12,500 to $14,999 | 0 (0.0%) | 0 (0.0%) |
| $15,000 to $17,499 | 0 (0.0%) | 0 (0.0%) |
| $17,500 to $19,999 | 8 (17.4%) | 0 (0.0%) |
| $20,000 to $22,499 | 0 (0.0%) | 8 (32.0%) |
| $22,500 to $24,999 | 0 (0.0%) | 0 (0.0%) |
| $25,000 to $29,999 | 0 (0.0%) | 0 (0.0%) |
| $30,000 to $34,999 | 0 (0.0%) | 5 (20.0%) |
| $35,000 to $39,999 | 17 (37.0%) | 0 (0.0%) |
| $40,000 to $44,999 | 9 (19.6%) | 0 (0.0%) |
| $45,000 to $49,999 | 0 (0.0%) | 0 (0.0%) |
| $50,000 to $54,999 | 0 (0.0%) | 0 (0.0%) |
| $55,000 to $64,999 | 0 (0.0%) | 0 (0.0%) |
| $65,000 to $74,999 | 6 (13.0%) | 0 (0.0%) |
| $75,000 to $99,999 | 0 (0.0%) | 0 (0.0%) |
| $100,000+ | 0 (0.0%) | 0 (0.0%) |
| Total | 46 (100.0%) | 25 (100.0%) |
Earnings by Sex by Educational Attainment in Iron City
| Educational Attainment | Male Income | Female Income |
| Less than High School | - | - |
| High School Diploma | - | - |
| College or Associate's Degree | - | - |
| Bachelor's Degree | - | - |
| Graduate Degree | - | - |
| Total | $38,824 | $0 |
Family Income in Iron City
Family Income Brackets in Iron City
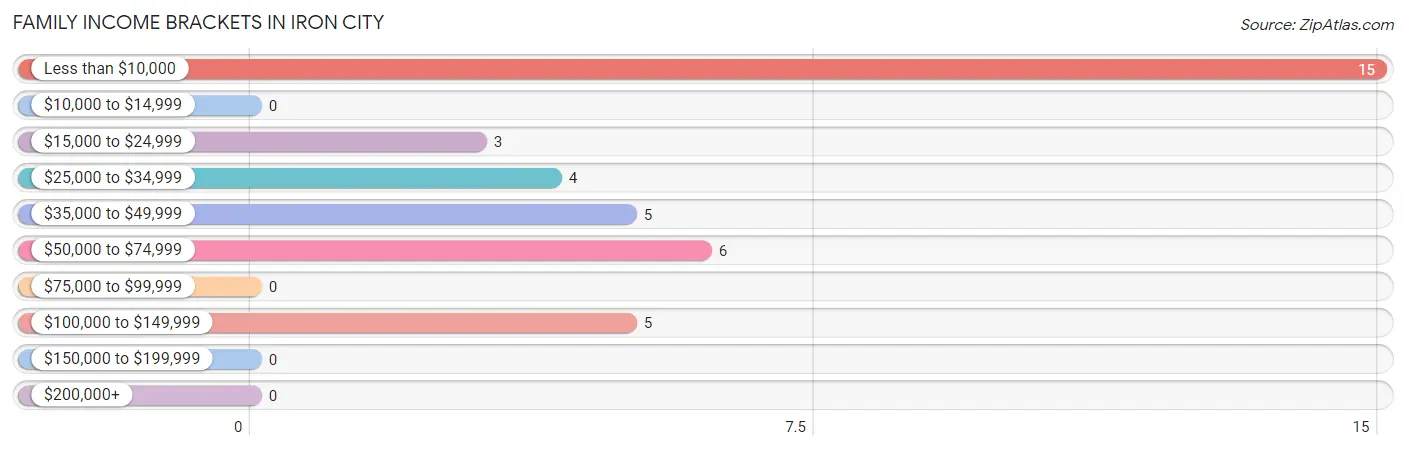
According to the Iron City family income data, there are 15 families falling into the less than $10,000 income range, which is the most common income bracket and makes up 39.5% of all families.
| Income Bracket | # Families | % Families |
| Less than $10,000 | 15 | 39.5% |
| $10,000 to $14,999 | 0 | 0.0% |
| $15,000 to $24,999 | 3 | 7.9% |
| $25,000 to $34,999 | 4 | 10.5% |
| $35,000 to $49,999 | 5 | 13.2% |
| $50,000 to $74,999 | 6 | 15.8% |
| $75,000 to $99,999 | 0 | 0.0% |
| $100,000 to $149,999 | 5 | 13.2% |
| $150,000 to $199,999 | 0 | 0.0% |
| $200,000+ | 0 | 0.0% |
Family Income by Famaliy Size in Iron City
| Income Bracket | # Families | Median Income |
| 2-Person Families | 13 (34.2%) | $0 |
| 3-Person Families | 25 (65.8%) | $0 |
| 4-Person Families | 0 (0.0%) | $0 |
| 5-Person Families | 0 (0.0%) | $0 |
| 6-Person Families | 0 (0.0%) | $0 |
| 7+ Person Families | 0 (0.0%) | $0 |
| Total | 38 (100.0%) | $0 |
Family Income by Number of Earners in Iron City
| Number of Earners | # Families | Median Income |
| No Earners | 18 (47.4%) | $0 |
| 1 Earner | 9 (23.7%) | $0 |
| 2 Earners | 11 (28.9%) | $0 |
| 3+ Earners | 0 (0.0%) | $0 |
| Total | 38 (100.0%) | $0 |
Household Income in Iron City
Household Income Brackets in Iron City
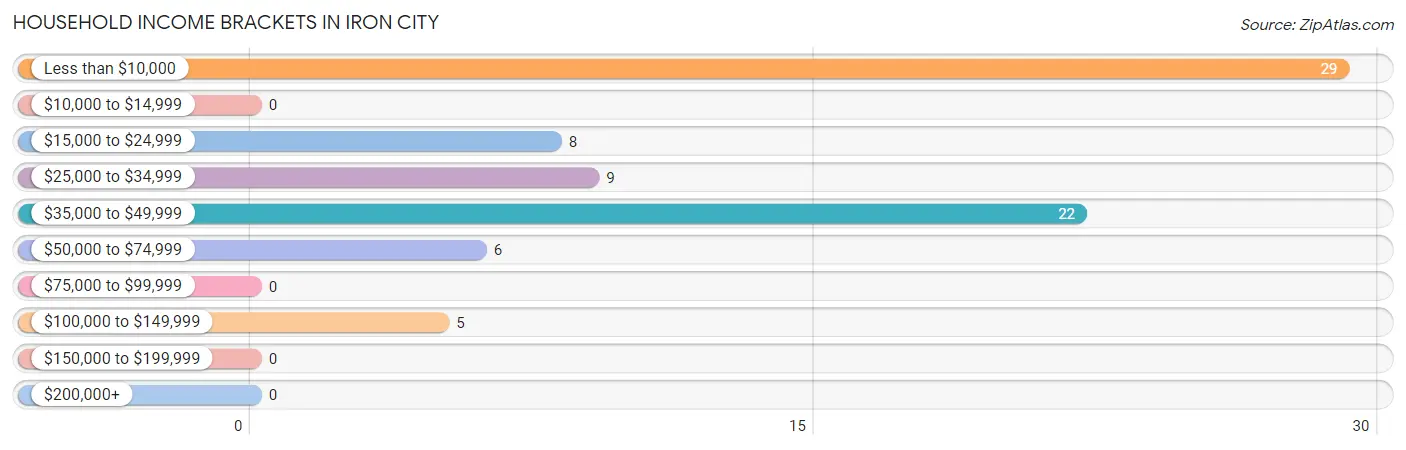
With 29 households falling in the category, the less than $10,000 income range is the most frequent in Iron City, accounting for 36.7% of all households.
| Income Bracket | # Households | % Households |
| Less than $10,000 | 29 | 36.7% |
| $10,000 to $14,999 | 0 | 0.0% |
| $15,000 to $24,999 | 8 | 10.1% |
| $25,000 to $34,999 | 9 | 11.4% |
| $35,000 to $49,999 | 22 | 27.8% |
| $50,000 to $74,999 | 6 | 7.6% |
| $75,000 to $99,999 | 0 | 0.0% |
| $100,000 to $149,999 | 5 | 6.3% |
| $150,000 to $199,999 | 0 | 0.0% |
| $200,000+ | 0 | 0.0% |
Household Income by Householder Age in Iron City
| Income Bracket | # Households | Median Income |
| 15 to 24 Years | 5 (6.3%) | $0 |
| 25 to 44 Years | 0 (0.0%) | $0 |
| 45 to 64 Years | 46 (58.2%) | $0 |
| 65+ Years | 28 (35.4%) | $0 |
| Total | 79 (100.0%) | $0 |
Poverty in Iron City
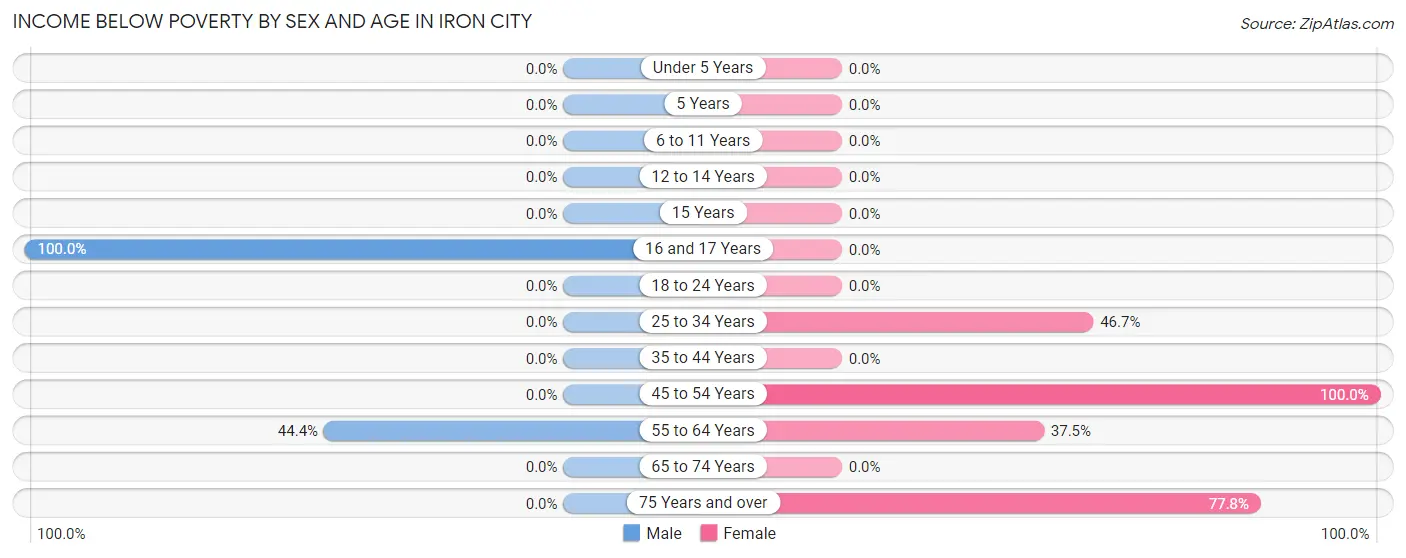
Income Below Poverty by Sex and Age in Iron City
With 48.6% poverty level for males and 47.5% for females among the residents of Iron City, 16 and 17 year old males and 45 to 54 year old females are the most vulnerable to poverty, with 33 males (100.0%) and 5 females (100.0%) in their respective age groups living below the poverty level.
| Age Bracket | Male | Female |
| Under 5 Years | 0 (0.0%) | 0 (0.0%) |
| 5 Years | 0 (0.0%) | 0 (0.0%) |
| 6 to 11 Years | 0 (0.0%) | 0 (0.0%) |
| 12 to 14 Years | 0 (0.0%) | 0 (0.0%) |
| 15 Years | 0 (0.0%) | 0 (0.0%) |
| 16 and 17 Years | 33 (100.0%) | 0 (0.0%) |
| 18 to 24 Years | 0 (0.0%) | 0 (0.0%) |
| 25 to 34 Years | 0 (0.0%) | 7 (46.7%) |
| 35 to 44 Years | 0 (0.0%) | 0 (0.0%) |
| 45 to 54 Years | 0 (0.0%) | 5 (100.0%) |
| 55 to 64 Years | 20 (44.4%) | 3 (37.5%) |
| 65 to 74 Years | 0 (0.0%) | 0 (0.0%) |
| 75 Years and over | 0 (0.0%) | 14 (77.8%) |
| Total | 53 (48.6%) | 29 (47.5%) |
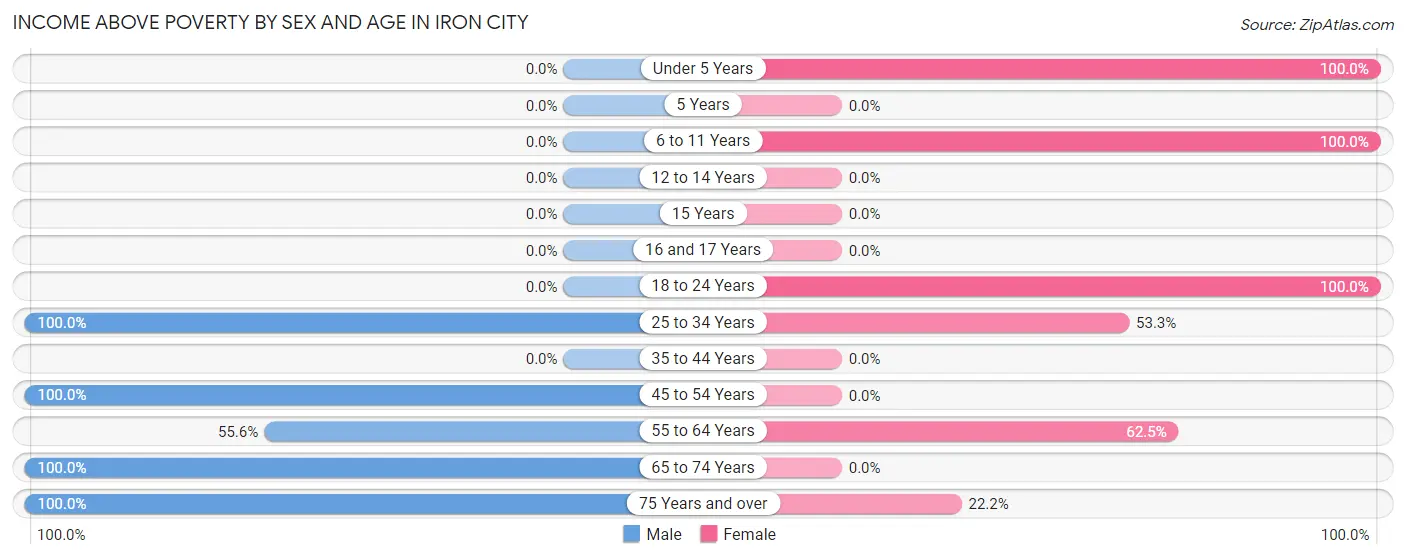
Income Above Poverty by Sex and Age in Iron City
According to the poverty statistics in Iron City, males aged 25 to 34 years and females aged under 5 years are the age groups that are most secure financially, with 100.0% of males and 100.0% of females in these age groups living above the poverty line.
| Age Bracket | Male | Female |
| Under 5 Years | 0 (0.0%) | 5 (100.0%) |
| 5 Years | 0 (0.0%) | 0 (0.0%) |
| 6 to 11 Years | 0 (0.0%) | 5 (100.0%) |
| 12 to 14 Years | 0 (0.0%) | 0 (0.0%) |
| 15 Years | 0 (0.0%) | 0 (0.0%) |
| 16 and 17 Years | 0 (0.0%) | 0 (0.0%) |
| 18 to 24 Years | 0 (0.0%) | 5 (100.0%) |
| 25 to 34 Years | 6 (100.0%) | 8 (53.3%) |
| 35 to 44 Years | 0 (0.0%) | 0 (0.0%) |
| 45 to 54 Years | 15 (100.0%) | 0 (0.0%) |
| 55 to 64 Years | 25 (55.6%) | 5 (62.5%) |
| 65 to 74 Years | 5 (100.0%) | 0 (0.0%) |
| 75 Years and over | 5 (100.0%) | 4 (22.2%) |
| Total | 56 (51.4%) | 32 (52.5%) |
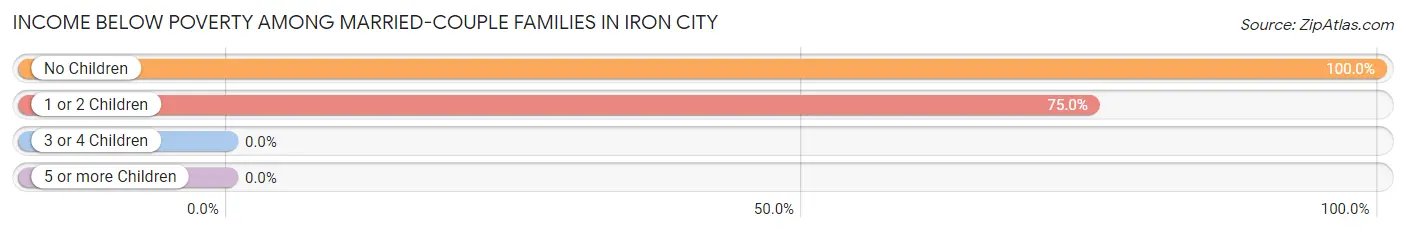
Income Below Poverty Among Married-Couple Families in Iron City
The poverty statistics for married-couple families in Iron City show that 78.3% or 18 of the total 23 families live below the poverty line. Families with no children have the highest poverty rate of 100.0%, comprising of 3 families. On the other hand, families with 1 or 2 children have the lowest poverty rate of 75.0%, which includes 15 families.
| Children | Above Poverty | Below Poverty |
| No Children | 0 (0.0%) | 3 (100.0%) |
| 1 or 2 Children | 5 (25.0%) | 15 (75.0%) |
| 3 or 4 Children | 0 (0.0%) | 0 (0.0%) |
| 5 or more Children | 0 (0.0%) | 0 (0.0%) |
| Total | 5 (21.7%) | 18 (78.3%) |
Income Below Poverty Among Single-Parent Households in Iron City
| Children | Single Father | Single Mother |
| No Children | 0 (0.0%) | 0 (0.0%) |
| 1 or 2 Children | 0 (0.0%) | 0 (0.0%) |
| 3 or 4 Children | 0 (0.0%) | 0 (0.0%) |
| 5 or more Children | 0 (0.0%) | 0 (0.0%) |
| Total | 0 (0.0%) | 0 (0.0%) |
Income Below Poverty Among Married-Couple vs Single-Parent Households in Iron City
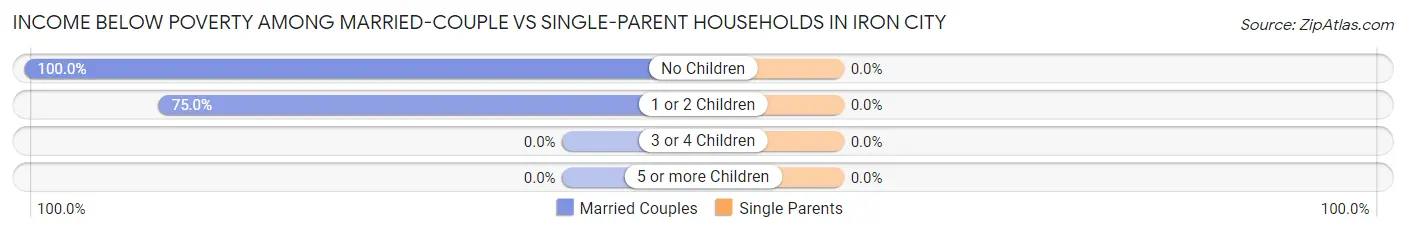
| Children | Married-Couple Families | Single-Parent Households |
| No Children | 3 (100.0%) | 0 (0.0%) |
| 1 or 2 Children | 15 (75.0%) | 0 (0.0%) |
| 3 or 4 Children | 0 (0.0%) | 0 (0.0%) |
| 5 or more Children | 0 (0.0%) | 0 (0.0%) |
| Total | 18 (78.3%) | 0 (0.0%) |
Race in Iron City
The most populous races in Iron City are White / Caucasian (134 | 71.7%), and Two or more Races (53 | 28.3%).
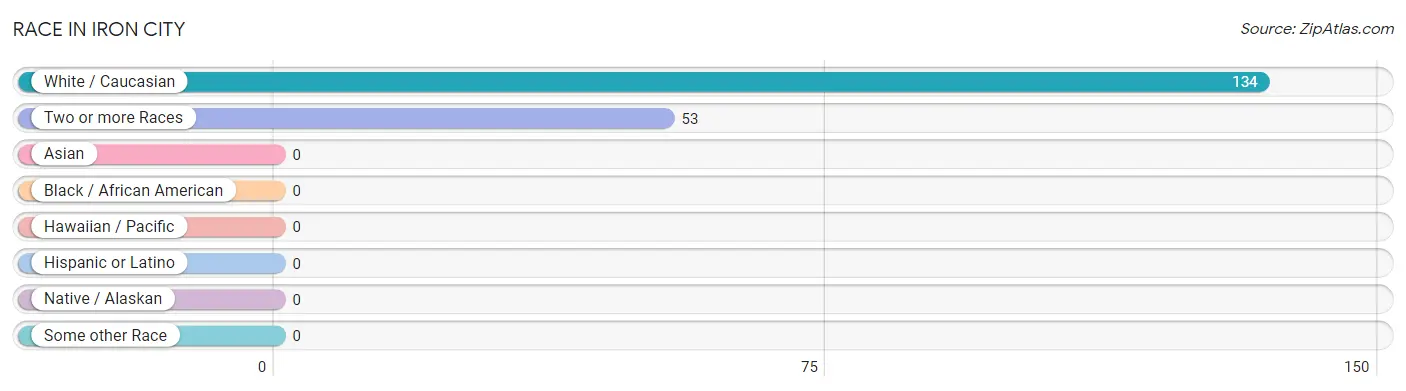
| Race | # Population | % Population |
| Asian | 0 | 0.0% |
| Black / African American | 0 | 0.0% |
| Hawaiian / Pacific | 0 | 0.0% |
| Hispanic or Latino | 0 | 0.0% |
| Native / Alaskan | 0 | 0.0% |
| White / Caucasian | 134 | 71.7% |
| Two or more Races | 53 | 28.3% |
| Some other Race | 0 | 0.0% |
| Total | 187 | 100.0% |
Ancestry in Iron City
The most populous ancestries reported in Iron City are Cherokee (53 | 28.3%), Dutch (38 | 20.3%), English (38 | 20.3%), American (34 | 18.2%), and German (15 | 8.0%), together accounting for 95.2% of all Iron City residents.
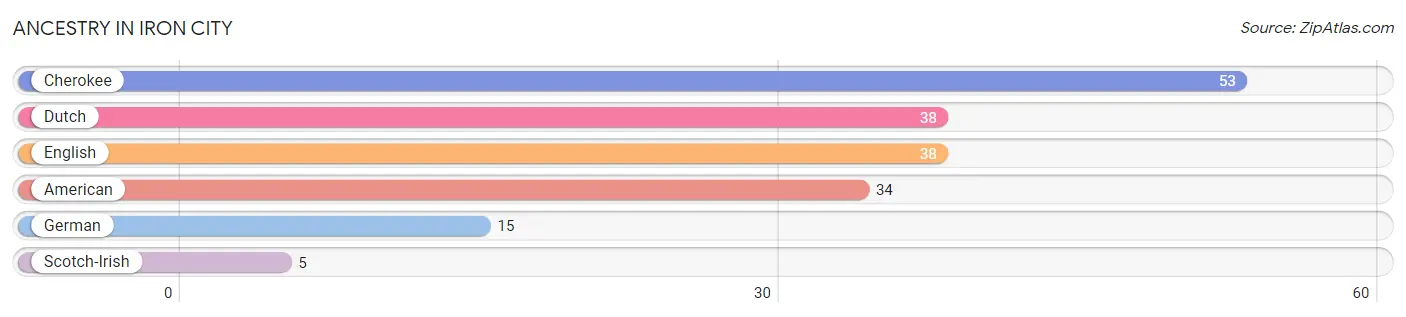
| Ancestry | # Population | % Population |
| American | 34 | 18.2% |
| Cherokee | 53 | 28.3% |
| Dutch | 38 | 20.3% |
| English | 38 | 20.3% |
| German | 15 | 8.0% |
| Scotch-Irish | 5 | 2.7% | View All 6 Rows |
Immigrants in Iron City

| Immigration Origin | # Population | % Population | View All 0 Rows |
Sex and Age in Iron City
Sex and Age in Iron City
The most populous age groups in Iron City are 15 to 19 Years (33 | 27.3%) for men and 75 to 79 Years (18 | 27.3%) for women.
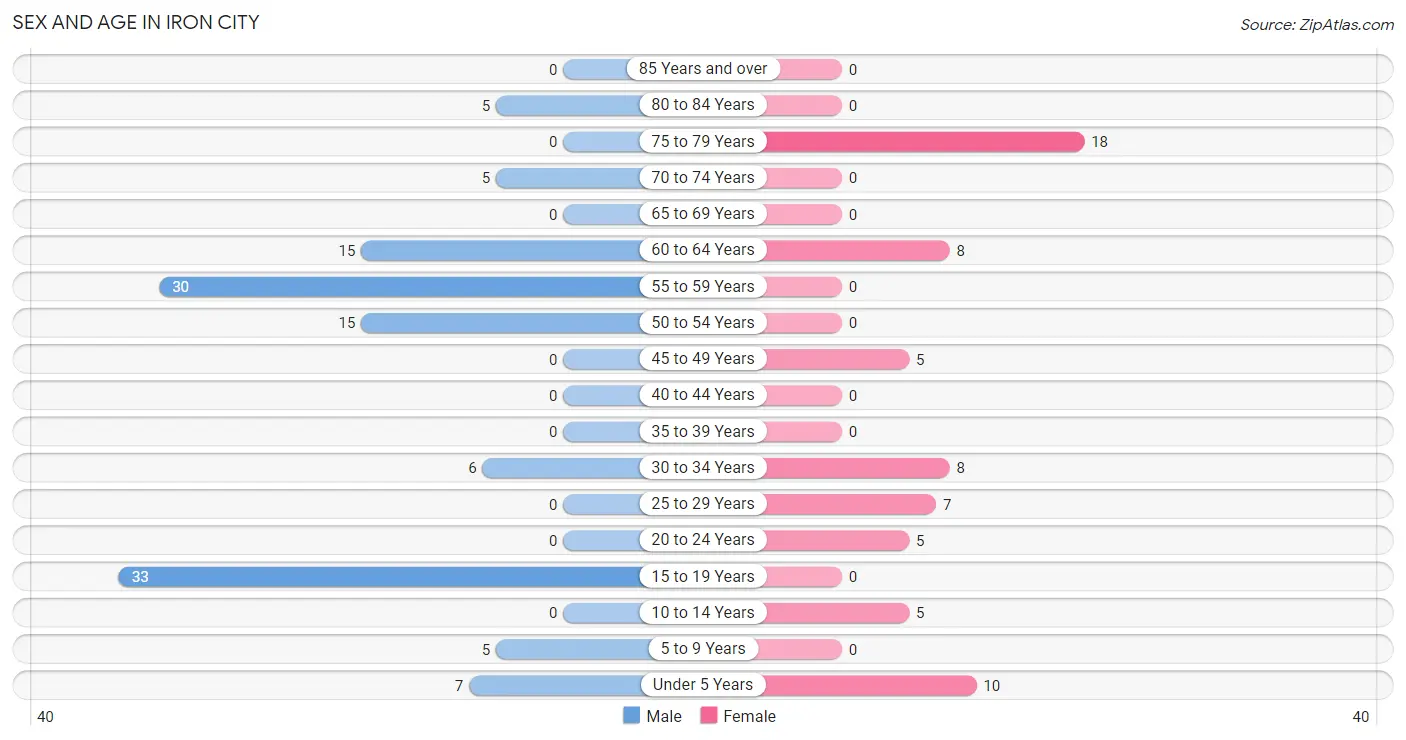
| Age Bracket | Male | Female |
| Under 5 Years | 7 (5.8%) | 10 (15.1%) |
| 5 to 9 Years | 5 (4.1%) | 0 (0.0%) |
| 10 to 14 Years | 0 (0.0%) | 5 (7.6%) |
| 15 to 19 Years | 33 (27.3%) | 0 (0.0%) |
| 20 to 24 Years | 0 (0.0%) | 5 (7.6%) |
| 25 to 29 Years | 0 (0.0%) | 7 (10.6%) |
| 30 to 34 Years | 6 (5.0%) | 8 (12.1%) |
| 35 to 39 Years | 0 (0.0%) | 0 (0.0%) |
| 40 to 44 Years | 0 (0.0%) | 0 (0.0%) |
| 45 to 49 Years | 0 (0.0%) | 5 (7.6%) |
| 50 to 54 Years | 15 (12.4%) | 0 (0.0%) |
| 55 to 59 Years | 30 (24.8%) | 0 (0.0%) |
| 60 to 64 Years | 15 (12.4%) | 8 (12.1%) |
| 65 to 69 Years | 0 (0.0%) | 0 (0.0%) |
| 70 to 74 Years | 5 (4.1%) | 0 (0.0%) |
| 75 to 79 Years | 0 (0.0%) | 18 (27.3%) |
| 80 to 84 Years | 5 (4.1%) | 0 (0.0%) |
| 85 Years and over | 0 (0.0%) | 0 (0.0%) |
| Total | 121 (100.0%) | 66 (100.0%) |
Families and Households in Iron City
Median Family Size in Iron City
The median family size in Iron City is 3.21 persons per family, with married-couple families (23 | 60.5%) accounting for the largest median family size of 3.35 persons per family. On the other hand, single male/father families (11 | 28.9%) represent the smallest median family size with 3.00 persons per family.
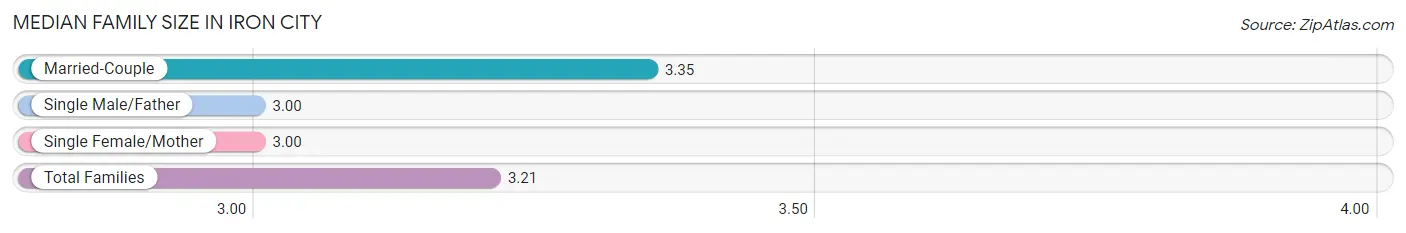
| Family Type | # Families | Family Size |
| Married-Couple | 23 (60.5%) | 3.35 |
| Single Male/Father | 11 (28.9%) | 3.00 |
| Single Female/Mother | 4 (10.5%) | 3.00 |
| Total Families | 38 (100.0%) | 3.21 |
Median Household Size in Iron City
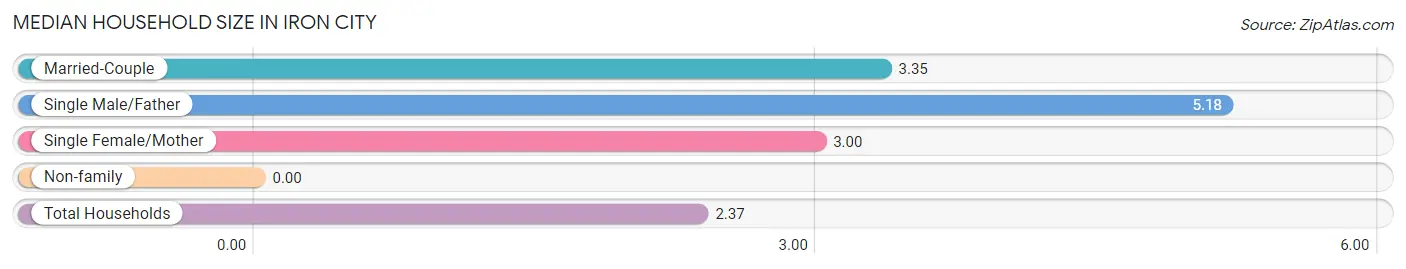
| Household Type | # Households | Household Size |
| Married-Couple | 23 (29.1%) | 3.35 |
| Single Male/Father | 11 (13.9%) | 5.18 |
| Single Female/Mother | 4 (5.1%) | 3.00 |
| Non-family | 41 (51.9%) | - |
| Total Households | 79 (100.0%) | 2.37 |
Household Size by Marriage Status in Iron City
Out of a total of 79 households in Iron City, 38 (48.1%) are family households, while 41 (51.9%) are nonfamily households. The most numerous type of family households are 3-person households, comprising 25, and the most common type of nonfamily households are 1-person households, comprising 41.
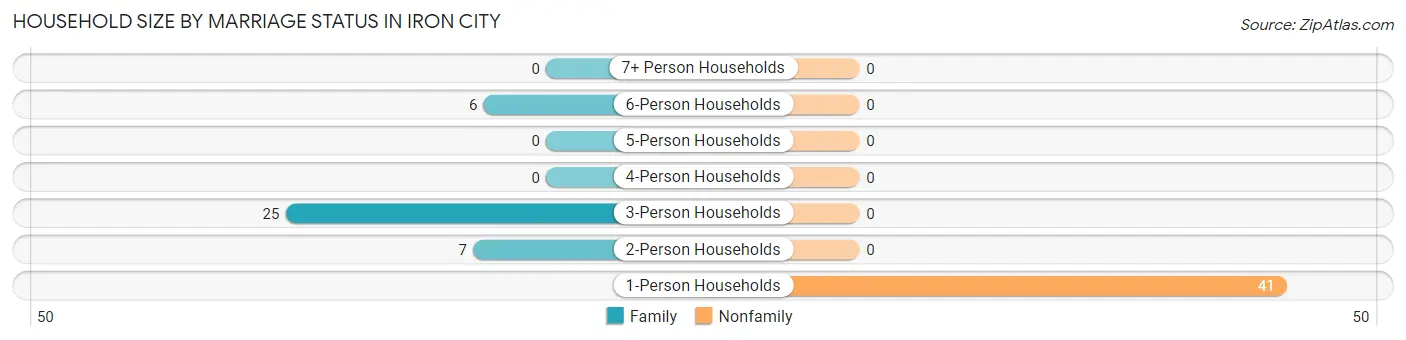
| Household Size | Family Households | Nonfamily Households |
| 1-Person Households | - | 41 (51.9%) |
| 2-Person Households | 7 (8.9%) | 0 (0.0%) |
| 3-Person Households | 25 (31.7%) | 0 (0.0%) |
| 4-Person Households | 0 (0.0%) | 0 (0.0%) |
| 5-Person Households | 0 (0.0%) | 0 (0.0%) |
| 6-Person Households | 6 (7.6%) | 0 (0.0%) |
| 7+ Person Households | 0 (0.0%) | 0 (0.0%) |
| Total | 38 (48.1%) | 41 (51.9%) |
Female Fertility in Iron City
Fertility by Age in Iron City
| Age Bracket | Women with Births | Births / 1,000 Women |
| 15 to 19 years | 0 (0.0%) | 0.0 |
| 20 to 34 years | 0 (0.0%) | 0.0 |
| 35 to 50 years | 0 (0.0%) | 0.0 |
| Total | 0 (0.0%) | 0.0 |
Fertility by Age by Marriage Status in Iron City
| Age Bracket | Married | Unmarried |
| 15 to 19 years | 0 (0.0%) | 0 (0.0%) |
| 20 to 34 years | 0 (0.0%) | 0 (0.0%) |
| 35 to 50 years | 0 (0.0%) | 0 (0.0%) |
| Total | 0 (0.0%) | 0 (0.0%) |
Fertility by Education in Iron City
| Educational Attainment | Women with Births | Births / 1,000 Women |
| Less than High School | 0 (0.0%) | 0.0 |
| High School Diploma | 0 (0.0%) | 0.0 |
| College or Associate's Degree | 0 (0.0%) | 0.0 |
| Bachelor's Degree | 0 (0.0%) | 0.0 |
| Graduate Degree | 0 (0.0%) | 0.0 |
| Total | 0 (0.0%) | 0.0 |
Fertility by Education by Marriage Status in Iron City
| Educational Attainment | Married | Unmarried |
| Less than High School | 0 (0.0%) | 0 (0.0%) |
| High School Diploma | 0 (0.0%) | 0 (0.0%) |
| College or Associate's Degree | 0 (0.0%) | 0 (0.0%) |
| Bachelor's Degree | 0 (0.0%) | 0 (0.0%) |
| Graduate Degree | 0 (0.0%) | 0 (0.0%) |
| Total | 0 (0.0%) | 0 (0.0%) |
Employment Characteristics in Iron City
Employment by Class of Employer in Iron City
Among the 66 employed individuals in Iron City, private company employees (41 | 62.1%), local government employees (19 | 28.8%), and self-employed (not incorporated) (6 | 9.1%) make up the most common classes of employment.
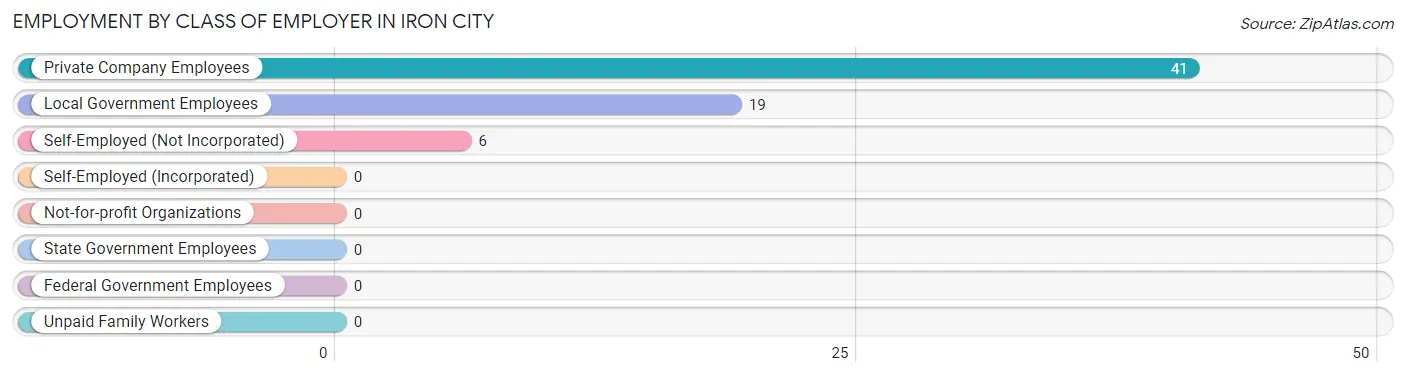
| Employer Class | # Employees | % Employees |
| Private Company Employees | 41 | 62.1% |
| Self-Employed (Incorporated) | 0 | 0.0% |
| Self-Employed (Not Incorporated) | 6 | 9.1% |
| Not-for-profit Organizations | 0 | 0.0% |
| Local Government Employees | 19 | 28.8% |
| State Government Employees | 0 | 0.0% |
| Federal Government Employees | 0 | 0.0% |
| Unpaid Family Workers | 0 | 0.0% |
| Total | 66 | 100.0% |
Employment Status by Age in Iron City
According to the labor force statistics for Iron City, out of the total population over 16 years of age (160), 53.8% or 86 individuals are in the labor force, with 23.3% or 20 of them unemployed. The age group with the highest labor force participation rate is 20 to 24 years, with 100.0% or 5 individuals in the labor force. Within the labor force, the 60 to 64 years age range has the highest percentage of unemployed individuals, with 100.0% or 15 of them being unemployed.
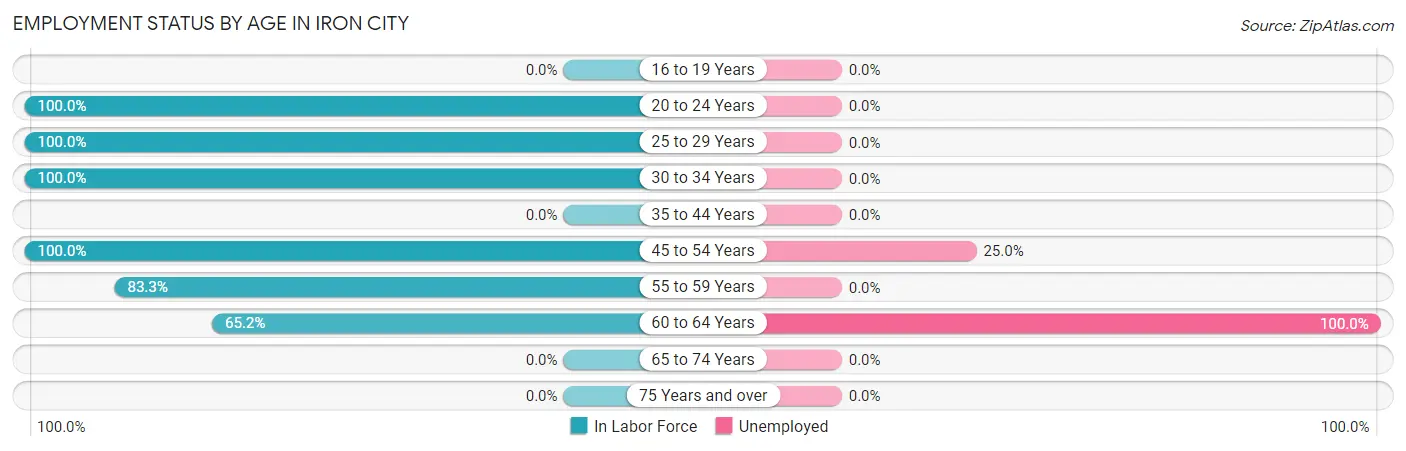
| Age Bracket | In Labor Force | Unemployed |
| 16 to 19 Years | 0 (0.0%) | 0 (0.0%) |
| 20 to 24 Years | 5 (100.0%) | 0 (0.0%) |
| 25 to 29 Years | 7 (100.0%) | 0 (0.0%) |
| 30 to 34 Years | 14 (100.0%) | 0 (0.0%) |
| 35 to 44 Years | 0 (0.0%) | 0 (0.0%) |
| 45 to 54 Years | 20 (100.0%) | 5 (25.0%) |
| 55 to 59 Years | 25 (83.3%) | 0 (0.0%) |
| 60 to 64 Years | 15 (65.2%) | 15 (100.0%) |
| 65 to 74 Years | 0 (0.0%) | 0 (0.0%) |
| 75 Years and over | 0 (0.0%) | 0 (0.0%) |
| Total | 86 (53.8%) | 20 (23.3%) |
Employment Status by Educational Attainment in Iron City
According to labor force statistics for Iron City, 86.2% of individuals (81) out of the total population between 25 and 64 years of age (94) are in the labor force, with 24.7% or 20 of them being unemployed. The group with the highest labor force participation rate are those with the educational attainment of college / associate degree, with 100.0% or 11 individuals in the labor force. Within the labor force, individuals with college / associate degree education have the highest percentage of unemployment, with 45.5% or 5 of them being unemployed.
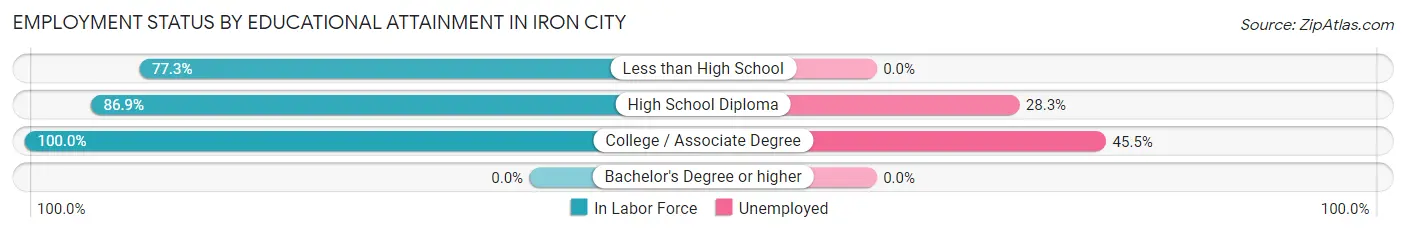
| Educational Attainment | In Labor Force | Unemployed |
| Less than High School | 17 (77.3%) | 0 (0.0%) |
| High School Diploma | 53 (86.9%) | 17 (28.3%) |
| College / Associate Degree | 11 (100.0%) | 5 (45.5%) |
| Bachelor's Degree or higher | 0 (0.0%) | 0 (0.0%) |
| Total | 81 (86.2%) | 23 (24.7%) |
Employment Occupations by Sex in Iron City
Management, Business, Science and Arts Occupations
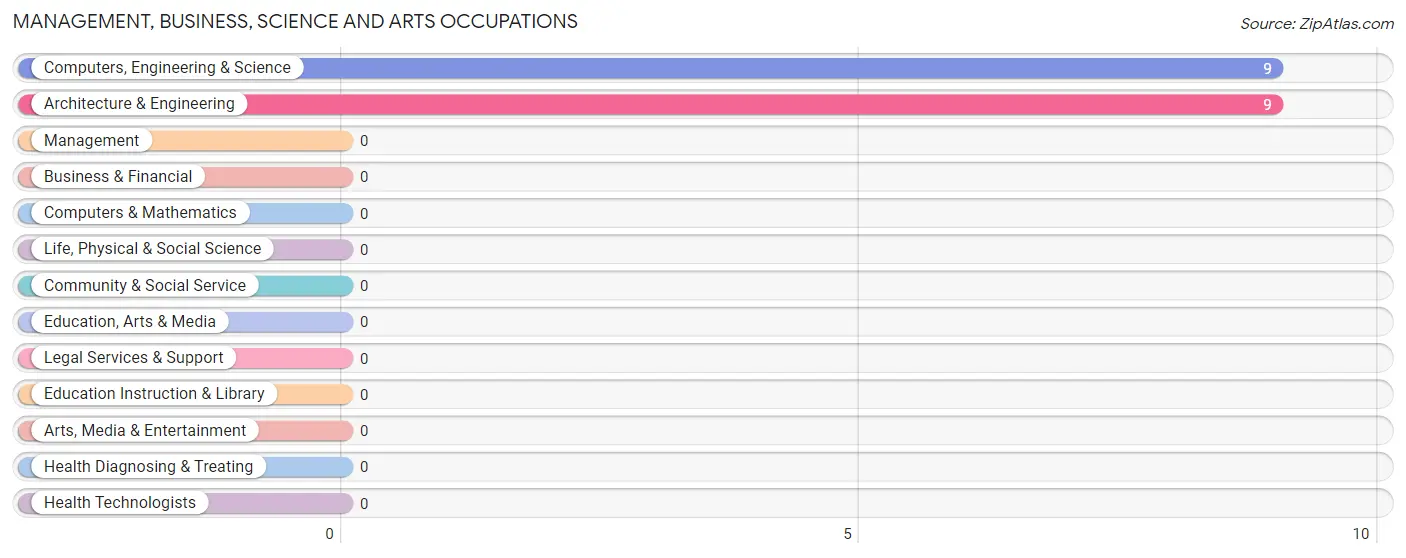
The most common Management, Business, Science and Arts occupations in Iron City are Computers, Engineering & Science (9 | 13.6%), and Architecture & Engineering (9 | 13.6%).
Management, Business, Science and Arts Occupations by Sex
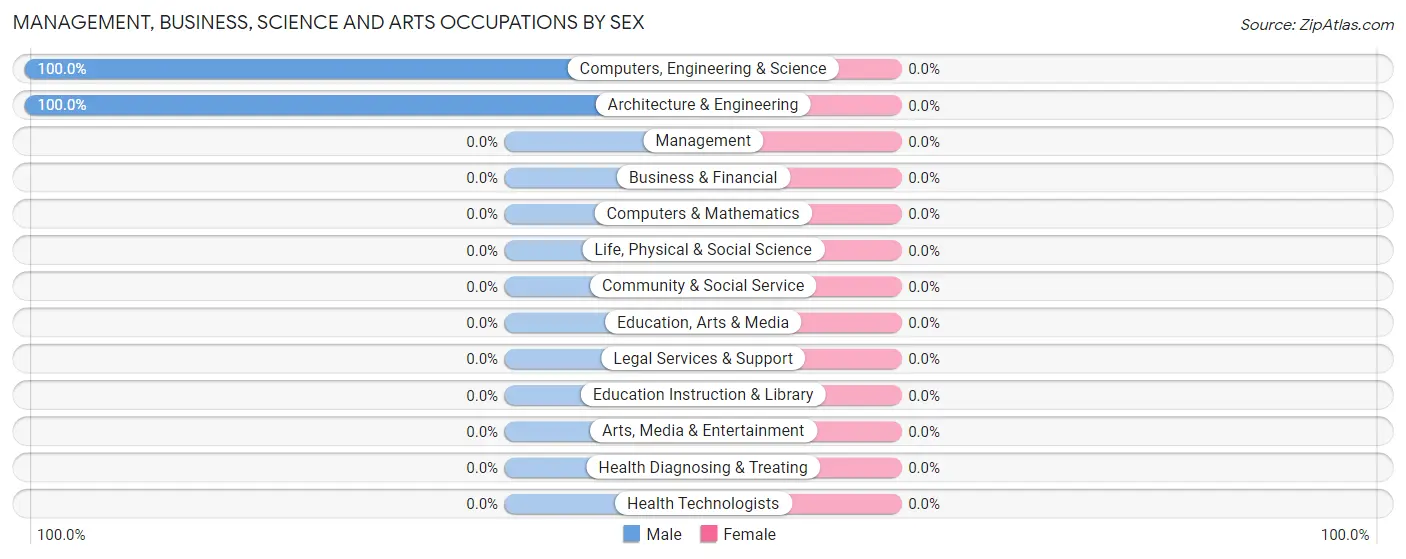
| Occupation | Male | Female |
| Management | 0 (0.0%) | 0 (0.0%) |
| Business & Financial | 0 (0.0%) | 0 (0.0%) |
| Computers, Engineering & Science | 9 (100.0%) | 0 (0.0%) |
| Computers & Mathematics | 0 (0.0%) | 0 (0.0%) |
| Architecture & Engineering | 9 (100.0%) | 0 (0.0%) |
| Life, Physical & Social Science | 0 (0.0%) | 0 (0.0%) |
| Community & Social Service | 0 (0.0%) | 0 (0.0%) |
| Education, Arts & Media | 0 (0.0%) | 0 (0.0%) |
| Legal Services & Support | 0 (0.0%) | 0 (0.0%) |
| Education Instruction & Library | 0 (0.0%) | 0 (0.0%) |
| Arts, Media & Entertainment | 0 (0.0%) | 0 (0.0%) |
| Health Diagnosing & Treating | 0 (0.0%) | 0 (0.0%) |
| Health Technologists | 0 (0.0%) | 0 (0.0%) |
| Total (Category) | 9 (100.0%) | 0 (0.0%) |
| Total (Overall) | 46 (69.7%) | 20 (30.3%) |
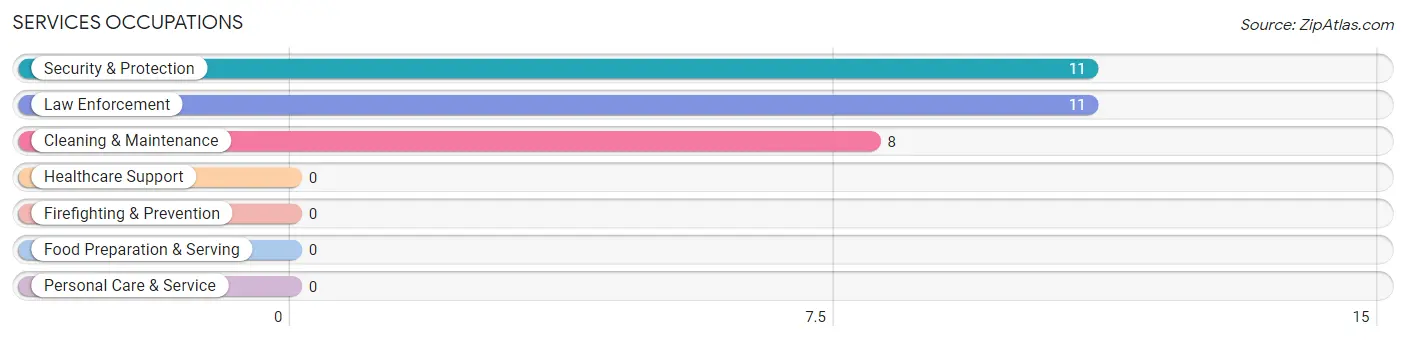
Services Occupations
The most common Services occupations in Iron City are Security & Protection (11 | 16.7%), Law Enforcement (11 | 16.7%), and Cleaning & Maintenance (8 | 12.1%).
Services Occupations by Sex
Within the Services occupations in Iron City, the most male-oriented occupations are Cleaning & Maintenance (100.0%), Security & Protection (54.5%), and Law Enforcement (54.5%), while the most female-oriented occupations are Security & Protection (45.5%), and Law Enforcement (45.5%).
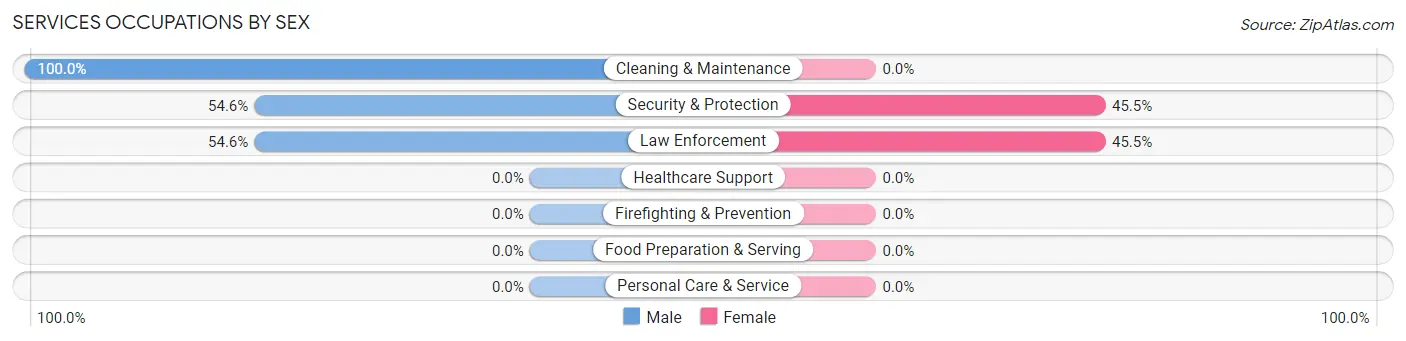
| Occupation | Male | Female |
| Healthcare Support | 0 (0.0%) | 0 (0.0%) |
| Security & Protection | 6 (54.5%) | 5 (45.5%) |
| Firefighting & Prevention | 0 (0.0%) | 0 (0.0%) |
| Law Enforcement | 6 (54.5%) | 5 (45.5%) |
| Food Preparation & Serving | 0 (0.0%) | 0 (0.0%) |
| Cleaning & Maintenance | 8 (100.0%) | 0 (0.0%) |
| Personal Care & Service | 0 (0.0%) | 0 (0.0%) |
| Total (Category) | 14 (73.7%) | 5 (26.3%) |
| Total (Overall) | 46 (69.7%) | 20 (30.3%) |
Sales and Office Occupations
Sales and Office Occupations by Sex
| Occupation | Male | Female |
| Sales & Related | 0 (0.0%) | 0 (0.0%) |
| Office & Administration | 0 (0.0%) | 0 (0.0%) |
| Total (Category) | 0 (0.0%) | 0 (0.0%) |
| Total (Overall) | 46 (69.7%) | 20 (30.3%) |
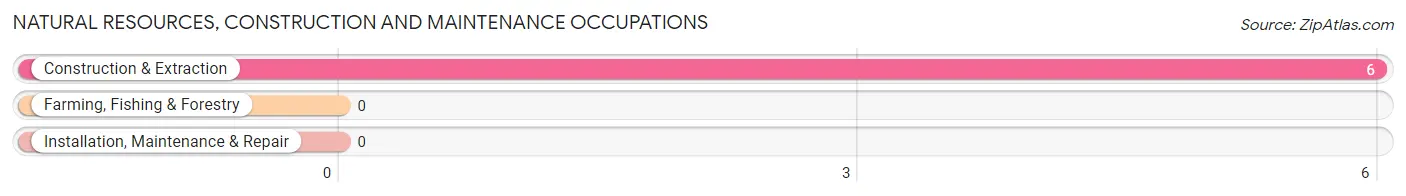
Natural Resources, Construction and Maintenance Occupations
The most common Natural Resources, Construction and Maintenance occupations in Iron City are , and Construction & Extraction (6 | 9.1%).
Natural Resources, Construction and Maintenance Occupations by Sex
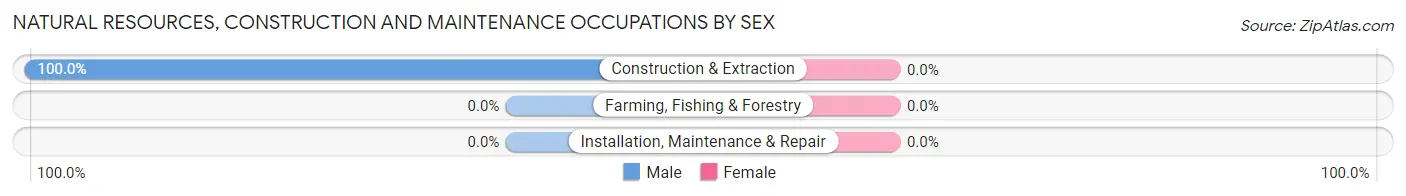
| Occupation | Male | Female |
| Farming, Fishing & Forestry | 0 (0.0%) | 0 (0.0%) |
| Construction & Extraction | 6 (100.0%) | 0 (0.0%) |
| Installation, Maintenance & Repair | 0 (0.0%) | 0 (0.0%) |
| Total (Category) | 6 (100.0%) | 0 (0.0%) |
| Total (Overall) | 46 (69.7%) | 20 (30.3%) |
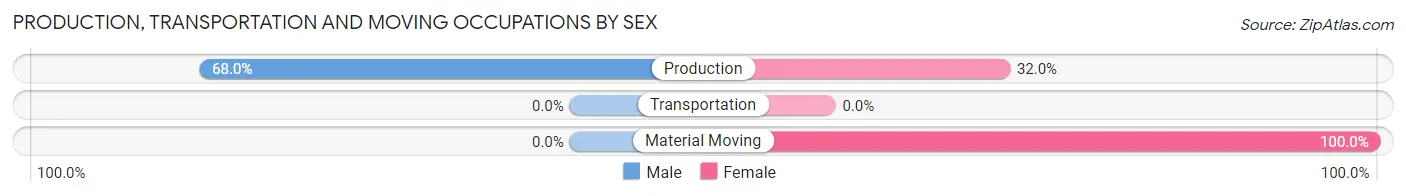
Production, Transportation and Moving Occupations
The most common Production, Transportation and Moving occupations in Iron City are Production (25 | 37.9%), and Material Moving (7 | 10.6%).
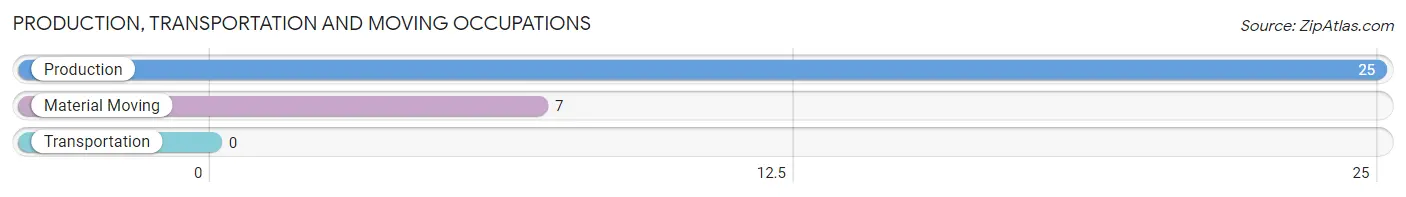
Production, Transportation and Moving Occupations by Sex
| Occupation | Male | Female |
| Production | 17 (68.0%) | 8 (32.0%) |
| Transportation | 0 (0.0%) | 0 (0.0%) |
| Material Moving | 0 (0.0%) | 7 (100.0%) |
| Total (Category) | 17 (53.1%) | 15 (46.9%) |
| Total (Overall) | 46 (69.7%) | 20 (30.3%) |
Employment Industries by Sex in Iron City
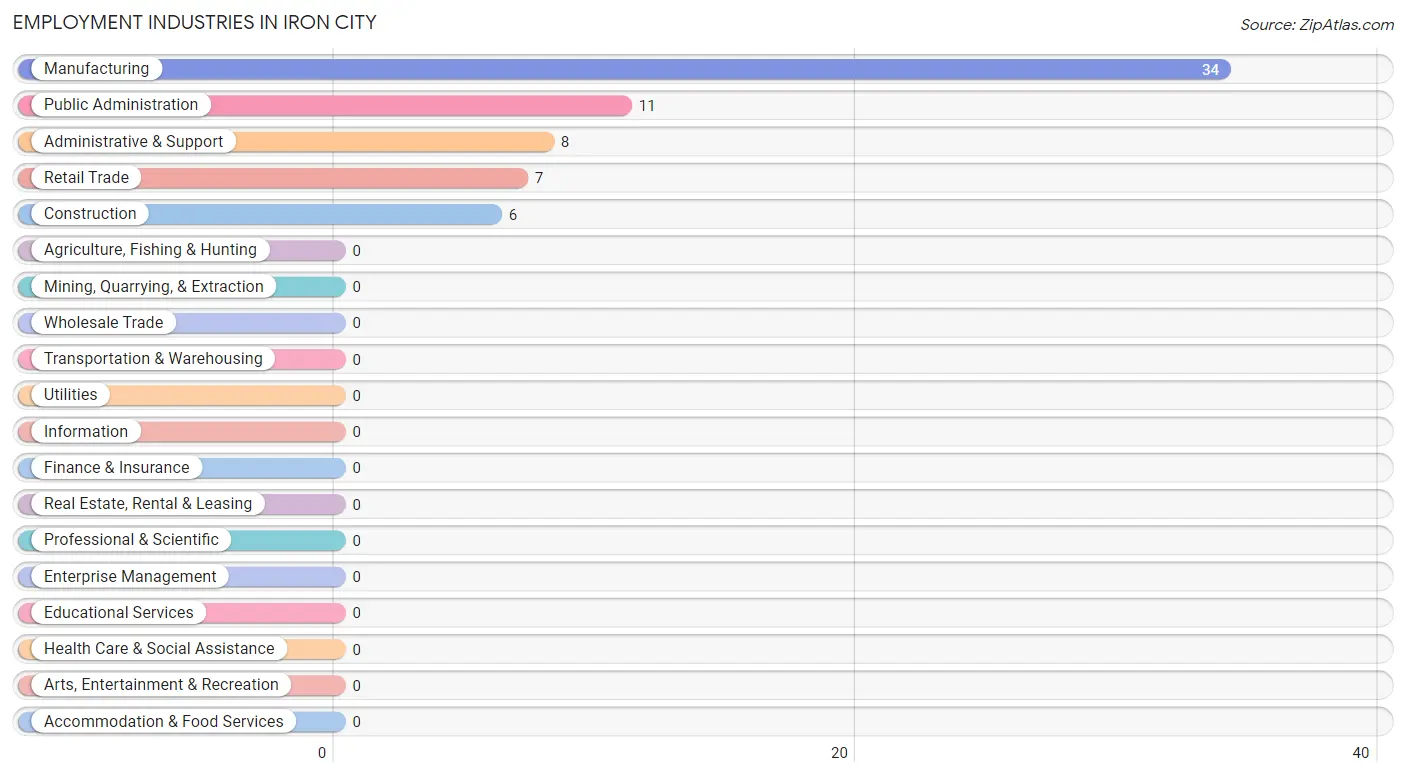
Employment Industries in Iron City
The major employment industries in Iron City include Manufacturing (34 | 51.5%), Public Administration (11 | 16.7%), Administrative & Support (8 | 12.1%), Retail Trade (7 | 10.6%), and Construction (6 | 9.1%).
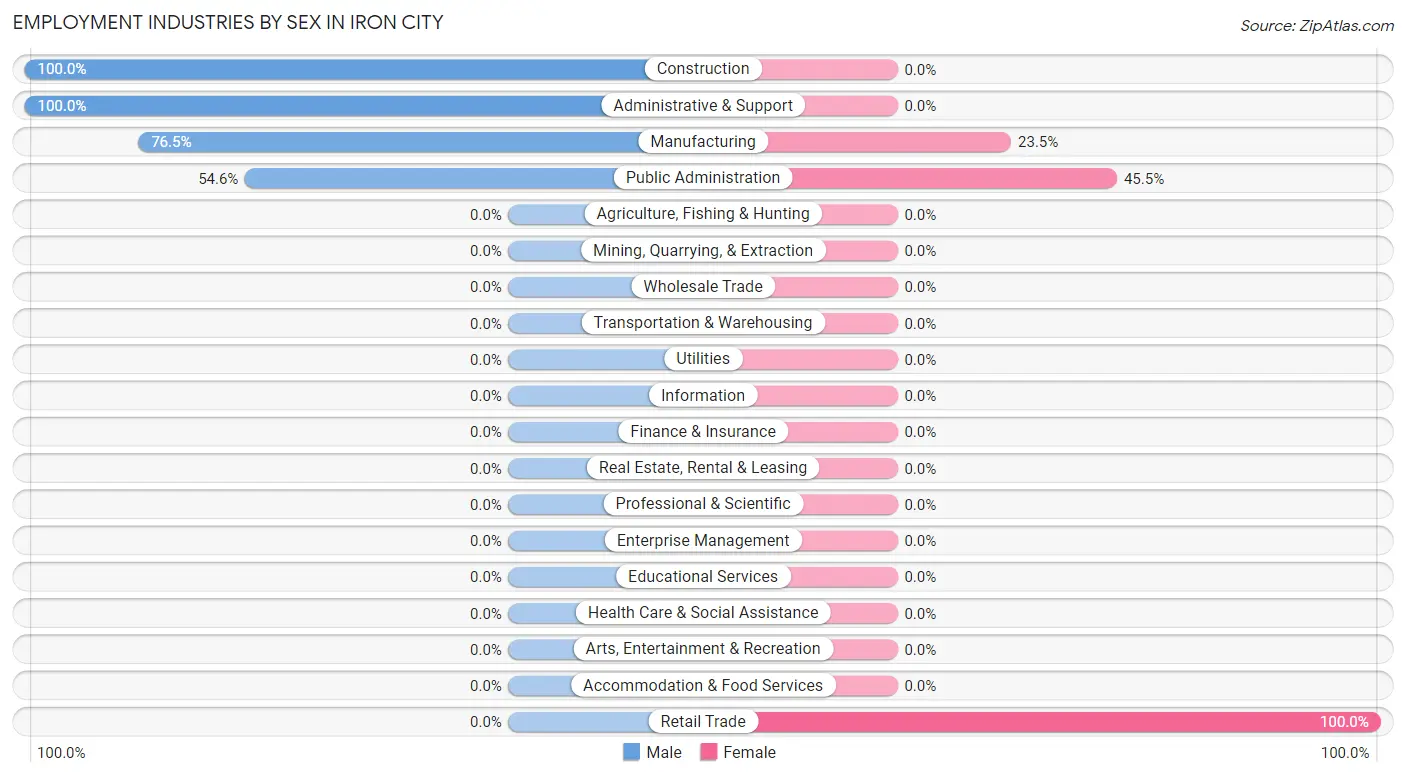
Employment Industries by Sex in Iron City
The Iron City industries that see more men than women are Construction (100.0%), Administrative & Support (100.0%), and Manufacturing (76.5%), whereas the industries that tend to have a higher number of women are Retail Trade (100.0%), Public Administration (45.5%), and Manufacturing (23.5%).
| Industry | Male | Female |
| Agriculture, Fishing & Hunting | 0 (0.0%) | 0 (0.0%) |
| Mining, Quarrying, & Extraction | 0 (0.0%) | 0 (0.0%) |
| Construction | 6 (100.0%) | 0 (0.0%) |
| Manufacturing | 26 (76.5%) | 8 (23.5%) |
| Wholesale Trade | 0 (0.0%) | 0 (0.0%) |
| Retail Trade | 0 (0.0%) | 7 (100.0%) |
| Transportation & Warehousing | 0 (0.0%) | 0 (0.0%) |
| Utilities | 0 (0.0%) | 0 (0.0%) |
| Information | 0 (0.0%) | 0 (0.0%) |
| Finance & Insurance | 0 (0.0%) | 0 (0.0%) |
| Real Estate, Rental & Leasing | 0 (0.0%) | 0 (0.0%) |
| Professional & Scientific | 0 (0.0%) | 0 (0.0%) |
| Enterprise Management | 0 (0.0%) | 0 (0.0%) |
| Administrative & Support | 8 (100.0%) | 0 (0.0%) |
| Educational Services | 0 (0.0%) | 0 (0.0%) |
| Health Care & Social Assistance | 0 (0.0%) | 0 (0.0%) |
| Arts, Entertainment & Recreation | 0 (0.0%) | 0 (0.0%) |
| Accommodation & Food Services | 0 (0.0%) | 0 (0.0%) |
| Public Administration | 6 (54.5%) | 5 (45.5%) |
| Total | 46 (69.7%) | 20 (30.3%) |
Education in Iron City
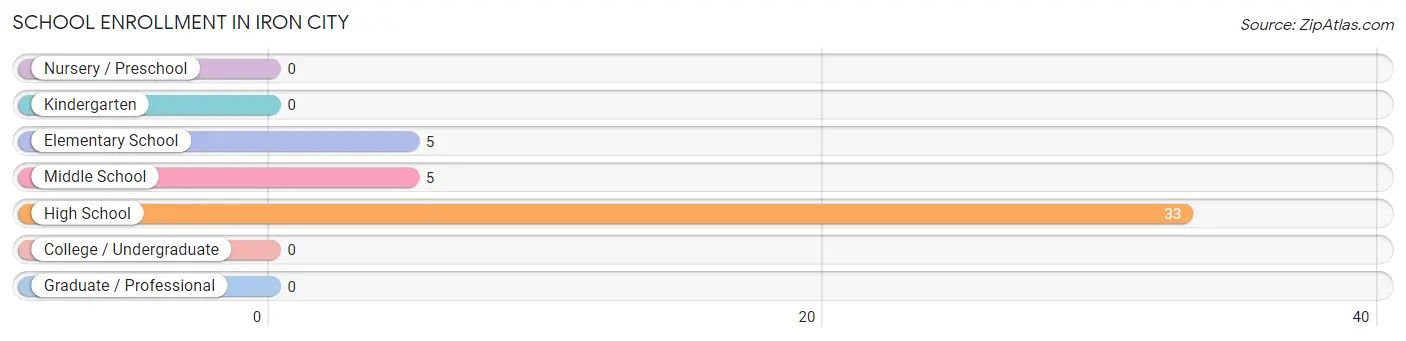
School Enrollment in Iron City
The most common levels of schooling among the 43 students in Iron City are high school (33 | 76.7%), elementary school (5 | 11.6%), and middle school (5 | 11.6%).
| School Level | # Students | % Students |
| Nursery / Preschool | 0 | 0.0% |
| Kindergarten | 0 | 0.0% |
| Elementary School | 5 | 11.6% |
| Middle School | 5 | 11.6% |
| High School | 33 | 76.7% |
| College / Undergraduate | 0 | 0.0% |
| Graduate / Professional | 0 | 0.0% |
| Total | 43 | 100.0% |
School Enrollment by Age by Funding Source in Iron City
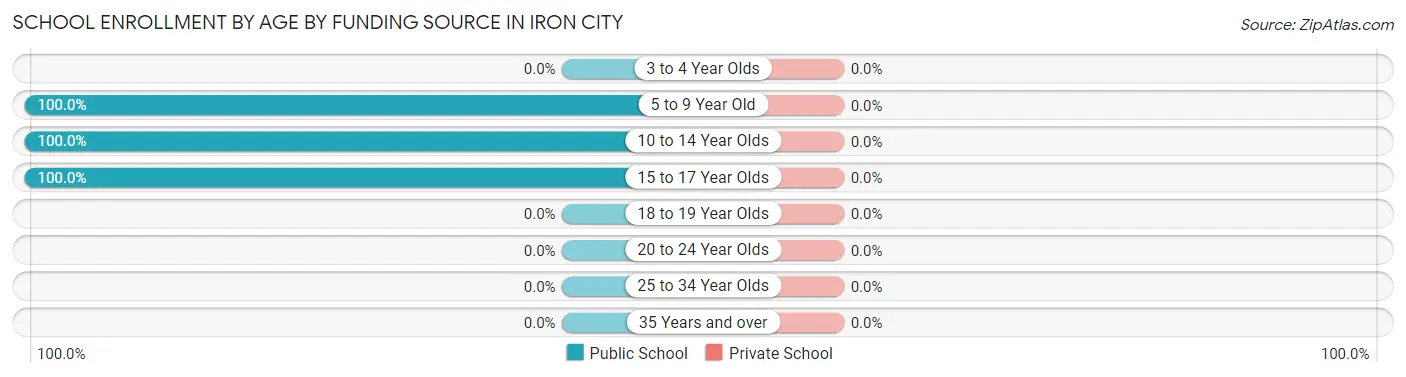
| Age Bracket | Public School | Private School |
| 3 to 4 Year Olds | 0 (0.0%) | 0 (0.0%) |
| 5 to 9 Year Old | 5 (100.0%) | 0 (0.0%) |
| 10 to 14 Year Olds | 5 (100.0%) | 0 (0.0%) |
| 15 to 17 Year Olds | 33 (100.0%) | 0 (0.0%) |
| 18 to 19 Year Olds | 0 (0.0%) | 0 (0.0%) |
| 20 to 24 Year Olds | 0 (0.0%) | 0 (0.0%) |
| 25 to 34 Year Olds | 0 (0.0%) | 0 (0.0%) |
| 35 Years and over | 0 (0.0%) | 0 (0.0%) |
| Total | 43 (100.0%) | 0 (0.0%) |
Educational Attainment by Field of Study in Iron City
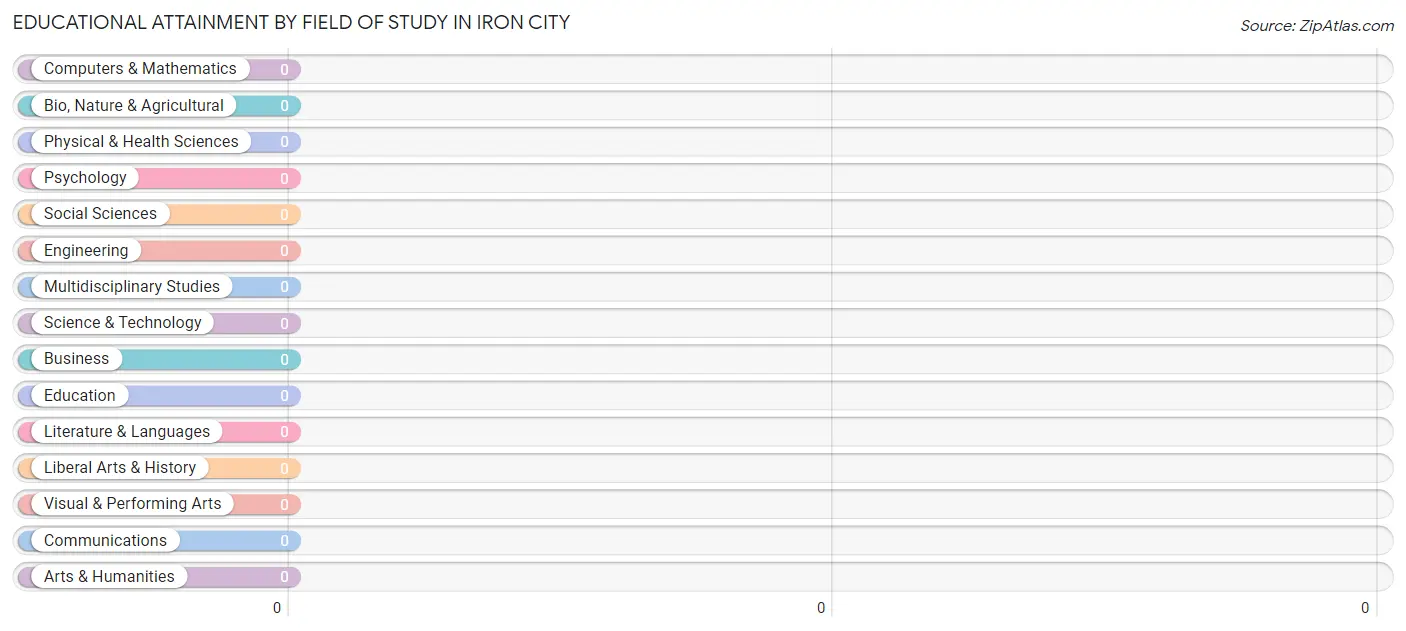
| Field of Study | # Graduates | % Graduates |
| Computers & Mathematics | 0 | 0.0% |
| Bio, Nature & Agricultural | 0 | 0.0% |
| Physical & Health Sciences | 0 | 0.0% |
| Psychology | 0 | 0.0% |
| Social Sciences | 0 | 0.0% |
| Engineering | 0 | 0.0% |
| Multidisciplinary Studies | 0 | 0.0% |
| Science & Technology | 0 | 0.0% |
| Business | 0 | 0.0% |
| Education | 0 | 0.0% |
| Literature & Languages | 0 | 0.0% |
| Liberal Arts & History | 0 | 0.0% |
| Visual & Performing Arts | 0 | 0.0% |
| Communications | 0 | 0.0% |
| Arts & Humanities | 0 | 0.0% |
| Total | 0 | 0.0% |
Transportation & Commute in Iron City
Vehicle Availability by Sex in Iron City
The most prevalent vehicle ownership categories in Iron City are males with 2 vehicles (29, accounting for 63.0%) and females with 2 vehicles (12, making up 145.0%).
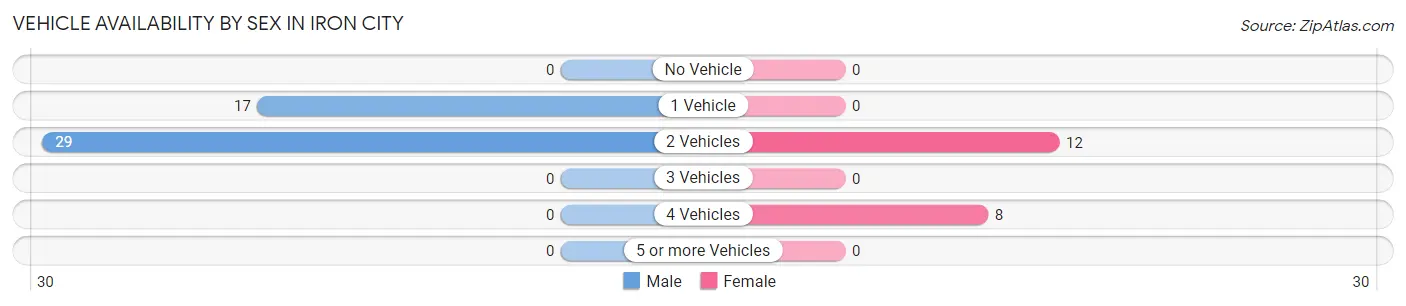
| Vehicles Available | Male | Female |
| No Vehicle | 0 (0.0%) | 0 (0.0%) |
| 1 Vehicle | 17 (37.0%) | 0 (0.0%) |
| 2 Vehicles | 29 (63.0%) | 12 (60.0%) |
| 3 Vehicles | 0 (0.0%) | 0 (0.0%) |
| 4 Vehicles | 0 (0.0%) | 8 (40.0%) |
| 5 or more Vehicles | 0 (0.0%) | 0 (0.0%) |
| Total | 46 (100.0%) | 20 (100.0%) |
Commute Time in Iron City
The most frequently occuring commute durations in Iron City are 40 to 44 minutes (17 commuters, 40.5%), 30 to 34 minutes (11 commuters, 26.2%), and 10 to 14 minutes (8 commuters, 19.1%).
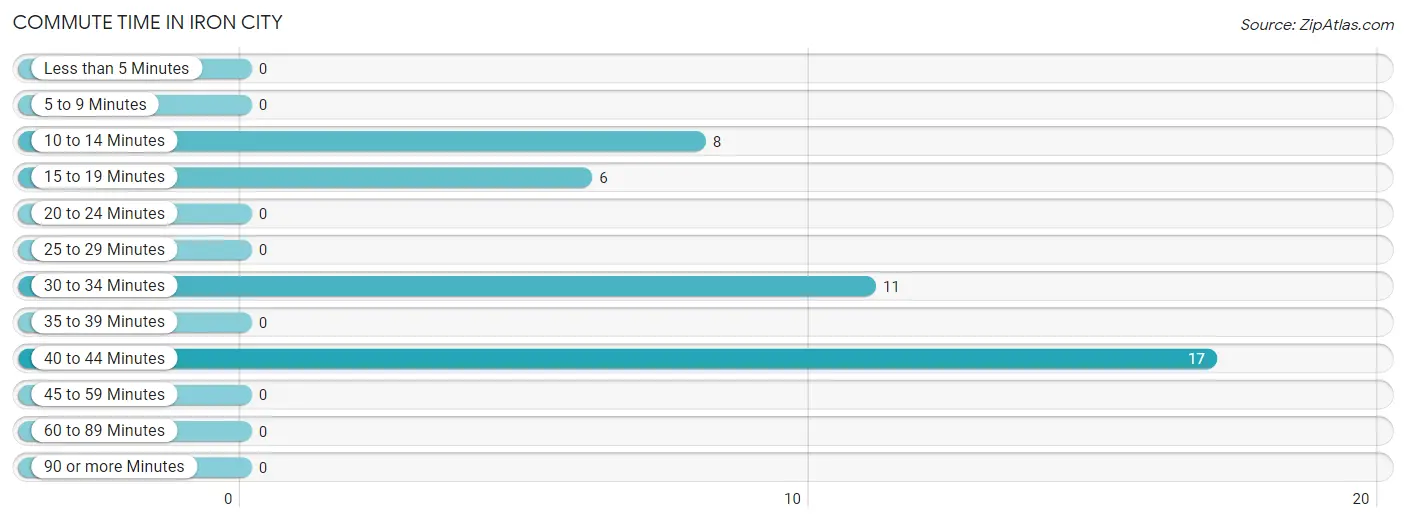
| Commute Time | # Commuters | % Commuters |
| Less than 5 Minutes | 0 | 0.0% |
| 5 to 9 Minutes | 0 | 0.0% |
| 10 to 14 Minutes | 8 | 19.1% |
| 15 to 19 Minutes | 6 | 14.3% |
| 20 to 24 Minutes | 0 | 0.0% |
| 25 to 29 Minutes | 0 | 0.0% |
| 30 to 34 Minutes | 11 | 26.2% |
| 35 to 39 Minutes | 0 | 0.0% |
| 40 to 44 Minutes | 17 | 40.5% |
| 45 to 59 Minutes | 0 | 0.0% |
| 60 to 89 Minutes | 0 | 0.0% |
| 90 or more Minutes | 0 | 0.0% |
Commute Time by Sex in Iron City
The most common commute times in Iron City are 40 to 44 minutes (17 commuters, 58.6%) for males and 10 to 14 minutes (8 commuters, 61.5%) for females.
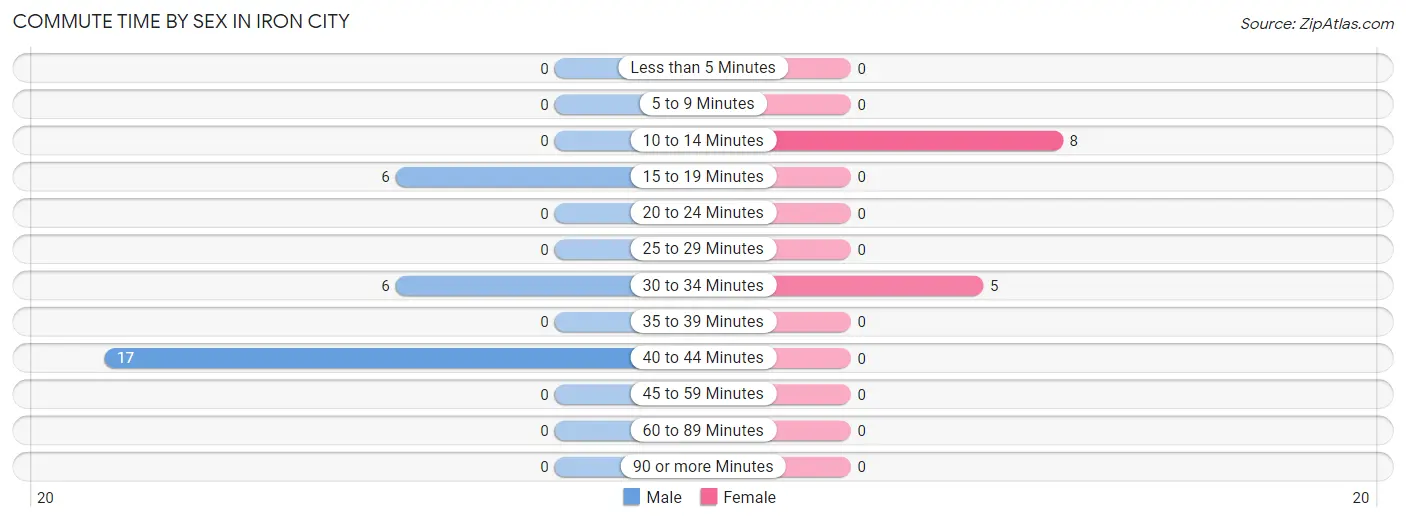
| Commute Time | Male | Female |
| Less than 5 Minutes | 0 (0.0%) | 0 (0.0%) |
| 5 to 9 Minutes | 0 (0.0%) | 0 (0.0%) |
| 10 to 14 Minutes | 0 (0.0%) | 8 (61.5%) |
| 15 to 19 Minutes | 6 (20.7%) | 0 (0.0%) |
| 20 to 24 Minutes | 0 (0.0%) | 0 (0.0%) |
| 25 to 29 Minutes | 0 (0.0%) | 0 (0.0%) |
| 30 to 34 Minutes | 6 (20.7%) | 5 (38.5%) |
| 35 to 39 Minutes | 0 (0.0%) | 0 (0.0%) |
| 40 to 44 Minutes | 17 (58.6%) | 0 (0.0%) |
| 45 to 59 Minutes | 0 (0.0%) | 0 (0.0%) |
| 60 to 89 Minutes | 0 (0.0%) | 0 (0.0%) |
| 90 or more Minutes | 0 (0.0%) | 0 (0.0%) |
Time of Departure to Work by Sex in Iron City
The most frequent times of departure to work in Iron City are 5:00 AM to 5:29 AM (17, 58.6%) for males and 6:30 AM to 6:59 AM (8, 61.5%) for females.
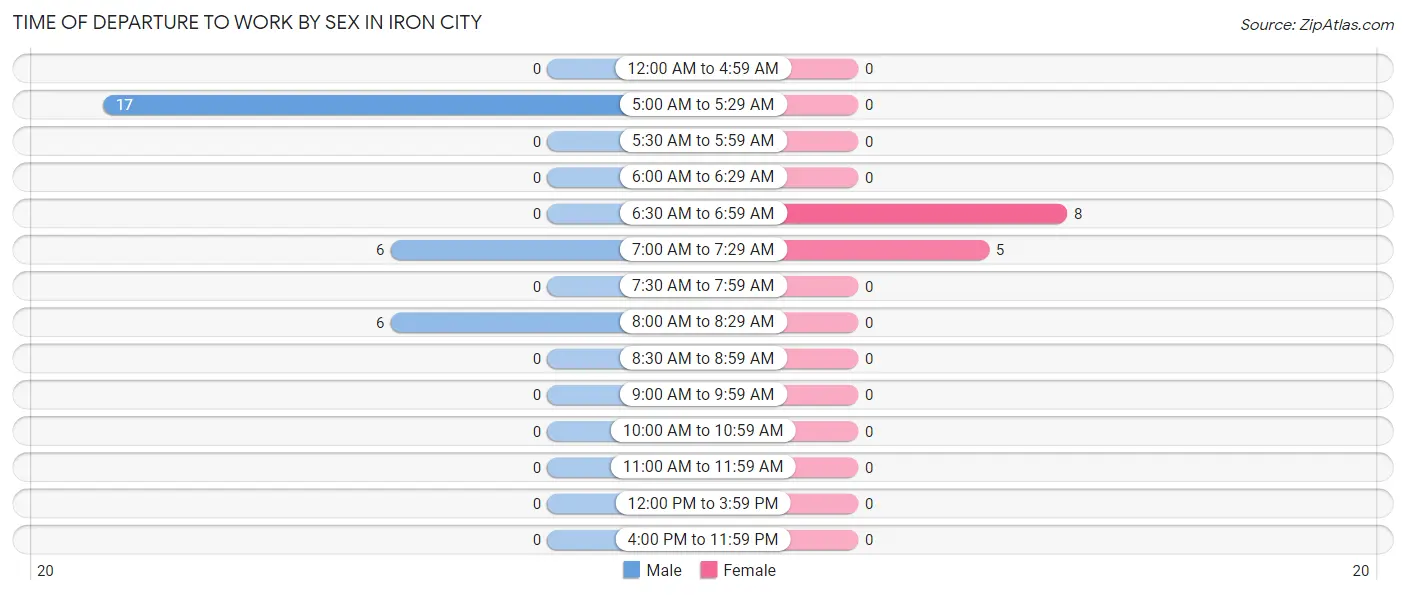
| Time of Departure | Male | Female |
| 12:00 AM to 4:59 AM | 0 (0.0%) | 0 (0.0%) |
| 5:00 AM to 5:29 AM | 17 (58.6%) | 0 (0.0%) |
| 5:30 AM to 5:59 AM | 0 (0.0%) | 0 (0.0%) |
| 6:00 AM to 6:29 AM | 0 (0.0%) | 0 (0.0%) |
| 6:30 AM to 6:59 AM | 0 (0.0%) | 8 (61.5%) |
| 7:00 AM to 7:29 AM | 6 (20.7%) | 5 (38.5%) |
| 7:30 AM to 7:59 AM | 0 (0.0%) | 0 (0.0%) |
| 8:00 AM to 8:29 AM | 6 (20.7%) | 0 (0.0%) |
| 8:30 AM to 8:59 AM | 0 (0.0%) | 0 (0.0%) |
| 9:00 AM to 9:59 AM | 0 (0.0%) | 0 (0.0%) |
| 10:00 AM to 10:59 AM | 0 (0.0%) | 0 (0.0%) |
| 11:00 AM to 11:59 AM | 0 (0.0%) | 0 (0.0%) |
| 12:00 PM to 3:59 PM | 0 (0.0%) | 0 (0.0%) |
| 4:00 PM to 11:59 PM | 0 (0.0%) | 0 (0.0%) |
| Total | 29 (100.0%) | 13 (100.0%) |
Housing Occupancy in Iron City
Occupancy by Ownership in Iron City
Of the total 79 dwellings in Iron City, owner-occupied units account for 79 (100.0%), while renter-occupied units make up 0 (0.0%).
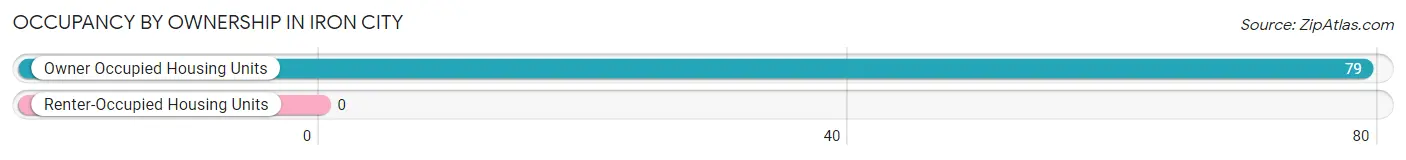
| Occupancy | # Housing Units | % Housing Units |
| Owner Occupied Housing Units | 79 | 100.0% |
| Renter-Occupied Housing Units | 0 | 0.0% |
| Total Occupied Housing Units | 79 | 100.0% |
Occupancy by Household Size in Iron City
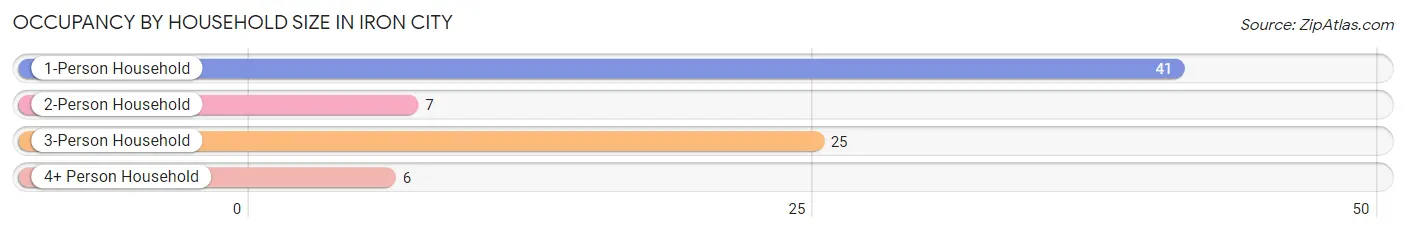
| Household Size | # Housing Units | % Housing Units |
| 1-Person Household | 41 | 51.9% |
| 2-Person Household | 7 | 8.9% |
| 3-Person Household | 25 | 31.7% |
| 4+ Person Household | 6 | 7.6% |
| Total Housing Units | 79 | 100.0% |
Occupancy by Ownership by Household Size in Iron City
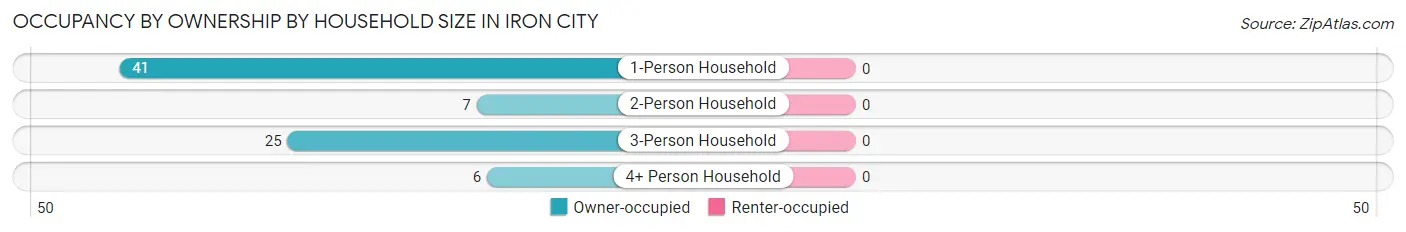
| Household Size | Owner-occupied | Renter-occupied |
| 1-Person Household | 41 (100.0%) | 0 (0.0%) |
| 2-Person Household | 7 (100.0%) | 0 (0.0%) |
| 3-Person Household | 25 (100.0%) | 0 (0.0%) |
| 4+ Person Household | 6 (100.0%) | 0 (0.0%) |
| Total Housing Units | 79 (100.0%) | 0 (0.0%) |
Occupancy by Educational Attainment in Iron City
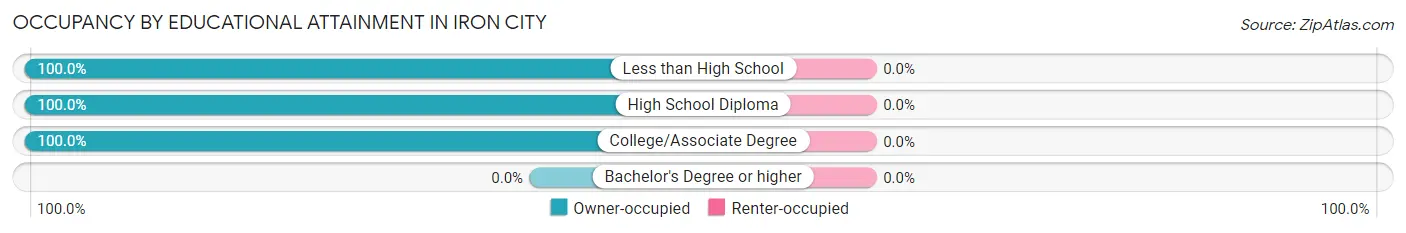
| Household Size | Owner-occupied | Renter-occupied |
| Less than High School | 31 (100.0%) | 0 (0.0%) |
| High School Diploma | 43 (100.0%) | 0 (0.0%) |
| College/Associate Degree | 5 (100.0%) | 0 (0.0%) |
| Bachelor's Degree or higher | 0 (0.0%) | 0 (0.0%) |
Occupancy by Age of Householder in Iron City
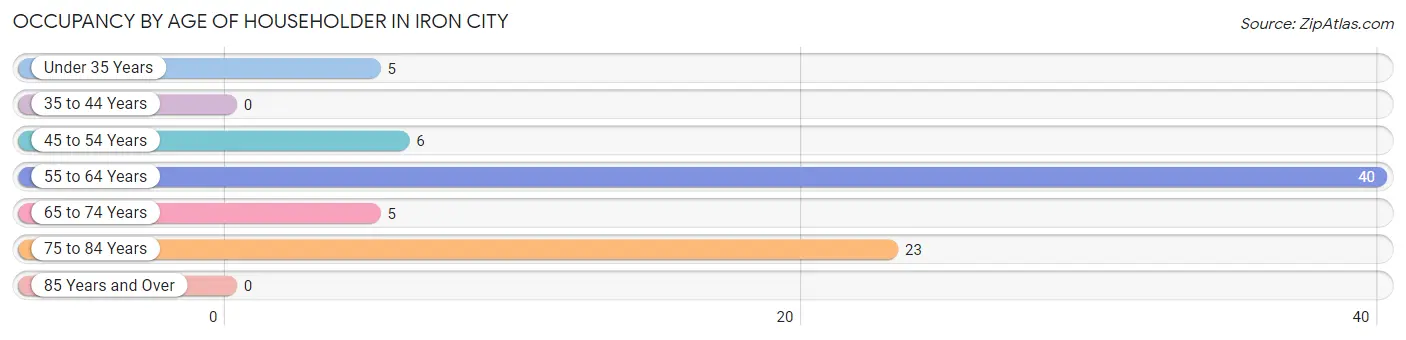
| Age Bracket | # Households | % Households |
| Under 35 Years | 5 | 6.3% |
| 35 to 44 Years | 0 | 0.0% |
| 45 to 54 Years | 6 | 7.6% |
| 55 to 64 Years | 40 | 50.6% |
| 65 to 74 Years | 5 | 6.3% |
| 75 to 84 Years | 23 | 29.1% |
| 85 Years and Over | 0 | 0.0% |
| Total | 79 | 100.0% |
Housing Finances in Iron City
Median Income by Occupancy in Iron City
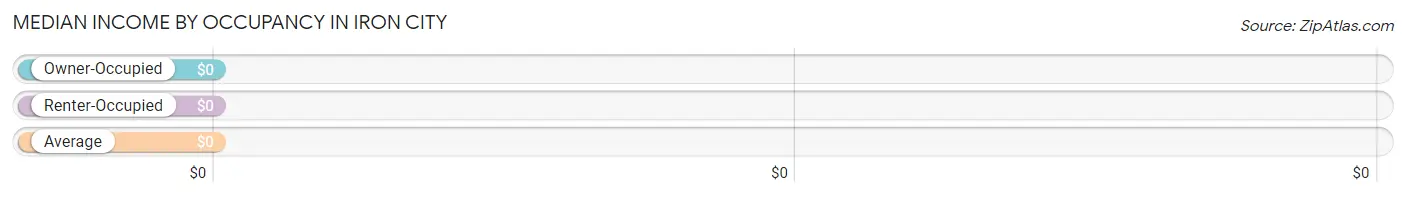
| Occupancy Type | # Households | Median Income |
| Owner-Occupied | 79 (100.0%) | $0 |
| Renter-Occupied | 0 (0.0%) | $0 |
| Average | 79 (100.0%) | $0 |
Occupancy by Householder Income Bracket in Iron City
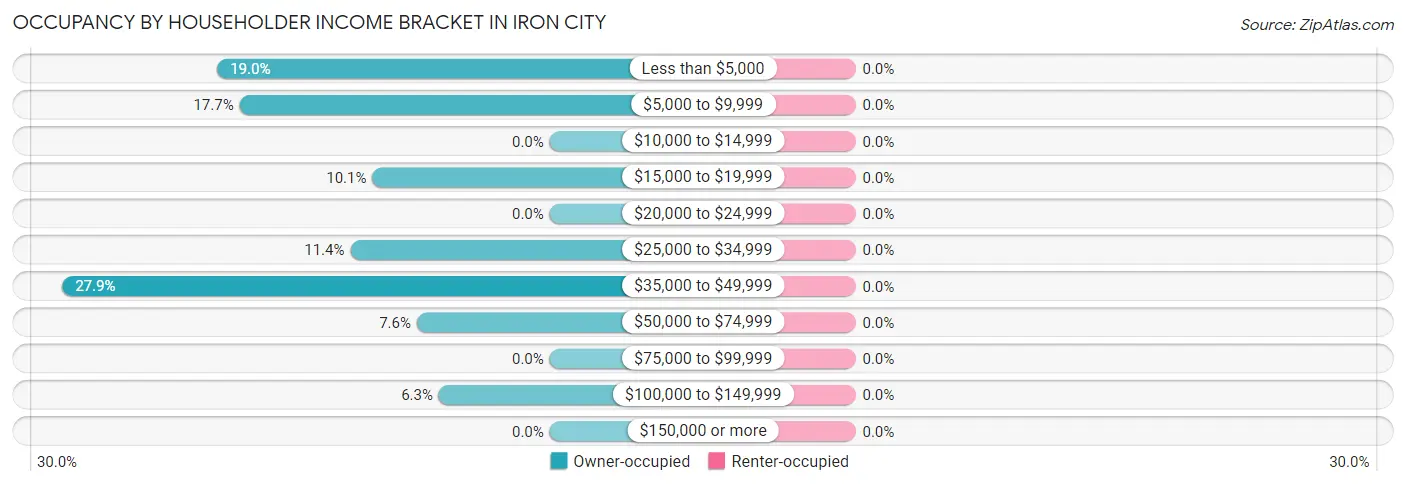
| Income Bracket | Owner-occupied | Renter-occupied |
| Less than $5,000 | 15 (19.0%) | 0 (0.0%) |
| $5,000 to $9,999 | 14 (17.7%) | 0 (0.0%) |
| $10,000 to $14,999 | 0 (0.0%) | 0 (0.0%) |
| $15,000 to $19,999 | 8 (10.1%) | 0 (0.0%) |
| $20,000 to $24,999 | 0 (0.0%) | 0 (0.0%) |
| $25,000 to $34,999 | 9 (11.4%) | 0 (0.0%) |
| $35,000 to $49,999 | 22 (27.9%) | 0 (0.0%) |
| $50,000 to $74,999 | 6 (7.6%) | 0 (0.0%) |
| $75,000 to $99,999 | 0 (0.0%) | 0 (0.0%) |
| $100,000 to $149,999 | 5 (6.3%) | 0 (0.0%) |
| $150,000 or more | 0 (0.0%) | 0 (0.0%) |
| Total | 79 (100.0%) | 0 (0.0%) |
Monthly Housing Cost Tiers in Iron City
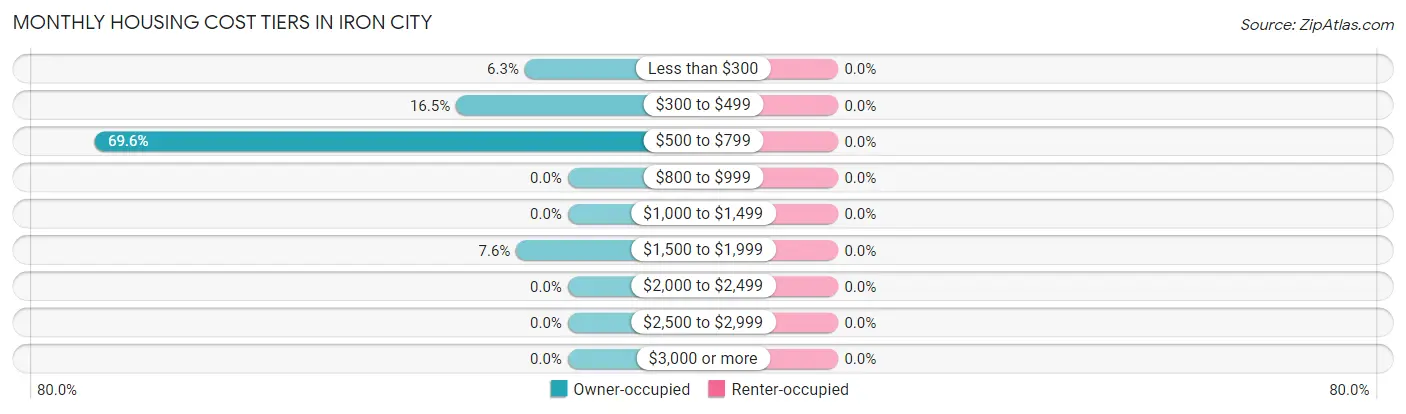
| Monthly Cost | Owner-occupied | Renter-occupied |
| Less than $300 | 5 (6.3%) | 0 (0.0%) |
| $300 to $499 | 13 (16.5%) | 0 (0.0%) |
| $500 to $799 | 55 (69.6%) | 0 (0.0%) |
| $800 to $999 | 0 (0.0%) | 0 (0.0%) |
| $1,000 to $1,499 | 0 (0.0%) | 0 (0.0%) |
| $1,500 to $1,999 | 6 (7.6%) | 0 (0.0%) |
| $2,000 to $2,499 | 0 (0.0%) | 0 (0.0%) |
| $2,500 to $2,999 | 0 (0.0%) | 0 (0.0%) |
| $3,000 or more | 0 (0.0%) | 0 (0.0%) |
| Total | 79 (100.0%) | 0 (0.0%) |
Physical Housing Characteristics in Iron City
Housing Structures in Iron City
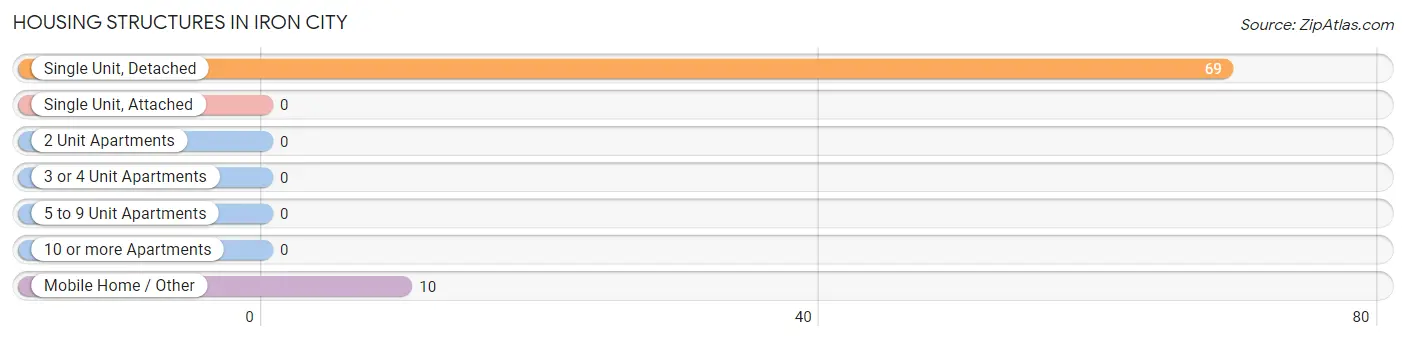
| Structure Type | # Housing Units | % Housing Units |
| Single Unit, Detached | 69 | 87.3% |
| Single Unit, Attached | 0 | 0.0% |
| 2 Unit Apartments | 0 | 0.0% |
| 3 or 4 Unit Apartments | 0 | 0.0% |
| 5 to 9 Unit Apartments | 0 | 0.0% |
| 10 or more Apartments | 0 | 0.0% |
| Mobile Home / Other | 10 | 12.7% |
| Total | 79 | 100.0% |
Housing Structures by Occupancy in Iron City
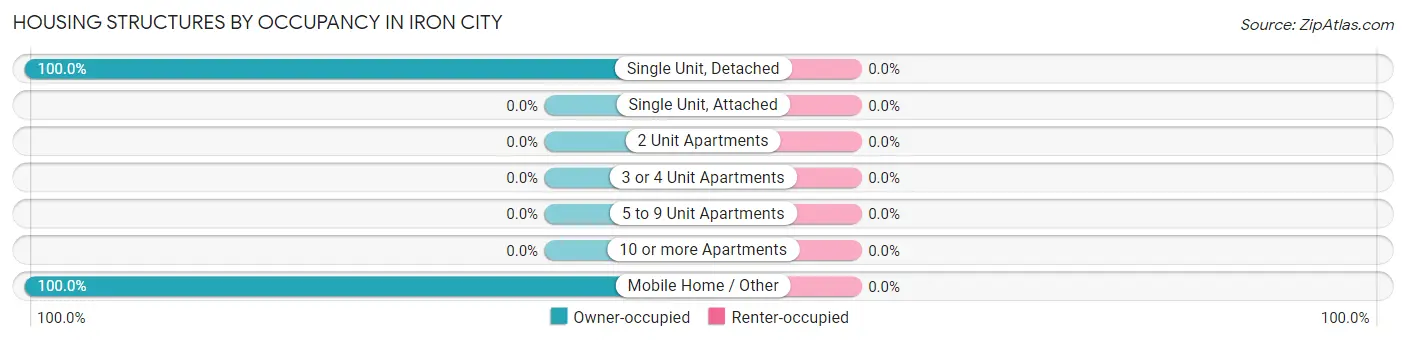
| Structure Type | Owner-occupied | Renter-occupied |
| Single Unit, Detached | 69 (100.0%) | 0 (0.0%) |
| Single Unit, Attached | 0 (0.0%) | 0 (0.0%) |
| 2 Unit Apartments | 0 (0.0%) | 0 (0.0%) |
| 3 or 4 Unit Apartments | 0 (0.0%) | 0 (0.0%) |
| 5 to 9 Unit Apartments | 0 (0.0%) | 0 (0.0%) |
| 10 or more Apartments | 0 (0.0%) | 0 (0.0%) |
| Mobile Home / Other | 10 (100.0%) | 0 (0.0%) |
| Total | 79 (100.0%) | 0 (0.0%) |
Housing Structures by Number of Rooms in Iron City
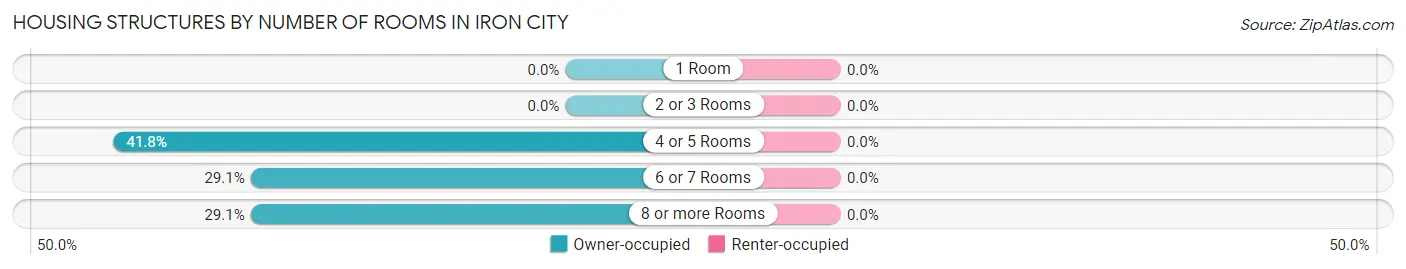
| Number of Rooms | Owner-occupied | Renter-occupied |
| 1 Room | 0 (0.0%) | 0 (0.0%) |
| 2 or 3 Rooms | 0 (0.0%) | 0 (0.0%) |
| 4 or 5 Rooms | 33 (41.8%) | 0 (0.0%) |
| 6 or 7 Rooms | 23 (29.1%) | 0 (0.0%) |
| 8 or more Rooms | 23 (29.1%) | 0 (0.0%) |
| Total | 79 (100.0%) | 0 (0.0%) |
Housing Structure by Heating Type in Iron City
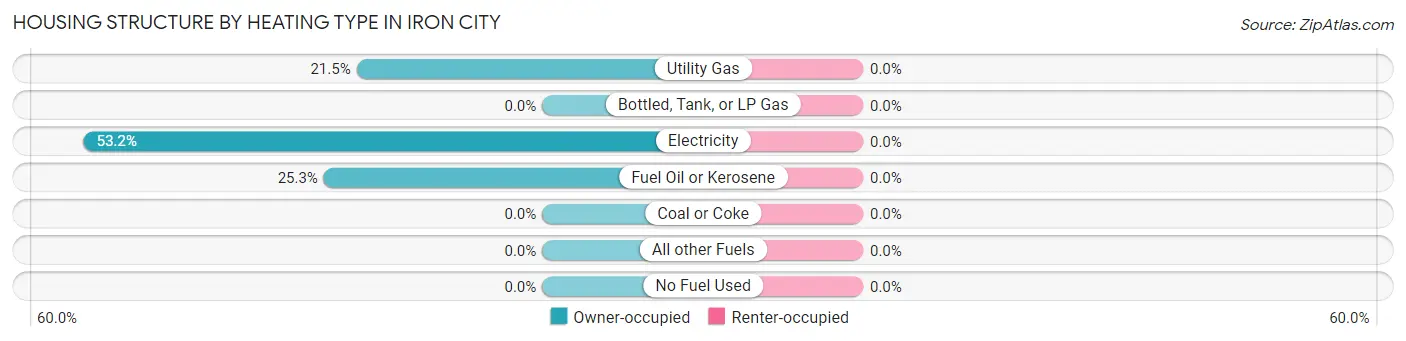
| Heating Type | Owner-occupied | Renter-occupied |
| Utility Gas | 17 (21.5%) | 0 (0.0%) |
| Bottled, Tank, or LP Gas | 0 (0.0%) | 0 (0.0%) |
| Electricity | 42 (53.2%) | 0 (0.0%) |
| Fuel Oil or Kerosene | 20 (25.3%) | 0 (0.0%) |
| Coal or Coke | 0 (0.0%) | 0 (0.0%) |
| All other Fuels | 0 (0.0%) | 0 (0.0%) |
| No Fuel Used | 0 (0.0%) | 0 (0.0%) |
| Total | 79 (100.0%) | 0 (0.0%) |
Household Vehicle Usage in Iron City
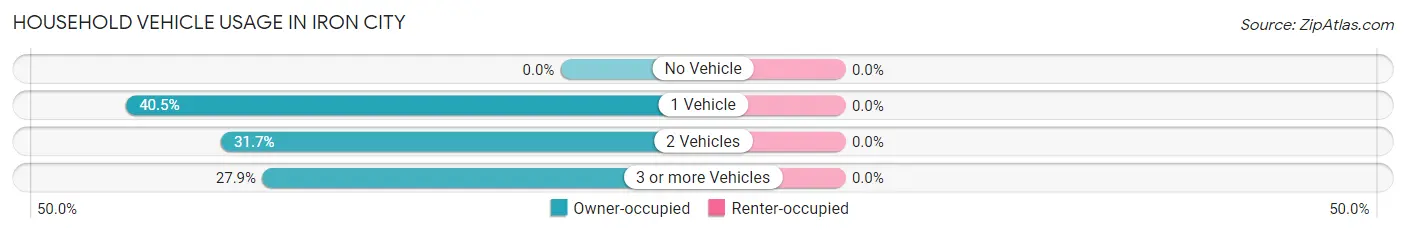
| Vehicles per Household | Owner-occupied | Renter-occupied |
| No Vehicle | 0 (0.0%) | 0 (0.0%) |
| 1 Vehicle | 32 (40.5%) | 0 (0.0%) |
| 2 Vehicles | 25 (31.7%) | 0 (0.0%) |
| 3 or more Vehicles | 22 (27.9%) | 0 (0.0%) |
| Total | 79 (100.0%) | 0 (0.0%) |
Real Estate & Mortgages in Iron City
Real Estate and Mortgage Overview in Iron City
| Characteristic | Without Mortgage | With Mortgage |
| Housing Units | 50 | 29 |
| Median Property Value | - | - |
| Median Household Income | - | - |
| Monthly Housing Costs | $544 | $0 |
| Real Estate Taxes | - | - |
Property Value by Mortgage Status in Iron City
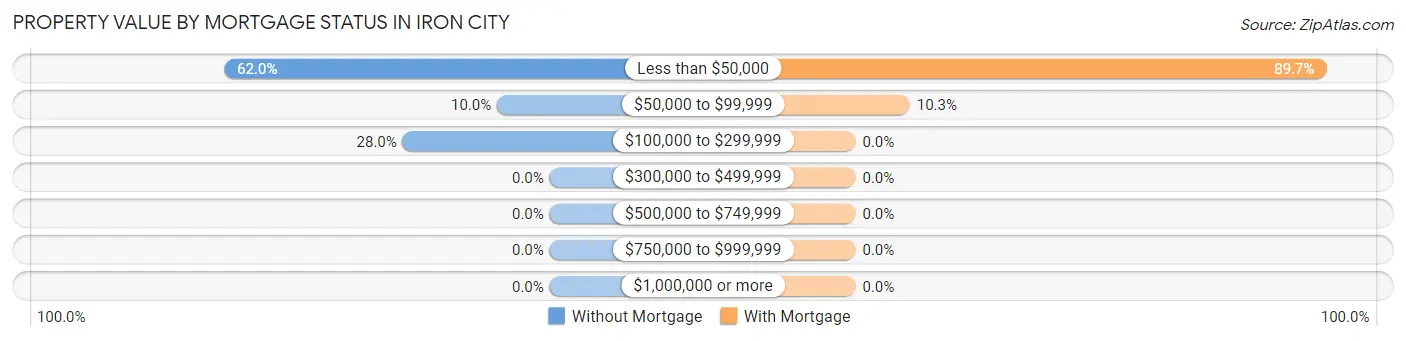
| Property Value | Without Mortgage | With Mortgage |
| Less than $50,000 | 31 (62.0%) | 26 (89.7%) |
| $50,000 to $99,999 | 5 (10.0%) | 3 (10.3%) |
| $100,000 to $299,999 | 14 (28.0%) | 0 (0.0%) |
| $300,000 to $499,999 | 0 (0.0%) | 0 (0.0%) |
| $500,000 to $749,999 | 0 (0.0%) | 0 (0.0%) |
| $750,000 to $999,999 | 0 (0.0%) | 0 (0.0%) |
| $1,000,000 or more | 0 (0.0%) | 0 (0.0%) |
| Total | 50 (100.0%) | 29 (100.0%) |
Household Income by Mortgage Status in Iron City
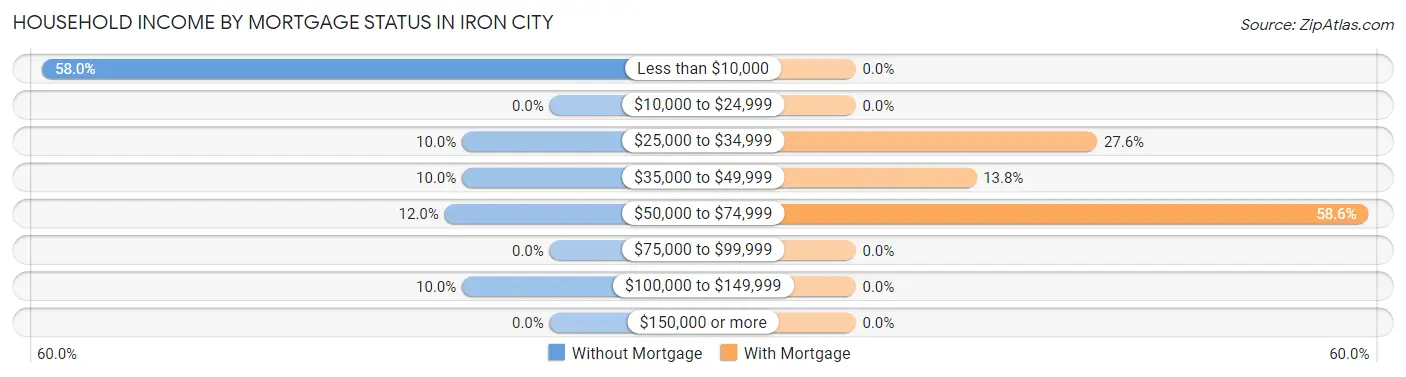
| Household Income | Without Mortgage | With Mortgage |
| Less than $10,000 | 29 (58.0%) | 0 (0.0%) |
| $10,000 to $24,999 | 0 (0.0%) | 0 (0.0%) |
| $25,000 to $34,999 | 5 (10.0%) | 8 (27.6%) |
| $35,000 to $49,999 | 5 (10.0%) | 4 (13.8%) |
| $50,000 to $74,999 | 6 (12.0%) | 17 (58.6%) |
| $75,000 to $99,999 | 0 (0.0%) | 0 (0.0%) |
| $100,000 to $149,999 | 5 (10.0%) | 0 (0.0%) |
| $150,000 or more | 0 (0.0%) | 0 (0.0%) |
| Total | 50 (100.0%) | 29 (100.0%) |
Property Value to Household Income Ratio in Iron City
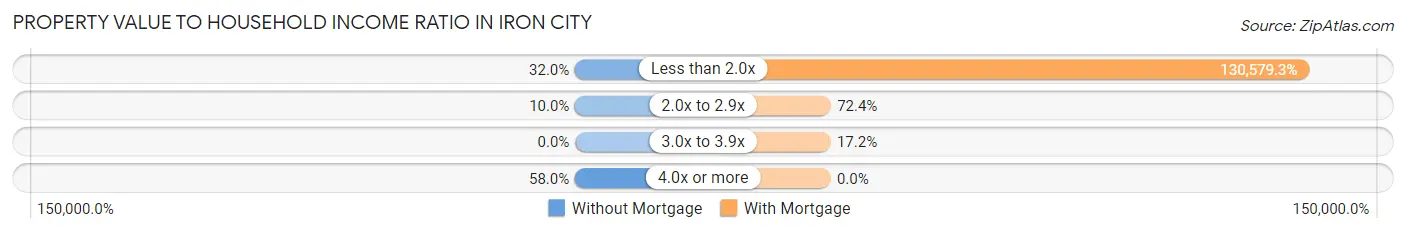
| Value-to-Income Ratio | Without Mortgage | With Mortgage |
| Less than 2.0x | 16 (32.0%) | 37,868 (130,579.3%) |
| 2.0x to 2.9x | 5 (10.0%) | 21 (72.4%) |
| 3.0x to 3.9x | 0 (0.0%) | 5 (17.2%) |
| 4.0x or more | 29 (58.0%) | 0 (0.0%) |
| Total | 50 (100.0%) | 29 (100.0%) |
Real Estate Taxes by Mortgage Status in Iron City
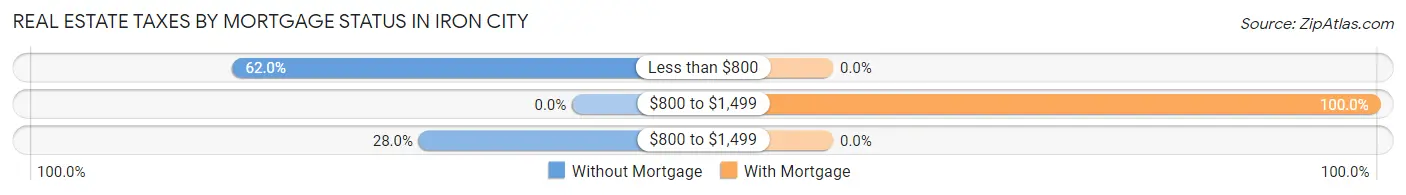
| Property Taxes | Without Mortgage | With Mortgage |
| Less than $800 | 31 (62.0%) | 0 (0.0%) |
| $800 to $1,499 | 0 (0.0%) | 29 (100.0%) |
| $800 to $1,499 | 14 (28.0%) | 0 (0.0%) |
| Total | 50 (100.0%) | 29 (100.0%) |
Health & Disability in Iron City
Health Insurance Coverage by Age in Iron City
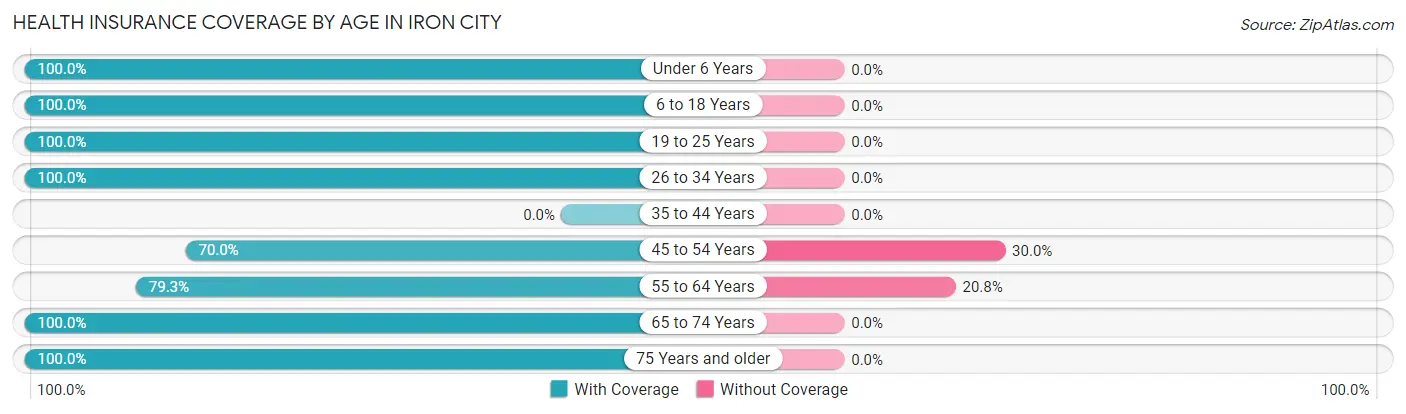
| Age Bracket | With Coverage | Without Coverage |
| Under 6 Years | 17 (100.0%) | 0 (0.0%) |
| 6 to 18 Years | 43 (100.0%) | 0 (0.0%) |
| 19 to 25 Years | 5 (100.0%) | 0 (0.0%) |
| 26 to 34 Years | 21 (100.0%) | 0 (0.0%) |
| 35 to 44 Years | 0 (0.0%) | 0 (0.0%) |
| 45 to 54 Years | 14 (70.0%) | 6 (30.0%) |
| 55 to 64 Years | 42 (79.2%) | 11 (20.7%) |
| 65 to 74 Years | 5 (100.0%) | 0 (0.0%) |
| 75 Years and older | 23 (100.0%) | 0 (0.0%) |
| Total | 170 (90.9%) | 17 (9.1%) |
Health Insurance Coverage by Citizenship Status in Iron City
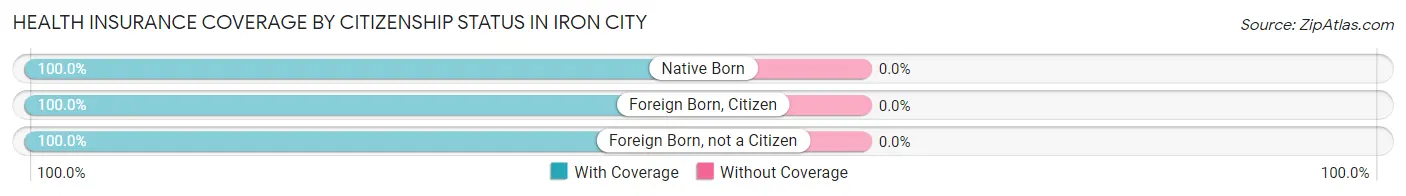
| Citizenship Status | With Coverage | Without Coverage |
| Native Born | 17 (100.0%) | 0 (0.0%) |
| Foreign Born, Citizen | 43 (100.0%) | 0 (0.0%) |
| Foreign Born, not a Citizen | 5 (100.0%) | 0 (0.0%) |
Health Insurance Coverage by Household Income in Iron City
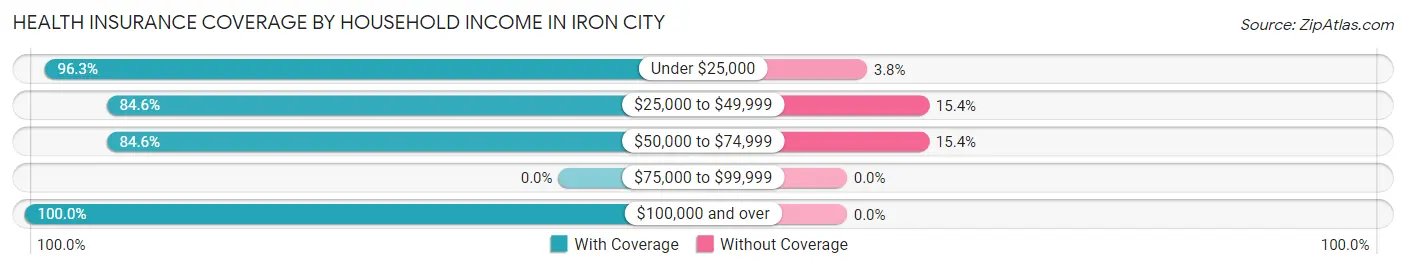
| Household Income | With Coverage | Without Coverage |
| Under $25,000 | 77 (96.3%) | 3 (3.7%) |
| $25,000 to $49,999 | 44 (84.6%) | 8 (15.4%) |
| $50,000 to $74,999 | 33 (84.6%) | 6 (15.4%) |
| $75,000 to $99,999 | 0 (0.0%) | 0 (0.0%) |
| $100,000 and over | 16 (100.0%) | 0 (0.0%) |
Public vs Private Health Insurance Coverage by Age in Iron City
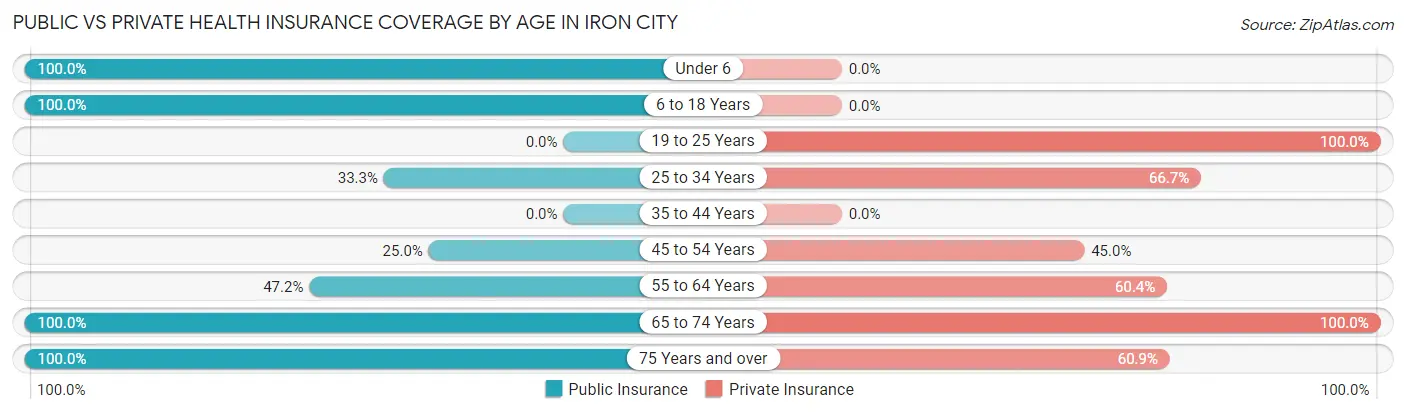
| Age Bracket | Public Insurance | Private Insurance |
| Under 6 | 17 (100.0%) | 0 (0.0%) |
| 6 to 18 Years | 43 (100.0%) | 0 (0.0%) |
| 19 to 25 Years | 0 (0.0%) | 5 (100.0%) |
| 25 to 34 Years | 7 (33.3%) | 14 (66.7%) |
| 35 to 44 Years | 0 (0.0%) | 0 (0.0%) |
| 45 to 54 Years | 5 (25.0%) | 9 (45.0%) |
| 55 to 64 Years | 25 (47.2%) | 32 (60.4%) |
| 65 to 74 Years | 5 (100.0%) | 5 (100.0%) |
| 75 Years and over | 23 (100.0%) | 14 (60.9%) |
| Total | 125 (66.8%) | 79 (42.2%) |
Disability Status by Sex by Age in Iron City
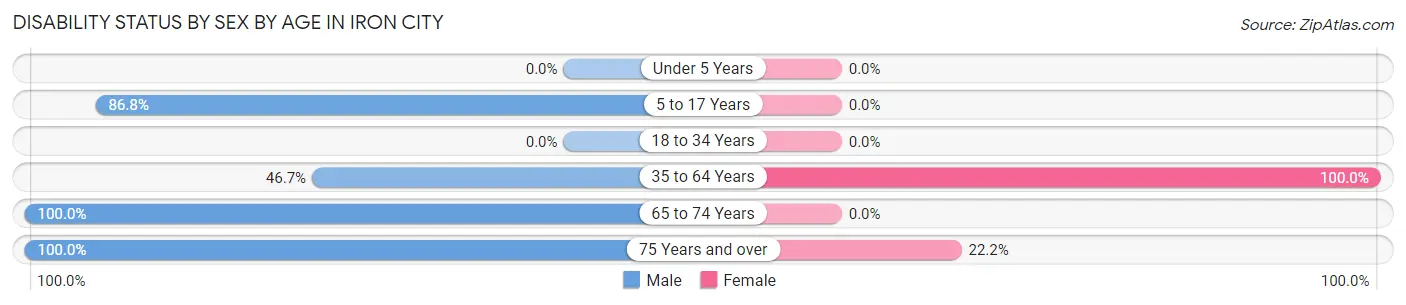
| Age Bracket | Male | Female |
| Under 5 Years | 0 (0.0%) | 0 (0.0%) |
| 5 to 17 Years | 33 (86.8%) | 0 (0.0%) |
| 18 to 34 Years | 0 (0.0%) | 0 (0.0%) |
| 35 to 64 Years | 28 (46.7%) | 13 (100.0%) |
| 65 to 74 Years | 5 (100.0%) | 0 (0.0%) |
| 75 Years and over | 5 (100.0%) | 4 (22.2%) |
Disability Class by Sex by Age in Iron City
Disability Class: Hearing Difficulty
| Age Bracket | Male | Female |
| Under 5 Years | 0 (0.0%) | 0 (0.0%) |
| 5 to 17 Years | 0 (0.0%) | 0 (0.0%) |
| 18 to 34 Years | 0 (0.0%) | 0 (0.0%) |
| 35 to 64 Years | 0 (0.0%) | 0 (0.0%) |
| 65 to 74 Years | 0 (0.0%) | 0 (0.0%) |
| 75 Years and over | 0 (0.0%) | 0 (0.0%) |
Disability Class: Vision Difficulty
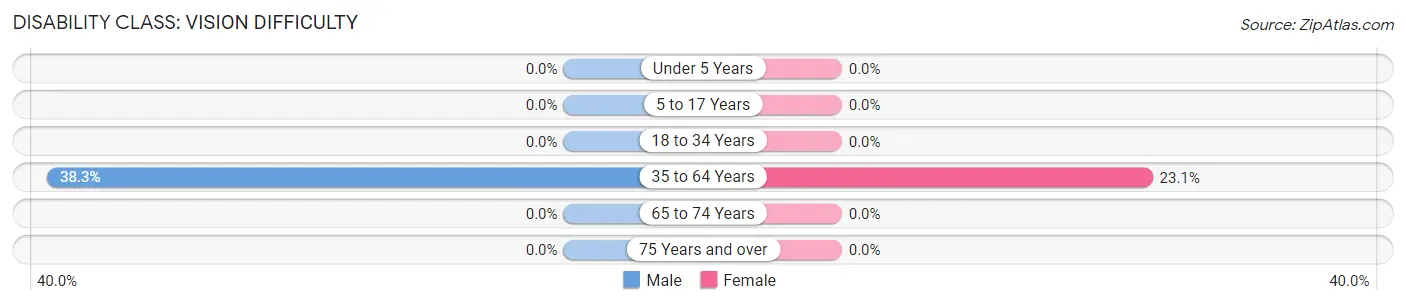
| Age Bracket | Male | Female |
| Under 5 Years | 0 (0.0%) | 0 (0.0%) |
| 5 to 17 Years | 0 (0.0%) | 0 (0.0%) |
| 18 to 34 Years | 0 (0.0%) | 0 (0.0%) |
| 35 to 64 Years | 23 (38.3%) | 3 (23.1%) |
| 65 to 74 Years | 0 (0.0%) | 0 (0.0%) |
| 75 Years and over | 0 (0.0%) | 0 (0.0%) |
Disability Class: Cognitive Difficulty
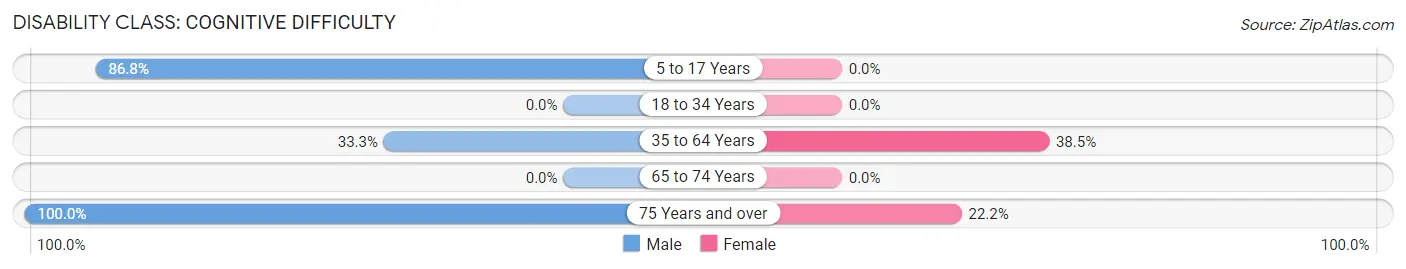
| Age Bracket | Male | Female |
| 5 to 17 Years | 33 (86.8%) | 0 (0.0%) |
| 18 to 34 Years | 0 (0.0%) | 0 (0.0%) |
| 35 to 64 Years | 20 (33.3%) | 5 (38.5%) |
| 65 to 74 Years | 0 (0.0%) | 0 (0.0%) |
| 75 Years and over | 5 (100.0%) | 4 (22.2%) |
Disability Class: Ambulatory Difficulty
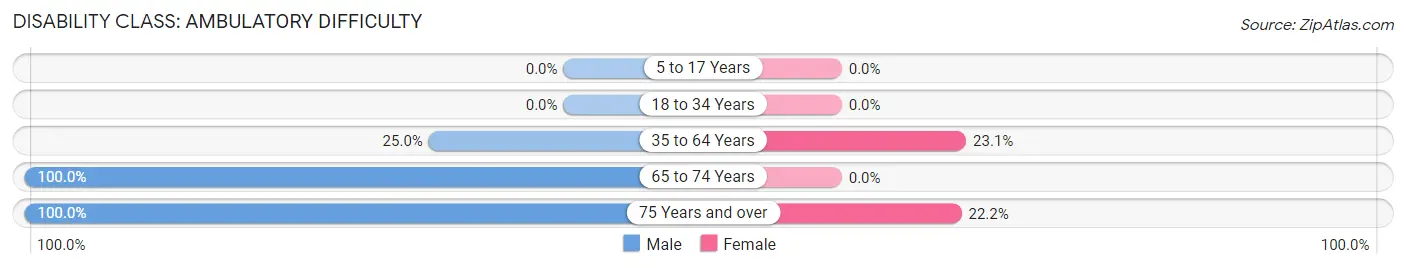
| Age Bracket | Male | Female |
| 5 to 17 Years | 0 (0.0%) | 0 (0.0%) |
| 18 to 34 Years | 0 (0.0%) | 0 (0.0%) |
| 35 to 64 Years | 15 (25.0%) | 3 (23.1%) |
| 65 to 74 Years | 5 (100.0%) | 0 (0.0%) |
| 75 Years and over | 5 (100.0%) | 4 (22.2%) |
Disability Class: Self-Care Difficulty
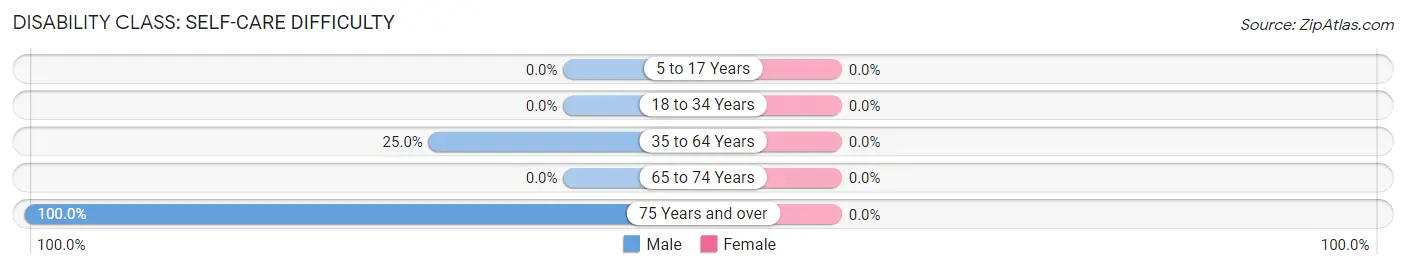
| Age Bracket | Male | Female |
| 5 to 17 Years | 0 (0.0%) | 0 (0.0%) |
| 18 to 34 Years | 0 (0.0%) | 0 (0.0%) |
| 35 to 64 Years | 15 (25.0%) | 0 (0.0%) |
| 65 to 74 Years | 0 (0.0%) | 0 (0.0%) |
| 75 Years and over | 5 (100.0%) | 0 (0.0%) |
Technology Access in Iron City
Computing Device Access in Iron City
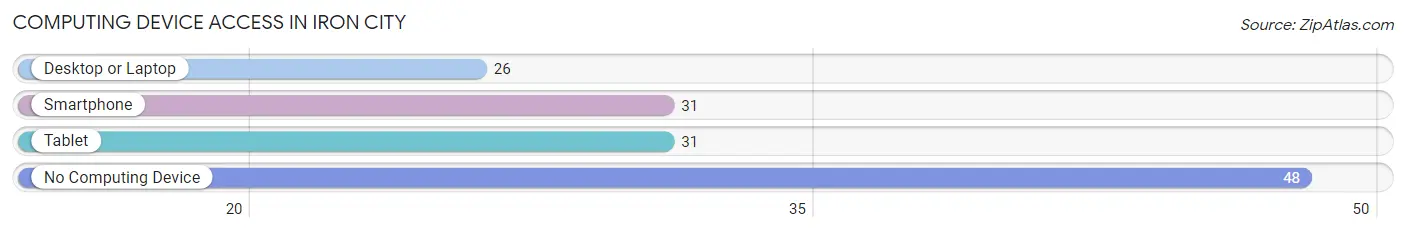
| Device Type | # Households | % Households |
| Desktop or Laptop | 26 | 32.9% |
| Smartphone | 31 | 39.2% |
| Tablet | 31 | 39.2% |
| No Computing Device | 48 | 60.8% |
| Total | 79 | 100.0% |
Internet Access in Iron City
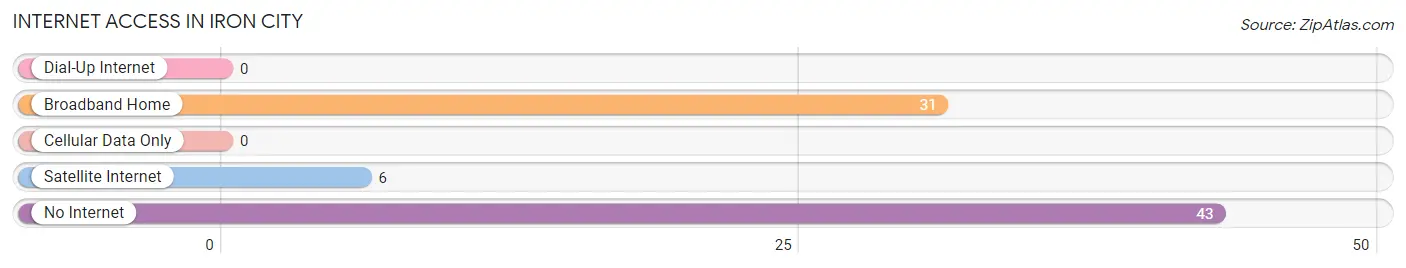
| Internet Type | # Households | % Households |
| Dial-Up Internet | 0 | 0.0% |
| Broadband Home | 31 | 39.2% |
| Cellular Data Only | 0 | 0.0% |
| Satellite Internet | 6 | 7.6% |
| No Internet | 43 | 54.4% |
| Total | 79 | 100.0% |
Iron City Summary
City of Iron City Tennessee
Iron City is a small town located in the northwest corner of Tennessee, in the county of Obion. It is situated on the banks of the Obion River, and is surrounded by rolling hills and farmland. The town has a population of approximately 1,000 people, and is known for its friendly atmosphere and small-town charm.
History
Iron City was founded in 1845 by a group of settlers from the nearby town of Union City. The settlers were looking for a place to build a new town, and chose the area due to its proximity to the Obion River. The town was named Iron City due to the abundance of iron ore in the area.
The town quickly grew, and by the late 1800s it had become a thriving community. The town was home to several businesses, including a blacksmith shop, a general store, and a sawmill. The town also had a school, a post office, and a church.
In the early 1900s, the town began to decline. The sawmill closed, and the population began to dwindle. However, in the late 1950s, the town began to experience a resurgence. The town was revitalized by the construction of a new bridge over the Obion River, which allowed for easier access to the town.
Geography
Iron City is located in the northwest corner of Tennessee, in the county of Obion. It is situated on the banks of the Obion River, and is surrounded by rolling hills and farmland. The town is located approximately 30 miles from the state capital of Nashville.
The town has a total area of 1.2 square miles, all of which is land. The town is located at an elevation of 545 feet above sea level.
Economy
Iron City’s economy is largely based on agriculture. The town is home to several farms, which produce a variety of crops, including corn, soybeans, and wheat. The town also has a small manufacturing sector, which produces a variety of products, including furniture and clothing.
The town also has a small tourism industry, which is centered around the Obion River. The town is home to several fishing and boating businesses, which attract visitors from all over the region.
Demographics
As of the 2010 census, Iron City had a population of 1,000 people. The town has a median age of 38.7 years, and a median household income of $37,500. The town is predominantly white, with a small African American population.
Conclusion
Iron City is a small town located in the northwest corner of Tennessee, in the county of Obion. It is situated on the banks of the Obion River, and is surrounded by rolling hills and farmland. The town has a population of approximately 1,000 people, and is known for its friendly atmosphere and small-town charm. The town’s economy is largely based on agriculture, and it also has a small manufacturing and tourism sector. The town is predominantly white, with a small African American population.
Common Questions
What is Per Capita Income in Iron City?
Per Capita income in Iron City is $14,283.
What is Income or Wage Gap in Iron City?
Income or Wage Gap in Iron City is 48.1%.
Women in Iron City earn 51.9 cents for every dollar earned by a man.
What is Inequality or Gini Index in Iron City?
Inequality or Gini Index in Iron City is 0.44.
What is the Total Population of Iron City?
Total Population of Iron City is 187.
What is the Total Male Population of Iron City?
Total Male Population of Iron City is 121.
What is the Total Female Population of Iron City?
Total Female Population of Iron City is 66.
What is the Ratio of Males per 100 Females in Iron City?
There are 183.33 Males per 100 Females in Iron City.
What is the Ratio of Females per 100 Males in Iron City?
There are 54.55 Females per 100 Males in Iron City.
What is the Median Population Age in Iron City?
Median Population Age in Iron City is 51.4 Years.
What is the Average Family Size in Iron City
Average Family Size in Iron City is 3.2 People.
What is the Average Household Size in Iron City
Average Household Size in Iron City is 2.4 People.
How Large is the Labor Force in Iron City?
There are 86 People in the Labor Forcein in Iron City.
What is the Percentage of People in the Labor Force in Iron City?
53.8% of People are in the Labor Force in Iron City.
What is the Unemployment Rate in Iron City?
Unemployment Rate in Iron City is 23.3%.