Green Hill, TN Map & Demographics
Green Hill Map
Green Hill Overview
$42,235
PER CAPITA INCOME
$107,639
AVG FAMILY INCOME
$94,428
AVG HOUSEHOLD INCOME
13.4%
WAGE / INCOME GAP [ % ]
86.6¢/ $1
WAGE / INCOME GAP [ $ ]
0.38
INEQUALITY / GINI INDEX
6,773
TOTAL POPULATION
3,320
MALE POPULATION
3,453
FEMALE POPULATION
96.15
MALES / 100 FEMALES
104.01
FEMALES / 100 MALES
48.7
MEDIAN AGE
3.0
AVG FAMILY SIZE
2.6
AVG HOUSEHOLD SIZE
3,401
LABOR FORCE [ PEOPLE ]
62.1%
PERCENT IN LABOR FORCE
6.6%
UNEMPLOYMENT RATE
Income in Green Hill
Income Overview in Green Hill
Per Capita Income in Green Hill is $42,235, while median incomes of families and households are $107,639 and $94,428 respectively.
| Characteristic | Number | Measure |
| Per Capita Income | 6,773 | $42,235 |
| Median Family Income | 2,004 | $107,639 |
| Mean Family Income | 2,004 | $124,571 |
| Median Household Income | 2,567 | $94,428 |
| Mean Household Income | 2,567 | $109,258 |
| Income Deficit | 2,004 | $0 |
| Wage / Income Gap (%) | 6,773 | 13.42% |
| Wage / Income Gap ($) | 6,773 | 86.58¢ per $1 |
| Gini / Inequality Index | 6,773 | 0.38 |
Earnings by Sex in Green Hill
Average Earnings in Green Hill are $55,780, $57,417 for men and $49,712 for women, a difference of 13.4%.
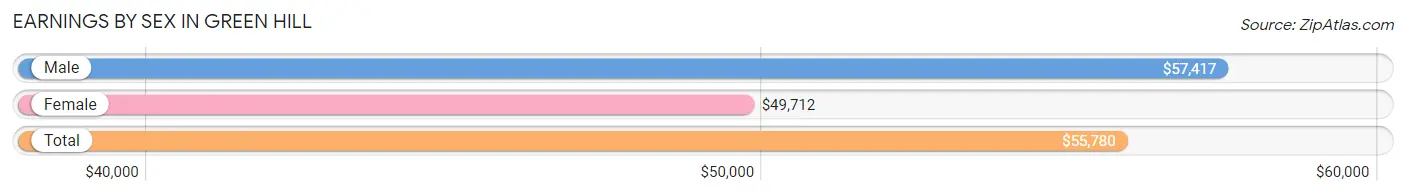
| Sex | Number | Average Earnings |
| Male | 1,820 (52.8%) | $57,417 |
| Female | 1,627 (47.2%) | $49,712 |
| Total | 3,447 (100.0%) | $55,780 |
Earnings by Sex by Income Bracket in Green Hill
The most common earnings brackets in Green Hill are $65,000 to $74,999 for men (325 | 17.9%) and $100,000+ for women (251 | 15.4%).
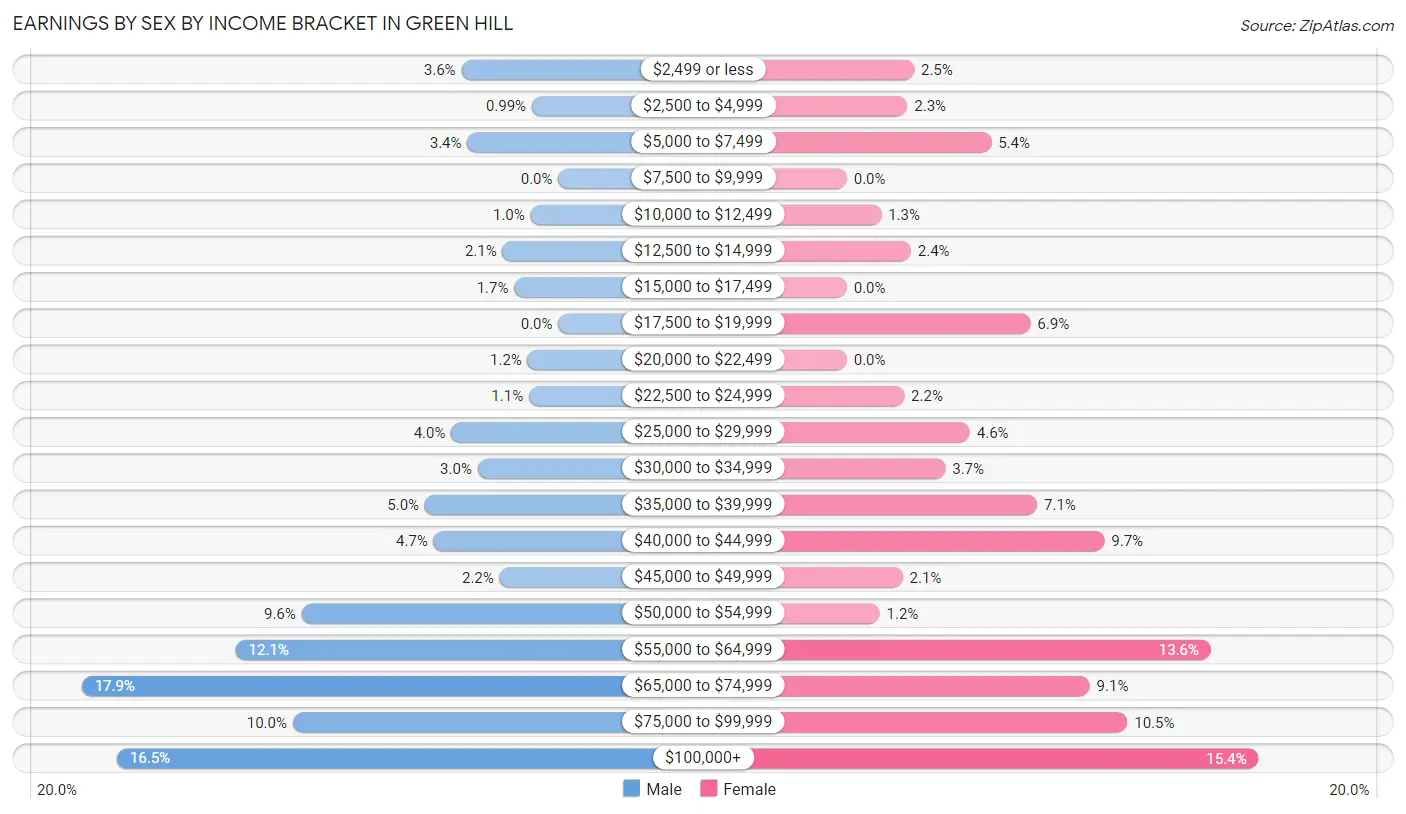
| Income | Male | Female |
| $2,499 or less | 66 (3.6%) | 41 (2.5%) |
| $2,500 to $4,999 | 18 (1.0%) | 37 (2.3%) |
| $5,000 to $7,499 | 62 (3.4%) | 88 (5.4%) |
| $7,500 to $9,999 | 0 (0.0%) | 0 (0.0%) |
| $10,000 to $12,499 | 19 (1.0%) | 21 (1.3%) |
| $12,500 to $14,999 | 38 (2.1%) | 39 (2.4%) |
| $15,000 to $17,499 | 30 (1.7%) | 0 (0.0%) |
| $17,500 to $19,999 | 0 (0.0%) | 112 (6.9%) |
| $20,000 to $22,499 | 21 (1.1%) | 0 (0.0%) |
| $22,500 to $24,999 | 20 (1.1%) | 35 (2.1%) |
| $25,000 to $29,999 | 73 (4.0%) | 75 (4.6%) |
| $30,000 to $34,999 | 55 (3.0%) | 60 (3.7%) |
| $35,000 to $39,999 | 91 (5.0%) | 116 (7.1%) |
| $40,000 to $44,999 | 85 (4.7%) | 157 (9.7%) |
| $45,000 to $49,999 | 40 (2.2%) | 34 (2.1%) |
| $50,000 to $54,999 | 175 (9.6%) | 20 (1.2%) |
| $55,000 to $64,999 | 220 (12.1%) | 222 (13.6%) |
| $65,000 to $74,999 | 325 (17.9%) | 148 (9.1%) |
| $75,000 to $99,999 | 181 (10.0%) | 171 (10.5%) |
| $100,000+ | 301 (16.5%) | 251 (15.4%) |
| Total | 1,820 (100.0%) | 1,627 (100.0%) |
Earnings by Sex by Educational Attainment in Green Hill
Average earnings in Green Hill are $57,839 for men and $55,027 for women, a difference of 4.9%. Men with an educational attainment of graduate degree enjoy the highest average annual earnings of $71,313, while those with less than high school education earn the least with $20,952. Women with an educational attainment of bachelor's degree earn the most with the average annual earnings of $71,061, while those with high school diploma education have the smallest earnings of $35,453.
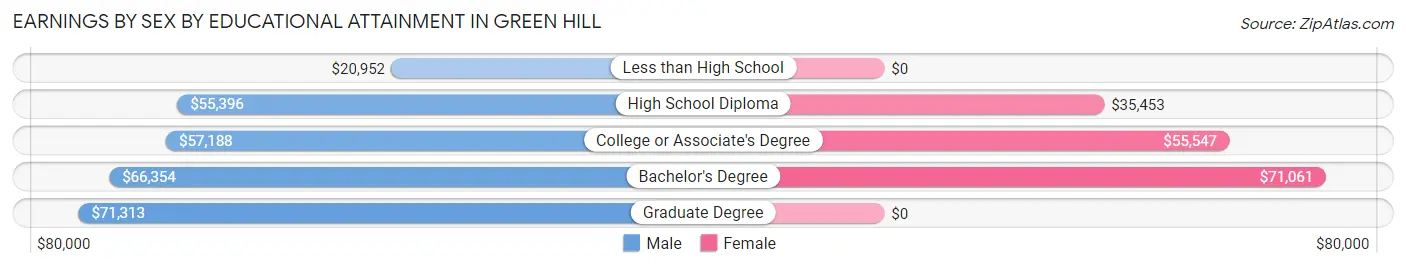
| Educational Attainment | Male Income | Female Income |
| Less than High School | $20,952 | $0 |
| High School Diploma | $55,396 | $35,453 |
| College or Associate's Degree | $57,188 | $55,547 |
| Bachelor's Degree | $66,354 | $71,061 |
| Graduate Degree | $71,313 | $0 |
| Total | $57,839 | $55,027 |
Family Income in Green Hill
Family Income Brackets in Green Hill
According to the Green Hill family income data, there are 643 families falling into the $100,000 to $149,999 income range, which is the most common income bracket and makes up 32.1% of all families.
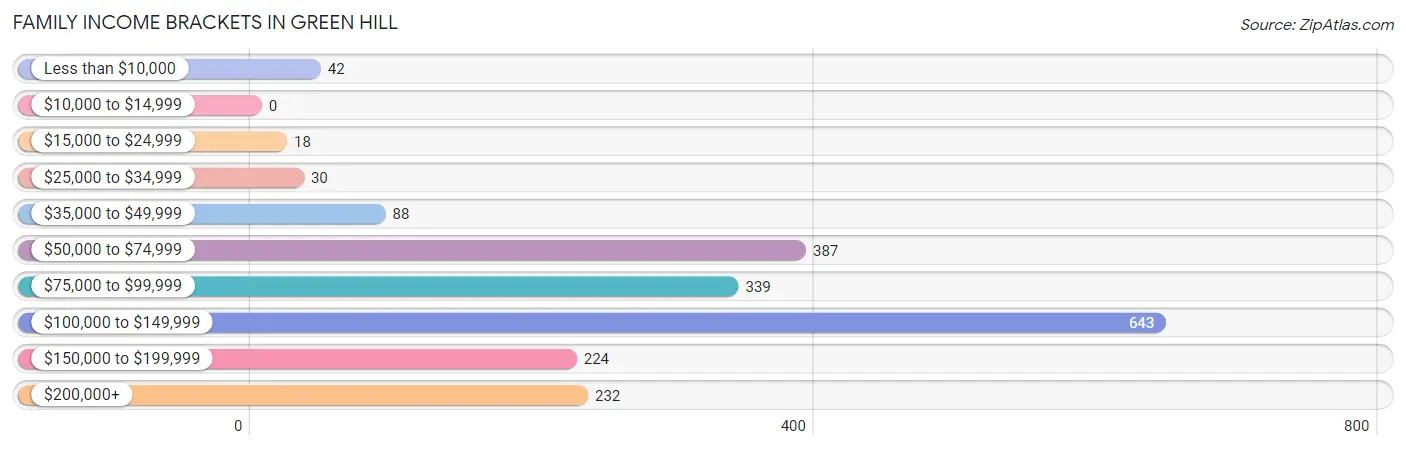
| Income Bracket | # Families | % Families |
| Less than $10,000 | 42 | 2.1% |
| $10,000 to $14,999 | 0 | 0.0% |
| $15,000 to $24,999 | 18 | 0.9% |
| $25,000 to $34,999 | 30 | 1.5% |
| $35,000 to $49,999 | 88 | 4.4% |
| $50,000 to $74,999 | 387 | 19.3% |
| $75,000 to $99,999 | 339 | 16.9% |
| $100,000 to $149,999 | 643 | 32.1% |
| $150,000 to $199,999 | 224 | 11.2% |
| $200,000+ | 232 | 11.6% |
Family Income by Famaliy Size in Green Hill
4-person families (459 | 22.9%) account for the highest median family income in Green Hill with $123,627 per family, while 2-person families (1,101 | 54.9%) have the highest median income of $40,799 per family member.
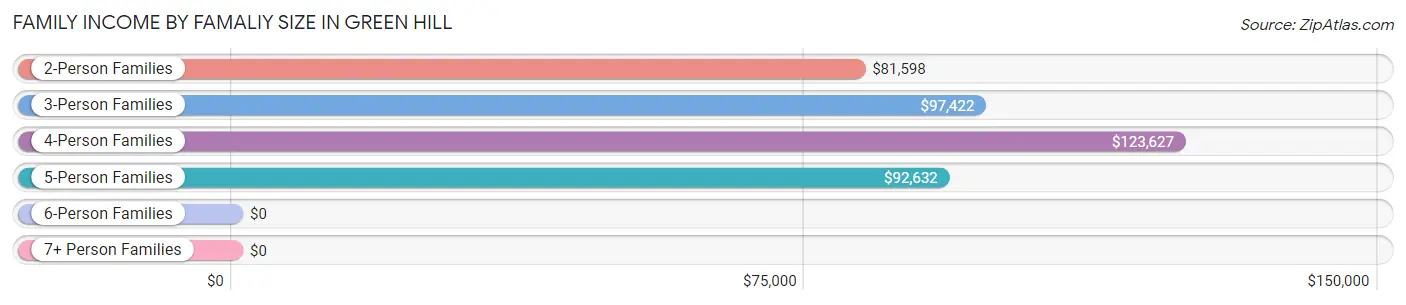
| Income Bracket | # Families | Median Income |
| 2-Person Families | 1,101 (54.9%) | $81,598 |
| 3-Person Families | 301 (15.0%) | $97,422 |
| 4-Person Families | 459 (22.9%) | $123,627 |
| 5-Person Families | 96 (4.8%) | $92,632 |
| 6-Person Families | 28 (1.4%) | $0 |
| 7+ Person Families | 19 (0.9%) | $0 |
| Total | 2,004 (100.0%) | $107,639 |
Family Income by Number of Earners in Green Hill
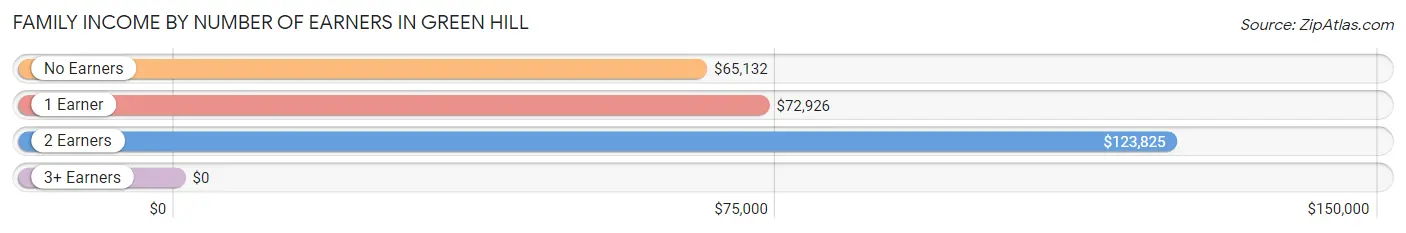
| Number of Earners | # Families | Median Income |
| No Earners | 322 (16.1%) | $65,132 |
| 1 Earner | 526 (26.3%) | $72,926 |
| 2 Earners | 1,038 (51.8%) | $123,825 |
| 3+ Earners | 118 (5.9%) | $0 |
| Total | 2,004 (100.0%) | $107,639 |
Household Income in Green Hill
Household Income Brackets in Green Hill
With 708 households falling in the category, the $100,000 to $149,999 income range is the most frequent in Green Hill, accounting for 27.6% of all households.
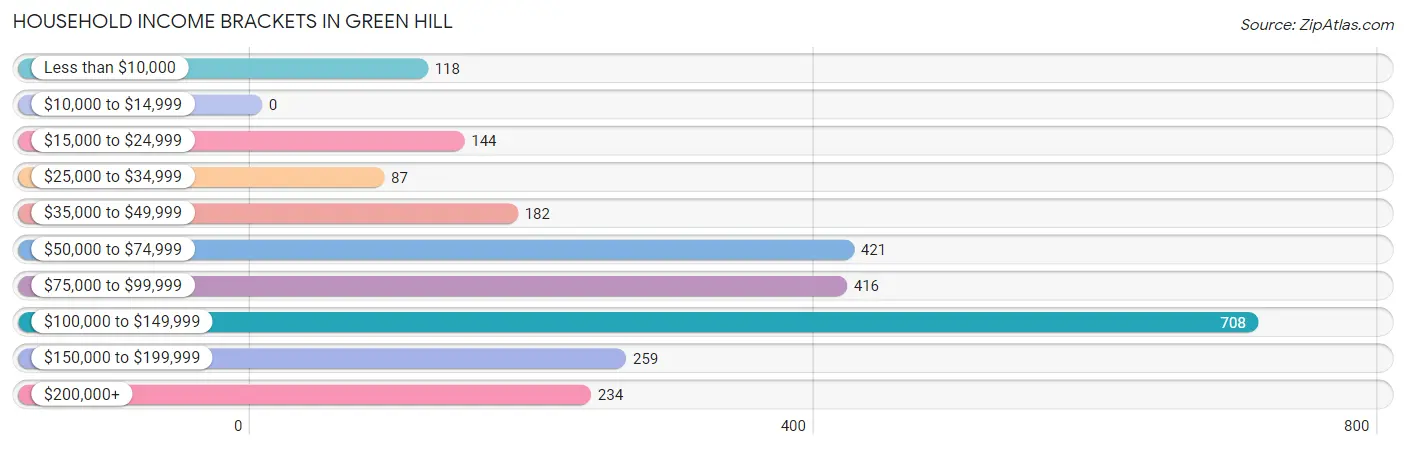
| Income Bracket | # Households | % Households |
| Less than $10,000 | 118 | 4.6% |
| $10,000 to $14,999 | 0 | 0.0% |
| $15,000 to $24,999 | 144 | 5.6% |
| $25,000 to $34,999 | 87 | 3.4% |
| $35,000 to $49,999 | 182 | 7.1% |
| $50,000 to $74,999 | 421 | 16.4% |
| $75,000 to $99,999 | 416 | 16.2% |
| $100,000 to $149,999 | 708 | 27.6% |
| $150,000 to $199,999 | 259 | 10.1% |
| $200,000+ | 234 | 9.1% |
Household Income by Householder Age in Green Hill
The median household income in Green Hill is $94,428, with the highest median household income of $122,945 found in the 45 to 64 years age bracket for the primary householder. A total of 1,221 households (47.6%) fall into this category.
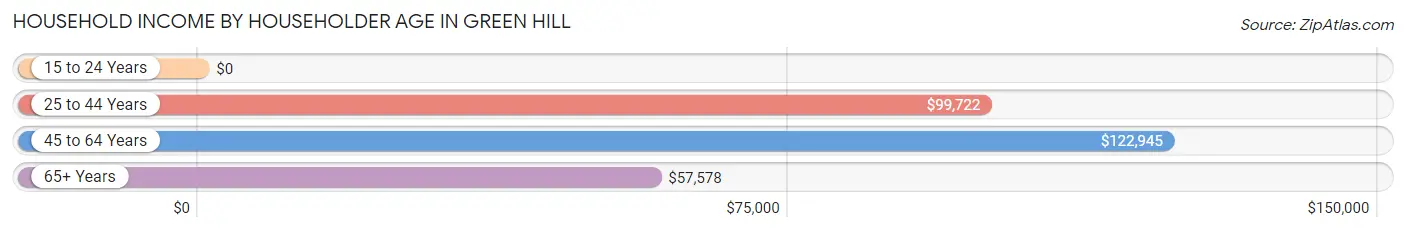
| Income Bracket | # Households | Median Income |
| 15 to 24 Years | 0 (0.0%) | $0 |
| 25 to 44 Years | 430 (16.8%) | $99,722 |
| 45 to 64 Years | 1,221 (47.6%) | $122,945 |
| 65+ Years | 916 (35.7%) | $57,578 |
| Total | 2,567 (100.0%) | $94,428 |
Poverty in Green Hill
Income Below Poverty by Sex and Age in Green Hill
With 8.6% poverty level for males and 2.4% for females among the residents of Green Hill, 16 and 17 year old males and 12 to 14 year old females are the most vulnerable to poverty, with 56 males (50.0%) and 20 females (19.8%) in their respective age groups living below the poverty level.
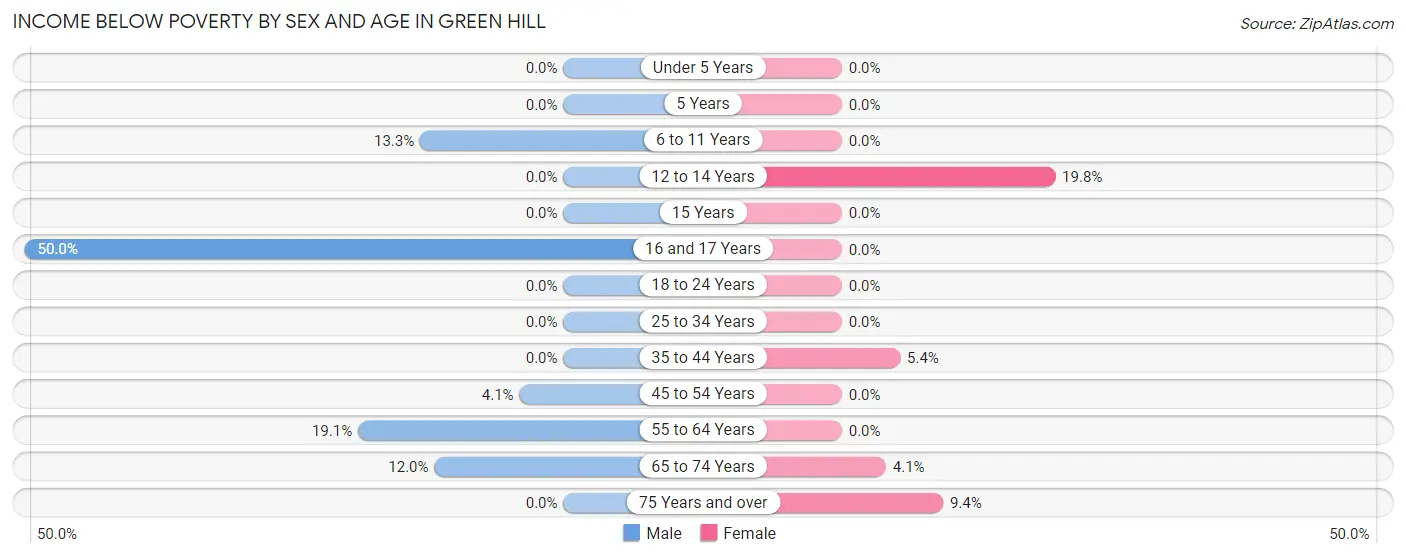
| Age Bracket | Male | Female |
| Under 5 Years | 0 (0.0%) | 0 (0.0%) |
| 5 Years | 0 (0.0%) | 0 (0.0%) |
| 6 to 11 Years | 27 (13.3%) | 0 (0.0%) |
| 12 to 14 Years | 0 (0.0%) | 20 (19.8%) |
| 15 Years | 0 (0.0%) | 0 (0.0%) |
| 16 and 17 Years | 56 (50.0%) | 0 (0.0%) |
| 18 to 24 Years | 0 (0.0%) | 0 (0.0%) |
| 25 to 34 Years | 0 (0.0%) | 0 (0.0%) |
| 35 to 44 Years | 0 (0.0%) | 22 (5.4%) |
| 45 to 54 Years | 30 (4.1%) | 0 (0.0%) |
| 55 to 64 Years | 114 (19.1%) | 0 (0.0%) |
| 65 to 74 Years | 57 (12.0%) | 19 (4.1%) |
| 75 Years and over | 0 (0.0%) | 20 (9.4%) |
| Total | 284 (8.6%) | 81 (2.4%) |
Income Above Poverty by Sex and Age in Green Hill
According to the poverty statistics in Green Hill, males aged under 5 years and females aged under 5 years are the age groups that are most secure financially, with 100.0% of males and 100.0% of females in these age groups living above the poverty line.
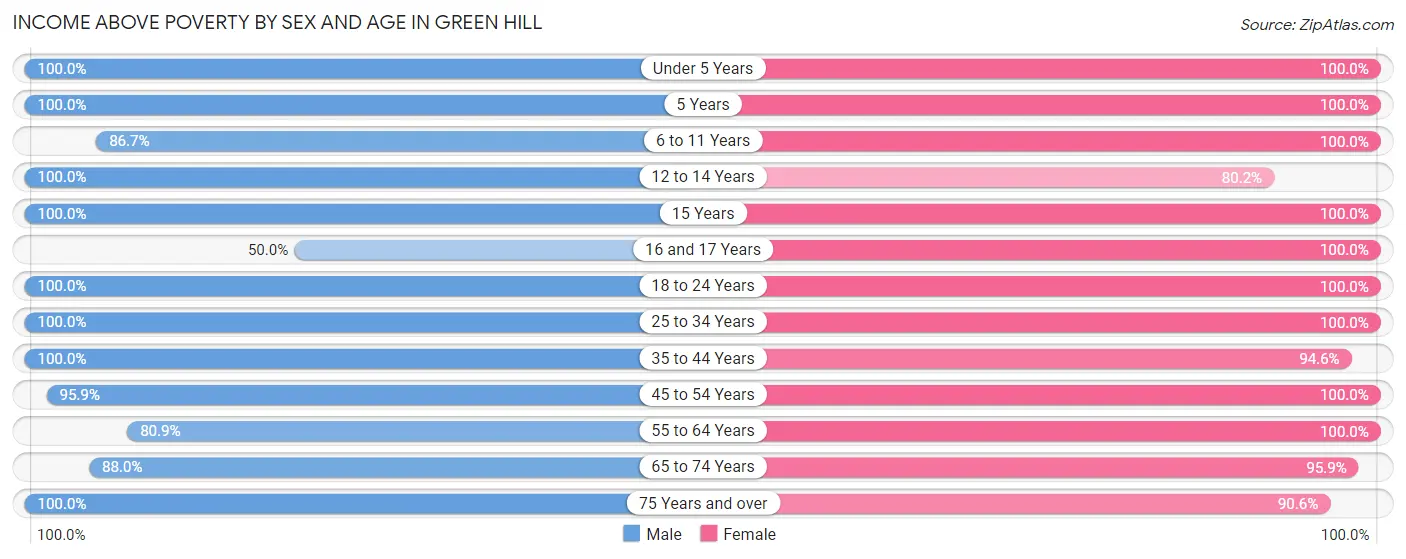
| Age Bracket | Male | Female |
| Under 5 Years | 60 (100.0%) | 145 (100.0%) |
| 5 Years | 46 (100.0%) | 13 (100.0%) |
| 6 to 11 Years | 176 (86.7%) | 408 (100.0%) |
| 12 to 14 Years | 126 (100.0%) | 81 (80.2%) |
| 15 Years | 13 (100.0%) | 181 (100.0%) |
| 16 and 17 Years | 56 (50.0%) | 188 (100.0%) |
| 18 to 24 Years | 165 (100.0%) | 70 (100.0%) |
| 25 to 34 Years | 183 (100.0%) | 150 (100.0%) |
| 35 to 44 Years | 365 (100.0%) | 385 (94.6%) |
| 45 to 54 Years | 705 (95.9%) | 582 (100.0%) |
| 55 to 64 Years | 484 (80.9%) | 531 (100.0%) |
| 65 to 74 Years | 419 (88.0%) | 445 (95.9%) |
| 75 Years and over | 238 (100.0%) | 193 (90.6%) |
| Total | 3,036 (91.4%) | 3,372 (97.7%) |
Income Below Poverty Among Married-Couple Families in Green Hill
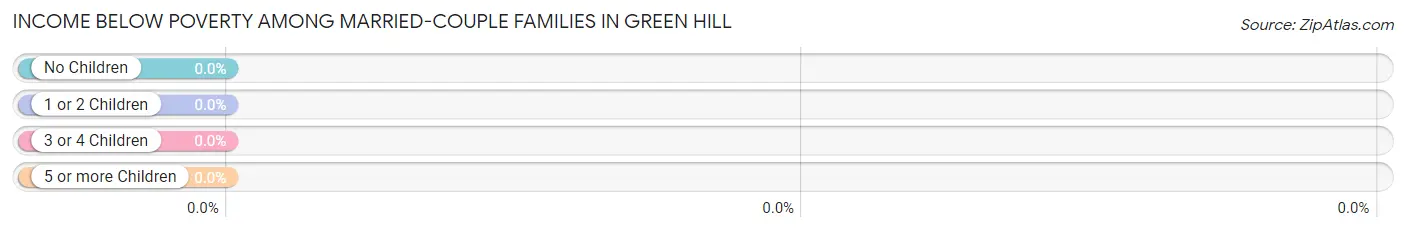
| Children | Above Poverty | Below Poverty |
| No Children | 1,126 (100.0%) | 0 (0.0%) |
| 1 or 2 Children | 497 (100.0%) | 0 (0.0%) |
| 3 or 4 Children | 96 (100.0%) | 0 (0.0%) |
| 5 or more Children | 19 (100.0%) | 0 (0.0%) |
| Total | 1,738 (100.0%) | 0 (0.0%) |
Income Below Poverty Among Single-Parent Households in Green Hill
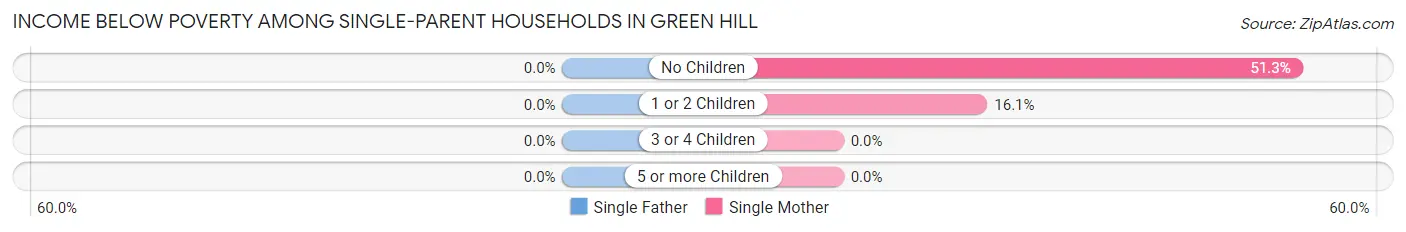
| Children | Single Father | Single Mother |
| No Children | 0 (0.0%) | 20 (51.3%) |
| 1 or 2 Children | 0 (0.0%) | 22 (16.1%) |
| 3 or 4 Children | 0 (0.0%) | 0 (0.0%) |
| 5 or more Children | 0 (0.0%) | 0 (0.0%) |
| Total | 0 (0.0%) | 42 (22.1%) |
Income Below Poverty Among Married-Couple vs Single-Parent Households in Green Hill
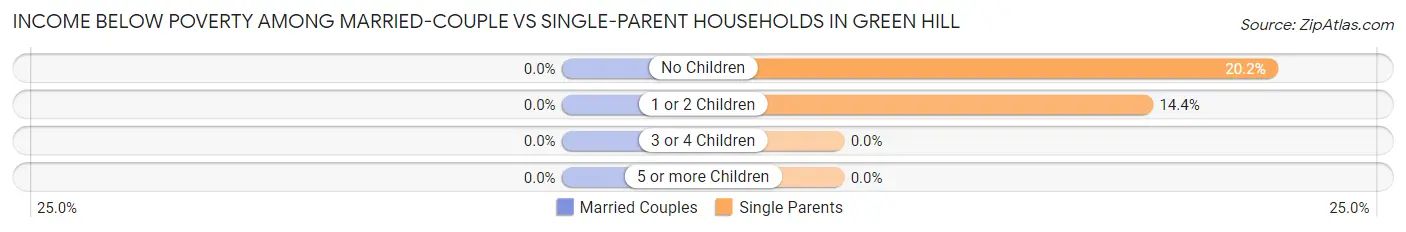
| Children | Married-Couple Families | Single-Parent Households |
| No Children | 0 (0.0%) | 20 (20.2%) |
| 1 or 2 Children | 0 (0.0%) | 22 (14.4%) |
| 3 or 4 Children | 0 (0.0%) | 0 (0.0%) |
| 5 or more Children | 0 (0.0%) | 0 (0.0%) |
| Total | 0 (0.0%) | 42 (15.8%) |
Race in Green Hill
The most populous races in Green Hill are White / Caucasian (6,285 | 92.8%), Black / African American (252 | 3.7%), and Hispanic or Latino (216 | 3.2%).
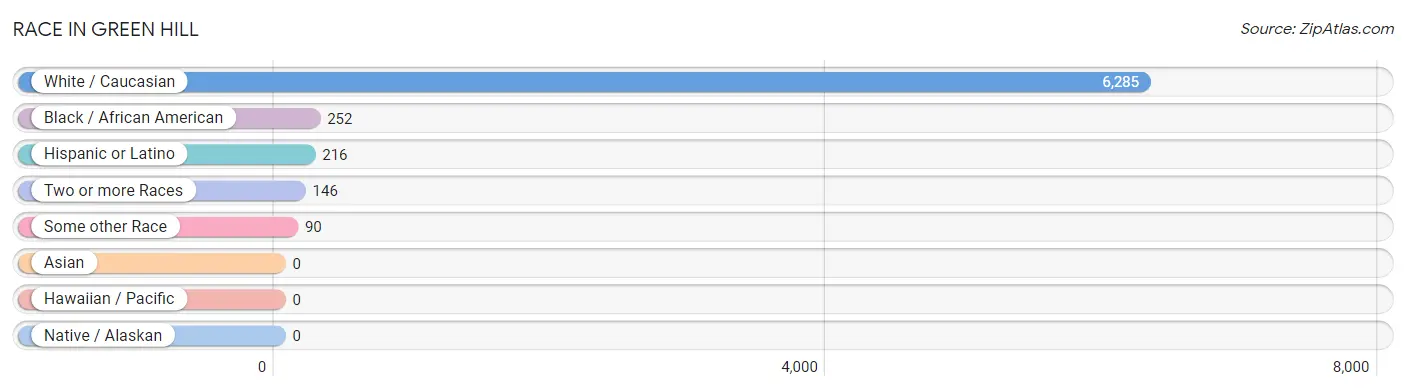
| Race | # Population | % Population |
| Asian | 0 | 0.0% |
| Black / African American | 252 | 3.7% |
| Hawaiian / Pacific | 0 | 0.0% |
| Hispanic or Latino | 216 | 3.2% |
| Native / Alaskan | 0 | 0.0% |
| White / Caucasian | 6,285 | 92.8% |
| Two or more Races | 146 | 2.2% |
| Some other Race | 90 | 1.3% |
| Total | 6,773 | 100.0% |
Ancestry in Green Hill
The most populous ancestries reported in Green Hill are German (1,574 | 23.2%), English (1,314 | 19.4%), American (668 | 9.9%), Irish (588 | 8.7%), and Scottish (276 | 4.1%), together accounting for 65.3% of all Green Hill residents.
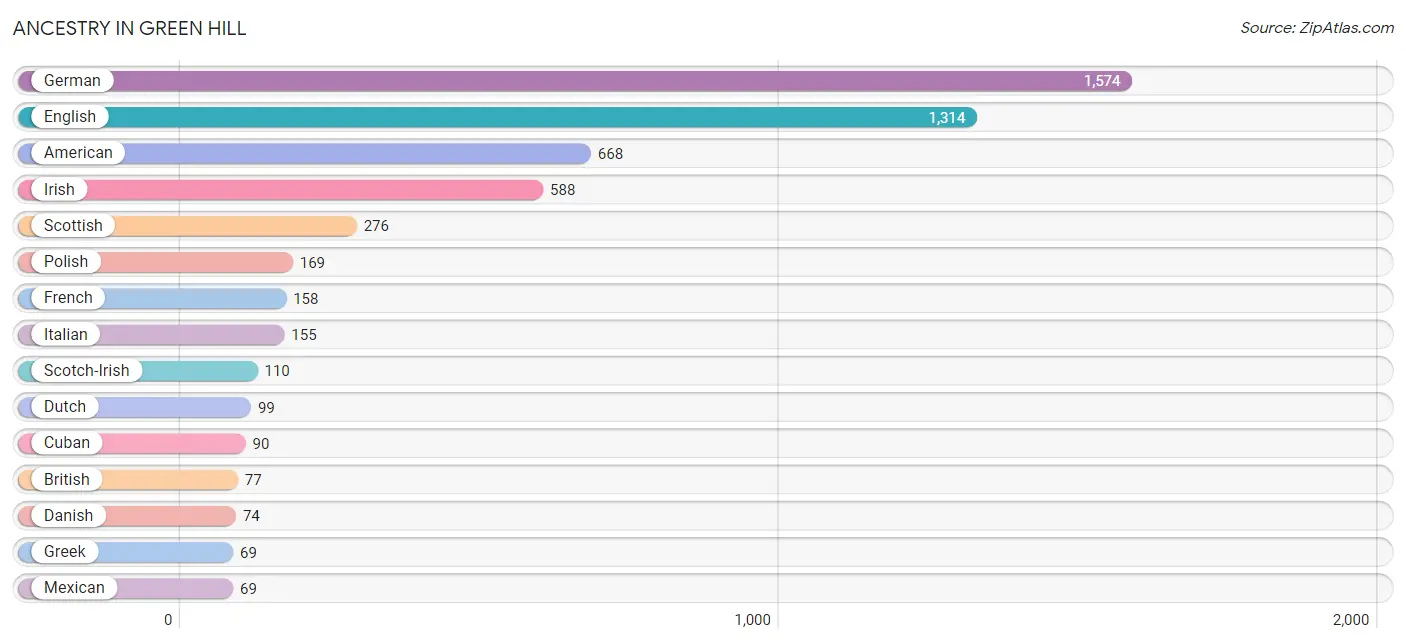
| Ancestry | # Population | % Population |
| American | 668 | 9.9% |
| Arab | 40 | 0.6% |
| Brazilian | 61 | 0.9% |
| British | 77 | 1.1% |
| Burmese | 15 | 0.2% |
| Central American | 34 | 0.5% |
| Cherokee | 54 | 0.8% |
| Choctaw | 21 | 0.3% |
| Cuban | 90 | 1.3% |
| Danish | 74 | 1.1% |
| Dutch | 99 | 1.5% |
| English | 1,314 | 19.4% |
| Ethiopian | 59 | 0.9% |
| European | 48 | 0.7% |
| Finnish | 17 | 0.3% |
| French | 158 | 2.3% |
| French Canadian | 51 | 0.7% |
| German | 1,574 | 23.2% |
| Greek | 69 | 1.0% |
| Guatemalan | 34 | 0.5% |
| Hungarian | 17 | 0.3% |
| Irish | 588 | 8.7% |
| Italian | 155 | 2.3% |
| Lebanese | 40 | 0.6% |
| Mexican | 69 | 1.0% |
| Norwegian | 19 | 0.3% |
| Polish | 169 | 2.5% |
| Puerto Rican | 23 | 0.3% |
| Romanian | 18 | 0.3% |
| Russian | 11 | 0.2% |
| Scandinavian | 33 | 0.5% |
| Scotch-Irish | 110 | 1.6% |
| Scottish | 276 | 4.1% |
| Serbian | 11 | 0.2% |
| Subsaharan African | 59 | 0.9% |
| Swedish | 15 | 0.2% |
| Welsh | 41 | 0.6% |
| Yugoslavian | 20 | 0.3% | View All 38 Rows |
Immigrants in Green Hill
The most numerous immigrant groups reported in Green Hill came from Latin America (39 | 0.6%), Africa (34 | 0.5%), Eastern Africa (34 | 0.5%), Ethiopia (34 | 0.5%), and Central America (22 | 0.3%), together accounting for 2.4% of all Green Hill residents.
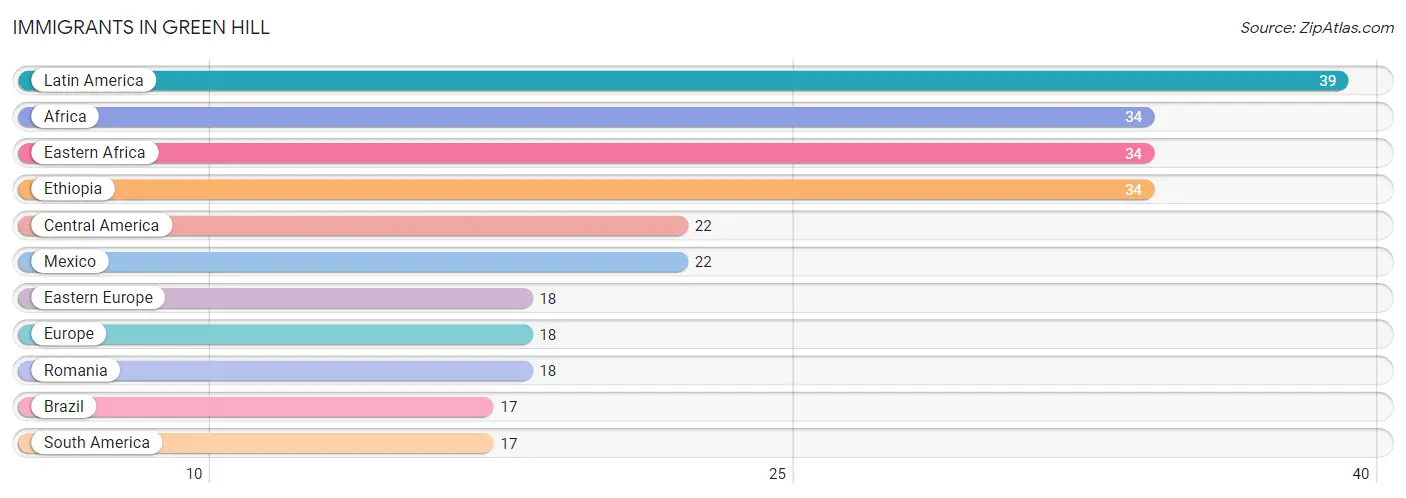
| Immigration Origin | # Population | % Population |
| Africa | 34 | 0.5% |
| Brazil | 17 | 0.3% |
| Central America | 22 | 0.3% |
| Eastern Africa | 34 | 0.5% |
| Eastern Europe | 18 | 0.3% |
| Ethiopia | 34 | 0.5% |
| Europe | 18 | 0.3% |
| Latin America | 39 | 0.6% |
| Mexico | 22 | 0.3% |
| Romania | 18 | 0.3% |
| South America | 17 | 0.3% | View All 11 Rows |
Sex and Age in Green Hill
Sex and Age in Green Hill
The most populous age groups in Green Hill are 50 to 54 Years (375 | 11.3%) for men and 15 to 19 Years (392 | 11.4%) for women.
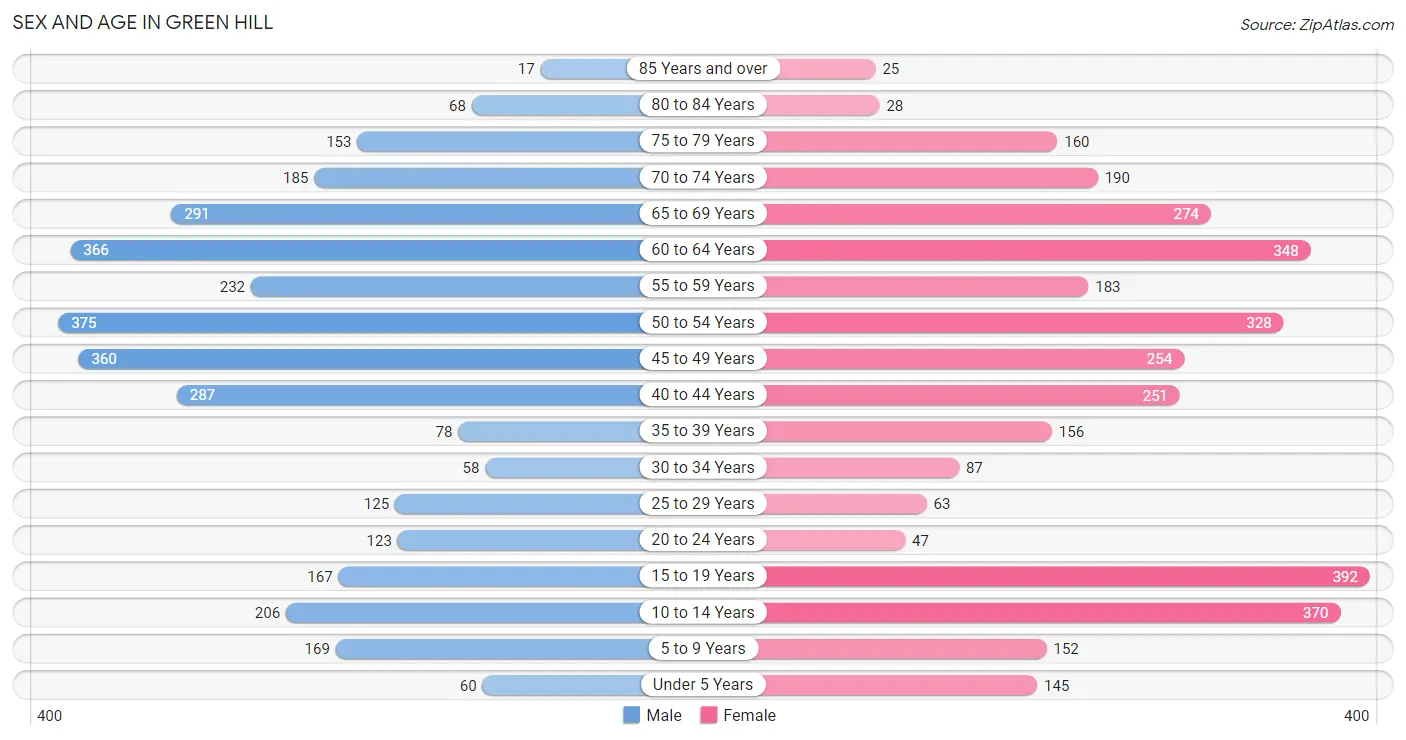
| Age Bracket | Male | Female |
| Under 5 Years | 60 (1.8%) | 145 (4.2%) |
| 5 to 9 Years | 169 (5.1%) | 152 (4.4%) |
| 10 to 14 Years | 206 (6.2%) | 370 (10.7%) |
| 15 to 19 Years | 167 (5.0%) | 392 (11.4%) |
| 20 to 24 Years | 123 (3.7%) | 47 (1.4%) |
| 25 to 29 Years | 125 (3.8%) | 63 (1.8%) |
| 30 to 34 Years | 58 (1.8%) | 87 (2.5%) |
| 35 to 39 Years | 78 (2.4%) | 156 (4.5%) |
| 40 to 44 Years | 287 (8.6%) | 251 (7.3%) |
| 45 to 49 Years | 360 (10.8%) | 254 (7.4%) |
| 50 to 54 Years | 375 (11.3%) | 328 (9.5%) |
| 55 to 59 Years | 232 (7.0%) | 183 (5.3%) |
| 60 to 64 Years | 366 (11.0%) | 348 (10.1%) |
| 65 to 69 Years | 291 (8.8%) | 274 (7.9%) |
| 70 to 74 Years | 185 (5.6%) | 190 (5.5%) |
| 75 to 79 Years | 153 (4.6%) | 160 (4.6%) |
| 80 to 84 Years | 68 (2.1%) | 28 (0.8%) |
| 85 Years and over | 17 (0.5%) | 25 (0.7%) |
| Total | 3,320 (100.0%) | 3,453 (100.0%) |
Families and Households in Green Hill
Median Family Size in Green Hill
The median family size in Green Hill is 2.99 persons per family, with married-couple families (1,738 | 86.7%) accounting for the largest median family size of 3.01 persons per family. On the other hand, single female/mother families (190 | 9.5%) represent the smallest median family size with 2.79 persons per family.
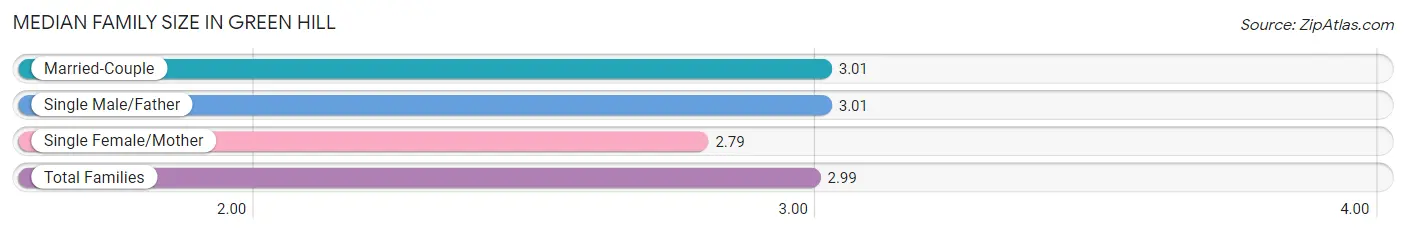
| Family Type | # Families | Family Size |
| Married-Couple | 1,738 (86.7%) | 3.01 |
| Single Male/Father | 76 (3.8%) | 3.01 |
| Single Female/Mother | 190 (9.5%) | 2.79 |
| Total Families | 2,004 (100.0%) | 2.99 |
Median Household Size in Green Hill
The median household size in Green Hill is 2.64 persons per household, with single male/father households (76 | 3.0%) accounting for the largest median household size of 3.22 persons per household. non-family households (563 | 21.9%) represent the smallest median household size with 1.31 persons per household.
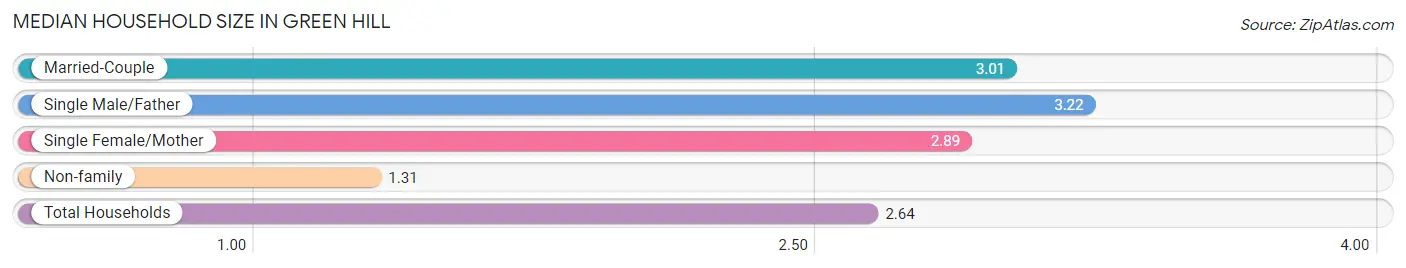
| Household Type | # Households | Household Size |
| Married-Couple | 1,738 (67.7%) | 3.01 |
| Single Male/Father | 76 (3.0%) | 3.22 |
| Single Female/Mother | 190 (7.4%) | 2.89 |
| Non-family | 563 (21.9%) | 1.31 |
| Total Households | 2,567 (100.0%) | 2.64 |
Household Size by Marriage Status in Green Hill
Out of a total of 2,567 households in Green Hill, 2,004 (78.1%) are family households, while 563 (21.9%) are nonfamily households. The most numerous type of family households are 2-person households, comprising 1,101, and the most common type of nonfamily households are 1-person households, comprising 494.
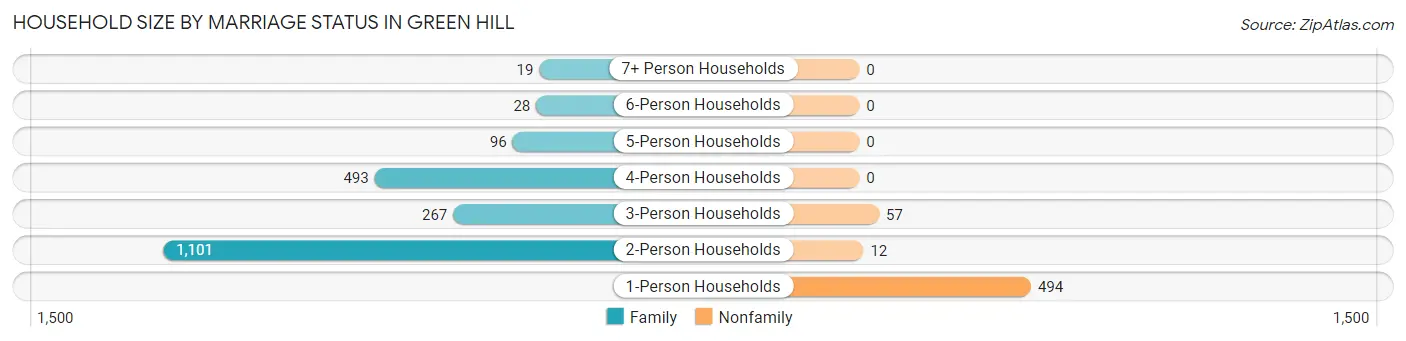
| Household Size | Family Households | Nonfamily Households |
| 1-Person Households | - | 494 (19.2%) |
| 2-Person Households | 1,101 (42.9%) | 12 (0.5%) |
| 3-Person Households | 267 (10.4%) | 57 (2.2%) |
| 4-Person Households | 493 (19.2%) | 0 (0.0%) |
| 5-Person Households | 96 (3.7%) | 0 (0.0%) |
| 6-Person Households | 28 (1.1%) | 0 (0.0%) |
| 7+ Person Households | 19 (0.7%) | 0 (0.0%) |
| Total | 2,004 (78.1%) | 563 (21.9%) |
Female Fertility in Green Hill
Fertility by Age in Green Hill
Average fertility rate in Green Hill is 24.0 births per 1,000 women. Women in the age bracket of 20 to 34 years have the highest fertility rate with 157.0 births per 1,000 women. Women in the age bracket of 20 to 34 years acount for 100.0% of all women with births.
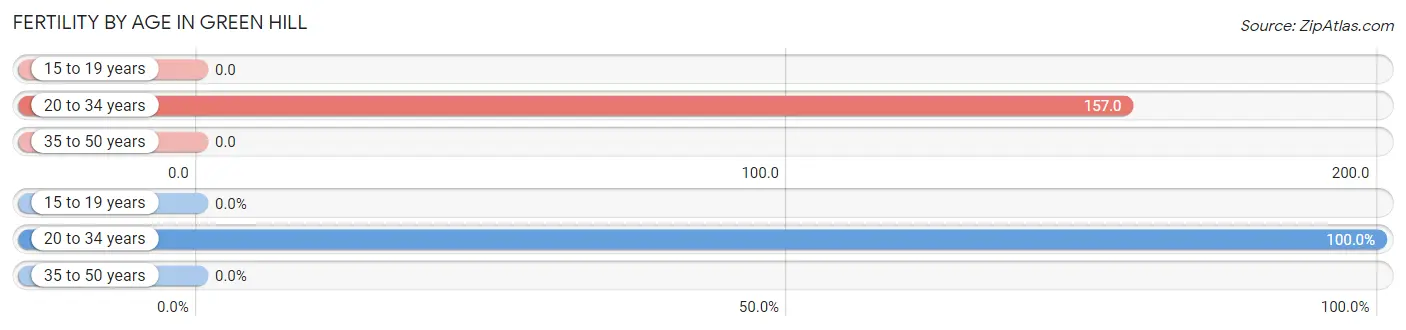
| Age Bracket | Women with Births | Births / 1,000 Women |
| 15 to 19 years | 0 (0.0%) | 0.0 |
| 20 to 34 years | 31 (100.0%) | 157.0 |
| 35 to 50 years | 0 (0.0%) | 0.0 |
| Total | 31 (100.0%) | 24.0 |
Fertility by Age by Marriage Status in Green Hill
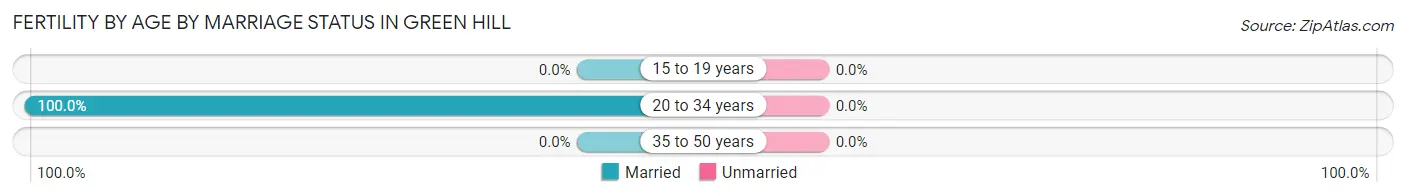
| Age Bracket | Married | Unmarried |
| 15 to 19 years | 0 (0.0%) | 0 (0.0%) |
| 20 to 34 years | 31 (100.0%) | 0 (0.0%) |
| 35 to 50 years | 0 (0.0%) | 0 (0.0%) |
| Total | 31 (100.0%) | 0 (0.0%) |
Fertility by Education in Green Hill
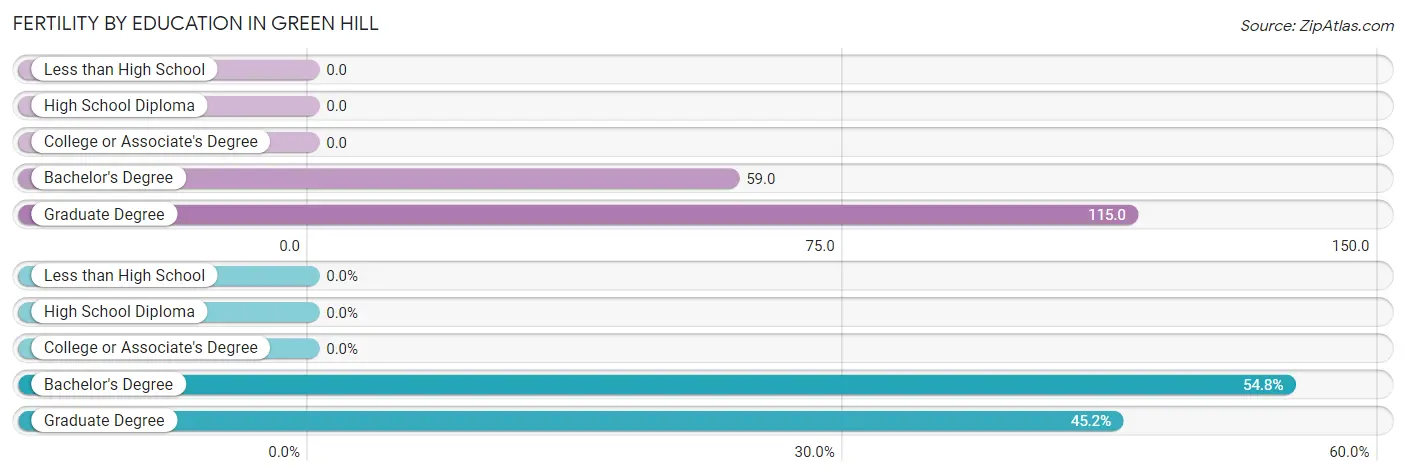
| Educational Attainment | Women with Births | Births / 1,000 Women |
| Less than High School | 0 (0.0%) | 0.0 |
| High School Diploma | 0 (0.0%) | 0.0 |
| College or Associate's Degree | 0 (0.0%) | 0.0 |
| Bachelor's Degree | 17 (54.8%) | 59.0 |
| Graduate Degree | 14 (45.2%) | 115.0 |
| Total | 31 (100.0%) | 24.0 |
Fertility by Education by Marriage Status in Green Hill
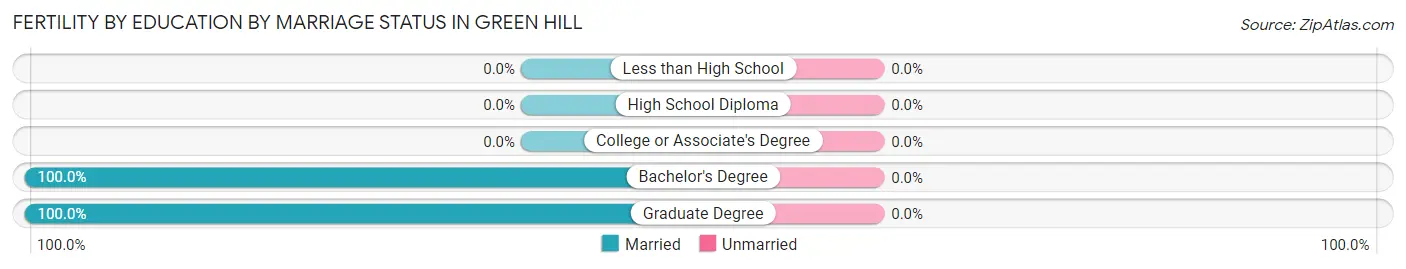
| Educational Attainment | Married | Unmarried |
| Less than High School | 0 (0.0%) | 0 (0.0%) |
| High School Diploma | 0 (0.0%) | 0 (0.0%) |
| College or Associate's Degree | 0 (0.0%) | 0 (0.0%) |
| Bachelor's Degree | 17 (100.0%) | 0 (0.0%) |
| Graduate Degree | 14 (100.0%) | 0 (0.0%) |
| Total | 31 (100.0%) | 0 (0.0%) |
Employment Characteristics in Green Hill
Employment by Class of Employer in Green Hill
Among the 3,066 employed individuals in Green Hill, private company employees (1,954 | 63.7%), not-for-profit organizations (467 | 15.2%), and self-employed (not incorporated) (235 | 7.7%) make up the most common classes of employment.
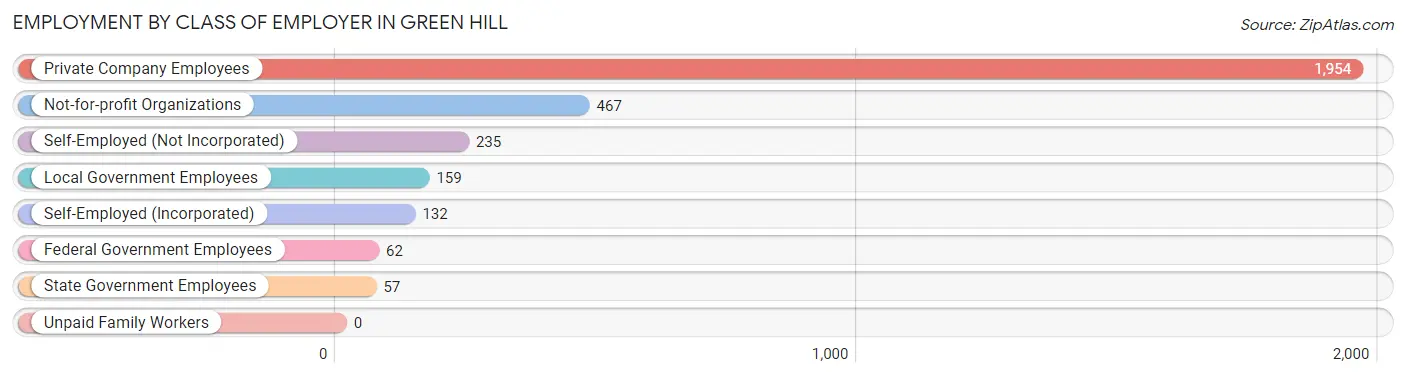
| Employer Class | # Employees | % Employees |
| Private Company Employees | 1,954 | 63.7% |
| Self-Employed (Incorporated) | 132 | 4.3% |
| Self-Employed (Not Incorporated) | 235 | 7.7% |
| Not-for-profit Organizations | 467 | 15.2% |
| Local Government Employees | 159 | 5.2% |
| State Government Employees | 57 | 1.9% |
| Federal Government Employees | 62 | 2.0% |
| Unpaid Family Workers | 0 | 0.0% |
| Total | 3,066 | 100.0% |
Employment Status by Age in Green Hill
According to the labor force statistics for Green Hill, out of the total population over 16 years of age (5,477), 62.1% or 3,401 individuals are in the labor force, with 6.6% or 224 of them unemployed. The age group with the highest labor force participation rate is 45 to 54 years, with 97.2% or 1,280 individuals in the labor force. Within the labor force, the 20 to 24 years age range has the highest percentage of unemployed individuals, with 37.7% or 20 of them being unemployed.
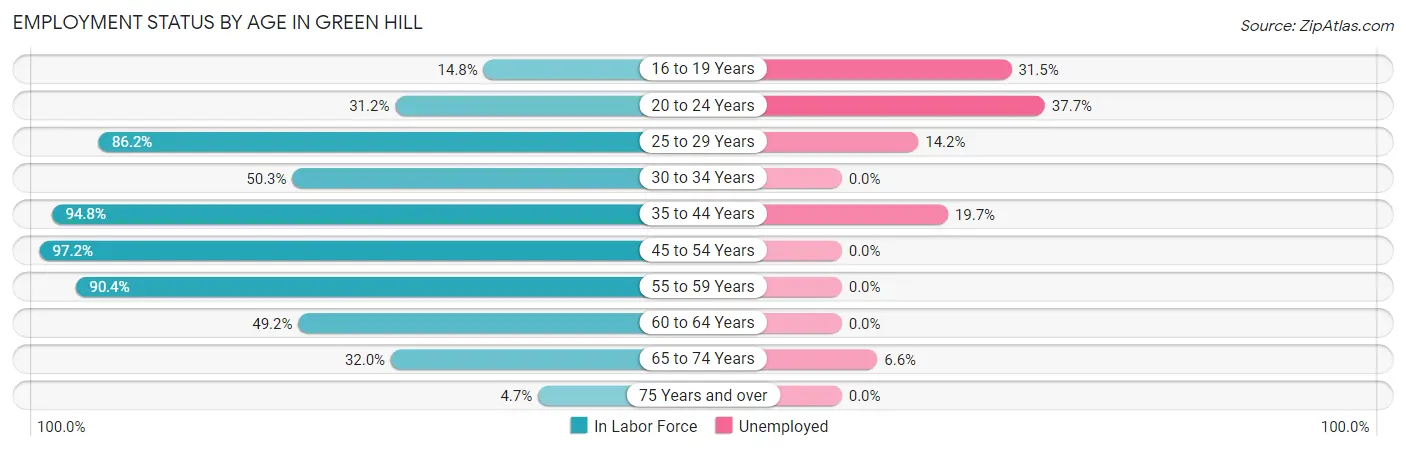
| Age Bracket | In Labor Force | Unemployed |
| 16 to 19 Years | 54 (14.8%) | 17 (31.5%) |
| 20 to 24 Years | 53 (31.2%) | 20 (37.7%) |
| 25 to 29 Years | 162 (86.2%) | 23 (14.2%) |
| 30 to 34 Years | 73 (50.3%) | 0 (0.0%) |
| 35 to 44 Years | 732 (94.8%) | 144 (19.7%) |
| 45 to 54 Years | 1,280 (97.2%) | 0 (0.0%) |
| 55 to 59 Years | 375 (90.4%) | 0 (0.0%) |
| 60 to 64 Years | 351 (49.2%) | 0 (0.0%) |
| 65 to 74 Years | 301 (32.0%) | 20 (6.6%) |
| 75 Years and over | 21 (4.7%) | 0 (0.0%) |
| Total | 3,401 (62.1%) | 224 (6.6%) |
Employment Status by Educational Attainment in Green Hill
According to labor force statistics for Green Hill, 83.7% of individuals (2,972) out of the total population between 25 and 64 years of age (3,551) are in the labor force, with 5.6% or 166 of them being unemployed. The group with the highest labor force participation rate are those with the educational attainment of college / associate degree, with 87.3% or 1,003 individuals in the labor force. Within the labor force, individuals with less than high school education have the highest percentage of unemployment, with 22.8% or 23 of them being unemployed.
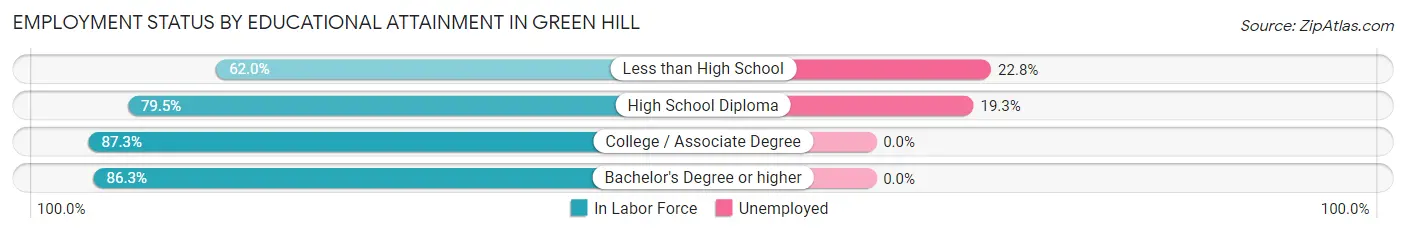
| Educational Attainment | In Labor Force | Unemployed |
| Less than High School | 101 (62.0%) | 37 (22.8%) |
| High School Diploma | 746 (79.5%) | 181 (19.3%) |
| College / Associate Degree | 1,003 (87.3%) | 0 (0.0%) |
| Bachelor's Degree or higher | 1,123 (86.3%) | 0 (0.0%) |
| Total | 2,972 (83.7%) | 199 (5.6%) |
Employment Occupations by Sex in Green Hill
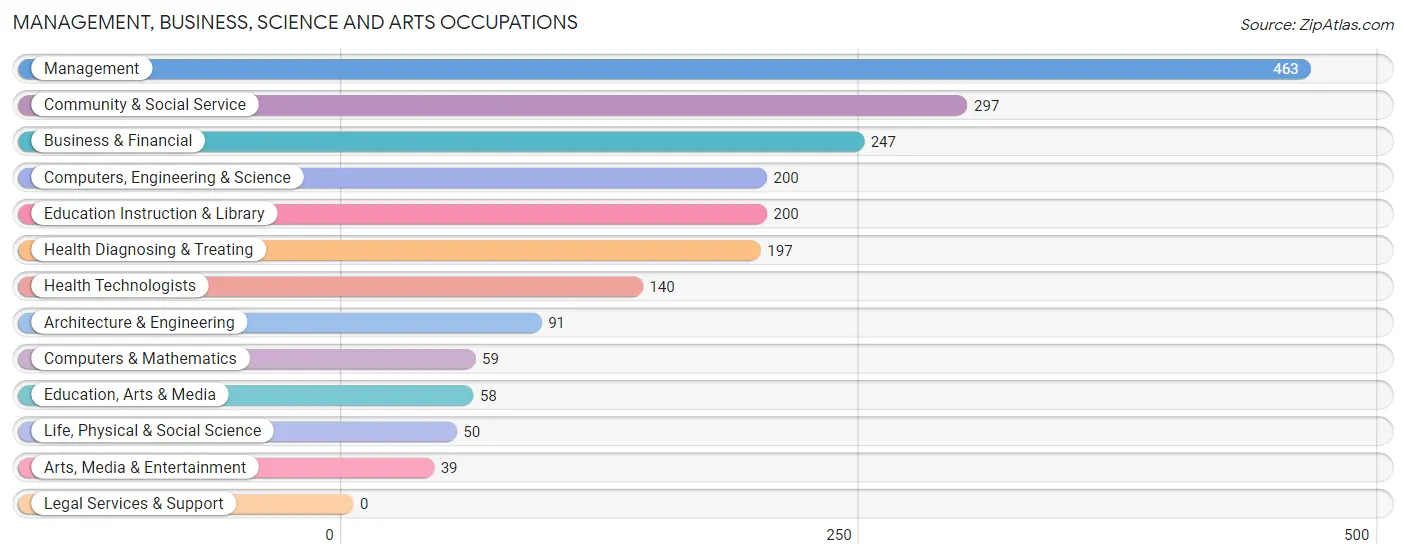
Management, Business, Science and Arts Occupations
The most common Management, Business, Science and Arts occupations in Green Hill are Management (463 | 14.6%), Community & Social Service (297 | 9.3%), Business & Financial (247 | 7.8%), Computers, Engineering & Science (200 | 6.3%), and Education Instruction & Library (200 | 6.3%).
Management, Business, Science and Arts Occupations by Sex
Within the Management, Business, Science and Arts occupations in Green Hill, the most male-oriented occupations are Computers, Engineering & Science (100.0%), Computers & Mathematics (100.0%), and Architecture & Engineering (100.0%), while the most female-oriented occupations are Health Diagnosing & Treating (94.4%), Health Technologists (92.1%), and Business & Financial (71.3%).
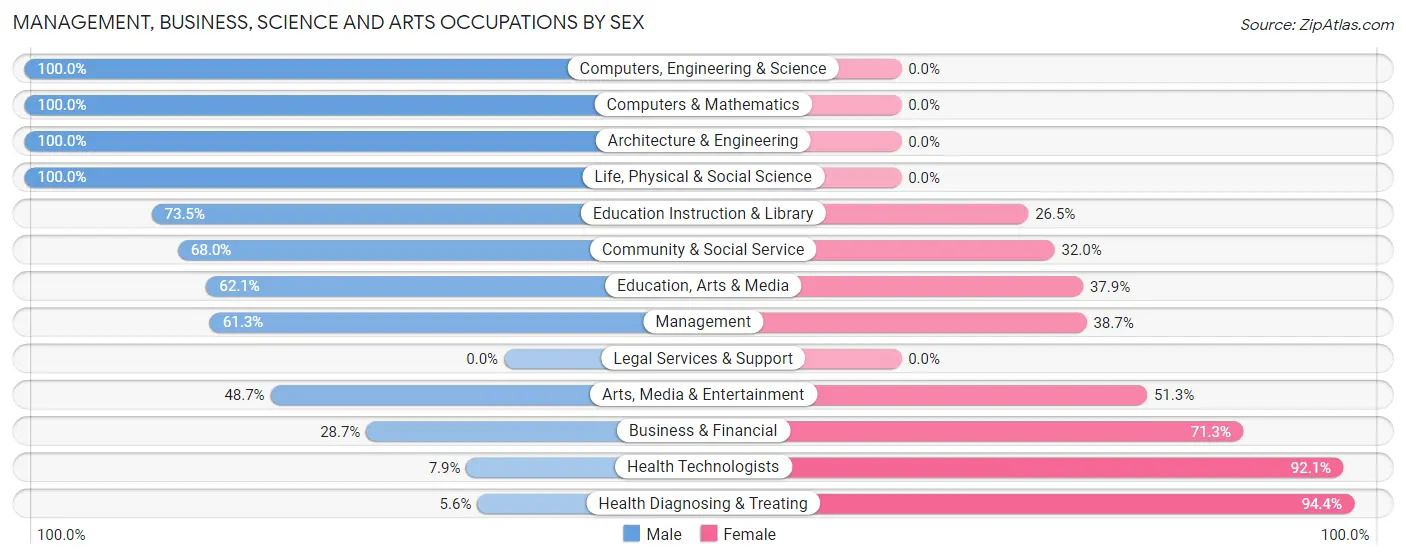
| Occupation | Male | Female |
| Management | 284 (61.3%) | 179 (38.7%) |
| Business & Financial | 71 (28.7%) | 176 (71.3%) |
| Computers, Engineering & Science | 200 (100.0%) | 0 (0.0%) |
| Computers & Mathematics | 59 (100.0%) | 0 (0.0%) |
| Architecture & Engineering | 91 (100.0%) | 0 (0.0%) |
| Life, Physical & Social Science | 50 (100.0%) | 0 (0.0%) |
| Community & Social Service | 202 (68.0%) | 95 (32.0%) |
| Education, Arts & Media | 36 (62.1%) | 22 (37.9%) |
| Legal Services & Support | 0 (0.0%) | 0 (0.0%) |
| Education Instruction & Library | 147 (73.5%) | 53 (26.5%) |
| Arts, Media & Entertainment | 19 (48.7%) | 20 (51.3%) |
| Health Diagnosing & Treating | 11 (5.6%) | 186 (94.4%) |
| Health Technologists | 11 (7.9%) | 129 (92.1%) |
| Total (Category) | 768 (54.7%) | 636 (45.3%) |
| Total (Overall) | 1,662 (52.3%) | 1,516 (47.7%) |
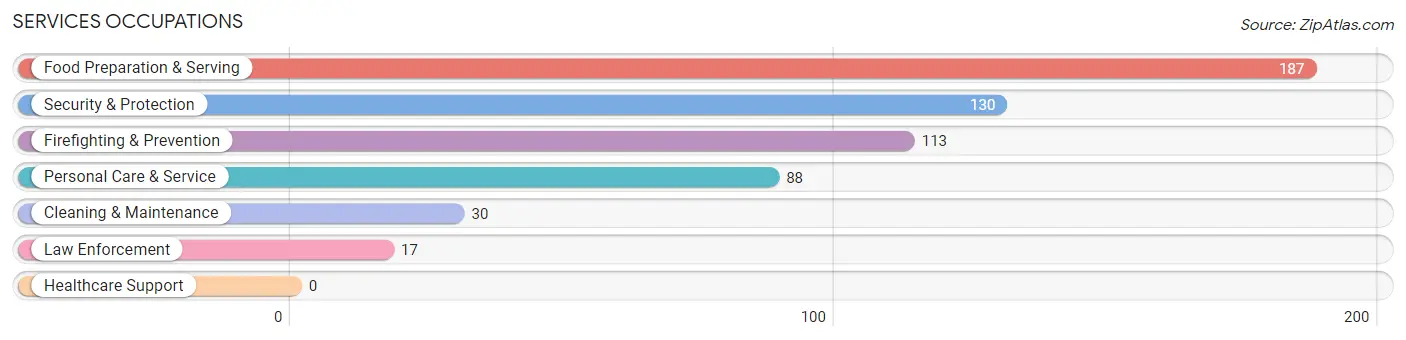
Services Occupations
The most common Services occupations in Green Hill are Food Preparation & Serving (187 | 5.9%), Security & Protection (130 | 4.1%), Firefighting & Prevention (113 | 3.6%), Personal Care & Service (88 | 2.8%), and Cleaning & Maintenance (30 | 0.9%).
Services Occupations by Sex
Within the Services occupations in Green Hill, the most male-oriented occupations are Law Enforcement (100.0%), Security & Protection (81.5%), and Firefighting & Prevention (78.8%), while the most female-oriented occupations are Personal Care & Service (76.1%), Food Preparation & Serving (42.8%), and Cleaning & Maintenance (40.0%).
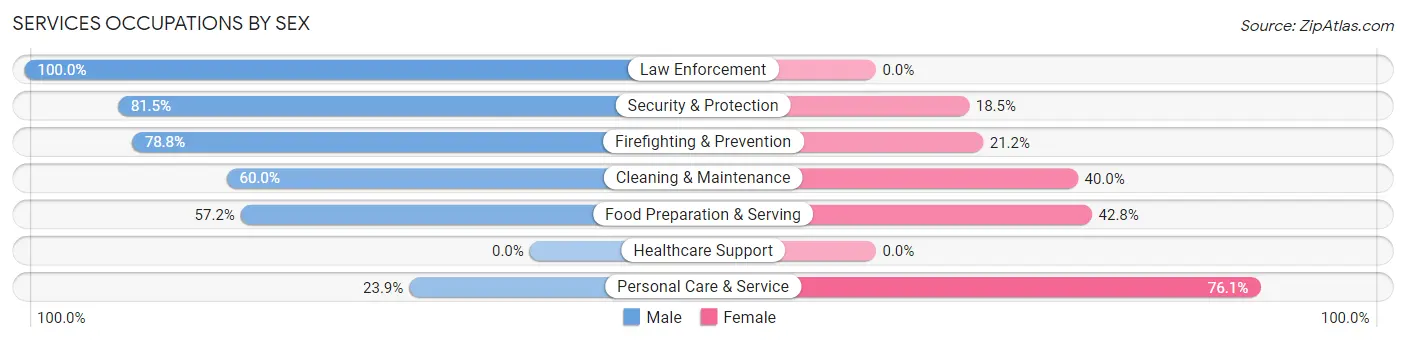
| Occupation | Male | Female |
| Healthcare Support | 0 (0.0%) | 0 (0.0%) |
| Security & Protection | 106 (81.5%) | 24 (18.5%) |
| Firefighting & Prevention | 89 (78.8%) | 24 (21.2%) |
| Law Enforcement | 17 (100.0%) | 0 (0.0%) |
| Food Preparation & Serving | 107 (57.2%) | 80 (42.8%) |
| Cleaning & Maintenance | 18 (60.0%) | 12 (40.0%) |
| Personal Care & Service | 21 (23.9%) | 67 (76.1%) |
| Total (Category) | 252 (57.9%) | 183 (42.1%) |
| Total (Overall) | 1,662 (52.3%) | 1,516 (47.7%) |
Sales and Office Occupations
The most common Sales and Office occupations in Green Hill are Office & Administration (639 | 20.1%), and Sales & Related (357 | 11.2%).

Sales and Office Occupations by Sex
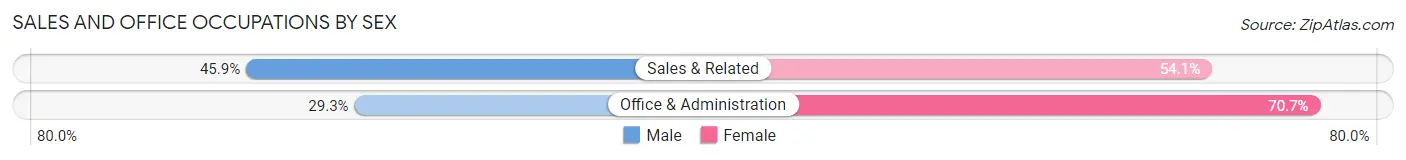
| Occupation | Male | Female |
| Sales & Related | 164 (45.9%) | 193 (54.1%) |
| Office & Administration | 187 (29.3%) | 452 (70.7%) |
| Total (Category) | 351 (35.2%) | 645 (64.8%) |
| Total (Overall) | 1,662 (52.3%) | 1,516 (47.7%) |
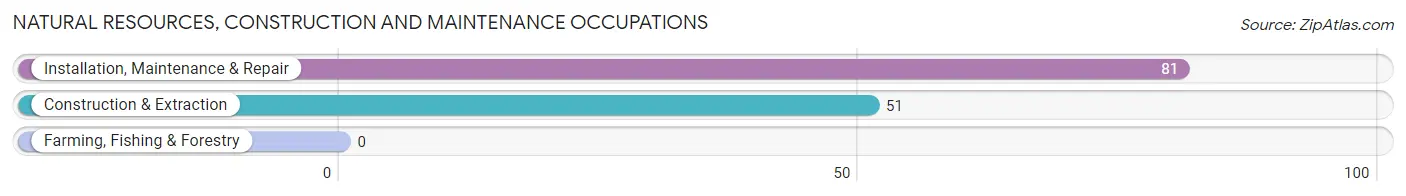
Natural Resources, Construction and Maintenance Occupations
The most common Natural Resources, Construction and Maintenance occupations in Green Hill are Installation, Maintenance & Repair (81 | 2.5%), and Construction & Extraction (51 | 1.6%).
Natural Resources, Construction and Maintenance Occupations by Sex
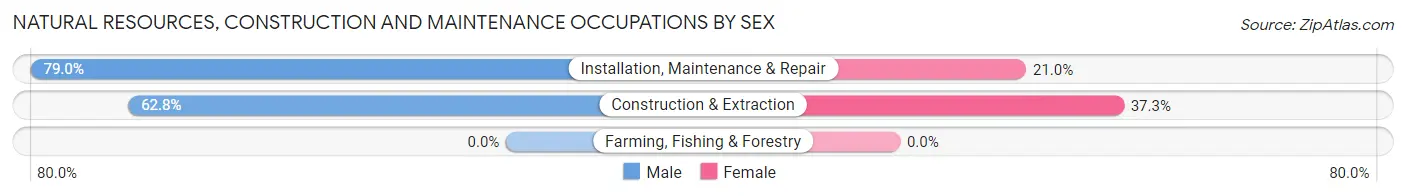
| Occupation | Male | Female |
| Farming, Fishing & Forestry | 0 (0.0%) | 0 (0.0%) |
| Construction & Extraction | 32 (62.7%) | 19 (37.2%) |
| Installation, Maintenance & Repair | 64 (79.0%) | 17 (21.0%) |
| Total (Category) | 96 (72.7%) | 36 (27.3%) |
| Total (Overall) | 1,662 (52.3%) | 1,516 (47.7%) |
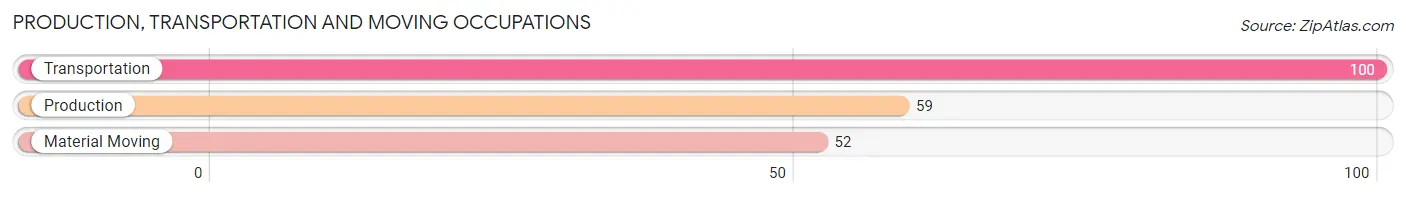
Production, Transportation and Moving Occupations
The most common Production, Transportation and Moving occupations in Green Hill are Transportation (100 | 3.2%), Production (59 | 1.9%), and Material Moving (52 | 1.6%).
Production, Transportation and Moving Occupations by Sex
| Occupation | Male | Female |
| Production | 43 (72.9%) | 16 (27.1%) |
| Transportation | 100 (100.0%) | 0 (0.0%) |
| Material Moving | 52 (100.0%) | 0 (0.0%) |
| Total (Category) | 195 (92.4%) | 16 (7.6%) |
| Total (Overall) | 1,662 (52.3%) | 1,516 (47.7%) |
Employment Industries by Sex in Green Hill
Employment Industries in Green Hill
The major employment industries in Green Hill include Health Care & Social Assistance (455 | 14.3%), Finance & Insurance (374 | 11.8%), Retail Trade (300 | 9.4%), Educational Services (262 | 8.2%), and Accommodation & Food Services (226 | 7.1%).
Employment Industries by Sex in Green Hill
The Green Hill industries that see more men than women are Utilities (100.0%), Information (100.0%), and Enterprise Management (100.0%), whereas the industries that tend to have a higher number of women are Health Care & Social Assistance (91.6%), Wholesale Trade (64.1%), and Real Estate, Rental & Leasing (63.2%).
| Industry | Male | Female |
| Agriculture, Fishing & Hunting | 0 (0.0%) | 0 (0.0%) |
| Mining, Quarrying, & Extraction | 0 (0.0%) | 0 (0.0%) |
| Construction | 39 (63.9%) | 22 (36.1%) |
| Manufacturing | 132 (70.6%) | 55 (29.4%) |
| Wholesale Trade | 28 (35.9%) | 50 (64.1%) |
| Retail Trade | 126 (42.0%) | 174 (58.0%) |
| Transportation & Warehousing | 169 (80.9%) | 40 (19.1%) |
| Utilities | 55 (100.0%) | 0 (0.0%) |
| Information | 74 (100.0%) | 0 (0.0%) |
| Finance & Insurance | 149 (39.8%) | 225 (60.2%) |
| Real Estate, Rental & Leasing | 46 (36.8%) | 79 (63.2%) |
| Professional & Scientific | 65 (41.1%) | 93 (58.9%) |
| Enterprise Management | 16 (100.0%) | 0 (0.0%) |
| Administrative & Support | 116 (84.7%) | 21 (15.3%) |
| Educational Services | 147 (56.1%) | 115 (43.9%) |
| Health Care & Social Assistance | 38 (8.4%) | 417 (91.6%) |
| Arts, Entertainment & Recreation | 78 (81.2%) | 18 (18.8%) |
| Accommodation & Food Services | 126 (55.7%) | 100 (44.3%) |
| Public Administration | 185 (82.6%) | 39 (17.4%) |
| Total | 1,662 (52.3%) | 1,516 (47.7%) |
Education in Green Hill
School Enrollment in Green Hill
The most common levels of schooling among the 1,703 students in Green Hill are high school (586 | 34.4%), elementary school (443 | 26.0%), and middle school (357 | 21.0%).
| School Level | # Students | % Students |
| Nursery / Preschool | 21 | 1.2% |
| Kindergarten | 57 | 3.4% |
| Elementary School | 443 | 26.0% |
| Middle School | 357 | 21.0% |
| High School | 586 | 34.4% |
| College / Undergraduate | 157 | 9.2% |
| Graduate / Professional | 82 | 4.8% |
| Total | 1,703 | 100.0% |
School Enrollment by Age by Funding Source in Green Hill
Out of a total of 1,703 students who are enrolled in schools in Green Hill, 191 (11.2%) attend a private institution, while the remaining 1,512 (88.8%) are enrolled in public schools. The age group of 3 to 4 year olds has the highest likelihood of being enrolled in private schools, with 21 (100.0% in the age bracket) enrolled. Conversely, the age group of 35 years and over has the lowest likelihood of being enrolled in a private school, with 125 (100.0% in the age bracket) attending a public institution.
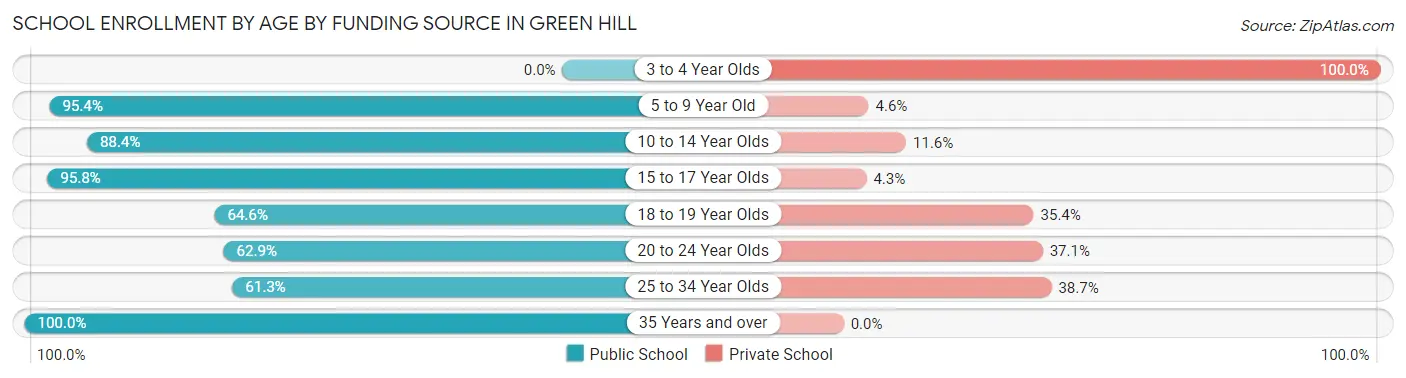
| Age Bracket | Public School | Private School |
| 3 to 4 Year Olds | 0 (0.0%) | 21 (100.0%) |
| 5 to 9 Year Old | 288 (95.4%) | 14 (4.6%) |
| 10 to 14 Year Olds | 509 (88.4%) | 67 (11.6%) |
| 15 to 17 Year Olds | 473 (95.8%) | 21 (4.3%) |
| 18 to 19 Year Olds | 42 (64.6%) | 23 (35.4%) |
| 20 to 24 Year Olds | 56 (62.9%) | 33 (37.1%) |
| 25 to 34 Year Olds | 19 (61.3%) | 12 (38.7%) |
| 35 Years and over | 125 (100.0%) | 0 (0.0%) |
| Total | 1,512 (88.8%) | 191 (11.2%) |
Educational Attainment by Field of Study in Green Hill
Business (440 | 24.0%), science & technology (228 | 12.4%), liberal arts & history (191 | 10.4%), bio, nature & agricultural (171 | 9.3%), and education (160 | 8.7%) are the most common fields of study among 1,835 individuals in Green Hill who have obtained a bachelor's degree or higher.
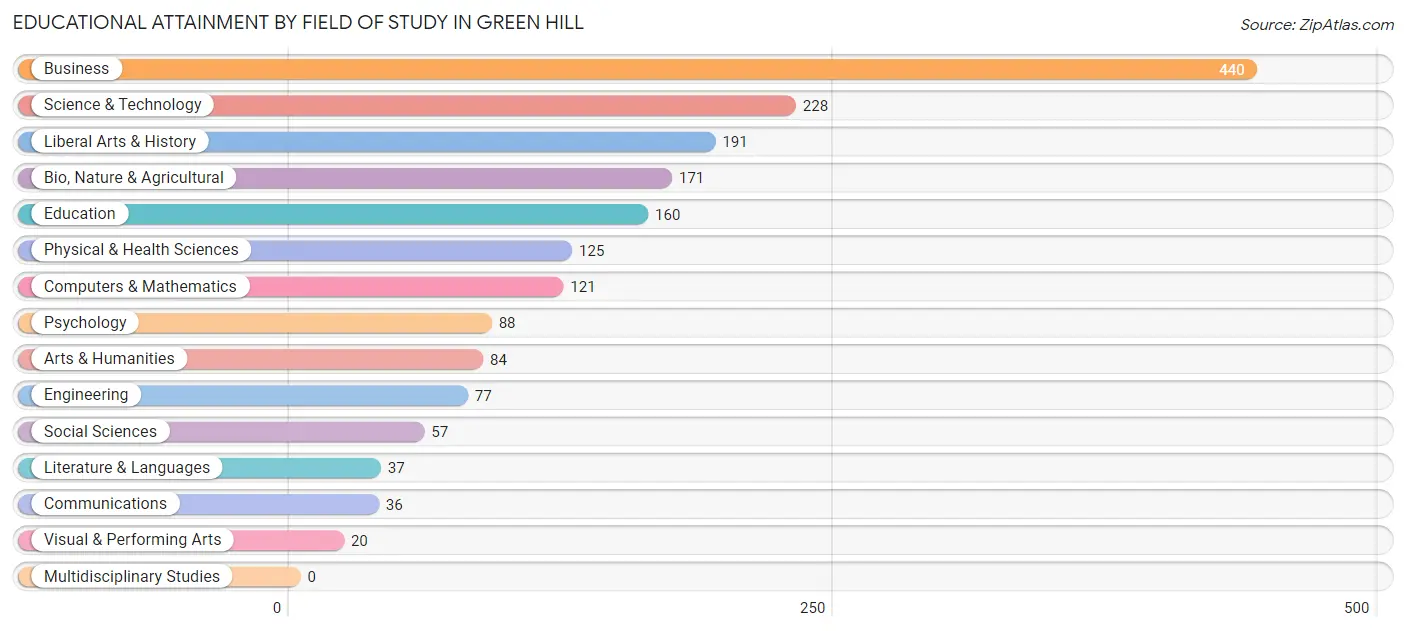
| Field of Study | # Graduates | % Graduates |
| Computers & Mathematics | 121 | 6.6% |
| Bio, Nature & Agricultural | 171 | 9.3% |
| Physical & Health Sciences | 125 | 6.8% |
| Psychology | 88 | 4.8% |
| Social Sciences | 57 | 3.1% |
| Engineering | 77 | 4.2% |
| Multidisciplinary Studies | 0 | 0.0% |
| Science & Technology | 228 | 12.4% |
| Business | 440 | 24.0% |
| Education | 160 | 8.7% |
| Literature & Languages | 37 | 2.0% |
| Liberal Arts & History | 191 | 10.4% |
| Visual & Performing Arts | 20 | 1.1% |
| Communications | 36 | 2.0% |
| Arts & Humanities | 84 | 4.6% |
| Total | 1,835 | 100.0% |
Transportation & Commute in Green Hill
Vehicle Availability by Sex in Green Hill
The most prevalent vehicle ownership categories in Green Hill are males with 2 vehicles (782, accounting for 47.6%) and females with 2 vehicles (751, making up 54.9%).
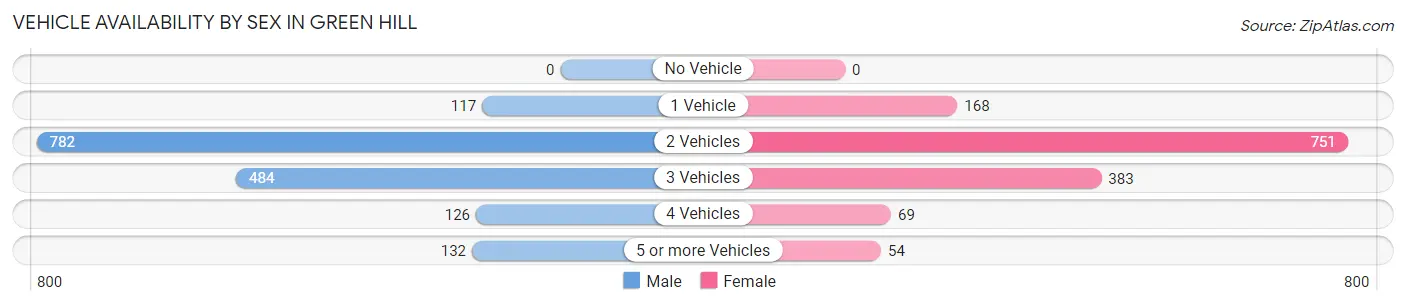
| Vehicles Available | Male | Female |
| No Vehicle | 0 (0.0%) | 0 (0.0%) |
| 1 Vehicle | 117 (7.1%) | 168 (11.8%) |
| 2 Vehicles | 782 (47.6%) | 751 (52.7%) |
| 3 Vehicles | 484 (29.5%) | 383 (26.9%) |
| 4 Vehicles | 126 (7.7%) | 69 (4.8%) |
| 5 or more Vehicles | 132 (8.0%) | 54 (3.8%) |
| Total | 1,641 (100.0%) | 1,425 (100.0%) |
Commute Time in Green Hill
The most frequently occuring commute durations in Green Hill are 30 to 34 minutes (628 commuters, 22.6%), 15 to 19 minutes (343 commuters, 12.4%), and 25 to 29 minutes (292 commuters, 10.5%).
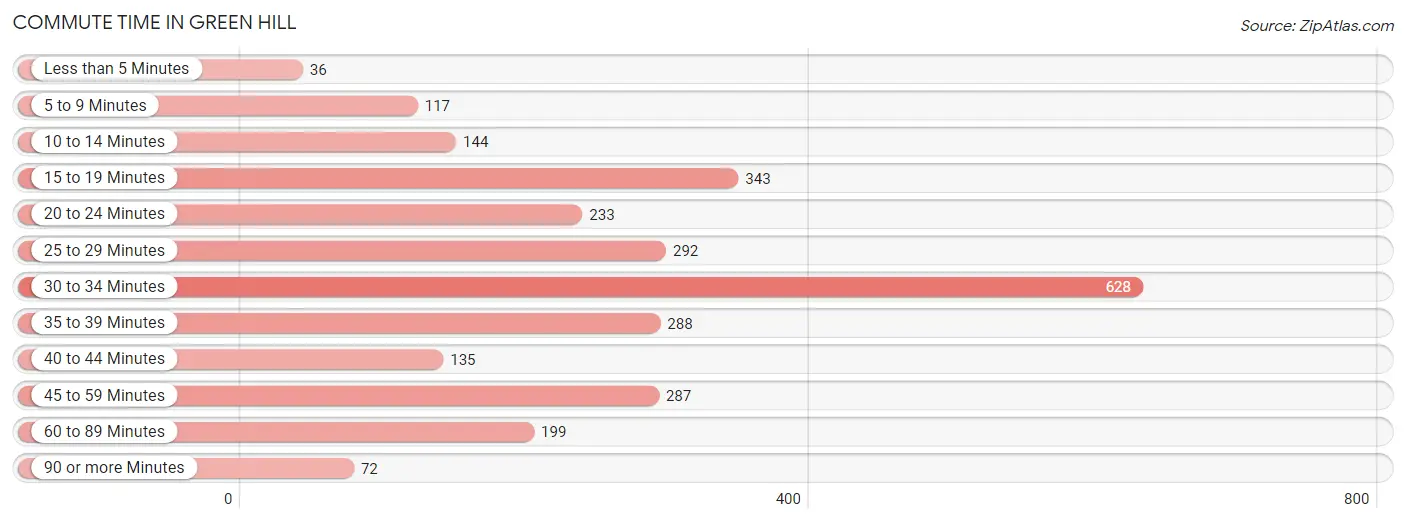
| Commute Time | # Commuters | % Commuters |
| Less than 5 Minutes | 36 | 1.3% |
| 5 to 9 Minutes | 117 | 4.2% |
| 10 to 14 Minutes | 144 | 5.2% |
| 15 to 19 Minutes | 343 | 12.4% |
| 20 to 24 Minutes | 233 | 8.4% |
| 25 to 29 Minutes | 292 | 10.5% |
| 30 to 34 Minutes | 628 | 22.6% |
| 35 to 39 Minutes | 288 | 10.4% |
| 40 to 44 Minutes | 135 | 4.9% |
| 45 to 59 Minutes | 287 | 10.3% |
| 60 to 89 Minutes | 199 | 7.2% |
| 90 or more Minutes | 72 | 2.6% |
Commute Time by Sex in Green Hill
The most common commute times in Green Hill are 15 to 19 minutes (299 commuters, 19.6%) for males and 30 to 34 minutes (337 commuters, 27.0%) for females.
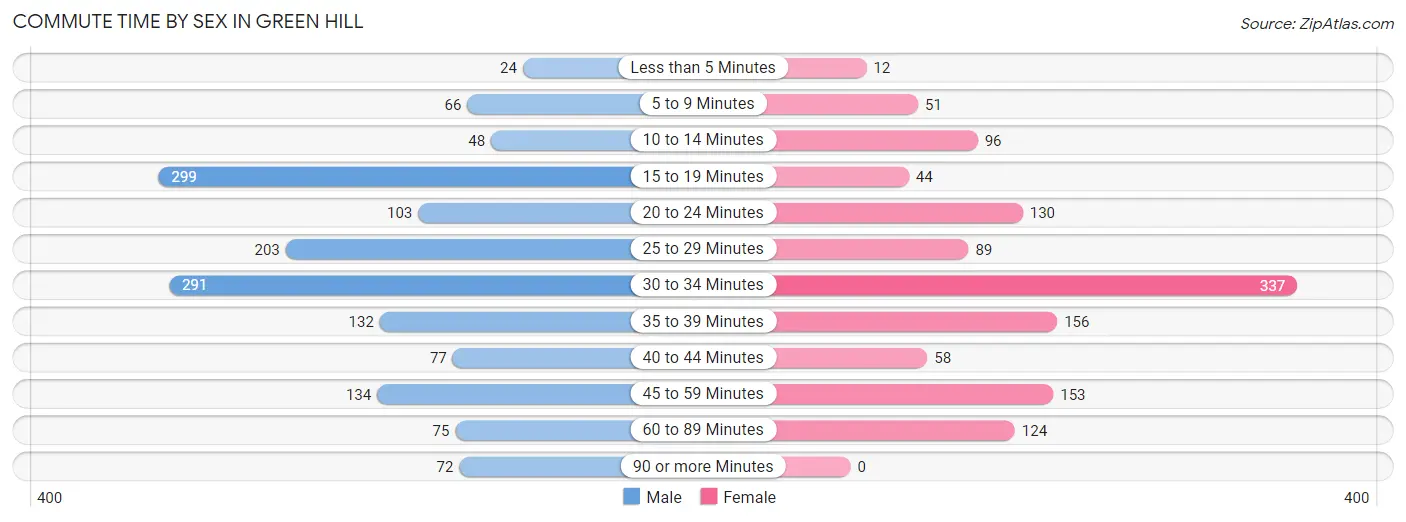
| Commute Time | Male | Female |
| Less than 5 Minutes | 24 (1.6%) | 12 (1.0%) |
| 5 to 9 Minutes | 66 (4.3%) | 51 (4.1%) |
| 10 to 14 Minutes | 48 (3.2%) | 96 (7.7%) |
| 15 to 19 Minutes | 299 (19.6%) | 44 (3.5%) |
| 20 to 24 Minutes | 103 (6.8%) | 130 (10.4%) |
| 25 to 29 Minutes | 203 (13.3%) | 89 (7.1%) |
| 30 to 34 Minutes | 291 (19.1%) | 337 (27.0%) |
| 35 to 39 Minutes | 132 (8.7%) | 156 (12.5%) |
| 40 to 44 Minutes | 77 (5.1%) | 58 (4.6%) |
| 45 to 59 Minutes | 134 (8.8%) | 153 (12.2%) |
| 60 to 89 Minutes | 75 (4.9%) | 124 (9.9%) |
| 90 or more Minutes | 72 (4.7%) | 0 (0.0%) |
Time of Departure to Work by Sex in Green Hill
The most frequent times of departure to work in Green Hill are 7:00 AM to 7:29 AM (334, 21.9%) for males and 7:00 AM to 7:29 AM (400, 32.0%) for females.
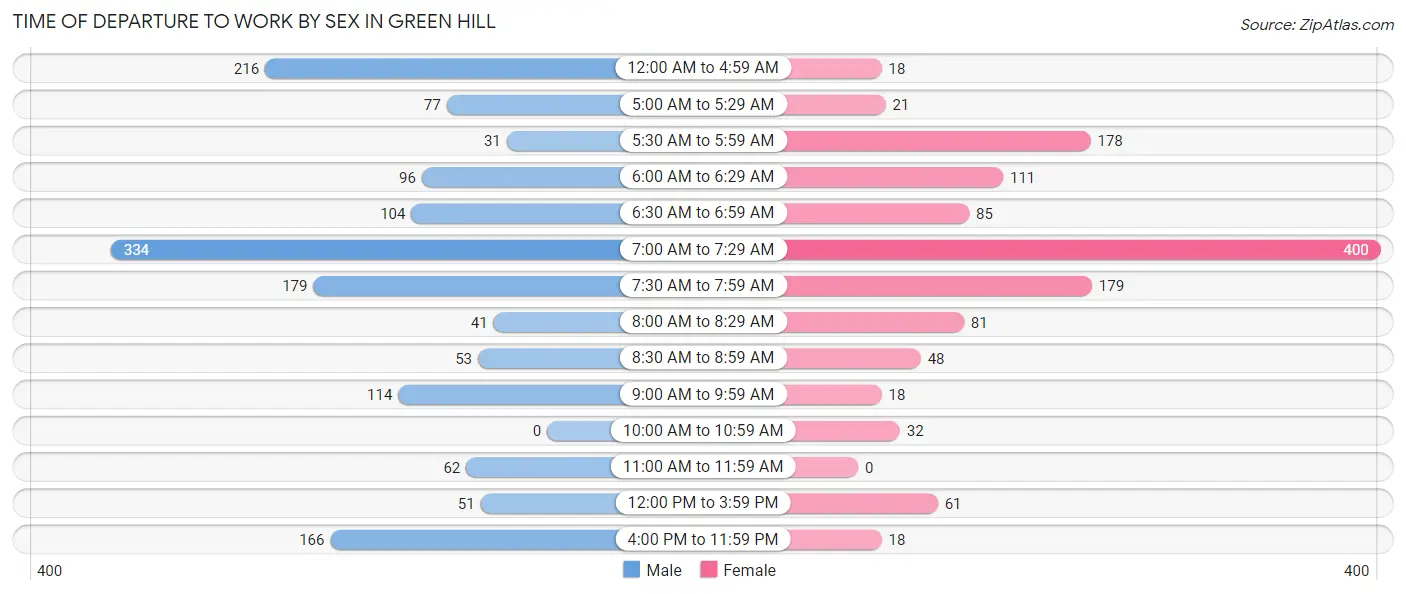
| Time of Departure | Male | Female |
| 12:00 AM to 4:59 AM | 216 (14.2%) | 18 (1.4%) |
| 5:00 AM to 5:29 AM | 77 (5.1%) | 21 (1.7%) |
| 5:30 AM to 5:59 AM | 31 (2.0%) | 178 (14.2%) |
| 6:00 AM to 6:29 AM | 96 (6.3%) | 111 (8.9%) |
| 6:30 AM to 6:59 AM | 104 (6.8%) | 85 (6.8%) |
| 7:00 AM to 7:29 AM | 334 (21.9%) | 400 (32.0%) |
| 7:30 AM to 7:59 AM | 179 (11.7%) | 179 (14.3%) |
| 8:00 AM to 8:29 AM | 41 (2.7%) | 81 (6.5%) |
| 8:30 AM to 8:59 AM | 53 (3.5%) | 48 (3.8%) |
| 9:00 AM to 9:59 AM | 114 (7.5%) | 18 (1.4%) |
| 10:00 AM to 10:59 AM | 0 (0.0%) | 32 (2.6%) |
| 11:00 AM to 11:59 AM | 62 (4.1%) | 0 (0.0%) |
| 12:00 PM to 3:59 PM | 51 (3.4%) | 61 (4.9%) |
| 4:00 PM to 11:59 PM | 166 (10.9%) | 18 (1.4%) |
| Total | 1,524 (100.0%) | 1,250 (100.0%) |
Housing Occupancy in Green Hill
Occupancy by Ownership in Green Hill
Of the total 2,567 dwellings in Green Hill, owner-occupied units account for 2,269 (88.4%), while renter-occupied units make up 298 (11.6%).
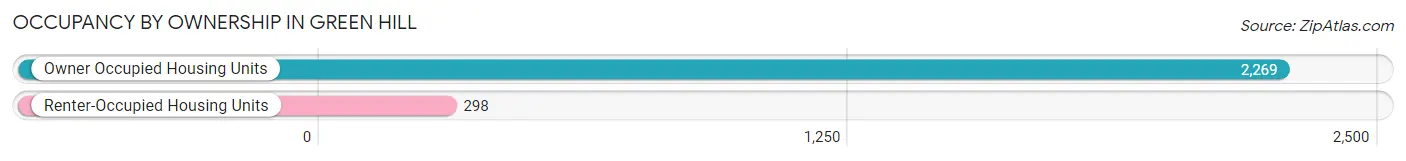
| Occupancy | # Housing Units | % Housing Units |
| Owner Occupied Housing Units | 2,269 | 88.4% |
| Renter-Occupied Housing Units | 298 | 11.6% |
| Total Occupied Housing Units | 2,567 | 100.0% |
Occupancy by Household Size in Green Hill
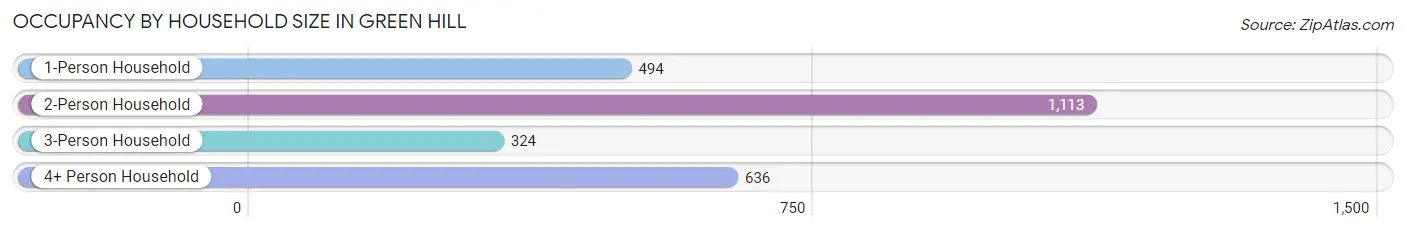
| Household Size | # Housing Units | % Housing Units |
| 1-Person Household | 494 | 19.2% |
| 2-Person Household | 1,113 | 43.4% |
| 3-Person Household | 324 | 12.6% |
| 4+ Person Household | 636 | 24.8% |
| Total Housing Units | 2,567 | 100.0% |
Occupancy by Ownership by Household Size in Green Hill
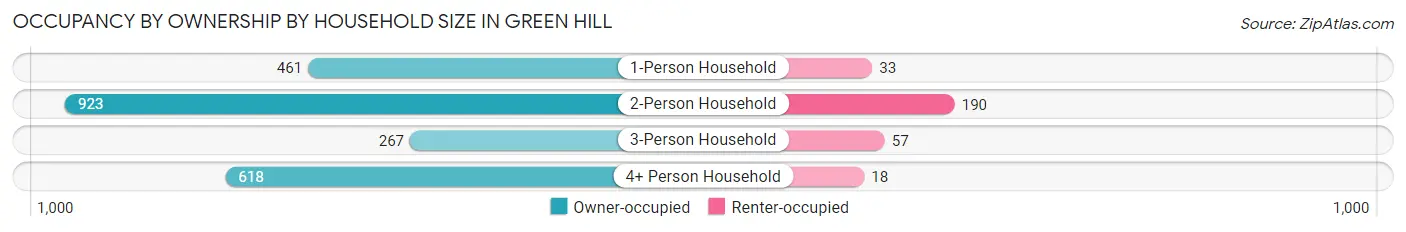
| Household Size | Owner-occupied | Renter-occupied |
| 1-Person Household | 461 (93.3%) | 33 (6.7%) |
| 2-Person Household | 923 (82.9%) | 190 (17.1%) |
| 3-Person Household | 267 (82.4%) | 57 (17.6%) |
| 4+ Person Household | 618 (97.2%) | 18 (2.8%) |
| Total Housing Units | 2,269 (88.4%) | 298 (11.6%) |
Occupancy by Educational Attainment in Green Hill
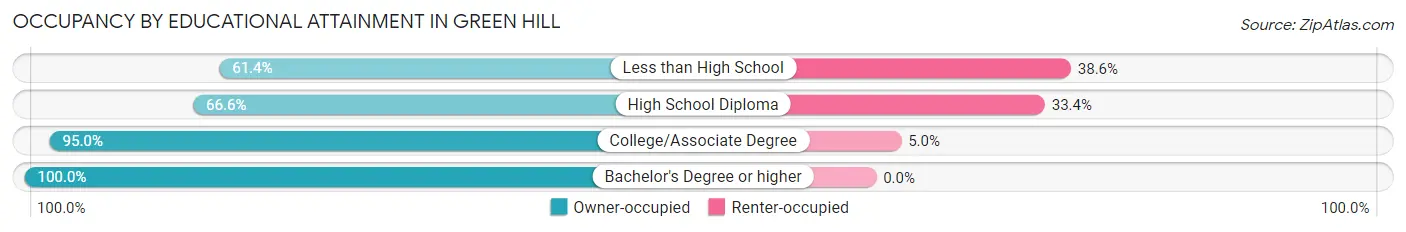
| Household Size | Owner-occupied | Renter-occupied |
| Less than High School | 35 (61.4%) | 22 (38.6%) |
| High School Diploma | 464 (66.6%) | 233 (33.4%) |
| College/Associate Degree | 823 (95.0%) | 43 (5.0%) |
| Bachelor's Degree or higher | 947 (100.0%) | 0 (0.0%) |
Occupancy by Age of Householder in Green Hill
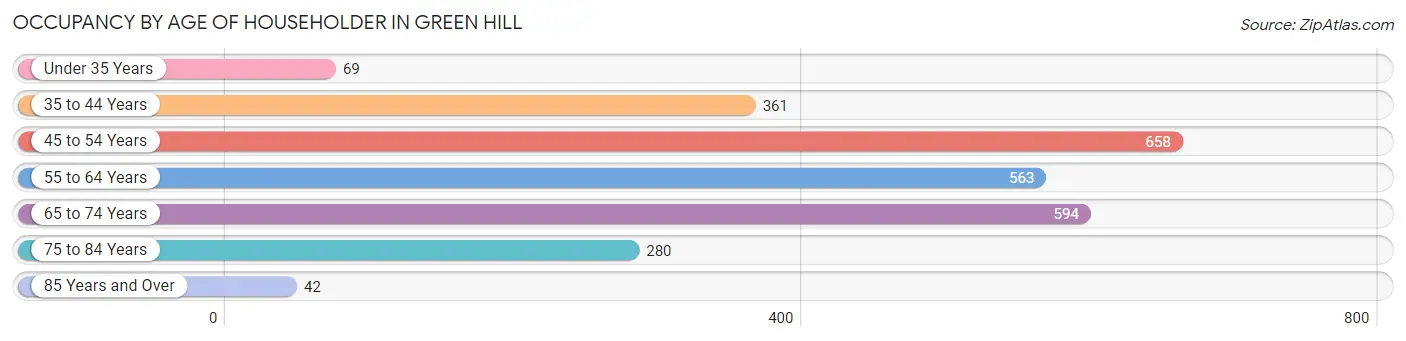
| Age Bracket | # Households | % Households |
| Under 35 Years | 69 | 2.7% |
| 35 to 44 Years | 361 | 14.1% |
| 45 to 54 Years | 658 | 25.6% |
| 55 to 64 Years | 563 | 21.9% |
| 65 to 74 Years | 594 | 23.1% |
| 75 to 84 Years | 280 | 10.9% |
| 85 Years and Over | 42 | 1.6% |
| Total | 2,567 | 100.0% |
Housing Finances in Green Hill
Median Income by Occupancy in Green Hill
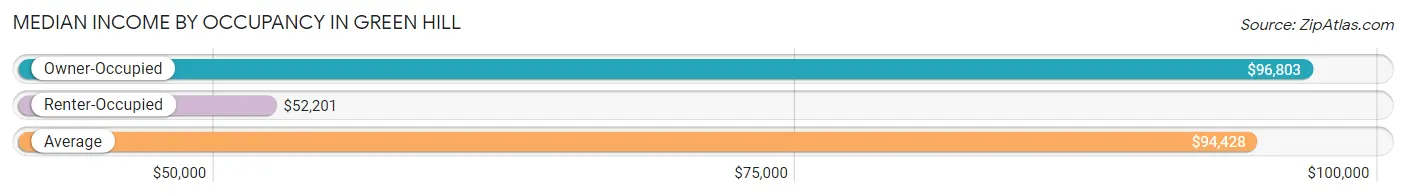
| Occupancy Type | # Households | Median Income |
| Owner-Occupied | 2,269 (88.4%) | $96,803 |
| Renter-Occupied | 298 (11.6%) | $52,201 |
| Average | 2,567 (100.0%) | $94,428 |
Occupancy by Householder Income Bracket in Green Hill
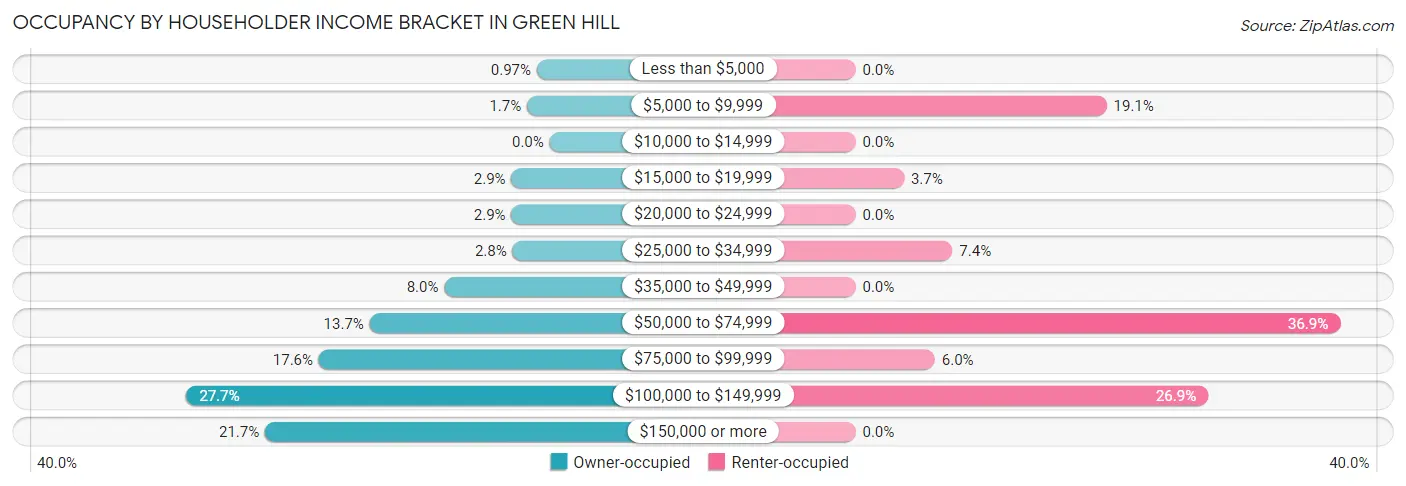
| Income Bracket | Owner-occupied | Renter-occupied |
| Less than $5,000 | 22 (1.0%) | 0 (0.0%) |
| $5,000 to $9,999 | 39 (1.7%) | 57 (19.1%) |
| $10,000 to $14,999 | 0 (0.0%) | 0 (0.0%) |
| $15,000 to $19,999 | 66 (2.9%) | 11 (3.7%) |
| $20,000 to $24,999 | 66 (2.9%) | 0 (0.0%) |
| $25,000 to $34,999 | 64 (2.8%) | 22 (7.4%) |
| $35,000 to $49,999 | 182 (8.0%) | 0 (0.0%) |
| $50,000 to $74,999 | 311 (13.7%) | 110 (36.9%) |
| $75,000 to $99,999 | 399 (17.6%) | 18 (6.0%) |
| $100,000 to $149,999 | 628 (27.7%) | 80 (26.9%) |
| $150,000 or more | 492 (21.7%) | 0 (0.0%) |
| Total | 2,269 (100.0%) | 298 (100.0%) |
Monthly Housing Cost Tiers in Green Hill
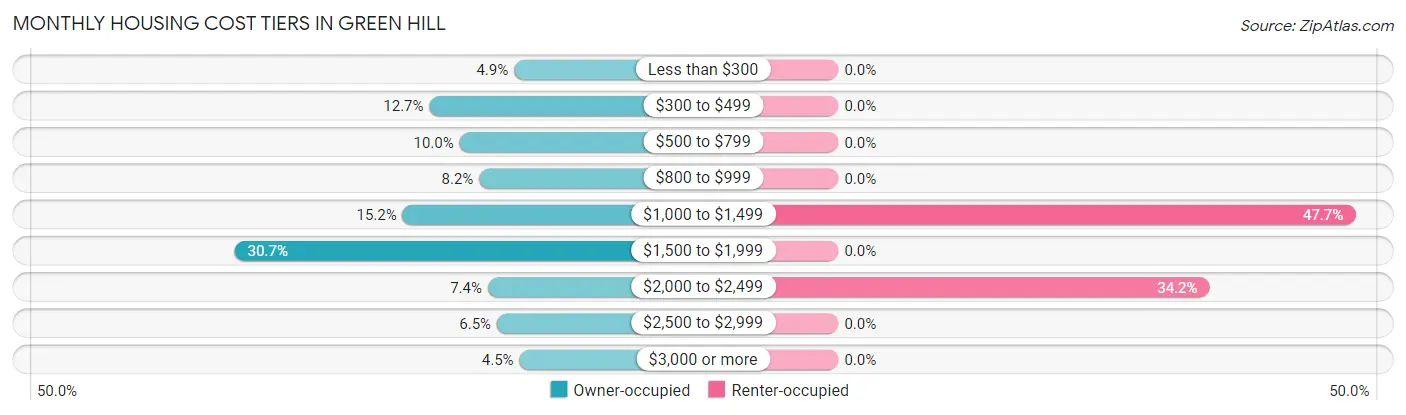
| Monthly Cost | Owner-occupied | Renter-occupied |
| Less than $300 | 112 (4.9%) | 0 (0.0%) |
| $300 to $499 | 289 (12.7%) | 0 (0.0%) |
| $500 to $799 | 226 (10.0%) | 0 (0.0%) |
| $800 to $999 | 185 (8.2%) | 0 (0.0%) |
| $1,000 to $1,499 | 345 (15.2%) | 142 (47.6%) |
| $1,500 to $1,999 | 696 (30.7%) | 0 (0.0%) |
| $2,000 to $2,499 | 167 (7.4%) | 102 (34.2%) |
| $2,500 to $2,999 | 148 (6.5%) | 0 (0.0%) |
| $3,000 or more | 101 (4.4%) | 0 (0.0%) |
| Total | 2,269 (100.0%) | 298 (100.0%) |
Physical Housing Characteristics in Green Hill
Housing Structures in Green Hill
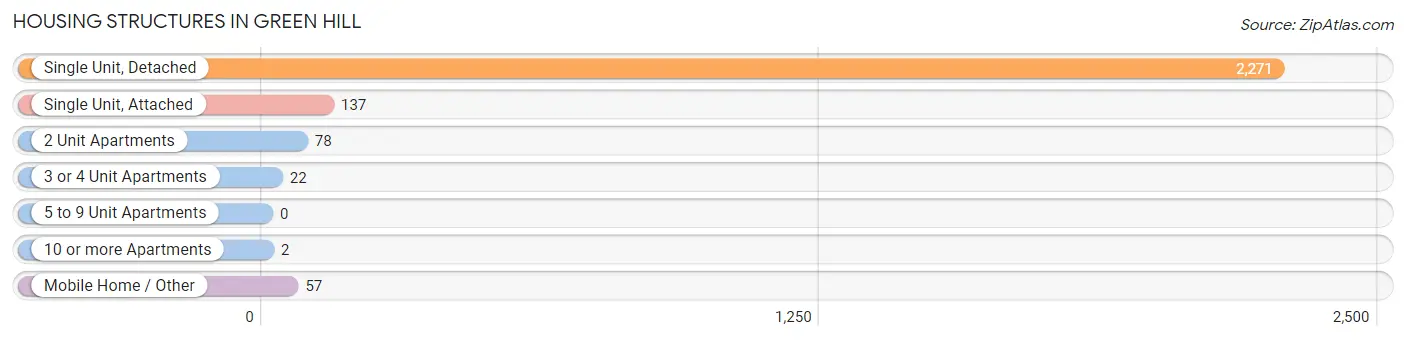
| Structure Type | # Housing Units | % Housing Units |
| Single Unit, Detached | 2,271 | 88.5% |
| Single Unit, Attached | 137 | 5.3% |
| 2 Unit Apartments | 78 | 3.0% |
| 3 or 4 Unit Apartments | 22 | 0.9% |
| 5 to 9 Unit Apartments | 0 | 0.0% |
| 10 or more Apartments | 2 | 0.1% |
| Mobile Home / Other | 57 | 2.2% |
| Total | 2,567 | 100.0% |
Housing Structures by Occupancy in Green Hill
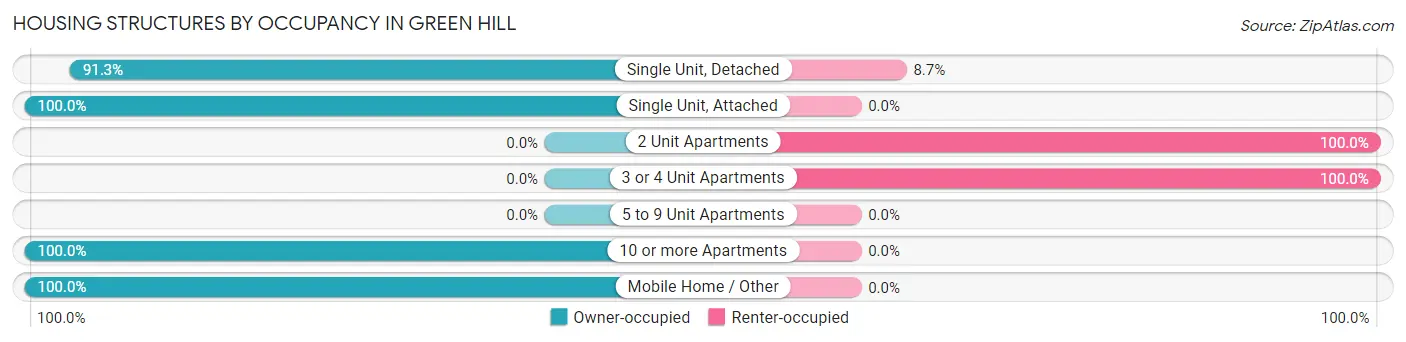
| Structure Type | Owner-occupied | Renter-occupied |
| Single Unit, Detached | 2,073 (91.3%) | 198 (8.7%) |
| Single Unit, Attached | 137 (100.0%) | 0 (0.0%) |
| 2 Unit Apartments | 0 (0.0%) | 78 (100.0%) |
| 3 or 4 Unit Apartments | 0 (0.0%) | 22 (100.0%) |
| 5 to 9 Unit Apartments | 0 (0.0%) | 0 (0.0%) |
| 10 or more Apartments | 2 (100.0%) | 0 (0.0%) |
| Mobile Home / Other | 57 (100.0%) | 0 (0.0%) |
| Total | 2,269 (88.4%) | 298 (11.6%) |
Housing Structures by Number of Rooms in Green Hill
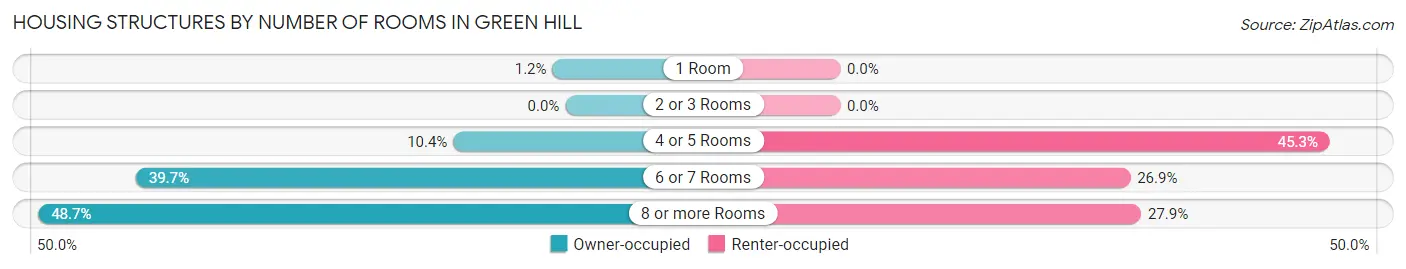
| Number of Rooms | Owner-occupied | Renter-occupied |
| 1 Room | 27 (1.2%) | 0 (0.0%) |
| 2 or 3 Rooms | 0 (0.0%) | 0 (0.0%) |
| 4 or 5 Rooms | 235 (10.4%) | 135 (45.3%) |
| 6 or 7 Rooms | 901 (39.7%) | 80 (26.9%) |
| 8 or more Rooms | 1,106 (48.7%) | 83 (27.9%) |
| Total | 2,269 (100.0%) | 298 (100.0%) |
Housing Structure by Heating Type in Green Hill
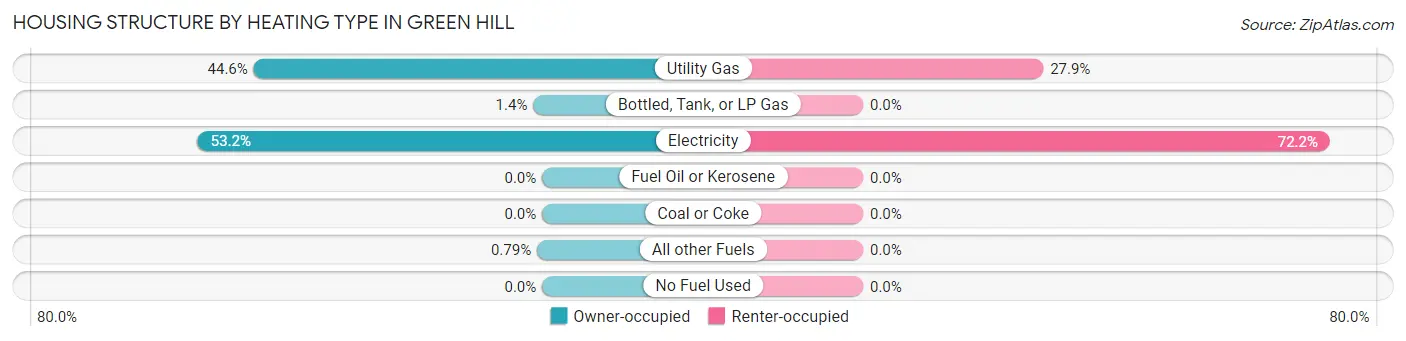
| Heating Type | Owner-occupied | Renter-occupied |
| Utility Gas | 1,012 (44.6%) | 83 (27.9%) |
| Bottled, Tank, or LP Gas | 31 (1.4%) | 0 (0.0%) |
| Electricity | 1,208 (53.2%) | 215 (72.2%) |
| Fuel Oil or Kerosene | 0 (0.0%) | 0 (0.0%) |
| Coal or Coke | 0 (0.0%) | 0 (0.0%) |
| All other Fuels | 18 (0.8%) | 0 (0.0%) |
| No Fuel Used | 0 (0.0%) | 0 (0.0%) |
| Total | 2,269 (100.0%) | 298 (100.0%) |
Household Vehicle Usage in Green Hill
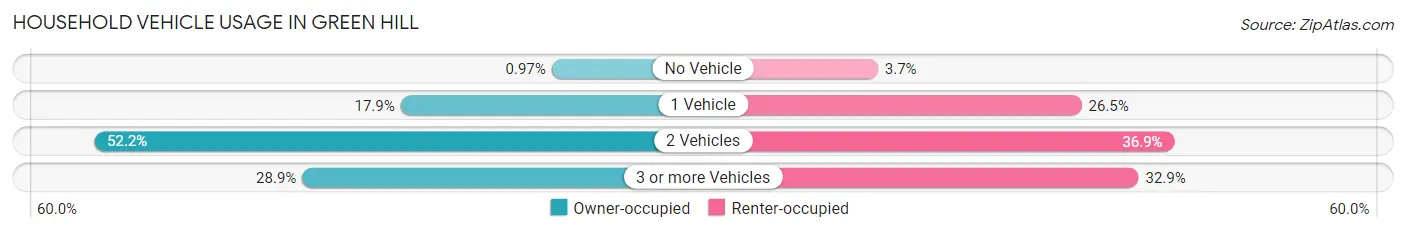
| Vehicles per Household | Owner-occupied | Renter-occupied |
| No Vehicle | 22 (1.0%) | 11 (3.7%) |
| 1 Vehicle | 406 (17.9%) | 79 (26.5%) |
| 2 Vehicles | 1,185 (52.2%) | 110 (36.9%) |
| 3 or more Vehicles | 656 (28.9%) | 98 (32.9%) |
| Total | 2,269 (100.0%) | 298 (100.0%) |
Real Estate & Mortgages in Green Hill
Real Estate and Mortgage Overview in Green Hill
| Characteristic | Without Mortgage | With Mortgage |
| Housing Units | 663 | 1,606 |
| Median Property Value | $333,400 | $330,600 |
| Median Household Income | $90,655 | $318 |
| Monthly Housing Costs | $471 | $101 |
| Real Estate Taxes | $1,470 | $30 |
Property Value by Mortgage Status in Green Hill
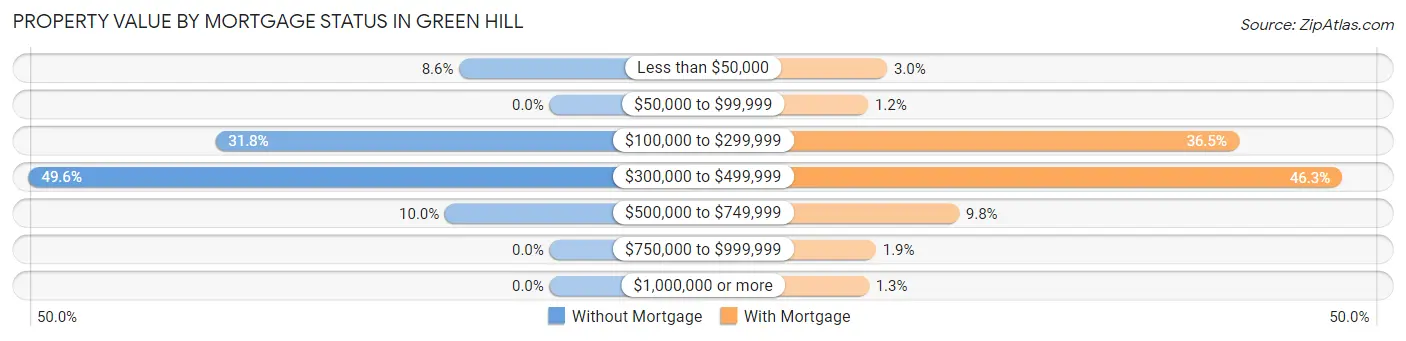
| Property Value | Without Mortgage | With Mortgage |
| Less than $50,000 | 57 (8.6%) | 48 (3.0%) |
| $50,000 to $99,999 | 0 (0.0%) | 19 (1.2%) |
| $100,000 to $299,999 | 211 (31.8%) | 586 (36.5%) |
| $300,000 to $499,999 | 329 (49.6%) | 744 (46.3%) |
| $500,000 to $749,999 | 66 (10.0%) | 158 (9.8%) |
| $750,000 to $999,999 | 0 (0.0%) | 31 (1.9%) |
| $1,000,000 or more | 0 (0.0%) | 20 (1.3%) |
| Total | 663 (100.0%) | 1,606 (100.0%) |
Household Income by Mortgage Status in Green Hill
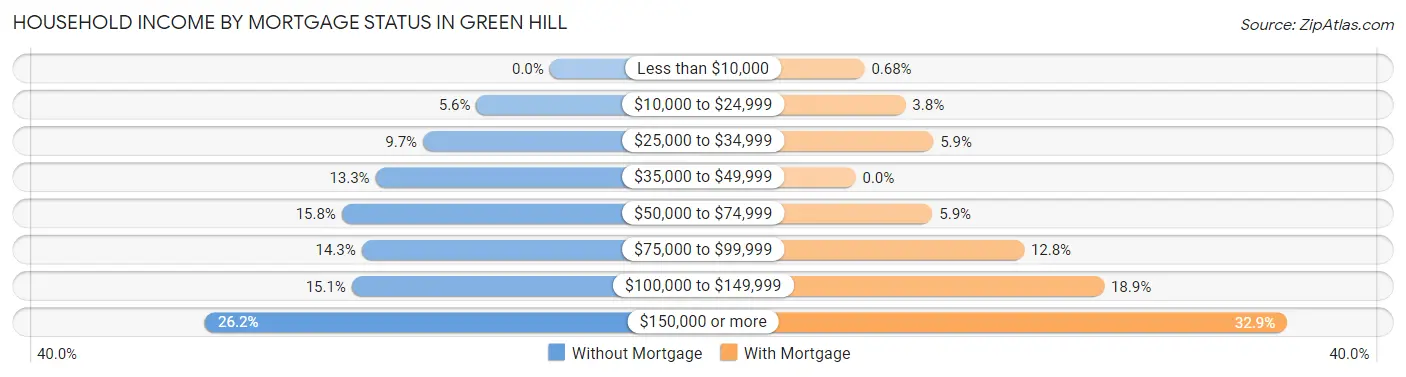
| Household Income | Without Mortgage | With Mortgage |
| Less than $10,000 | 0 (0.0%) | 11 (0.7%) |
| $10,000 to $24,999 | 37 (5.6%) | 61 (3.8%) |
| $25,000 to $34,999 | 64 (9.7%) | 95 (5.9%) |
| $35,000 to $49,999 | 88 (13.3%) | 0 (0.0%) |
| $50,000 to $74,999 | 105 (15.8%) | 94 (5.9%) |
| $75,000 to $99,999 | 95 (14.3%) | 206 (12.8%) |
| $100,000 to $149,999 | 100 (15.1%) | 304 (18.9%) |
| $150,000 or more | 174 (26.2%) | 528 (32.9%) |
| Total | 663 (100.0%) | 1,606 (100.0%) |
Property Value to Household Income Ratio in Green Hill
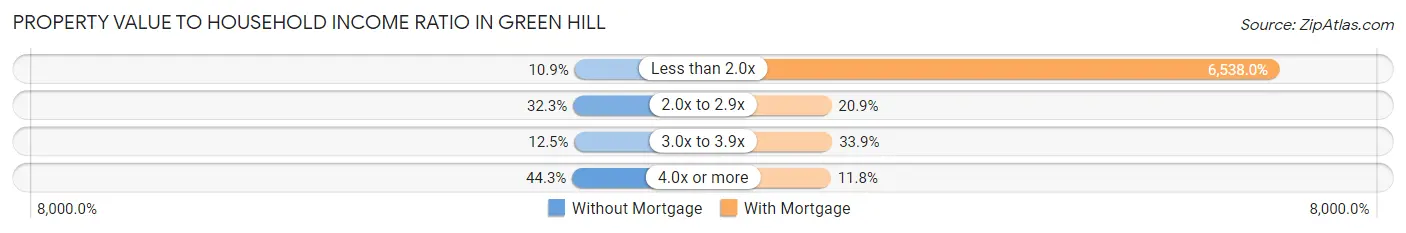
| Value-to-Income Ratio | Without Mortgage | With Mortgage |
| Less than 2.0x | 72 (10.9%) | 105,000 (6,538.0%) |
| 2.0x to 2.9x | 214 (32.3%) | 335 (20.9%) |
| 3.0x to 3.9x | 83 (12.5%) | 544 (33.9%) |
| 4.0x or more | 294 (44.3%) | 190 (11.8%) |
| Total | 663 (100.0%) | 1,606 (100.0%) |
Real Estate Taxes by Mortgage Status in Green Hill
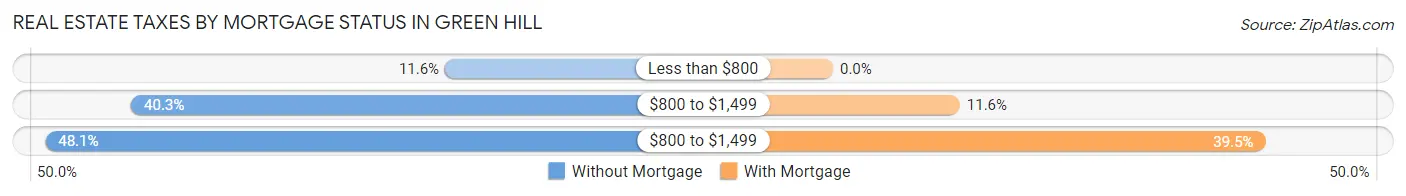
| Property Taxes | Without Mortgage | With Mortgage |
| Less than $800 | 77 (11.6%) | 0 (0.0%) |
| $800 to $1,499 | 267 (40.3%) | 186 (11.6%) |
| $800 to $1,499 | 319 (48.1%) | 634 (39.5%) |
| Total | 663 (100.0%) | 1,606 (100.0%) |
Health & Disability in Green Hill
Health Insurance Coverage by Age in Green Hill
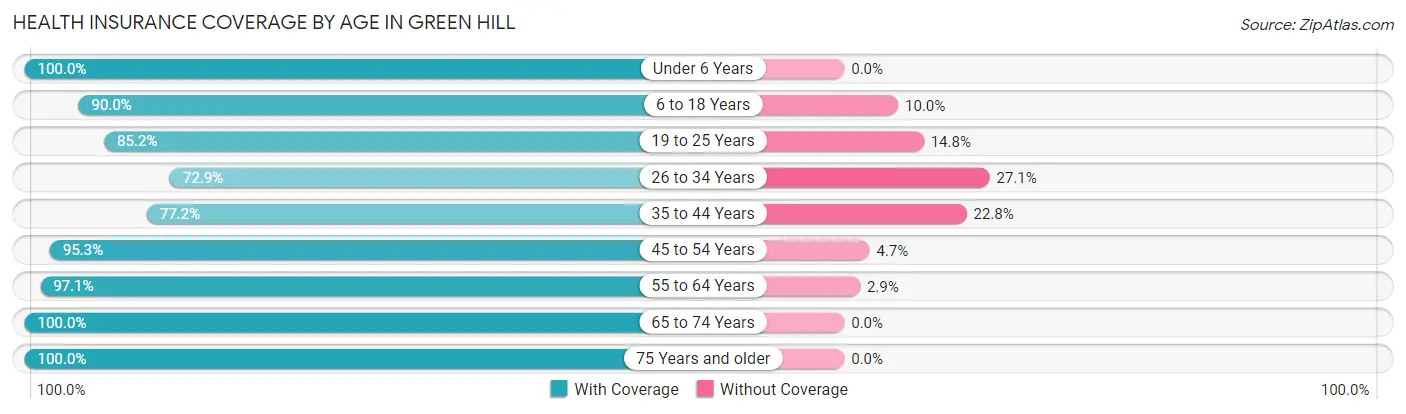
| Age Bracket | With Coverage | Without Coverage |
| Under 6 Years | 264 (100.0%) | 0 (0.0%) |
| 6 to 18 Years | 1,236 (90.0%) | 138 (10.0%) |
| 19 to 25 Years | 184 (85.2%) | 32 (14.8%) |
| 26 to 34 Years | 226 (72.9%) | 84 (27.1%) |
| 35 to 44 Years | 596 (77.2%) | 176 (22.8%) |
| 45 to 54 Years | 1,255 (95.3%) | 62 (4.7%) |
| 55 to 64 Years | 1,096 (97.1%) | 33 (2.9%) |
| 65 to 74 Years | 940 (100.0%) | 0 (0.0%) |
| 75 Years and older | 451 (100.0%) | 0 (0.0%) |
| Total | 6,248 (92.2%) | 525 (7.7%) |
Health Insurance Coverage by Citizenship Status in Green Hill
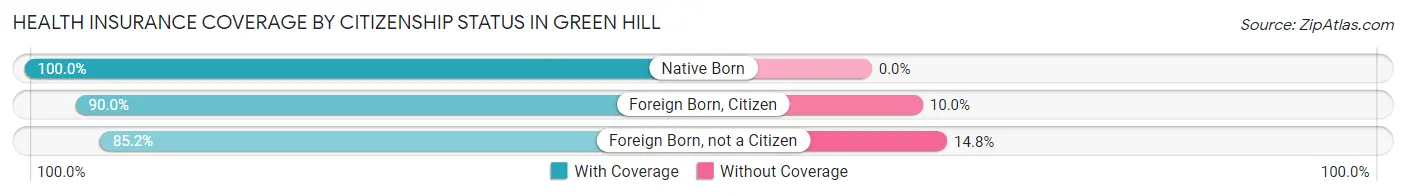
| Citizenship Status | With Coverage | Without Coverage |
| Native Born | 264 (100.0%) | 0 (0.0%) |
| Foreign Born, Citizen | 1,236 (90.0%) | 138 (10.0%) |
| Foreign Born, not a Citizen | 184 (85.2%) | 32 (14.8%) |
Health Insurance Coverage by Household Income in Green Hill
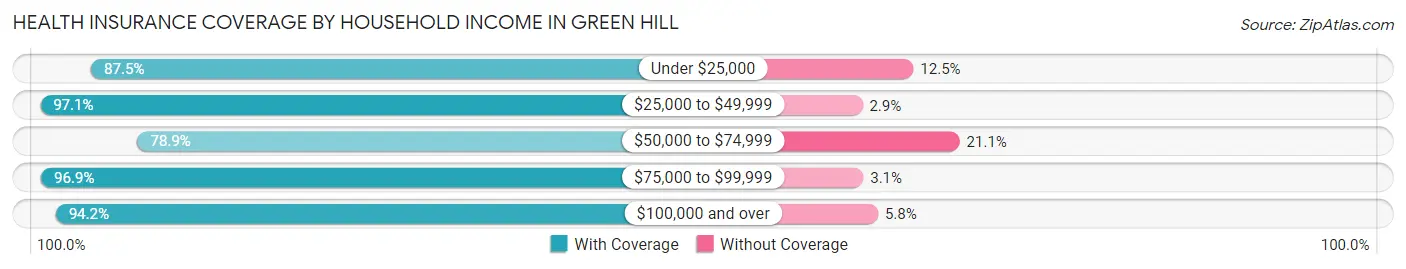
| Household Income | With Coverage | Without Coverage |
| Under $25,000 | 484 (87.5%) | 69 (12.5%) |
| $25,000 to $49,999 | 398 (97.1%) | 12 (2.9%) |
| $50,000 to $74,999 | 705 (78.9%) | 189 (21.1%) |
| $75,000 to $99,999 | 1,129 (96.9%) | 36 (3.1%) |
| $100,000 and over | 3,532 (94.2%) | 219 (5.8%) |
Public vs Private Health Insurance Coverage by Age in Green Hill
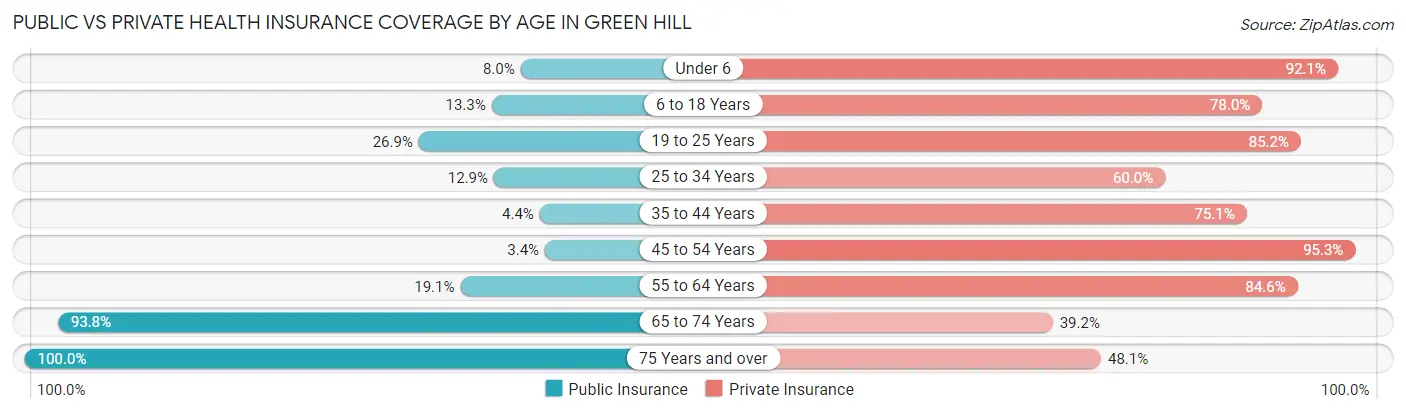
| Age Bracket | Public Insurance | Private Insurance |
| Under 6 | 21 (8.0%) | 243 (92.0%) |
| 6 to 18 Years | 183 (13.3%) | 1,072 (78.0%) |
| 19 to 25 Years | 58 (26.9%) | 184 (85.2%) |
| 25 to 34 Years | 40 (12.9%) | 186 (60.0%) |
| 35 to 44 Years | 34 (4.4%) | 580 (75.1%) |
| 45 to 54 Years | 45 (3.4%) | 1,255 (95.3%) |
| 55 to 64 Years | 216 (19.1%) | 955 (84.6%) |
| 65 to 74 Years | 882 (93.8%) | 368 (39.2%) |
| 75 Years and over | 451 (100.0%) | 217 (48.1%) |
| Total | 1,930 (28.5%) | 5,060 (74.7%) |
Disability Status by Sex by Age in Green Hill
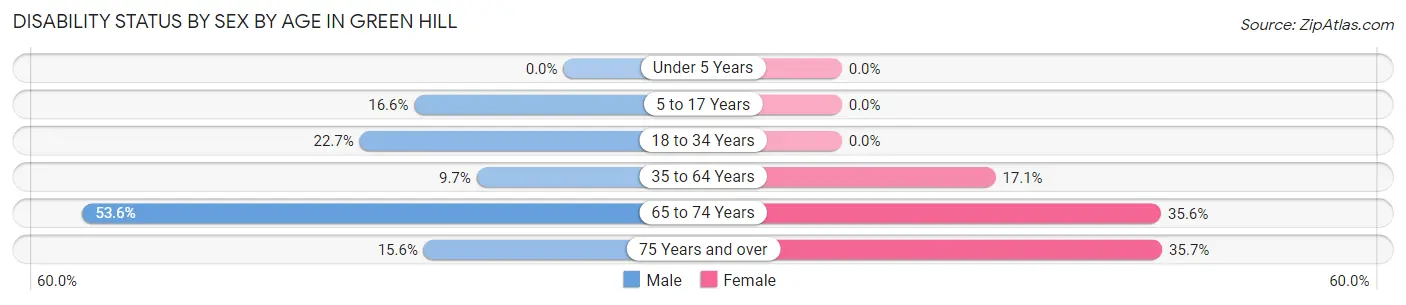
| Age Bracket | Male | Female |
| Under 5 Years | 0 (0.0%) | 0 (0.0%) |
| 5 to 17 Years | 83 (16.6%) | 0 (0.0%) |
| 18 to 34 Years | 79 (22.7%) | 0 (0.0%) |
| 35 to 64 Years | 164 (9.7%) | 260 (17.1%) |
| 65 to 74 Years | 255 (53.6%) | 165 (35.6%) |
| 75 Years and over | 37 (15.5%) | 76 (35.7%) |
Disability Class by Sex by Age in Green Hill
Disability Class: Hearing Difficulty
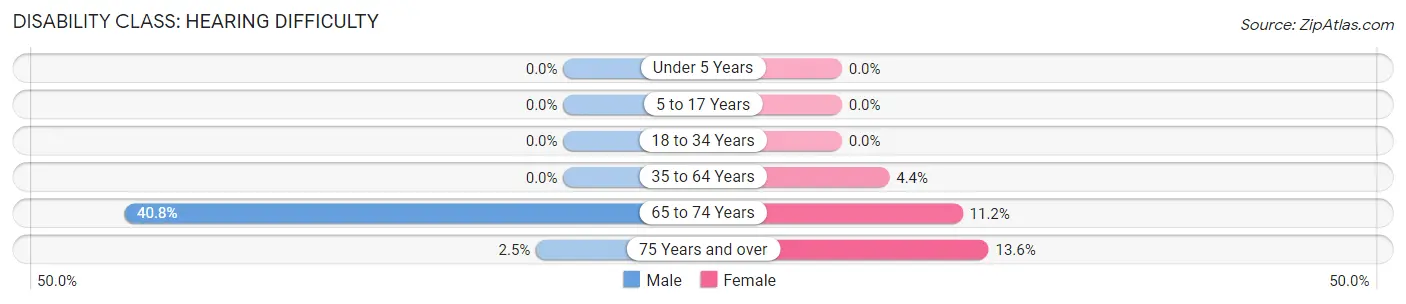
| Age Bracket | Male | Female |
| Under 5 Years | 0 (0.0%) | 0 (0.0%) |
| 5 to 17 Years | 0 (0.0%) | 0 (0.0%) |
| 18 to 34 Years | 0 (0.0%) | 0 (0.0%) |
| 35 to 64 Years | 0 (0.0%) | 67 (4.4%) |
| 65 to 74 Years | 194 (40.8%) | 52 (11.2%) |
| 75 Years and over | 6 (2.5%) | 29 (13.6%) |
Disability Class: Vision Difficulty
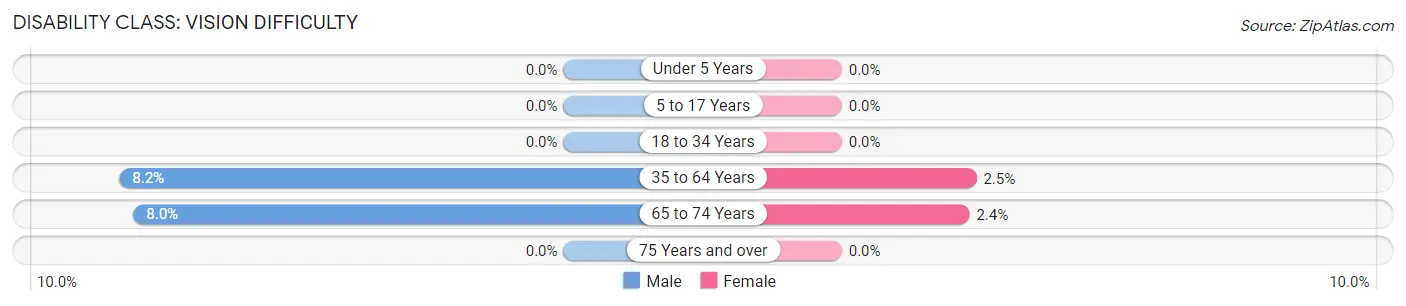
| Age Bracket | Male | Female |
| Under 5 Years | 0 (0.0%) | 0 (0.0%) |
| 5 to 17 Years | 0 (0.0%) | 0 (0.0%) |
| 18 to 34 Years | 0 (0.0%) | 0 (0.0%) |
| 35 to 64 Years | 140 (8.2%) | 38 (2.5%) |
| 65 to 74 Years | 38 (8.0%) | 11 (2.4%) |
| 75 Years and over | 0 (0.0%) | 0 (0.0%) |
Disability Class: Cognitive Difficulty
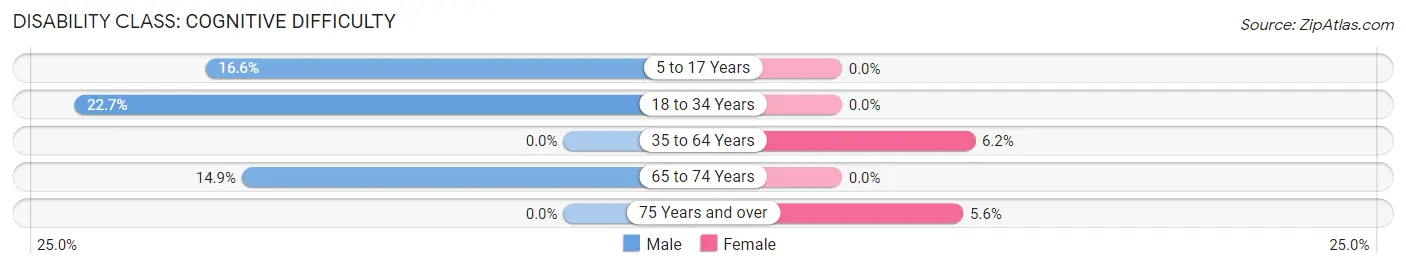
| Age Bracket | Male | Female |
| 5 to 17 Years | 83 (16.6%) | 0 (0.0%) |
| 18 to 34 Years | 79 (22.7%) | 0 (0.0%) |
| 35 to 64 Years | 0 (0.0%) | 94 (6.2%) |
| 65 to 74 Years | 71 (14.9%) | 0 (0.0%) |
| 75 Years and over | 0 (0.0%) | 12 (5.6%) |
Disability Class: Ambulatory Difficulty
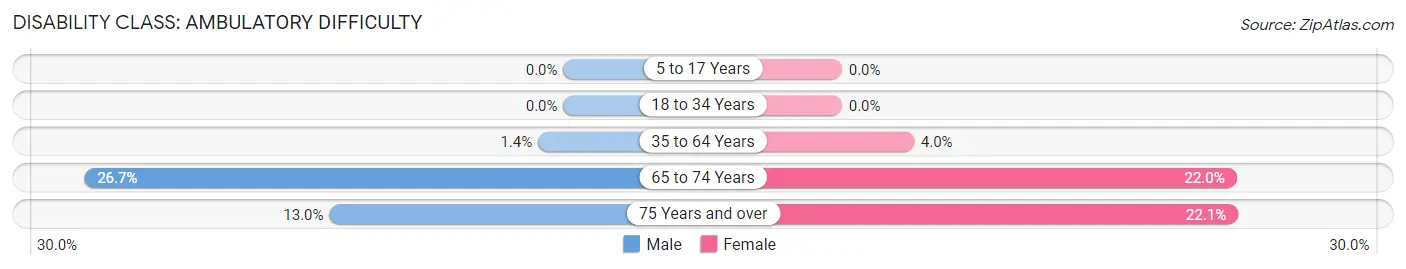
| Age Bracket | Male | Female |
| 5 to 17 Years | 0 (0.0%) | 0 (0.0%) |
| 18 to 34 Years | 0 (0.0%) | 0 (0.0%) |
| 35 to 64 Years | 24 (1.4%) | 61 (4.0%) |
| 65 to 74 Years | 127 (26.7%) | 102 (22.0%) |
| 75 Years and over | 31 (13.0%) | 47 (22.1%) |
Disability Class: Self-Care Difficulty
| Age Bracket | Male | Female |
| 5 to 17 Years | 0 (0.0%) | 0 (0.0%) |
| 18 to 34 Years | 21 (6.0%) | 0 (0.0%) |
| 35 to 64 Years | 0 (0.0%) | 0 (0.0%) |
| 65 to 74 Years | 57 (12.0%) | 21 (4.5%) |
| 75 Years and over | 0 (0.0%) | 12 (5.6%) |
Technology Access in Green Hill
Computing Device Access in Green Hill
| Device Type | # Households | % Households |
| Desktop or Laptop | 2,391 | 93.1% |
| Smartphone | 2,377 | 92.6% |
| Tablet | 1,929 | 75.1% |
| No Computing Device | 66 | 2.6% |
| Total | 2,567 | 100.0% |
Internet Access in Green Hill
| Internet Type | # Households | % Households |
| Dial-Up Internet | 18 | 0.7% |
| Broadband Home | 2,194 | 85.5% |
| Cellular Data Only | 139 | 5.4% |
| Satellite Internet | 118 | 4.6% |
| No Internet | 185 | 7.2% |
| Total | 2,567 | 100.0% |
Green Hill Summary
Hill, Tennessee is a small town located in the foothills of the Appalachian Mountains in the eastern part of the state. It is situated in Greene County, and is part of the Greeneville-Greene County Metropolitan Statistical Area. The town has a population of approximately 1,500 people, and is known for its rural charm and friendly atmosphere.
History
Green Hill was first settled in the late 1700s by a group of settlers from North Carolina. The town was originally known as “Green Hill” due to its location on a hill overlooking the Nolichucky River. The town was officially incorporated in 1819, and was named after the nearby Greeneville.
In the early 1800s, Green Hill was a thriving agricultural community, with many of its residents growing tobacco, corn, and other crops. The town also had a number of mills, including a grist mill, a saw mill, and a cotton gin.
In the late 1800s, the town began to experience a decline in population due to the introduction of the railroad. The railroad bypassed Green Hill, and many of the town’s residents moved away in search of better economic opportunities.
In the early 1900s, Green Hill experienced a resurgence in population due to the introduction of the automobile. The town was now accessible to larger cities, and many people moved to Green Hill in search of a better life.
Geography
Green Hill is located in the foothills of the Appalachian Mountains in the eastern part of Tennessee. The town is situated in Greene County, and is part of the Greeneville-Greene County Metropolitan Statistical Area. The town is located at an elevation of 1,000 feet above sea level, and is surrounded by rolling hills and lush forests.
The town is located near the Nolichucky River, which is a popular destination for fishing and other outdoor activities. The town is also located near the Cherokee National Forest, which is a popular destination for camping, hiking, and other outdoor activities.
Economy
Green Hill’s economy is largely based on agriculture and tourism. The town is home to several farms, which produce a variety of crops, including corn, tobacco, and hay. The town is also home to several small businesses, including restaurants, shops, and other services.
The town is also a popular destination for tourists, who come to enjoy the town’s rural charm and friendly atmosphere. The town is home to several historic sites, including the Green Hill Historic District, which is listed on the National Register of Historic Places.
Demographics
As of the 2010 census, Green Hill had a population of 1,500 people. The town is predominantly white, with approximately 95% of the population identifying as white. The town also has a small African American population, with approximately 4% of the population identifying as African American.
The town has a median household income of $35,000, and a poverty rate of 17%. The town also has a high rate of educational attainment, with approximately 90% of the population having at least a high school diploma.
Conclusion
Green Hill, Tennessee is a small town located in the foothills of the Appalachian Mountains in the eastern part of the state. The town has a population of approximately 1,500 people, and is known for its rural charm and friendly atmosphere. The town’s economy is largely based on agriculture and tourism, and the town is home to several historic sites. The town is predominantly white, with a small African American population, and has a median household income of $35,000.
Common Questions
What is Per Capita Income in Green Hill?
Per Capita income in Green Hill is $42,235.
What is the Median Family Income in Green Hill?
Median Family Income in Green Hill is $107,639.
What is the Median Household income in Green Hill?
Median Household Income in Green Hill is $94,428.
What is Income or Wage Gap in Green Hill?
Income or Wage Gap in Green Hill is 13.4%.
Women in Green Hill earn 86.6 cents for every dollar earned by a man.
What is Inequality or Gini Index in Green Hill?
Inequality or Gini Index in Green Hill is 0.38.
What is the Total Population of Green Hill?
Total Population of Green Hill is 6,773.
What is the Total Male Population of Green Hill?
Total Male Population of Green Hill is 3,320.
What is the Total Female Population of Green Hill?
Total Female Population of Green Hill is 3,453.
What is the Ratio of Males per 100 Females in Green Hill?
There are 96.15 Males per 100 Females in Green Hill.
What is the Ratio of Females per 100 Males in Green Hill?
There are 104.01 Females per 100 Males in Green Hill.
What is the Median Population Age in Green Hill?
Median Population Age in Green Hill is 48.7 Years.
What is the Average Family Size in Green Hill
Average Family Size in Green Hill is 3.0 People.
What is the Average Household Size in Green Hill
Average Household Size in Green Hill is 2.6 People.
How Large is the Labor Force in Green Hill?
There are 3,401 People in the Labor Forcein in Green Hill.
What is the Percentage of People in the Labor Force in Green Hill?
62.1% of People are in the Labor Force in Green Hill.
What is the Unemployment Rate in Green Hill?
Unemployment Rate in Green Hill is 6.6%.