Zip Codes with the Highest Percentage of Population Employed in Security & Protection in Maryville, TN
RELATED REPORTS & OPTIONS
Security & Protection
Maryville
Compare Zip Codes
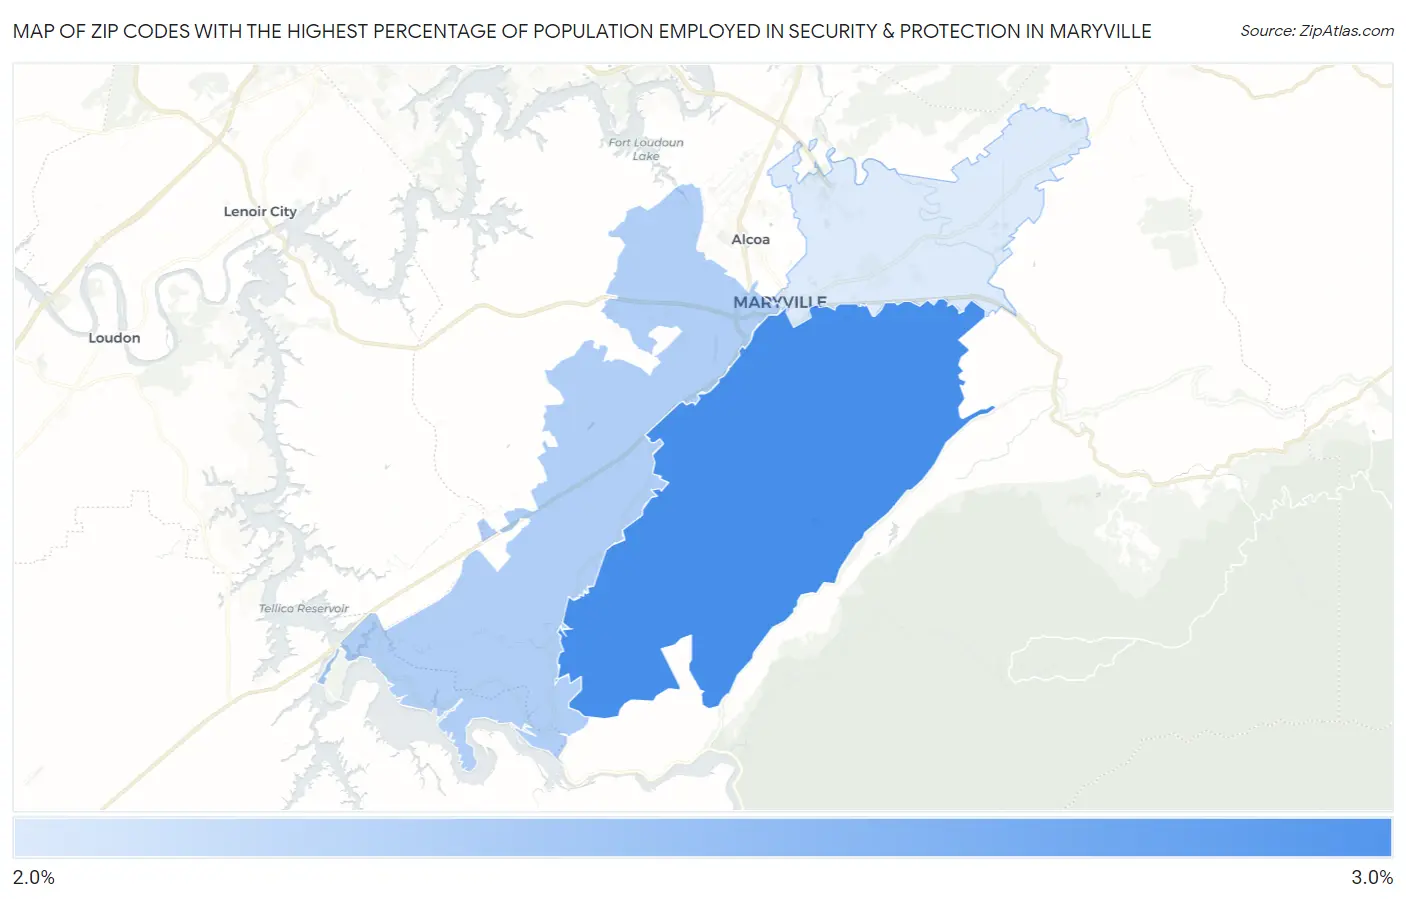
Map of Zip Codes with the Highest Percentage of Population Employed in Security & Protection in Maryville
2.4%
2.9%
Zip Codes with the Highest Percentage of Population Employed in Security & Protection in Maryville, TN
| Zip Code | % Employed | vs State | vs National | |
| 1. | 37803 | 2.9% | 2.1%(+0.780)#144 | 2.1%(+0.725)#7,766 |
| 2. | 37801 | 2.5% | 2.1%(+0.415)#191 | 2.1%(+0.361)#9,463 |
| 3. | 37804 | 2.4% | 2.1%(+0.261)#211 | 2.1%(+0.206)#10,302 |
1
Common Questions
What are the Top Zip Codes with the Highest Percentage of Population Employed in Security & Protection in Maryville, TN?
Top Zip Codes with the Highest Percentage of Population Employed in Security & Protection in Maryville, TN are:
What zip code has the Highest Percentage of Population Employed in Security & Protection in Maryville, TN?
37803 has the Highest Percentage of Population Employed in Security & Protection in Maryville, TN with 2.9%.
What is the Percentage of Population Employed in Security & Protection in Maryville, TN?
Percentage of Population Employed in Security & Protection in Maryville is 2.7%.
What is the Percentage of Population Employed in Security & Protection in Tennessee?
Percentage of Population Employed in Security & Protection in Tennessee is 2.1%.
What is the Percentage of Population Employed in Security & Protection in the United States?
Percentage of Population Employed in Security & Protection in the United States is 2.1%.