Pleasant Hill, TN Map & Demographics
Pleasant Hill Map
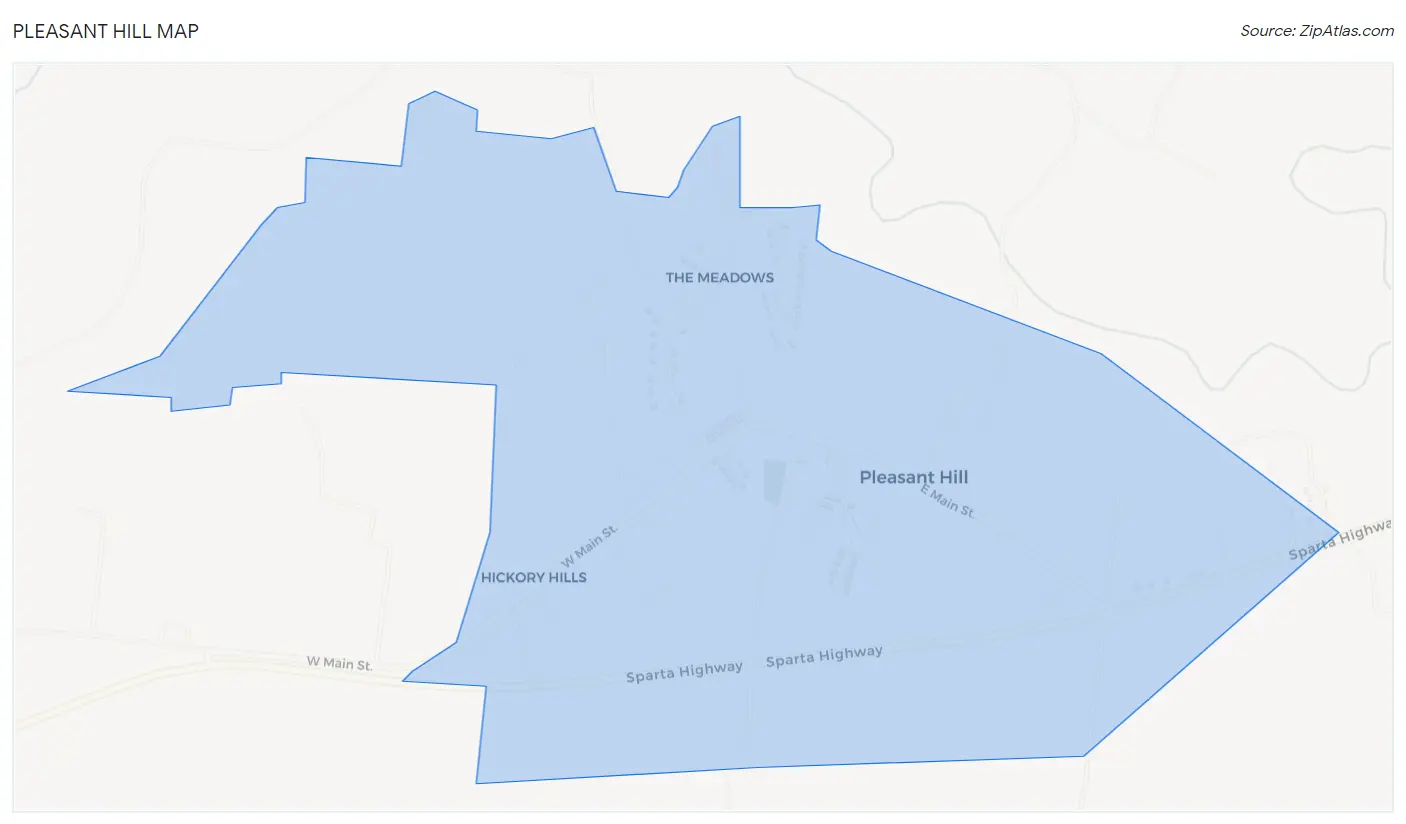
Pleasant Hill Overview
$24,894
PER CAPITA INCOME
$48,750
AVG FAMILY INCOME
$47,500
AVG HOUSEHOLD INCOME
0.41
INEQUALITY / GINI INDEX
589
TOTAL POPULATION
281
MALE POPULATION
308
FEMALE POPULATION
91.23
MALES / 100 FEMALES
109.61
FEMALES / 100 MALES
64.7
MEDIAN AGE
2.3
AVG FAMILY SIZE
2.0
AVG HOUSEHOLD SIZE
217
LABOR FORCE [ PEOPLE ]
38.3%
PERCENT IN LABOR FORCE
12.4%
UNEMPLOYMENT RATE
Pleasant Hill Zip Codes
Pleasant Hill Area Codes
Income in Pleasant Hill
Income Overview in Pleasant Hill
Per Capita Income in Pleasant Hill is $24,894, while median incomes of families and households are $48,750 and $47,500 respectively.
| Characteristic | Number | Measure |
| Per Capita Income | 589 | $24,894 |
| Median Family Income | 111 | $48,750 |
| Mean Family Income | 111 | $51,974 |
| Median Household Income | 258 | $47,500 |
| Mean Household Income | 258 | $52,584 |
| Income Deficit | 111 | $0 |
| Wage / Income Gap (%) | 589 | 0.00% |
| Wage / Income Gap ($) | 589 | 100.00¢ per $1 |
| Gini / Inequality Index | 589 | 0.41 |
Earnings by Sex in Pleasant Hill
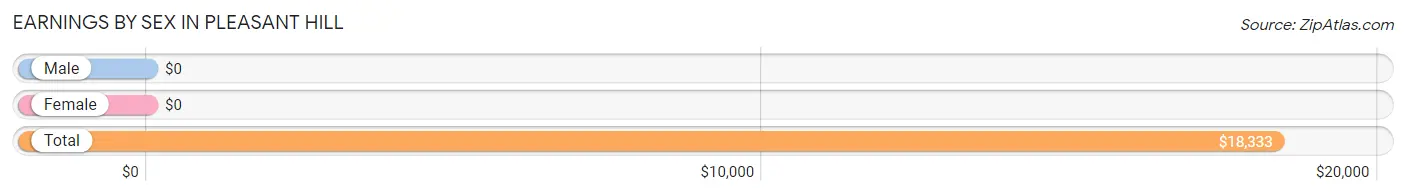
| Sex | Number | Average Earnings |
| Male | 153 (61.2%) | $0 |
| Female | 97 (38.8%) | $0 |
| Total | 250 (100.0%) | $18,333 |
Earnings by Sex by Income Bracket in Pleasant Hill
The most common earnings brackets in Pleasant Hill are $2,499 or less for men (49 | 32.0%) and $2,499 or less for women (22 | 22.7%).
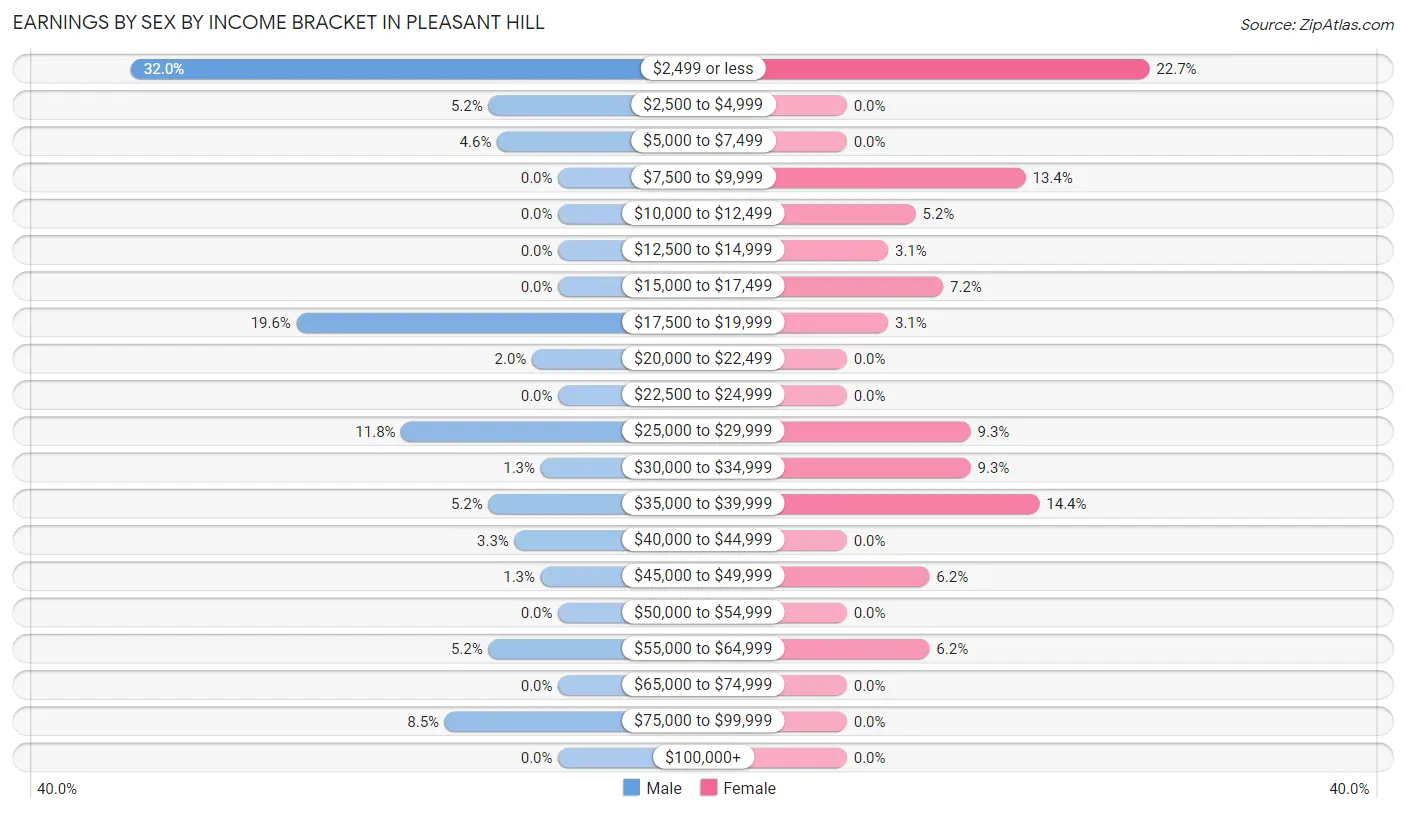
| Income | Male | Female |
| $2,499 or less | 49 (32.0%) | 22 (22.7%) |
| $2,500 to $4,999 | 8 (5.2%) | 0 (0.0%) |
| $5,000 to $7,499 | 7 (4.6%) | 0 (0.0%) |
| $7,500 to $9,999 | 0 (0.0%) | 13 (13.4%) |
| $10,000 to $12,499 | 0 (0.0%) | 5 (5.1%) |
| $12,500 to $14,999 | 0 (0.0%) | 3 (3.1%) |
| $15,000 to $17,499 | 0 (0.0%) | 7 (7.2%) |
| $17,500 to $19,999 | 30 (19.6%) | 3 (3.1%) |
| $20,000 to $22,499 | 3 (2.0%) | 0 (0.0%) |
| $22,500 to $24,999 | 0 (0.0%) | 0 (0.0%) |
| $25,000 to $29,999 | 18 (11.8%) | 9 (9.3%) |
| $30,000 to $34,999 | 2 (1.3%) | 9 (9.3%) |
| $35,000 to $39,999 | 8 (5.2%) | 14 (14.4%) |
| $40,000 to $44,999 | 5 (3.3%) | 0 (0.0%) |
| $45,000 to $49,999 | 2 (1.3%) | 6 (6.2%) |
| $50,000 to $54,999 | 0 (0.0%) | 0 (0.0%) |
| $55,000 to $64,999 | 8 (5.2%) | 6 (6.2%) |
| $65,000 to $74,999 | 0 (0.0%) | 0 (0.0%) |
| $75,000 to $99,999 | 13 (8.5%) | 0 (0.0%) |
| $100,000+ | 0 (0.0%) | 0 (0.0%) |
| Total | 153 (100.0%) | 97 (100.0%) |
Earnings by Sex by Educational Attainment in Pleasant Hill
Average earnings in Pleasant Hill are $19,708 for men and $27,500 for women, a difference of 28.3%. Men with an educational attainment of high school diploma enjoy the highest average annual earnings of $28,194, while those with college or associate's degree education earn the least with $20,417. Women with an educational attainment of high school diploma earn the most with the average annual earnings of $35,568, while those with graduate degree education have the smallest earnings of $2,499.
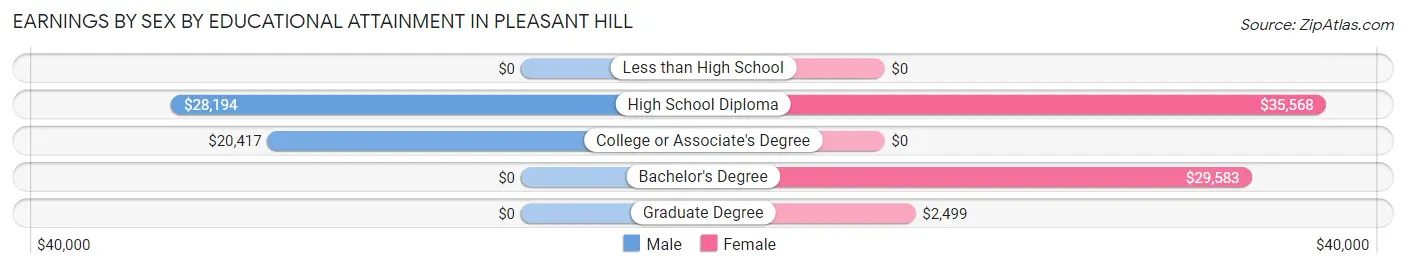
| Educational Attainment | Male Income | Female Income |
| Less than High School | - | - |
| High School Diploma | $28,194 | $35,568 |
| College or Associate's Degree | $20,417 | $0 |
| Bachelor's Degree | - | - |
| Graduate Degree | - | - |
| Total | $19,708 | $27,500 |
Family Income in Pleasant Hill
Family Income Brackets in Pleasant Hill
According to the Pleasant Hill family income data, there are 37 families falling into the $50,000 to $74,999 income range, which is the most common income bracket and makes up 33.3% of all families.
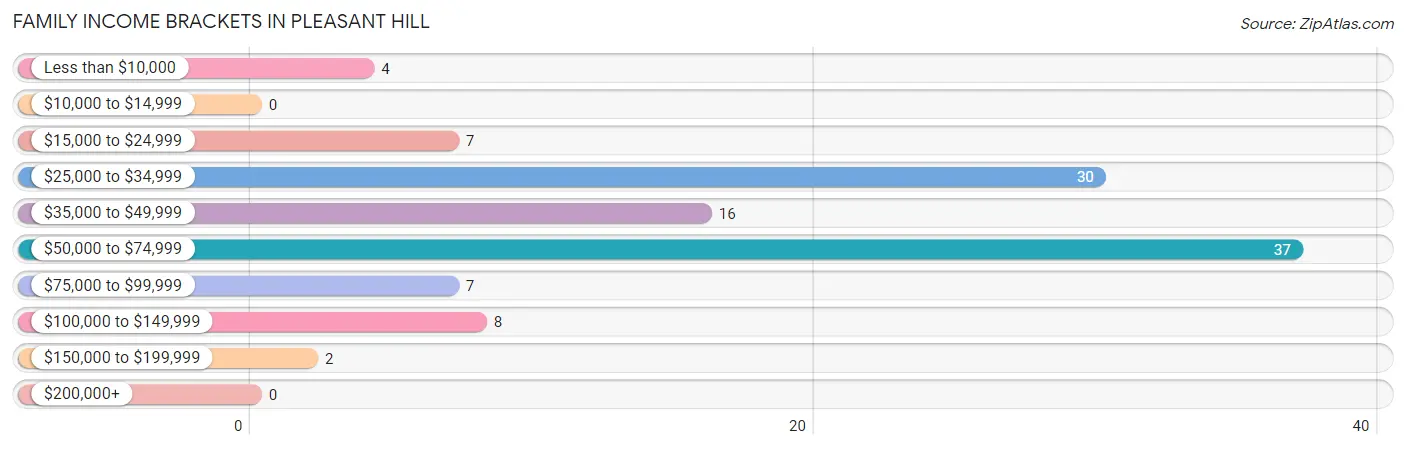
| Income Bracket | # Families | % Families |
| Less than $10,000 | 4 | 3.6% |
| $10,000 to $14,999 | 0 | 0.0% |
| $15,000 to $24,999 | 7 | 6.3% |
| $25,000 to $34,999 | 30 | 27.0% |
| $35,000 to $49,999 | 16 | 14.4% |
| $50,000 to $74,999 | 37 | 33.3% |
| $75,000 to $99,999 | 7 | 6.3% |
| $100,000 to $149,999 | 8 | 7.2% |
| $150,000 to $199,999 | 2 | 1.8% |
| $200,000+ | 0 | 0.0% |
Family Income by Famaliy Size in Pleasant Hill
2-person families (89 | 80.2%) account for the highest median family income in Pleasant Hill with $55,104 per family, while 2-person families (89 | 80.2%) have the highest median income of $27,552 per family member.
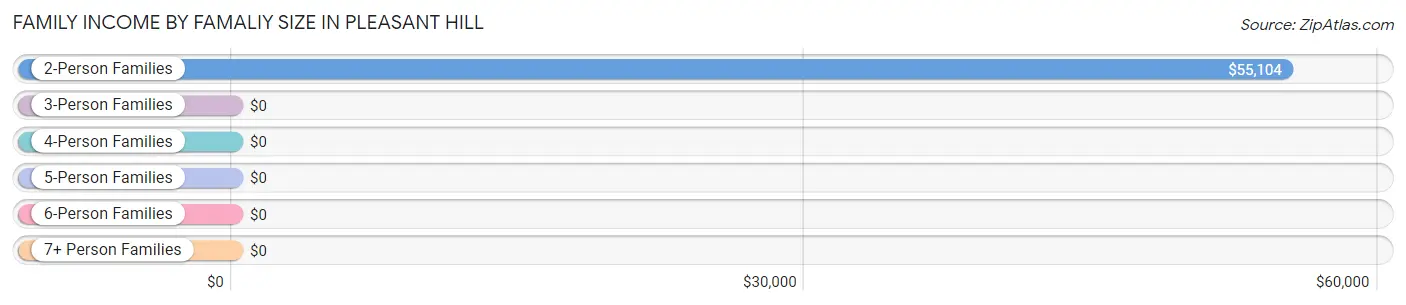
| Income Bracket | # Families | Median Income |
| 2-Person Families | 89 (80.2%) | $55,104 |
| 3-Person Families | 9 (8.1%) | $0 |
| 4-Person Families | 10 (9.0%) | $0 |
| 5-Person Families | 3 (2.7%) | $0 |
| 6-Person Families | 0 (0.0%) | $0 |
| 7+ Person Families | 0 (0.0%) | $0 |
| Total | 111 (100.0%) | $48,750 |
Family Income by Number of Earners in Pleasant Hill
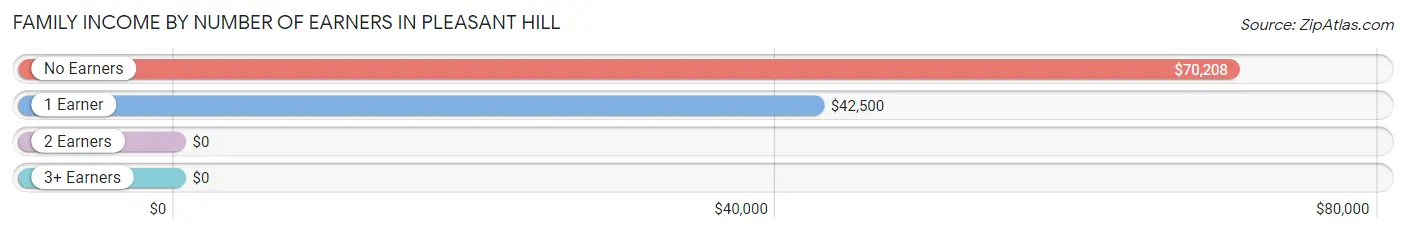
| Number of Earners | # Families | Median Income |
| No Earners | 41 (36.9%) | $70,208 |
| 1 Earner | 20 (18.0%) | $42,500 |
| 2 Earners | 47 (42.3%) | $0 |
| 3+ Earners | 3 (2.7%) | $0 |
| Total | 111 (100.0%) | $48,750 |
Household Income in Pleasant Hill
Household Income Brackets in Pleasant Hill
With 48 households falling in the category, the $75,000 to $99,999 income range is the most frequent in Pleasant Hill, accounting for 18.6% of all households. In contrast, only 2 households (0.8%) fall into the $150,000 to $199,999 income bracket, making it the least populous group.
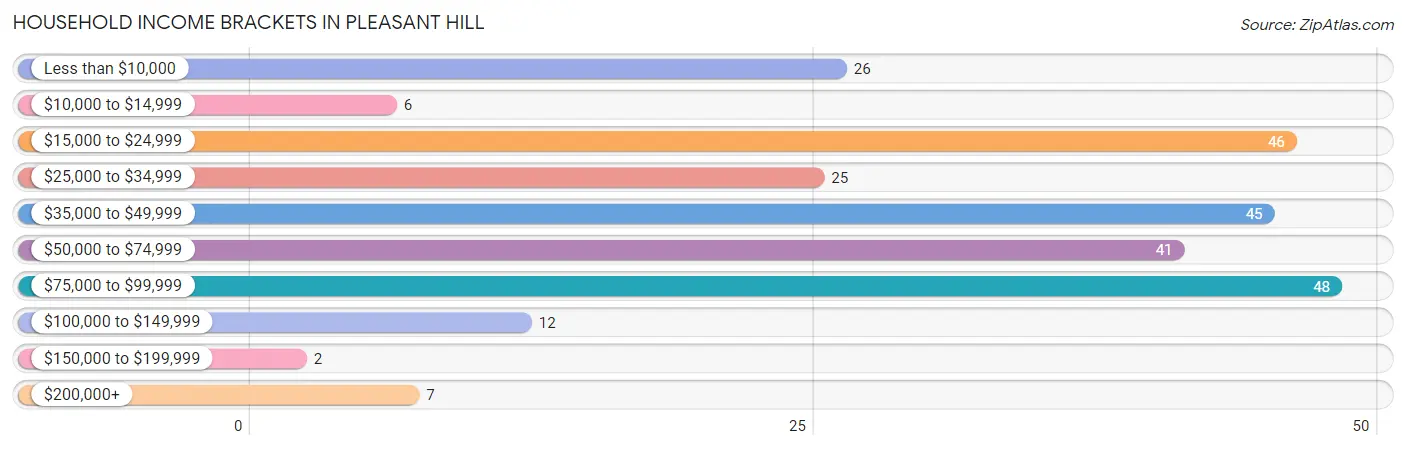
| Income Bracket | # Households | % Households |
| Less than $10,000 | 26 | 10.1% |
| $10,000 to $14,999 | 6 | 2.3% |
| $15,000 to $24,999 | 46 | 17.8% |
| $25,000 to $34,999 | 25 | 9.7% |
| $35,000 to $49,999 | 45 | 17.4% |
| $50,000 to $74,999 | 41 | 15.9% |
| $75,000 to $99,999 | 48 | 18.6% |
| $100,000 to $149,999 | 12 | 4.7% |
| $150,000 to $199,999 | 2 | 0.8% |
| $200,000+ | 7 | 2.7% |
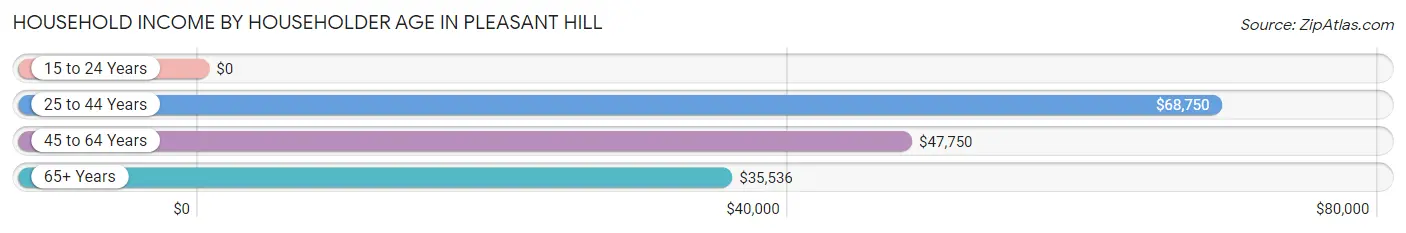
Household Income by Householder Age in Pleasant Hill
The median household income in Pleasant Hill is $47,500, with the highest median household income of $68,750 found in the 25 to 44 years age bracket for the primary householder. A total of 29 households (11.2%) fall into this category.
| Income Bracket | # Households | Median Income |
| 15 to 24 Years | 0 (0.0%) | $0 |
| 25 to 44 Years | 29 (11.2%) | $68,750 |
| 45 to 64 Years | 54 (20.9%) | $47,750 |
| 65+ Years | 175 (67.8%) | $35,536 |
| Total | 258 (100.0%) | $47,500 |
Poverty in Pleasant Hill
Income Below Poverty by Sex and Age in Pleasant Hill
With 21.7% poverty level for males and 10.9% for females among the residents of Pleasant Hill, 18 to 24 year old males and 12 to 14 year old females are the most vulnerable to poverty, with 32 males (86.5%) and 5 females (100.0%) in their respective age groups living below the poverty level.
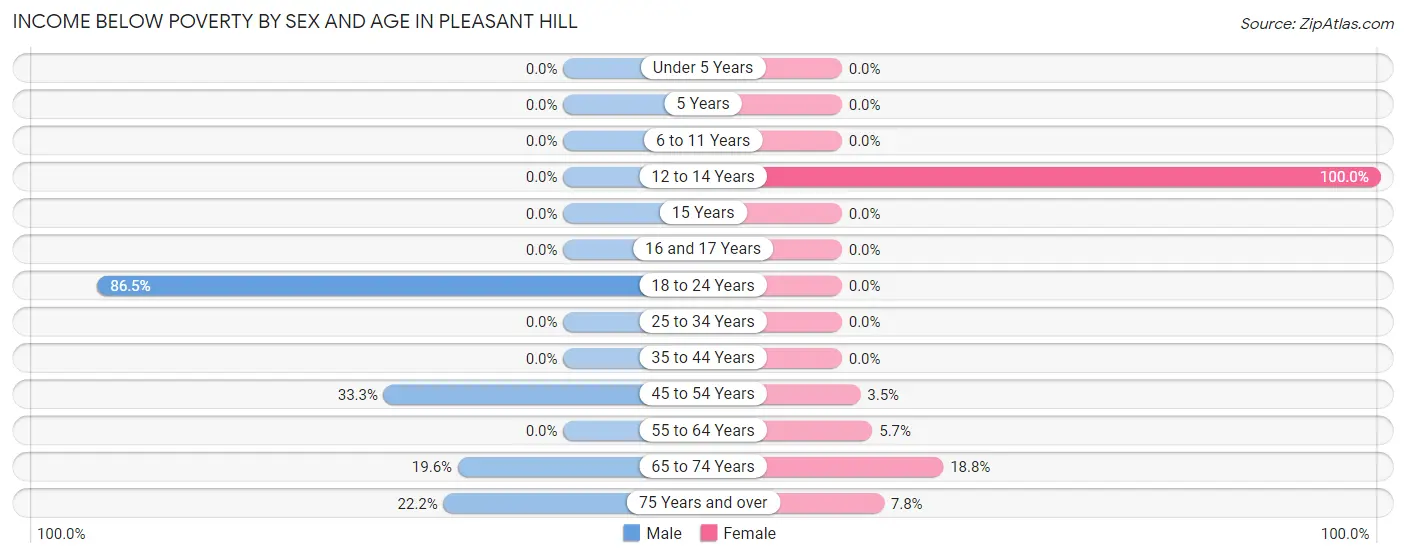
| Age Bracket | Male | Female |
| Under 5 Years | 0 (0.0%) | 0 (0.0%) |
| 5 Years | 0 (0.0%) | 0 (0.0%) |
| 6 to 11 Years | 0 (0.0%) | 0 (0.0%) |
| 12 to 14 Years | 0 (0.0%) | 5 (100.0%) |
| 15 Years | 0 (0.0%) | 0 (0.0%) |
| 16 and 17 Years | 0 (0.0%) | 0 (0.0%) |
| 18 to 24 Years | 32 (86.5%) | 0 (0.0%) |
| 25 to 34 Years | 0 (0.0%) | 0 (0.0%) |
| 35 to 44 Years | 0 (0.0%) | 0 (0.0%) |
| 45 to 54 Years | 4 (33.3%) | 1 (3.5%) |
| 55 to 64 Years | 0 (0.0%) | 3 (5.7%) |
| 65 to 74 Years | 9 (19.6%) | 16 (18.8%) |
| 75 Years and over | 10 (22.2%) | 5 (7.8%) |
| Total | 55 (21.7%) | 30 (10.9%) |
Income Above Poverty by Sex and Age in Pleasant Hill
According to the poverty statistics in Pleasant Hill, males aged under 5 years and females aged under 5 years are the age groups that are most secure financially, with 100.0% of males and 100.0% of females in these age groups living above the poverty line.
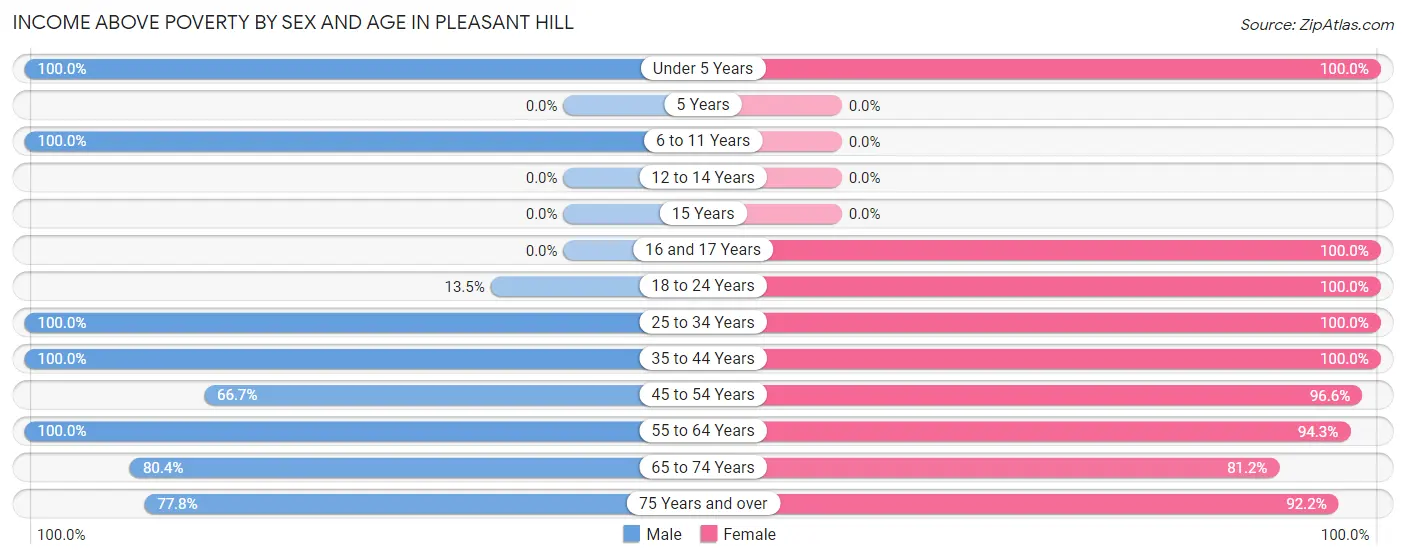
| Age Bracket | Male | Female |
| Under 5 Years | 5 (100.0%) | 6 (100.0%) |
| 5 Years | 0 (0.0%) | 0 (0.0%) |
| 6 to 11 Years | 6 (100.0%) | 0 (0.0%) |
| 12 to 14 Years | 0 (0.0%) | 0 (0.0%) |
| 15 Years | 0 (0.0%) | 0 (0.0%) |
| 16 and 17 Years | 0 (0.0%) | 3 (100.0%) |
| 18 to 24 Years | 5 (13.5%) | 13 (100.0%) |
| 25 to 34 Years | 37 (100.0%) | 9 (100.0%) |
| 35 to 44 Years | 5 (100.0%) | 8 (100.0%) |
| 45 to 54 Years | 8 (66.7%) | 28 (96.6%) |
| 55 to 64 Years | 60 (100.0%) | 50 (94.3%) |
| 65 to 74 Years | 37 (80.4%) | 69 (81.2%) |
| 75 Years and over | 35 (77.8%) | 59 (92.2%) |
| Total | 198 (78.3%) | 245 (89.1%) |
Income Below Poverty Among Married-Couple Families in Pleasant Hill
The poverty statistics for married-couple families in Pleasant Hill show that 7.2% or 7 of the total 97 families live below the poverty line. Families with no children have the highest poverty rate of 8.5%, comprising of 7 families. On the other hand, families with 1 or 2 children have the lowest poverty rate of 0.0%, which includes 0 families.
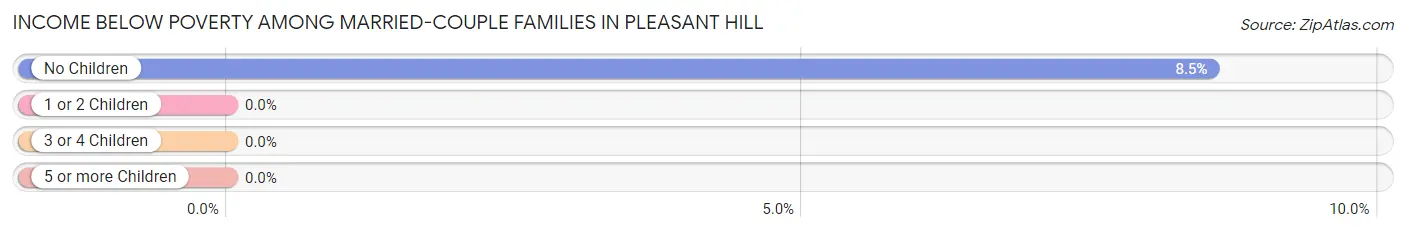
| Children | Above Poverty | Below Poverty |
| No Children | 75 (91.5%) | 7 (8.5%) |
| 1 or 2 Children | 15 (100.0%) | 0 (0.0%) |
| 3 or 4 Children | 0 (0.0%) | 0 (0.0%) |
| 5 or more Children | 0 (0.0%) | 0 (0.0%) |
| Total | 90 (92.8%) | 7 (7.2%) |
Income Below Poverty Among Single-Parent Households in Pleasant Hill
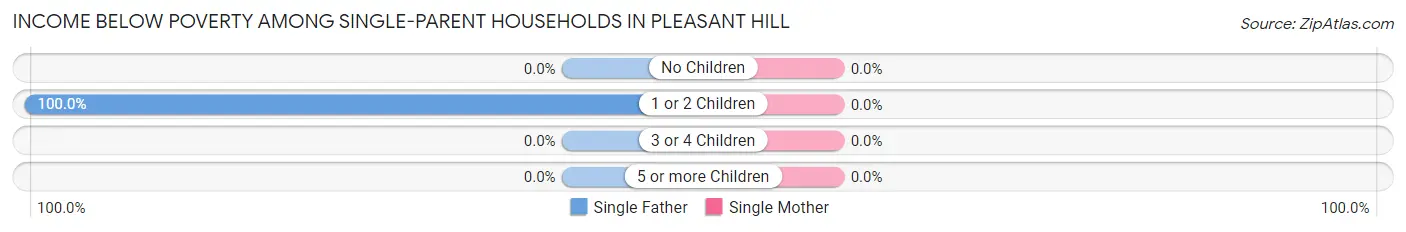
| Children | Single Father | Single Mother |
| No Children | 0 (0.0%) | 0 (0.0%) |
| 1 or 2 Children | 4 (100.0%) | 0 (0.0%) |
| 3 or 4 Children | 0 (0.0%) | 0 (0.0%) |
| 5 or more Children | 0 (0.0%) | 0 (0.0%) |
| Total | 4 (100.0%) | 0 (0.0%) |
Income Below Poverty Among Married-Couple vs Single-Parent Households in Pleasant Hill
The poverty data for Pleasant Hill shows that 7 of the married-couple family households (7.2%) and 4 of the single-parent households (28.6%) are living below the poverty level. Within the married-couple family households, those with no children have the highest poverty rate, with 7 households (8.5%) falling below the poverty line. Among the single-parent households, those with 1 or 2 children have the highest poverty rate, with 4 household (100.0%) living below poverty.
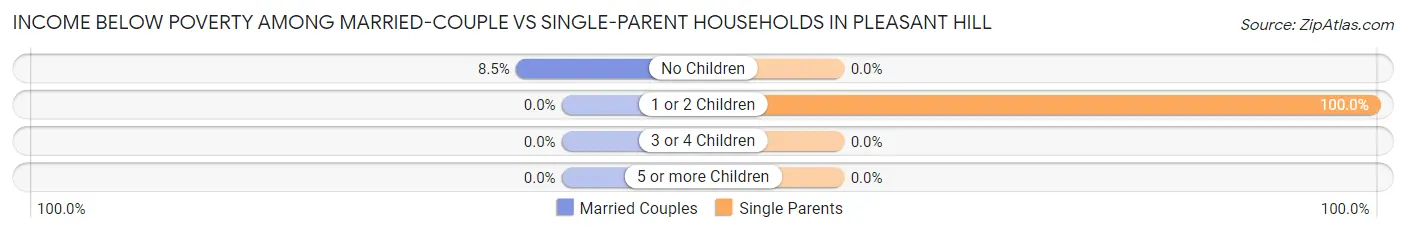
| Children | Married-Couple Families | Single-Parent Households |
| No Children | 7 (8.5%) | 0 (0.0%) |
| 1 or 2 Children | 0 (0.0%) | 4 (100.0%) |
| 3 or 4 Children | 0 (0.0%) | 0 (0.0%) |
| 5 or more Children | 0 (0.0%) | 0 (0.0%) |
| Total | 7 (7.2%) | 4 (28.6%) |
Race in Pleasant Hill
The most populous races in Pleasant Hill are White / Caucasian (504 | 85.6%), Two or more Races (75 | 12.7%), and Black / African American (10 | 1.7%).
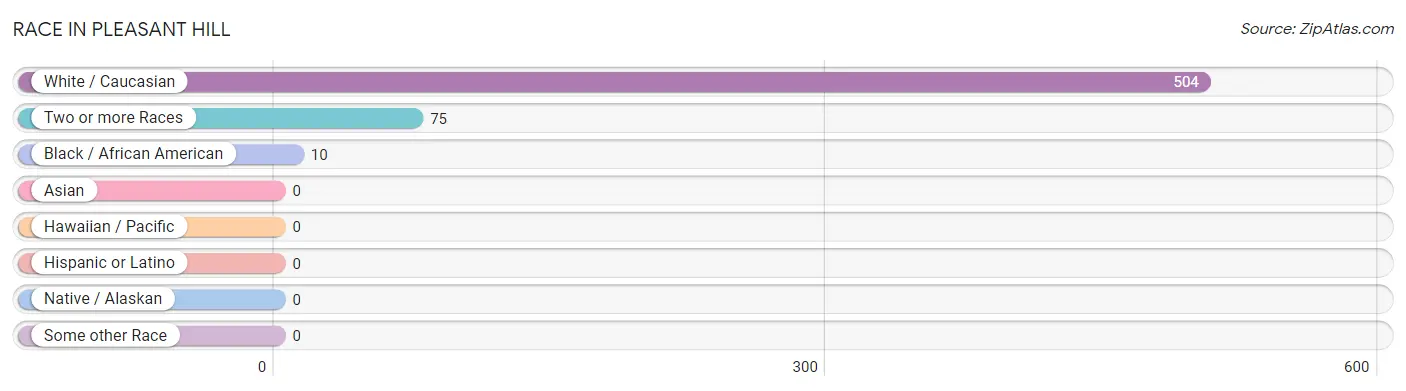
| Race | # Population | % Population |
| Asian | 0 | 0.0% |
| Black / African American | 10 | 1.7% |
| Hawaiian / Pacific | 0 | 0.0% |
| Hispanic or Latino | 0 | 0.0% |
| Native / Alaskan | 0 | 0.0% |
| White / Caucasian | 504 | 85.6% |
| Two or more Races | 75 | 12.7% |
| Some other Race | 0 | 0.0% |
| Total | 589 | 100.0% |
Ancestry in Pleasant Hill
The most populous ancestries reported in Pleasant Hill are English (155 | 26.3%), American (85 | 14.4%), French (70 | 11.9%), Irish (64 | 10.9%), and German (61 | 10.4%), together accounting for 73.9% of all Pleasant Hill residents.
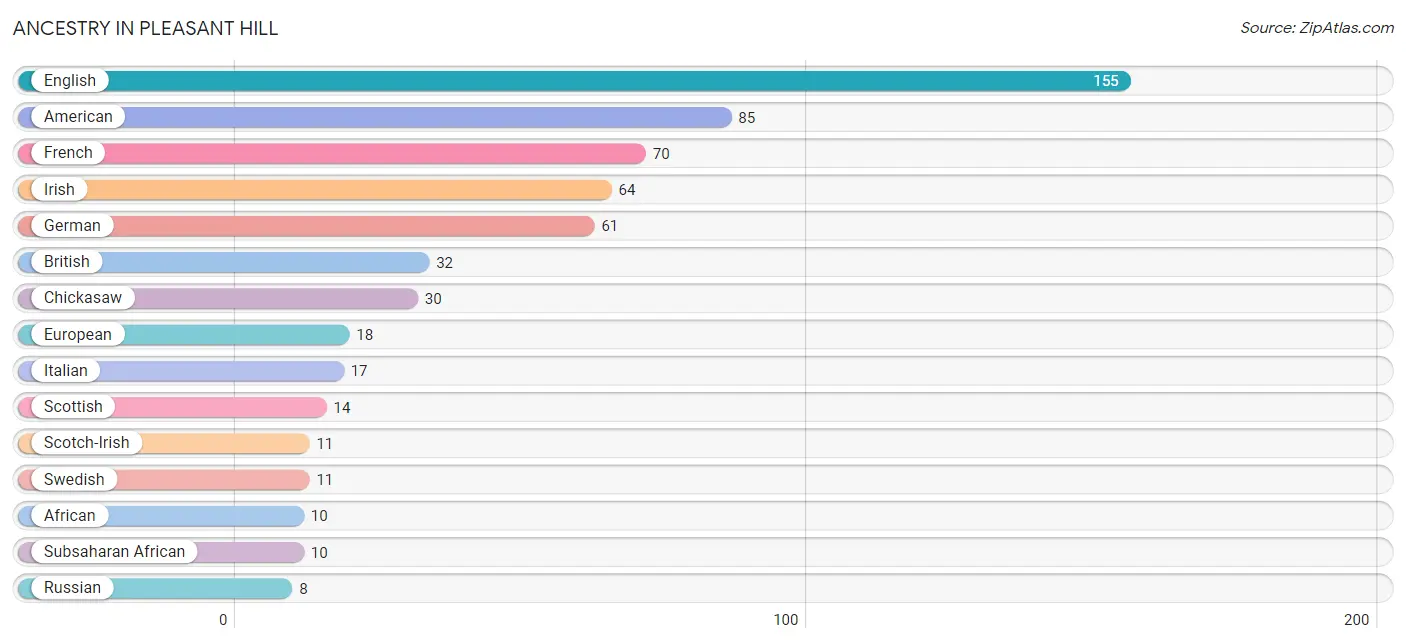
| Ancestry | # Population | % Population |
| African | 10 | 1.7% |
| American | 85 | 14.4% |
| British | 32 | 5.4% |
| Chickasaw | 30 | 5.1% |
| Dutch | 4 | 0.7% |
| English | 155 | 26.3% |
| European | 18 | 3.1% |
| French | 70 | 11.9% |
| German | 61 | 10.4% |
| Irish | 64 | 10.9% |
| Italian | 17 | 2.9% |
| Northern European | 2 | 0.3% |
| Pennsylvania German | 6 | 1.0% |
| Russian | 8 | 1.4% |
| Scotch-Irish | 11 | 1.9% |
| Scottish | 14 | 2.4% |
| Subsaharan African | 10 | 1.7% |
| Swedish | 11 | 1.9% |
| Swiss | 3 | 0.5% |
| Yugoslavian | 5 | 0.9% | View All 20 Rows |
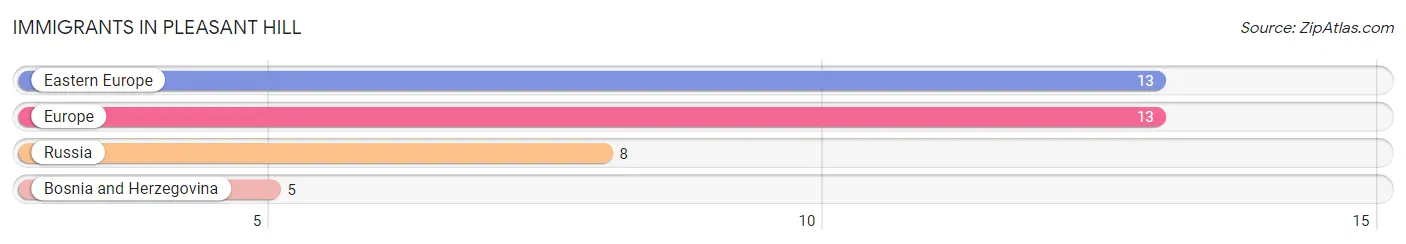
Immigrants in Pleasant Hill
The most numerous immigrant groups reported in Pleasant Hill came from Eastern Europe (13 | 2.2%), Europe (13 | 2.2%), Russia (8 | 1.4%), and Bosnia and Herzegovina (5 | 0.9%), together accounting for 6.6% of all Pleasant Hill residents.
| Immigration Origin | # Population | % Population |
| Bosnia and Herzegovina | 5 | 0.9% |
| Eastern Europe | 13 | 2.2% |
| Europe | 13 | 2.2% |
| Russia | 8 | 1.4% | View All 4 Rows |
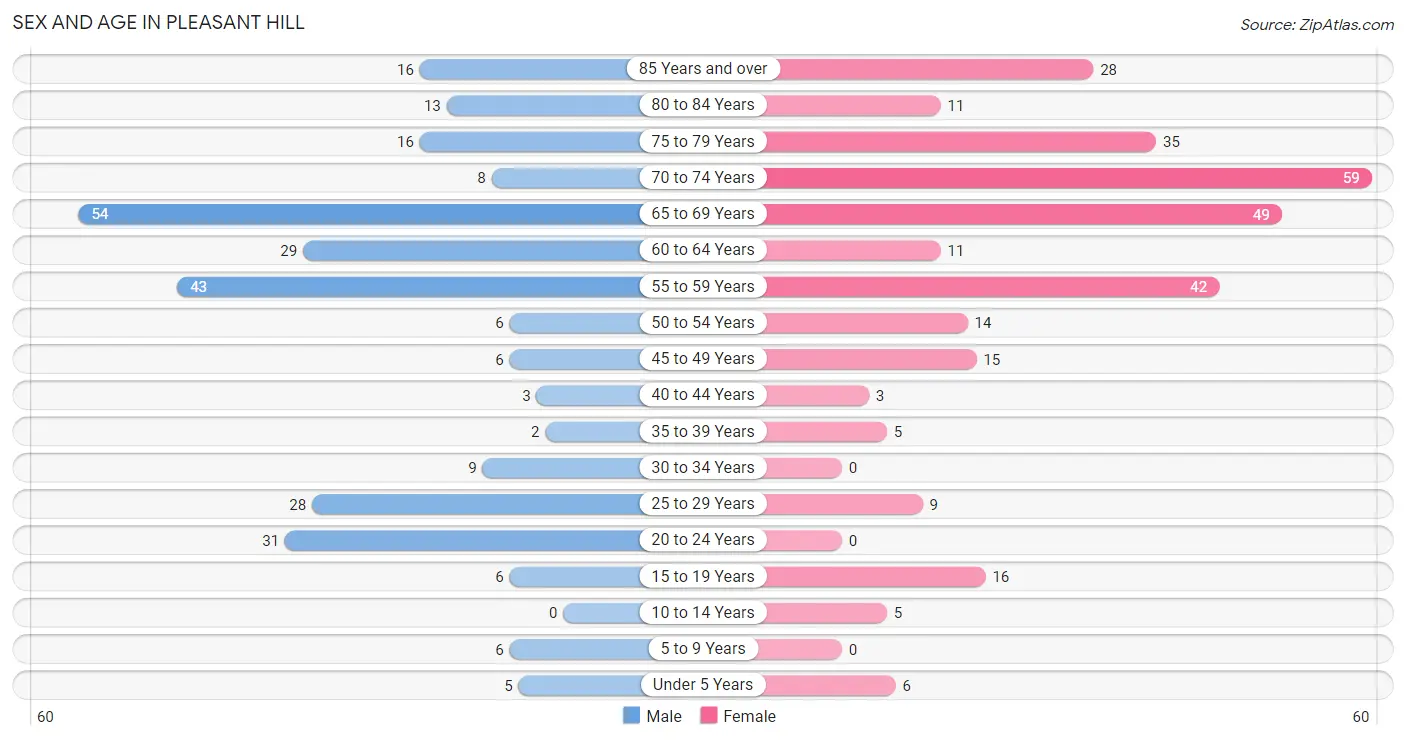
Sex and Age in Pleasant Hill
Sex and Age in Pleasant Hill
The most populous age groups in Pleasant Hill are 65 to 69 Years (54 | 19.2%) for men and 70 to 74 Years (59 | 19.2%) for women.
| Age Bracket | Male | Female |
| Under 5 Years | 5 (1.8%) | 6 (1.9%) |
| 5 to 9 Years | 6 (2.1%) | 0 (0.0%) |
| 10 to 14 Years | 0 (0.0%) | 5 (1.6%) |
| 15 to 19 Years | 6 (2.1%) | 16 (5.2%) |
| 20 to 24 Years | 31 (11.0%) | 0 (0.0%) |
| 25 to 29 Years | 28 (10.0%) | 9 (2.9%) |
| 30 to 34 Years | 9 (3.2%) | 0 (0.0%) |
| 35 to 39 Years | 2 (0.7%) | 5 (1.6%) |
| 40 to 44 Years | 3 (1.1%) | 3 (1.0%) |
| 45 to 49 Years | 6 (2.1%) | 15 (4.9%) |
| 50 to 54 Years | 6 (2.1%) | 14 (4.5%) |
| 55 to 59 Years | 43 (15.3%) | 42 (13.6%) |
| 60 to 64 Years | 29 (10.3%) | 11 (3.6%) |
| 65 to 69 Years | 54 (19.2%) | 49 (15.9%) |
| 70 to 74 Years | 8 (2.9%) | 59 (19.2%) |
| 75 to 79 Years | 16 (5.7%) | 35 (11.4%) |
| 80 to 84 Years | 13 (4.6%) | 11 (3.6%) |
| 85 Years and over | 16 (5.7%) | 28 (9.1%) |
| Total | 281 (100.0%) | 308 (100.0%) |
Families and Households in Pleasant Hill
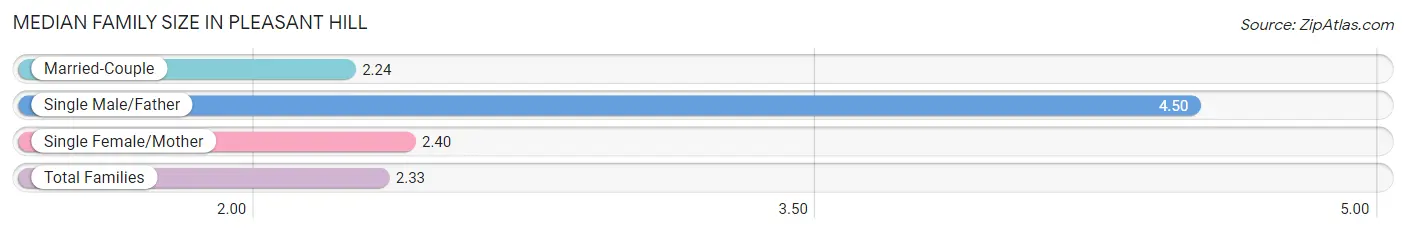
Median Family Size in Pleasant Hill
The median family size in Pleasant Hill is 2.33 persons per family, with single male/father families (4 | 3.6%) accounting for the largest median family size of 4.5 persons per family. On the other hand, married-couple families (97 | 87.4%) represent the smallest median family size with 2.24 persons per family.
| Family Type | # Families | Family Size |
| Married-Couple | 97 (87.4%) | 2.24 |
| Single Male/Father | 4 (3.6%) | 4.50 |
| Single Female/Mother | 10 (9.0%) | 2.40 |
| Total Families | 111 (100.0%) | 2.33 |
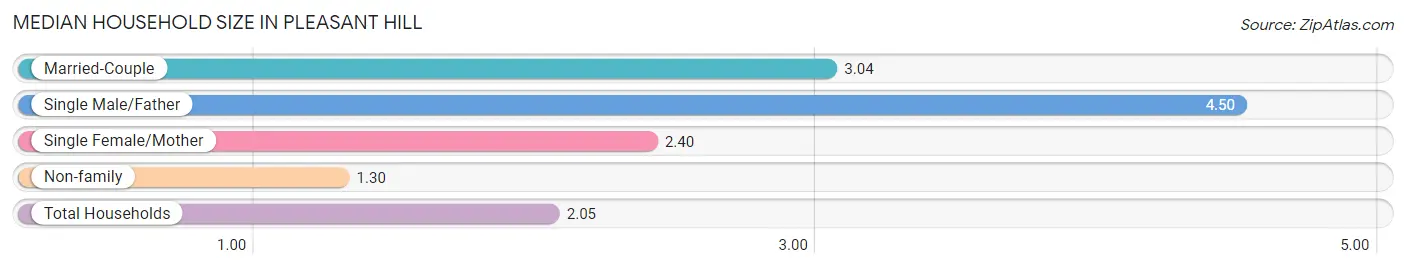
Median Household Size in Pleasant Hill
The median household size in Pleasant Hill is 2.05 persons per household, with single male/father households (4 | 1.5%) accounting for the largest median household size of 4.5 persons per household. non-family households (147 | 57.0%) represent the smallest median household size with 1.30 persons per household.
| Household Type | # Households | Household Size |
| Married-Couple | 97 (37.6%) | 3.04 |
| Single Male/Father | 4 (1.5%) | 4.50 |
| Single Female/Mother | 10 (3.9%) | 2.40 |
| Non-family | 147 (57.0%) | 1.30 |
| Total Households | 258 (100.0%) | 2.05 |
Household Size by Marriage Status in Pleasant Hill
Out of a total of 258 households in Pleasant Hill, 111 (43.0%) are family households, while 147 (57.0%) are nonfamily households. The most numerous type of family households are 2-person households, comprising 63, and the most common type of nonfamily households are 1-person households, comprising 135.
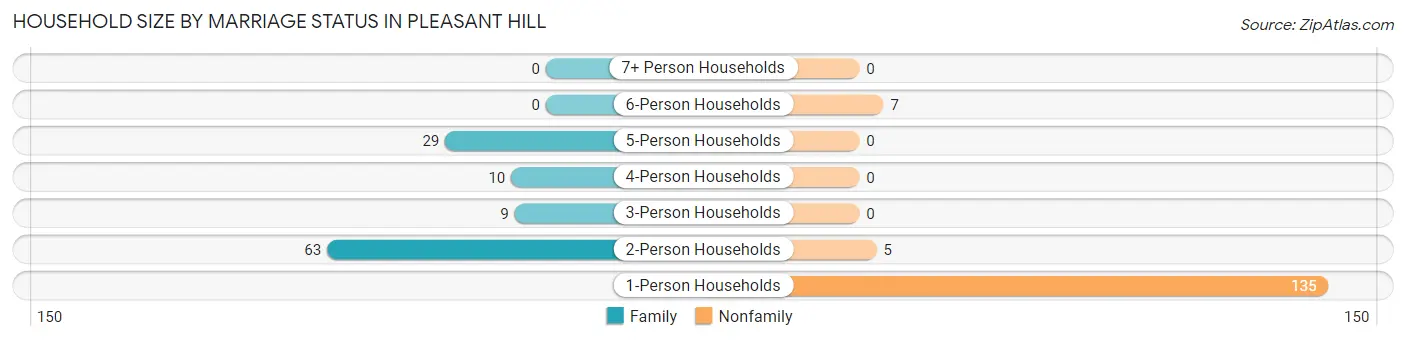
| Household Size | Family Households | Nonfamily Households |
| 1-Person Households | - | 135 (52.3%) |
| 2-Person Households | 63 (24.4%) | 5 (1.9%) |
| 3-Person Households | 9 (3.5%) | 0 (0.0%) |
| 4-Person Households | 10 (3.9%) | 0 (0.0%) |
| 5-Person Households | 29 (11.2%) | 0 (0.0%) |
| 6-Person Households | 0 (0.0%) | 7 (2.7%) |
| 7+ Person Households | 0 (0.0%) | 0 (0.0%) |
| Total | 111 (43.0%) | 147 (57.0%) |
Female Fertility in Pleasant Hill
Fertility by Age in Pleasant Hill
| Age Bracket | Women with Births | Births / 1,000 Women |
| 15 to 19 years | 0 (0.0%) | 0.0 |
| 20 to 34 years | 0 (0.0%) | 0.0 |
| 35 to 50 years | 0 (0.0%) | 0.0 |
| Total | 0 (0.0%) | 0.0 |
Fertility by Age by Marriage Status in Pleasant Hill
| Age Bracket | Married | Unmarried |
| 15 to 19 years | 0 (0.0%) | 0 (0.0%) |
| 20 to 34 years | 0 (0.0%) | 0 (0.0%) |
| 35 to 50 years | 0 (0.0%) | 0 (0.0%) |
| Total | 0 (0.0%) | 0 (0.0%) |
Fertility by Education in Pleasant Hill
| Educational Attainment | Women with Births | Births / 1,000 Women |
| Less than High School | 0 (0.0%) | 0.0 |
| High School Diploma | 0 (0.0%) | 0.0 |
| College or Associate's Degree | 0 (0.0%) | 0.0 |
| Bachelor's Degree | 0 (0.0%) | 0.0 |
| Graduate Degree | 0 (0.0%) | 0.0 |
| Total | 0 (0.0%) | 0.0 |
Fertility by Education by Marriage Status in Pleasant Hill
| Educational Attainment | Married | Unmarried |
| Less than High School | 0 (0.0%) | 0 (0.0%) |
| High School Diploma | 0 (0.0%) | 0 (0.0%) |
| College or Associate's Degree | 0 (0.0%) | 0 (0.0%) |
| Bachelor's Degree | 0 (0.0%) | 0 (0.0%) |
| Graduate Degree | 0 (0.0%) | 0 (0.0%) |
| Total | 0 (0.0%) | 0 (0.0%) |
Employment Characteristics in Pleasant Hill
Employment by Class of Employer in Pleasant Hill
Among the 190 employed individuals in Pleasant Hill, private company employees (65 | 34.2%), not-for-profit organizations (50 | 26.3%), and local government employees (39 | 20.5%) make up the most common classes of employment.
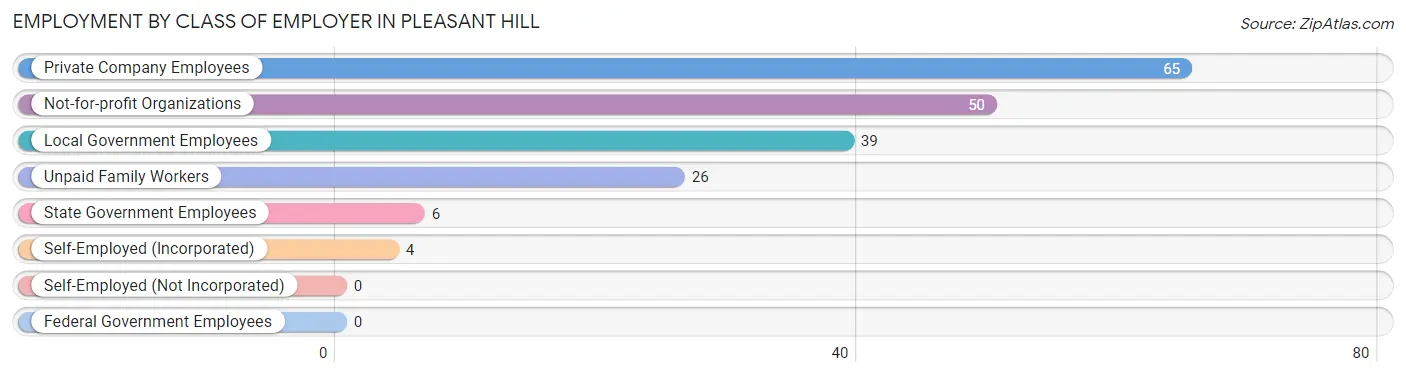
| Employer Class | # Employees | % Employees |
| Private Company Employees | 65 | 34.2% |
| Self-Employed (Incorporated) | 4 | 2.1% |
| Self-Employed (Not Incorporated) | 0 | 0.0% |
| Not-for-profit Organizations | 50 | 26.3% |
| Local Government Employees | 39 | 20.5% |
| State Government Employees | 6 | 3.2% |
| Federal Government Employees | 0 | 0.0% |
| Unpaid Family Workers | 26 | 13.7% |
| Total | 190 | 100.0% |
Employment Status by Age in Pleasant Hill
According to the labor force statistics for Pleasant Hill, out of the total population over 16 years of age (567), 38.3% or 217 individuals are in the labor force, with 12.4% or 27 of them unemployed. The age group with the highest labor force participation rate is 30 to 34 years, with 100.0% or 9 individuals in the labor force. Within the labor force, the 16 to 19 years age range has the highest percentage of unemployed individuals, with 100.0% or 15 of them being unemployed.
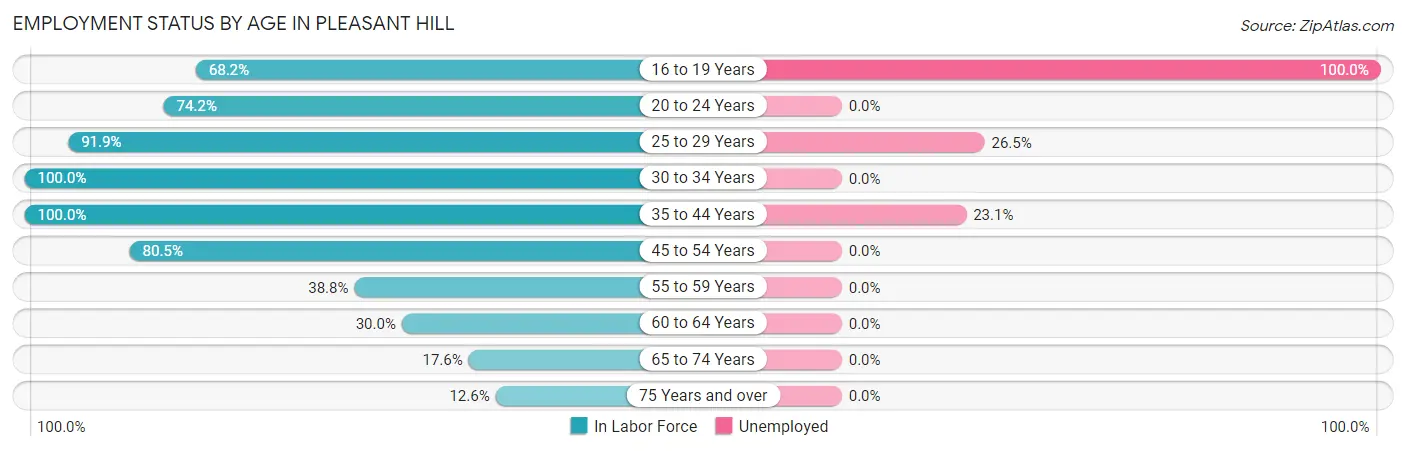
| Age Bracket | In Labor Force | Unemployed |
| 16 to 19 Years | 15 (68.2%) | 15 (100.0%) |
| 20 to 24 Years | 23 (74.2%) | 0 (0.0%) |
| 25 to 29 Years | 34 (91.9%) | 9 (26.5%) |
| 30 to 34 Years | 9 (100.0%) | 0 (0.0%) |
| 35 to 44 Years | 13 (100.0%) | 3 (23.1%) |
| 45 to 54 Years | 33 (80.5%) | 0 (0.0%) |
| 55 to 59 Years | 33 (38.8%) | 0 (0.0%) |
| 60 to 64 Years | 12 (30.0%) | 0 (0.0%) |
| 65 to 74 Years | 30 (17.6%) | 0 (0.0%) |
| 75 Years and over | 15 (12.6%) | 0 (0.0%) |
| Total | 217 (38.3%) | 27 (12.4%) |
Employment Status by Educational Attainment in Pleasant Hill
According to labor force statistics for Pleasant Hill, 59.6% of individuals (134) out of the total population between 25 and 64 years of age (225) are in the labor force, with 9.0% or 12 of them being unemployed. The group with the highest labor force participation rate are those with the educational attainment of less than high school, with 90.0% or 27 individuals in the labor force. Within the labor force, individuals with college / associate degree education have the highest percentage of unemployment, with 13.6% or 9 of them being unemployed.
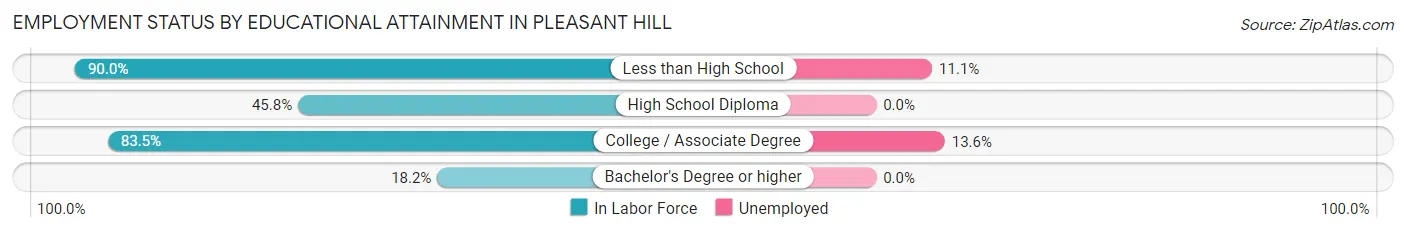
| Educational Attainment | In Labor Force | Unemployed |
| Less than High School | 27 (90.0%) | 3 (11.1%) |
| High School Diploma | 33 (45.8%) | 0 (0.0%) |
| College / Associate Degree | 66 (83.5%) | 11 (13.6%) |
| Bachelor's Degree or higher | 8 (18.2%) | 0 (0.0%) |
| Total | 134 (59.6%) | 20 (9.0%) |
Employment Occupations by Sex in Pleasant Hill
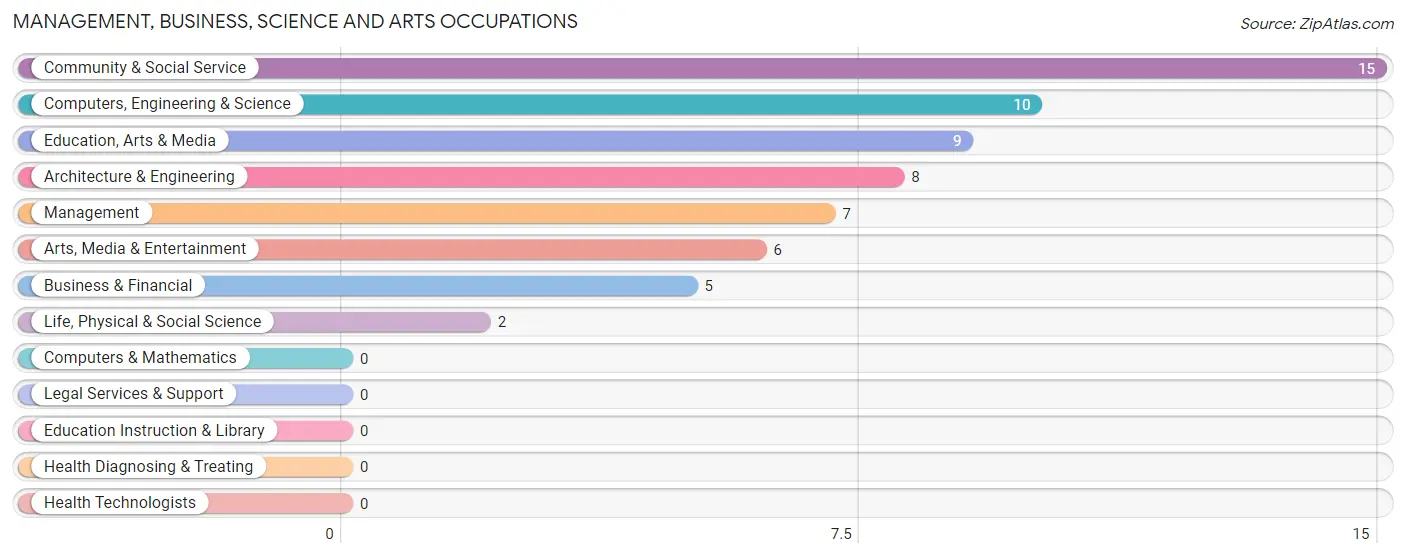
Management, Business, Science and Arts Occupations
The most common Management, Business, Science and Arts occupations in Pleasant Hill are Community & Social Service (15 | 7.9%), Computers, Engineering & Science (10 | 5.3%), Education, Arts & Media (9 | 4.7%), Architecture & Engineering (8 | 4.2%), and Management (7 | 3.7%).
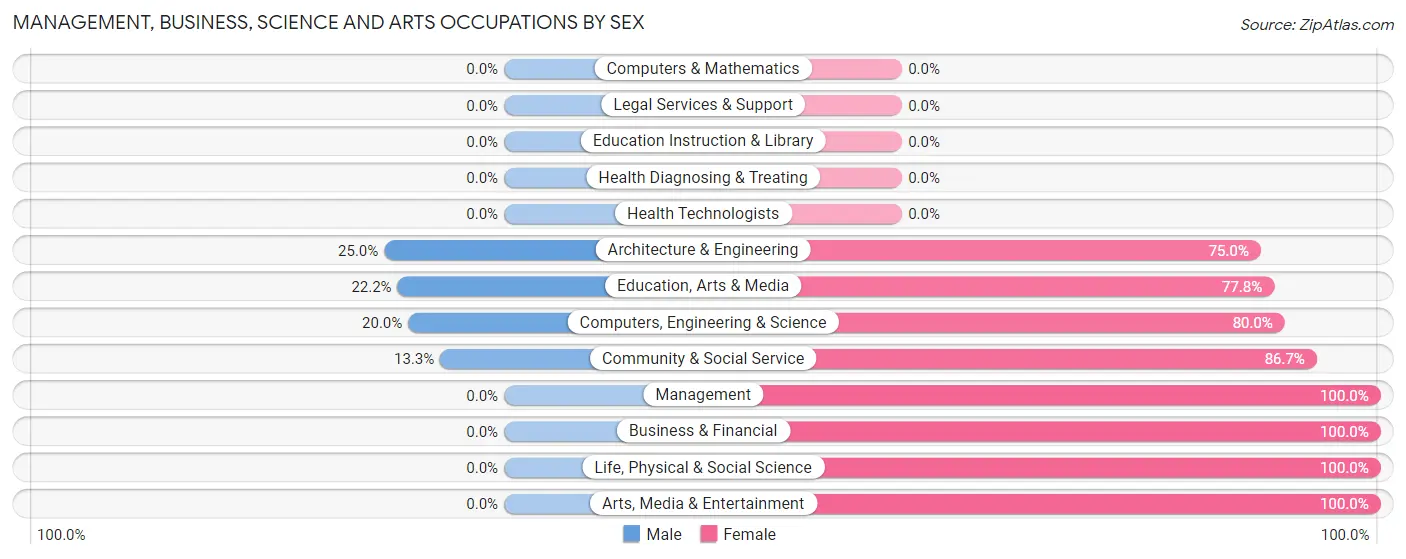
Management, Business, Science and Arts Occupations by Sex
Within the Management, Business, Science and Arts occupations in Pleasant Hill, the most male-oriented occupations are Architecture & Engineering (25.0%), Education, Arts & Media (22.2%), and Computers, Engineering & Science (20.0%), while the most female-oriented occupations are Management (100.0%), Business & Financial (100.0%), and Life, Physical & Social Science (100.0%).
| Occupation | Male | Female |
| Management | 0 (0.0%) | 7 (100.0%) |
| Business & Financial | 0 (0.0%) | 5 (100.0%) |
| Computers, Engineering & Science | 2 (20.0%) | 8 (80.0%) |
| Computers & Mathematics | 0 (0.0%) | 0 (0.0%) |
| Architecture & Engineering | 2 (25.0%) | 6 (75.0%) |
| Life, Physical & Social Science | 0 (0.0%) | 2 (100.0%) |
| Community & Social Service | 2 (13.3%) | 13 (86.7%) |
| Education, Arts & Media | 2 (22.2%) | 7 (77.8%) |
| Legal Services & Support | 0 (0.0%) | 0 (0.0%) |
| Education Instruction & Library | 0 (0.0%) | 0 (0.0%) |
| Arts, Media & Entertainment | 0 (0.0%) | 6 (100.0%) |
| Health Diagnosing & Treating | 0 (0.0%) | 0 (0.0%) |
| Health Technologists | 0 (0.0%) | 0 (0.0%) |
| Total (Category) | 4 (10.8%) | 33 (89.2%) |
| Total (Overall) | 129 (67.9%) | 61 (32.1%) |
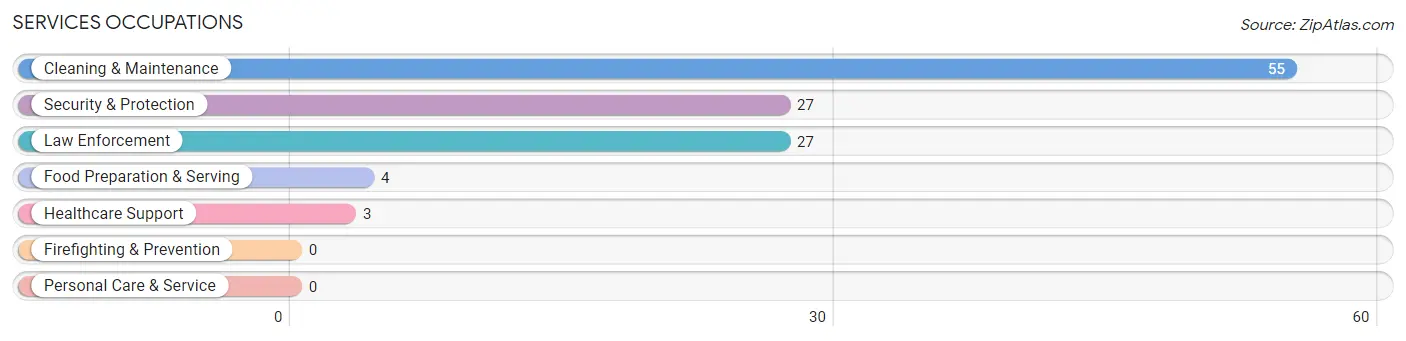
Services Occupations
The most common Services occupations in Pleasant Hill are Cleaning & Maintenance (55 | 28.9%), Security & Protection (27 | 14.2%), Law Enforcement (27 | 14.2%), Food Preparation & Serving (4 | 2.1%), and Healthcare Support (3 | 1.6%).
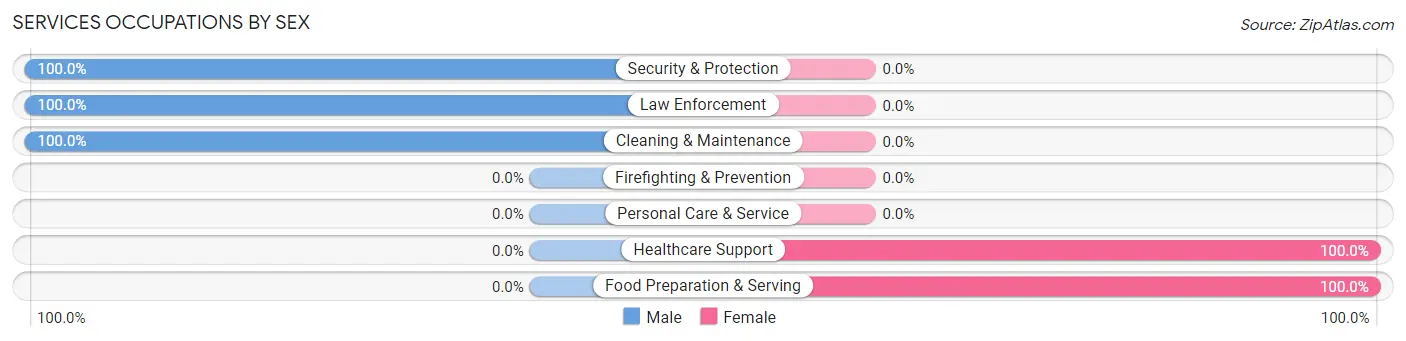
Services Occupations by Sex
Within the Services occupations in Pleasant Hill, the most male-oriented occupations are Security & Protection (100.0%), Law Enforcement (100.0%), and Cleaning & Maintenance (100.0%), while the most female-oriented occupations are Healthcare Support (100.0%), and Food Preparation & Serving (100.0%).
| Occupation | Male | Female |
| Healthcare Support | 0 (0.0%) | 3 (100.0%) |
| Security & Protection | 27 (100.0%) | 0 (0.0%) |
| Firefighting & Prevention | 0 (0.0%) | 0 (0.0%) |
| Law Enforcement | 27 (100.0%) | 0 (0.0%) |
| Food Preparation & Serving | 0 (0.0%) | 4 (100.0%) |
| Cleaning & Maintenance | 55 (100.0%) | 0 (0.0%) |
| Personal Care & Service | 0 (0.0%) | 0 (0.0%) |
| Total (Category) | 82 (92.1%) | 7 (7.9%) |
| Total (Overall) | 129 (67.9%) | 61 (32.1%) |
Sales and Office Occupations
The most common Sales and Office occupations in Pleasant Hill are Office & Administration (19 | 10.0%), and Sales & Related (5 | 2.6%).
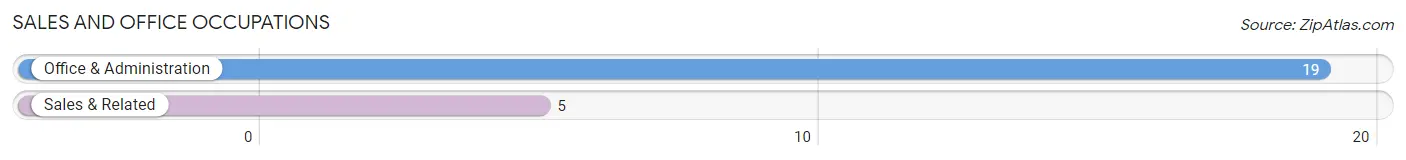
Sales and Office Occupations by Sex
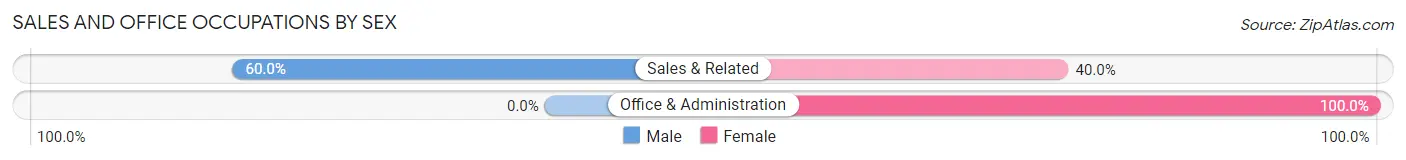
| Occupation | Male | Female |
| Sales & Related | 3 (60.0%) | 2 (40.0%) |
| Office & Administration | 0 (0.0%) | 19 (100.0%) |
| Total (Category) | 3 (12.5%) | 21 (87.5%) |
| Total (Overall) | 129 (67.9%) | 61 (32.1%) |
Natural Resources, Construction and Maintenance Occupations
The most common Natural Resources, Construction and Maintenance occupations in Pleasant Hill are , and Construction & Extraction (19 | 10.0%).
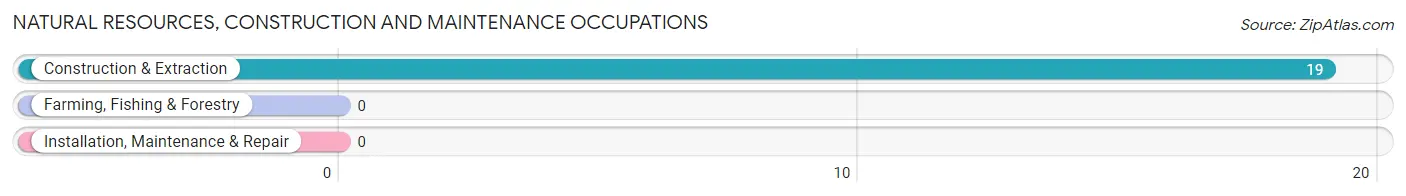
Natural Resources, Construction and Maintenance Occupations by Sex
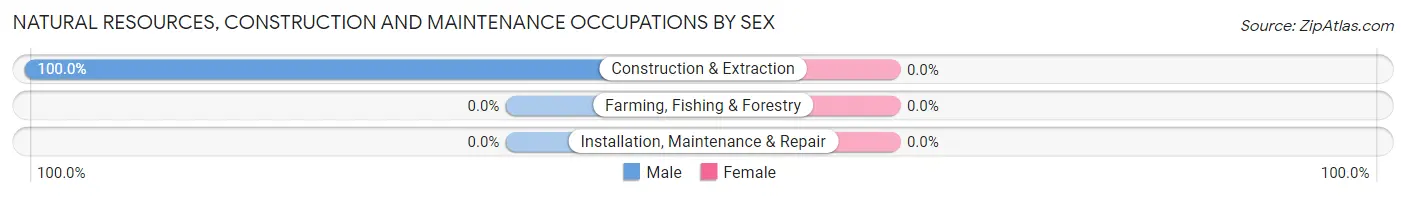
| Occupation | Male | Female |
| Farming, Fishing & Forestry | 0 (0.0%) | 0 (0.0%) |
| Construction & Extraction | 19 (100.0%) | 0 (0.0%) |
| Installation, Maintenance & Repair | 0 (0.0%) | 0 (0.0%) |
| Total (Category) | 19 (100.0%) | 0 (0.0%) |
| Total (Overall) | 129 (67.9%) | 61 (32.1%) |
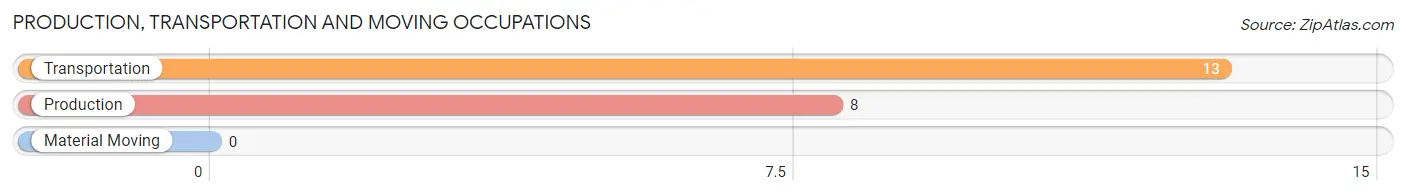
Production, Transportation and Moving Occupations
The most common Production, Transportation and Moving occupations in Pleasant Hill are Transportation (13 | 6.8%), and Production (8 | 4.2%).
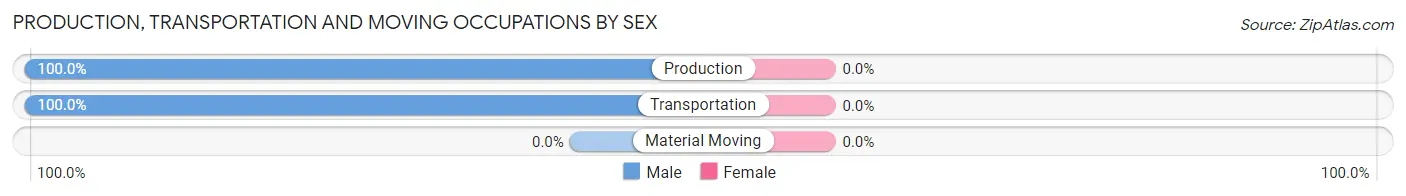
Production, Transportation and Moving Occupations by Sex
| Occupation | Male | Female |
| Production | 8 (100.0%) | 0 (0.0%) |
| Transportation | 13 (100.0%) | 0 (0.0%) |
| Material Moving | 0 (0.0%) | 0 (0.0%) |
| Total (Category) | 21 (100.0%) | 0 (0.0%) |
| Total (Overall) | 129 (67.9%) | 61 (32.1%) |
Employment Industries by Sex in Pleasant Hill
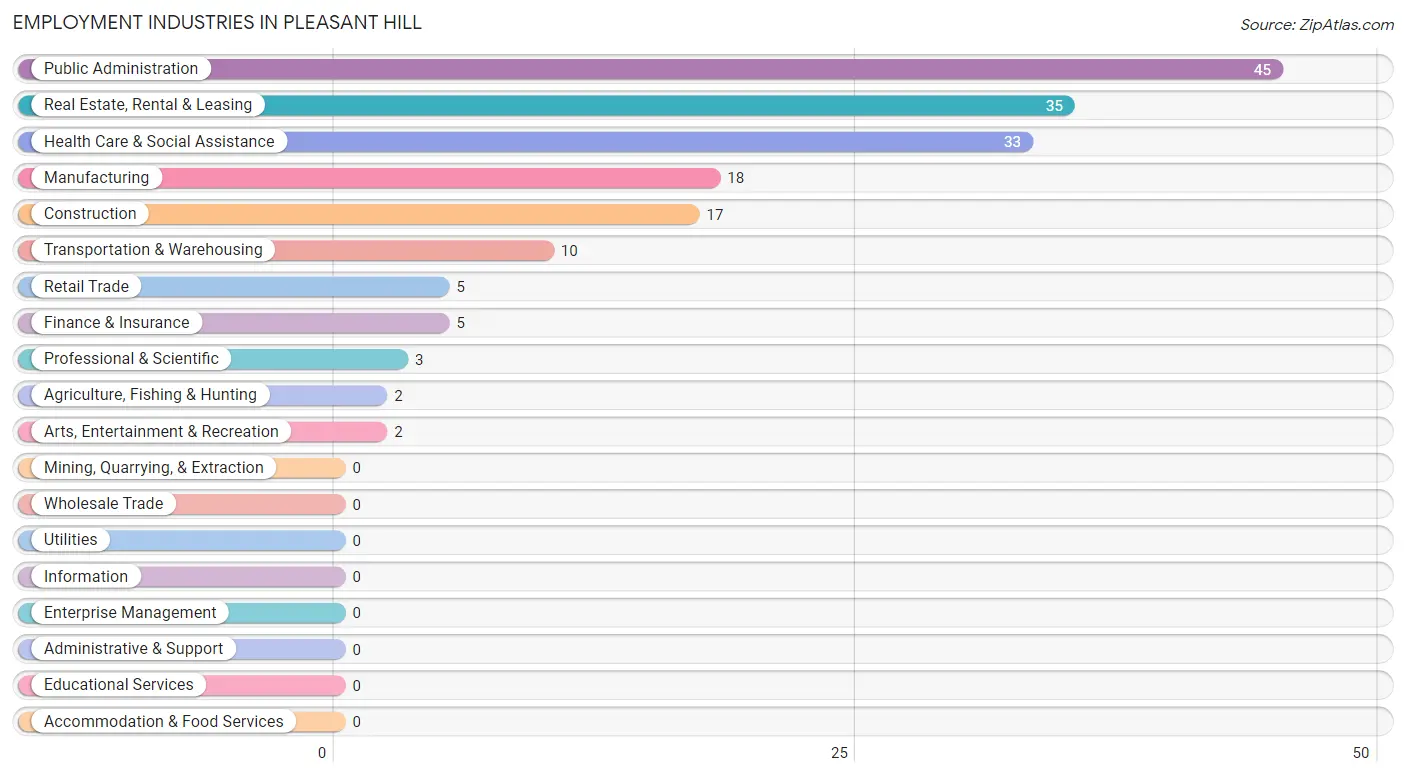
Employment Industries in Pleasant Hill
The major employment industries in Pleasant Hill include Public Administration (45 | 23.7%), Real Estate, Rental & Leasing (35 | 18.4%), Health Care & Social Assistance (33 | 17.4%), Manufacturing (18 | 9.5%), and Construction (17 | 8.9%).
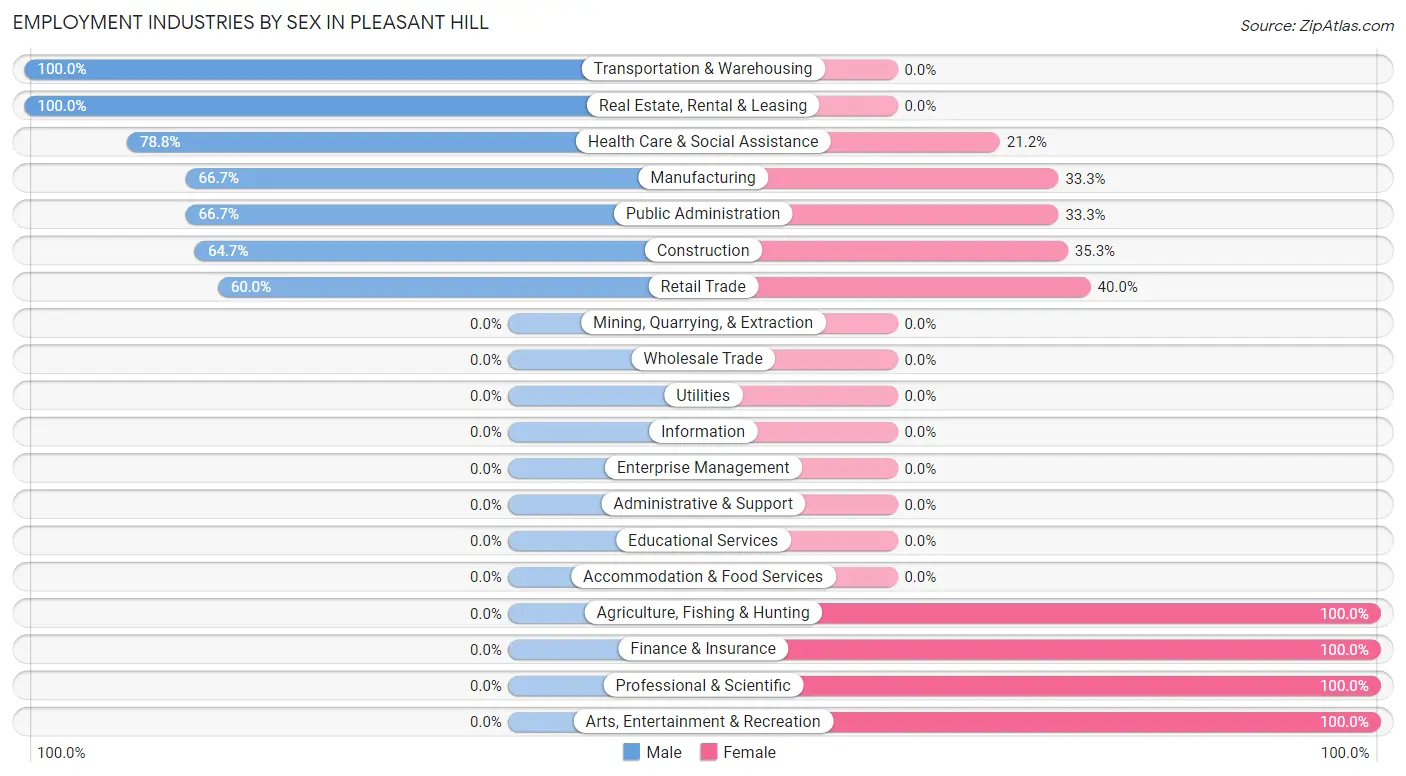
Employment Industries by Sex in Pleasant Hill
The Pleasant Hill industries that see more men than women are Transportation & Warehousing (100.0%), Real Estate, Rental & Leasing (100.0%), and Health Care & Social Assistance (78.8%), whereas the industries that tend to have a higher number of women are Agriculture, Fishing & Hunting (100.0%), Finance & Insurance (100.0%), and Professional & Scientific (100.0%).
| Industry | Male | Female |
| Agriculture, Fishing & Hunting | 0 (0.0%) | 2 (100.0%) |
| Mining, Quarrying, & Extraction | 0 (0.0%) | 0 (0.0%) |
| Construction | 11 (64.7%) | 6 (35.3%) |
| Manufacturing | 12 (66.7%) | 6 (33.3%) |
| Wholesale Trade | 0 (0.0%) | 0 (0.0%) |
| Retail Trade | 3 (60.0%) | 2 (40.0%) |
| Transportation & Warehousing | 10 (100.0%) | 0 (0.0%) |
| Utilities | 0 (0.0%) | 0 (0.0%) |
| Information | 0 (0.0%) | 0 (0.0%) |
| Finance & Insurance | 0 (0.0%) | 5 (100.0%) |
| Real Estate, Rental & Leasing | 35 (100.0%) | 0 (0.0%) |
| Professional & Scientific | 0 (0.0%) | 3 (100.0%) |
| Enterprise Management | 0 (0.0%) | 0 (0.0%) |
| Administrative & Support | 0 (0.0%) | 0 (0.0%) |
| Educational Services | 0 (0.0%) | 0 (0.0%) |
| Health Care & Social Assistance | 26 (78.8%) | 7 (21.2%) |
| Arts, Entertainment & Recreation | 0 (0.0%) | 2 (100.0%) |
| Accommodation & Food Services | 0 (0.0%) | 0 (0.0%) |
| Public Administration | 30 (66.7%) | 15 (33.3%) |
| Total | 129 (67.9%) | 61 (32.1%) |
Education in Pleasant Hill
School Enrollment in Pleasant Hill
The most common levels of schooling among the 44 students in Pleasant Hill are high school (25 | 56.8%), elementary school (6 | 13.6%), and nursery / preschool (5 | 11.4%).
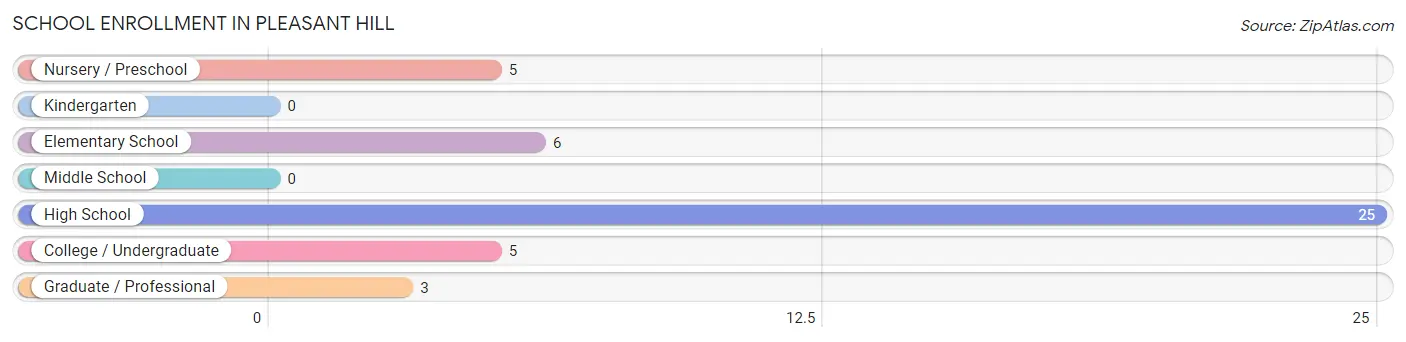
| School Level | # Students | % Students |
| Nursery / Preschool | 5 | 11.4% |
| Kindergarten | 0 | 0.0% |
| Elementary School | 6 | 13.6% |
| Middle School | 0 | 0.0% |
| High School | 25 | 56.8% |
| College / Undergraduate | 5 | 11.4% |
| Graduate / Professional | 3 | 6.8% |
| Total | 44 | 100.0% |
School Enrollment by Age by Funding Source in Pleasant Hill
Out of a total of 44 students who are enrolled in schools in Pleasant Hill, 3 (6.8%) attend a private institution, while the remaining 41 (93.2%) are enrolled in public schools. The age group of 35 years and over has the highest likelihood of being enrolled in private schools, with 3 (100.0% in the age bracket) enrolled. Conversely, the age group of 3 to 4 year olds has the lowest likelihood of being enrolled in a private school, with 5 (100.0% in the age bracket) attending a public institution.
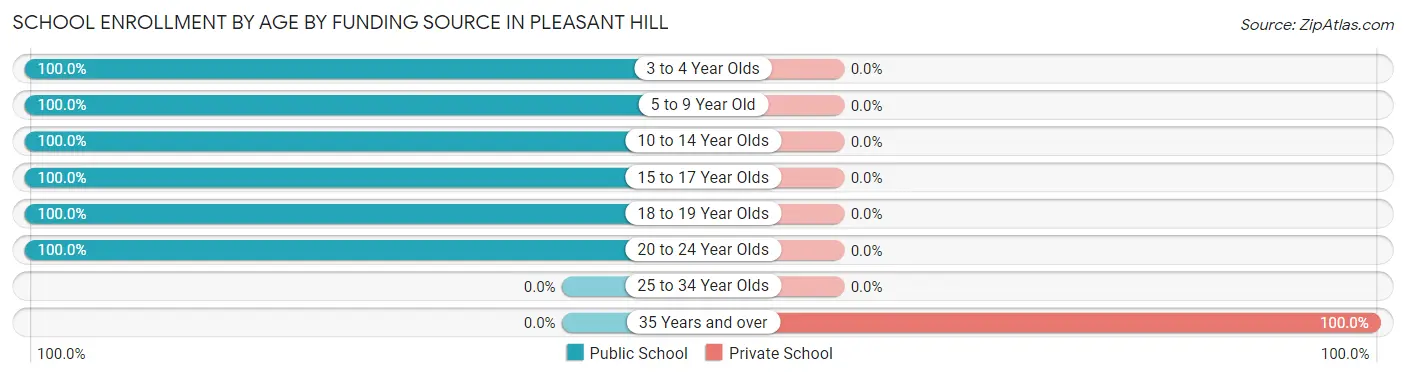
| Age Bracket | Public School | Private School |
| 3 to 4 Year Olds | 5 (100.0%) | 0 (0.0%) |
| 5 to 9 Year Old | 6 (100.0%) | 0 (0.0%) |
| 10 to 14 Year Olds | 5 (100.0%) | 0 (0.0%) |
| 15 to 17 Year Olds | 3 (100.0%) | 0 (0.0%) |
| 18 to 19 Year Olds | 19 (100.0%) | 0 (0.0%) |
| 20 to 24 Year Olds | 3 (100.0%) | 0 (0.0%) |
| 25 to 34 Year Olds | 0 (0.0%) | 0 (0.0%) |
| 35 Years and over | 0 (0.0%) | 3 (100.0%) |
| Total | 41 (93.2%) | 3 (6.8%) |
Educational Attainment by Field of Study in Pleasant Hill
Visual & performing arts (68 | 25.4%), psychology (36 | 13.4%), education (33 | 12.3%), physical & health sciences (26 | 9.7%), and social sciences (26 | 9.7%) are the most common fields of study among 268 individuals in Pleasant Hill who have obtained a bachelor's degree or higher.
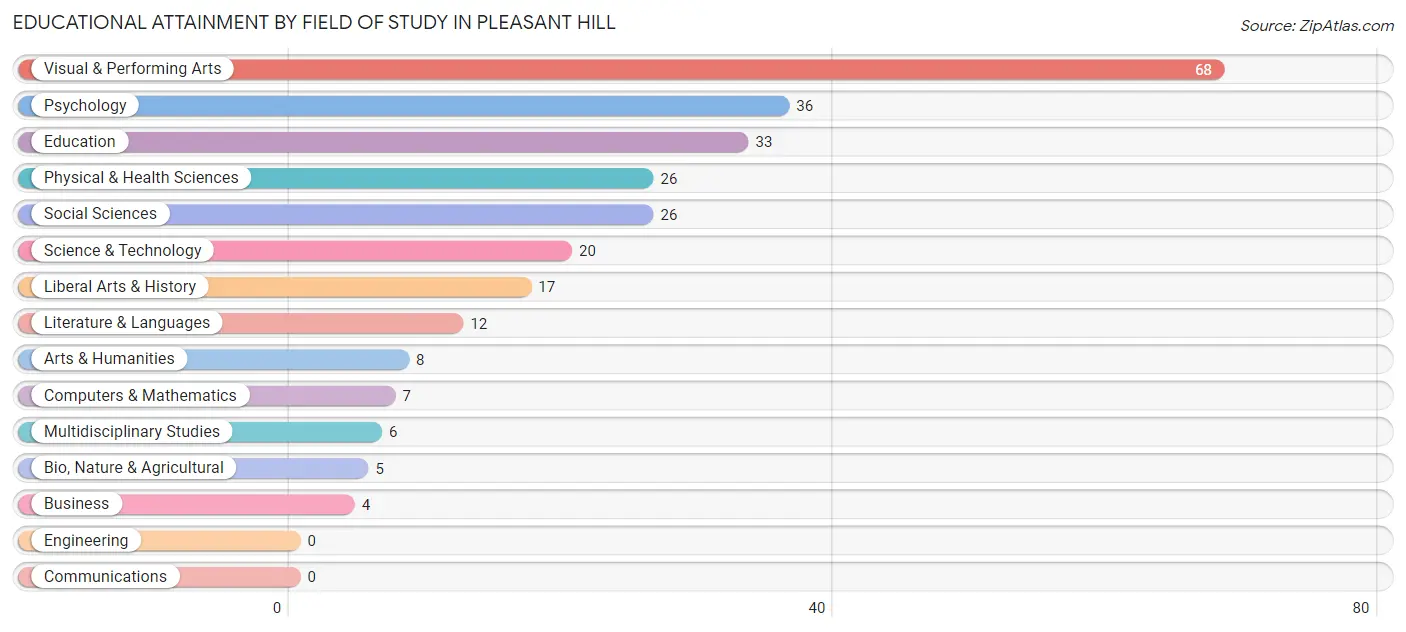
| Field of Study | # Graduates | % Graduates |
| Computers & Mathematics | 7 | 2.6% |
| Bio, Nature & Agricultural | 5 | 1.9% |
| Physical & Health Sciences | 26 | 9.7% |
| Psychology | 36 | 13.4% |
| Social Sciences | 26 | 9.7% |
| Engineering | 0 | 0.0% |
| Multidisciplinary Studies | 6 | 2.2% |
| Science & Technology | 20 | 7.5% |
| Business | 4 | 1.5% |
| Education | 33 | 12.3% |
| Literature & Languages | 12 | 4.5% |
| Liberal Arts & History | 17 | 6.3% |
| Visual & Performing Arts | 68 | 25.4% |
| Communications | 0 | 0.0% |
| Arts & Humanities | 8 | 3.0% |
| Total | 268 | 100.0% |
Transportation & Commute in Pleasant Hill
Vehicle Availability by Sex in Pleasant Hill
The most prevalent vehicle ownership categories in Pleasant Hill are males with 4 vehicles (75, accounting for 58.1%) and females with 4 vehicles (0, making up 123.0%).
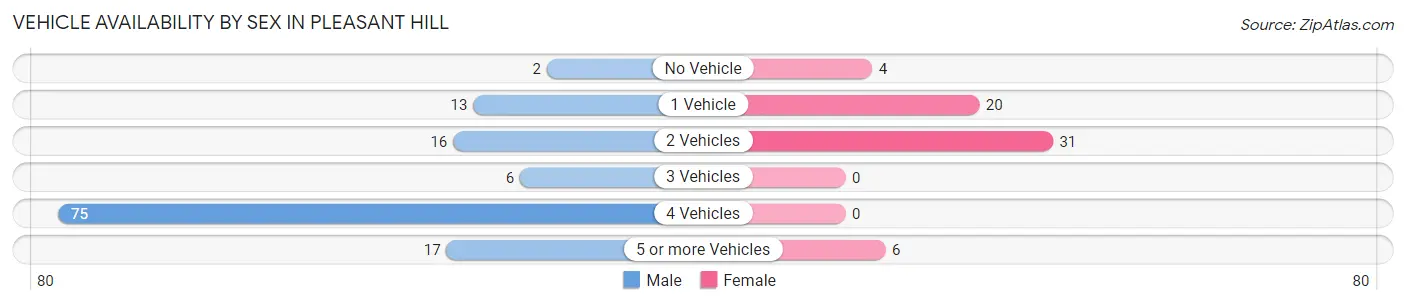
| Vehicles Available | Male | Female |
| No Vehicle | 2 (1.5%) | 4 (6.6%) |
| 1 Vehicle | 13 (10.1%) | 20 (32.8%) |
| 2 Vehicles | 16 (12.4%) | 31 (50.8%) |
| 3 Vehicles | 6 (4.6%) | 0 (0.0%) |
| 4 Vehicles | 75 (58.1%) | 0 (0.0%) |
| 5 or more Vehicles | 17 (13.2%) | 6 (9.8%) |
| Total | 129 (100.0%) | 61 (100.0%) |
Commute Time in Pleasant Hill
The most frequently occuring commute durations in Pleasant Hill are 10 to 14 minutes (35 commuters, 19.3%), 20 to 24 minutes (27 commuters, 14.9%), and 25 to 29 minutes (26 commuters, 14.4%).
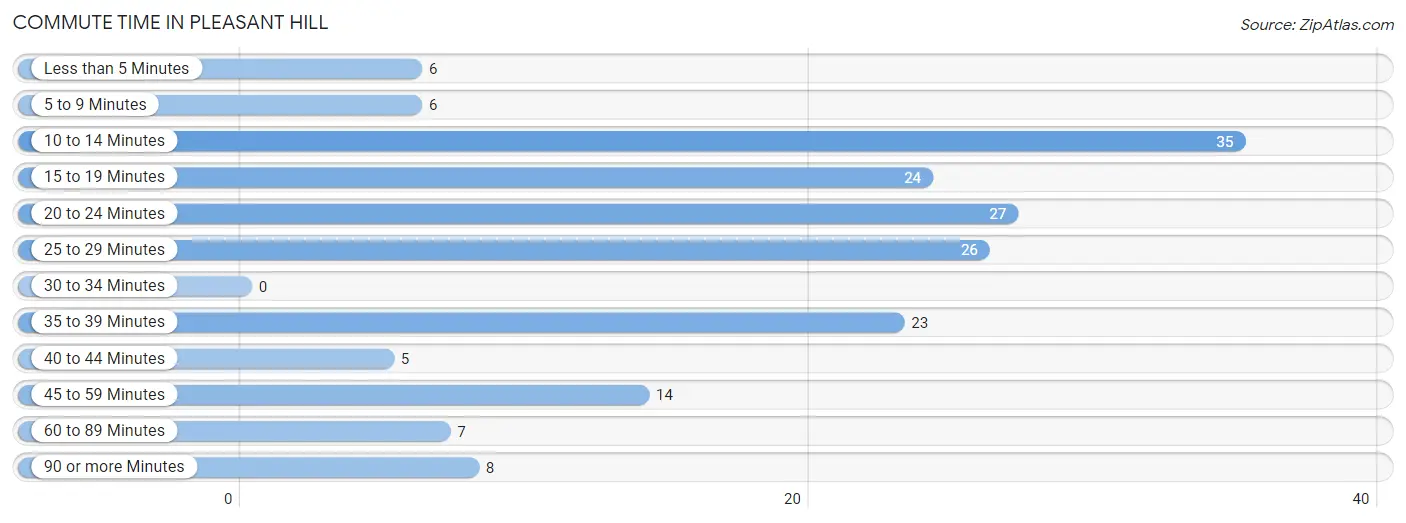
| Commute Time | # Commuters | % Commuters |
| Less than 5 Minutes | 6 | 3.3% |
| 5 to 9 Minutes | 6 | 3.3% |
| 10 to 14 Minutes | 35 | 19.3% |
| 15 to 19 Minutes | 24 | 13.3% |
| 20 to 24 Minutes | 27 | 14.9% |
| 25 to 29 Minutes | 26 | 14.4% |
| 30 to 34 Minutes | 0 | 0.0% |
| 35 to 39 Minutes | 23 | 12.7% |
| 40 to 44 Minutes | 5 | 2.8% |
| 45 to 59 Minutes | 14 | 7.7% |
| 60 to 89 Minutes | 7 | 3.9% |
| 90 or more Minutes | 8 | 4.4% |
Commute Time by Sex in Pleasant Hill
The most common commute times in Pleasant Hill are 10 to 14 minutes (29 commuters, 22.5%) for males and 15 to 19 minutes (13 commuters, 25.0%) for females.
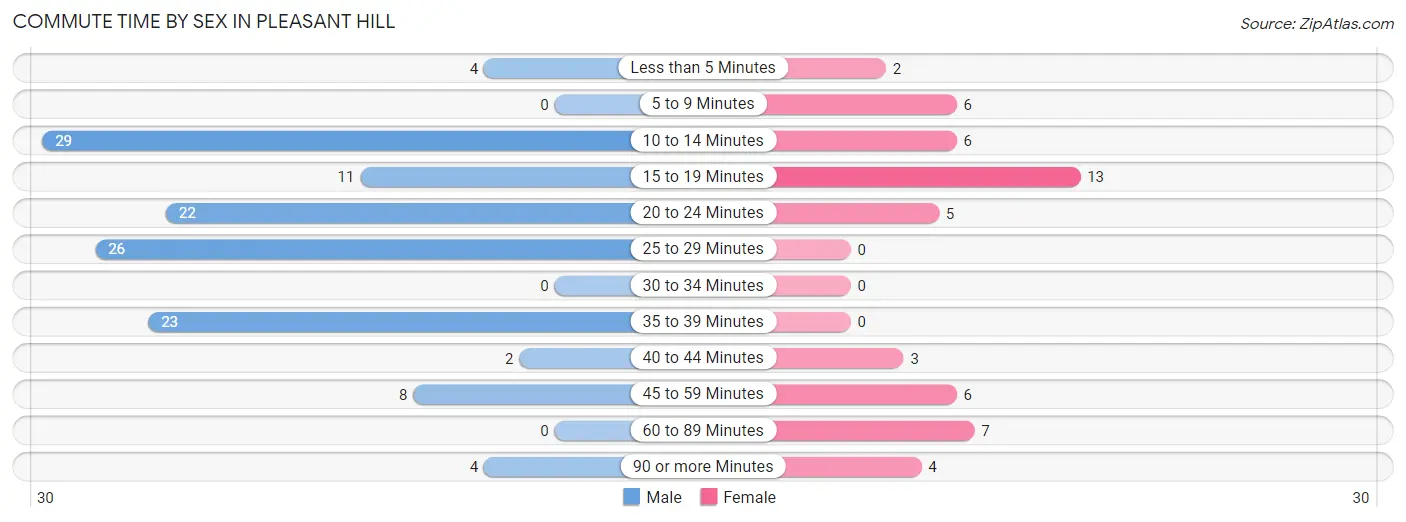
| Commute Time | Male | Female |
| Less than 5 Minutes | 4 (3.1%) | 2 (3.8%) |
| 5 to 9 Minutes | 0 (0.0%) | 6 (11.5%) |
| 10 to 14 Minutes | 29 (22.5%) | 6 (11.5%) |
| 15 to 19 Minutes | 11 (8.5%) | 13 (25.0%) |
| 20 to 24 Minutes | 22 (17.1%) | 5 (9.6%) |
| 25 to 29 Minutes | 26 (20.2%) | 0 (0.0%) |
| 30 to 34 Minutes | 0 (0.0%) | 0 (0.0%) |
| 35 to 39 Minutes | 23 (17.8%) | 0 (0.0%) |
| 40 to 44 Minutes | 2 (1.5%) | 3 (5.8%) |
| 45 to 59 Minutes | 8 (6.2%) | 6 (11.5%) |
| 60 to 89 Minutes | 0 (0.0%) | 7 (13.5%) |
| 90 or more Minutes | 4 (3.1%) | 4 (7.7%) |
Time of Departure to Work by Sex in Pleasant Hill
The most frequent times of departure to work in Pleasant Hill are 7:30 AM to 7:59 AM (35, 27.1%) for males and 7:00 AM to 7:29 AM (13, 25.0%) for females.
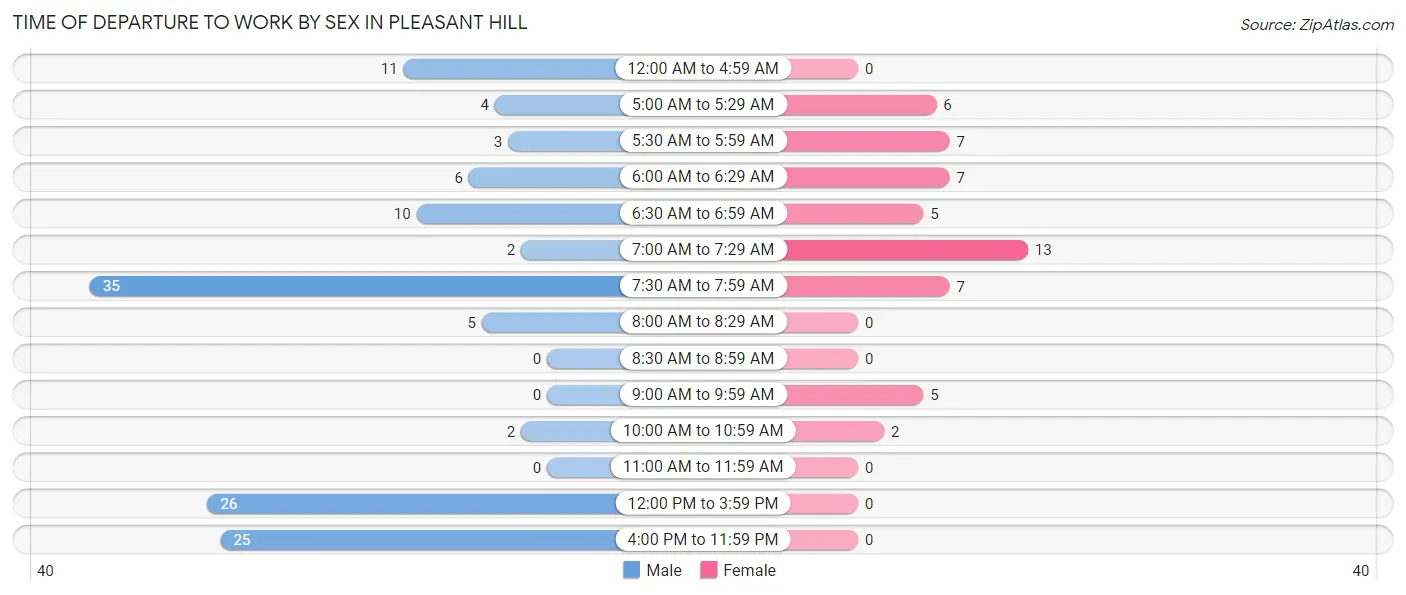
| Time of Departure | Male | Female |
| 12:00 AM to 4:59 AM | 11 (8.5%) | 0 (0.0%) |
| 5:00 AM to 5:29 AM | 4 (3.1%) | 6 (11.5%) |
| 5:30 AM to 5:59 AM | 3 (2.3%) | 7 (13.5%) |
| 6:00 AM to 6:29 AM | 6 (4.6%) | 7 (13.5%) |
| 6:30 AM to 6:59 AM | 10 (7.7%) | 5 (9.6%) |
| 7:00 AM to 7:29 AM | 2 (1.5%) | 13 (25.0%) |
| 7:30 AM to 7:59 AM | 35 (27.1%) | 7 (13.5%) |
| 8:00 AM to 8:29 AM | 5 (3.9%) | 0 (0.0%) |
| 8:30 AM to 8:59 AM | 0 (0.0%) | 0 (0.0%) |
| 9:00 AM to 9:59 AM | 0 (0.0%) | 5 (9.6%) |
| 10:00 AM to 10:59 AM | 2 (1.5%) | 2 (3.8%) |
| 11:00 AM to 11:59 AM | 0 (0.0%) | 0 (0.0%) |
| 12:00 PM to 3:59 PM | 26 (20.2%) | 0 (0.0%) |
| 4:00 PM to 11:59 PM | 25 (19.4%) | 0 (0.0%) |
| Total | 129 (100.0%) | 52 (100.0%) |
Housing Occupancy in Pleasant Hill
Occupancy by Ownership in Pleasant Hill
Of the total 258 dwellings in Pleasant Hill, owner-occupied units account for 210 (81.4%), while renter-occupied units make up 48 (18.6%).
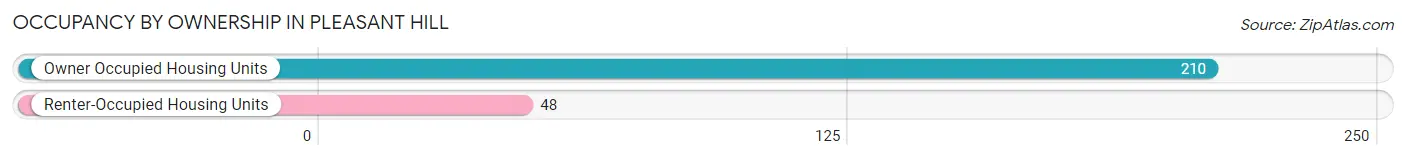
| Occupancy | # Housing Units | % Housing Units |
| Owner Occupied Housing Units | 210 | 81.4% |
| Renter-Occupied Housing Units | 48 | 18.6% |
| Total Occupied Housing Units | 258 | 100.0% |
Occupancy by Household Size in Pleasant Hill
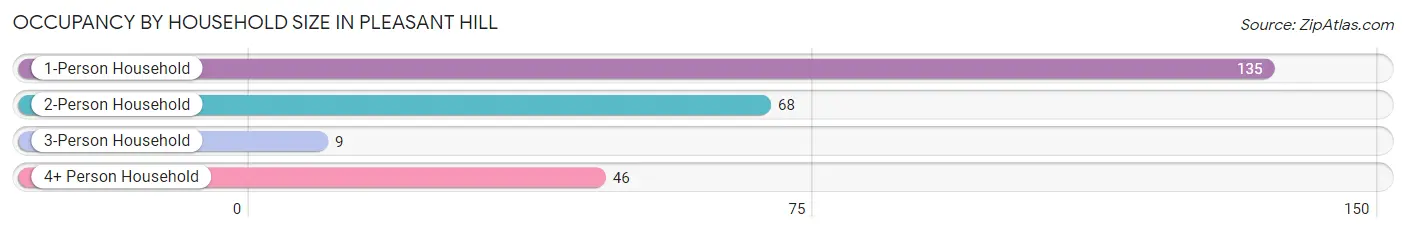
| Household Size | # Housing Units | % Housing Units |
| 1-Person Household | 135 | 52.3% |
| 2-Person Household | 68 | 26.4% |
| 3-Person Household | 9 | 3.5% |
| 4+ Person Household | 46 | 17.8% |
| Total Housing Units | 258 | 100.0% |
Occupancy by Ownership by Household Size in Pleasant Hill
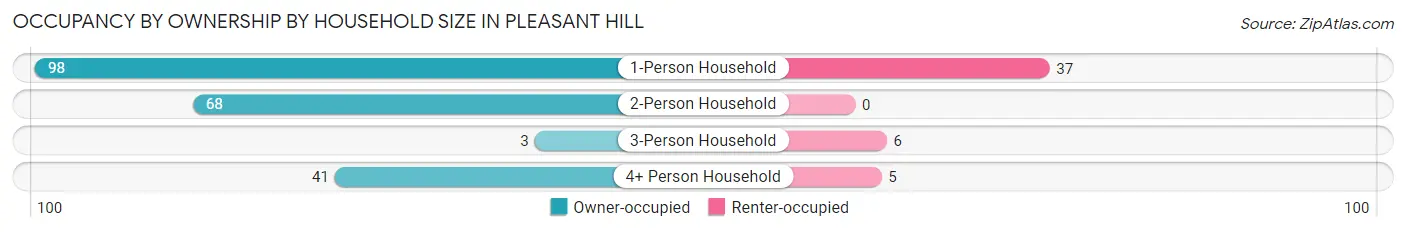
| Household Size | Owner-occupied | Renter-occupied |
| 1-Person Household | 98 (72.6%) | 37 (27.4%) |
| 2-Person Household | 68 (100.0%) | 0 (0.0%) |
| 3-Person Household | 3 (33.3%) | 6 (66.7%) |
| 4+ Person Household | 41 (89.1%) | 5 (10.9%) |
| Total Housing Units | 210 (81.4%) | 48 (18.6%) |
Occupancy by Educational Attainment in Pleasant Hill
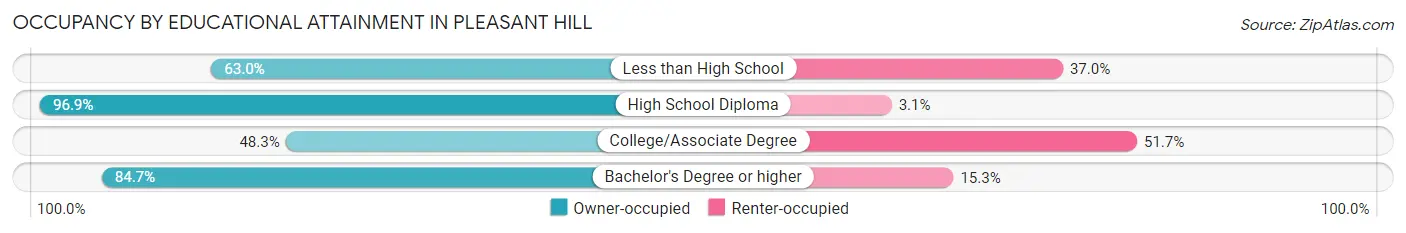
| Household Size | Owner-occupied | Renter-occupied |
| Less than High School | 17 (63.0%) | 10 (37.0%) |
| High School Diploma | 63 (96.9%) | 2 (3.1%) |
| College/Associate Degree | 14 (48.3%) | 15 (51.7%) |
| Bachelor's Degree or higher | 116 (84.7%) | 21 (15.3%) |
Occupancy by Age of Householder in Pleasant Hill
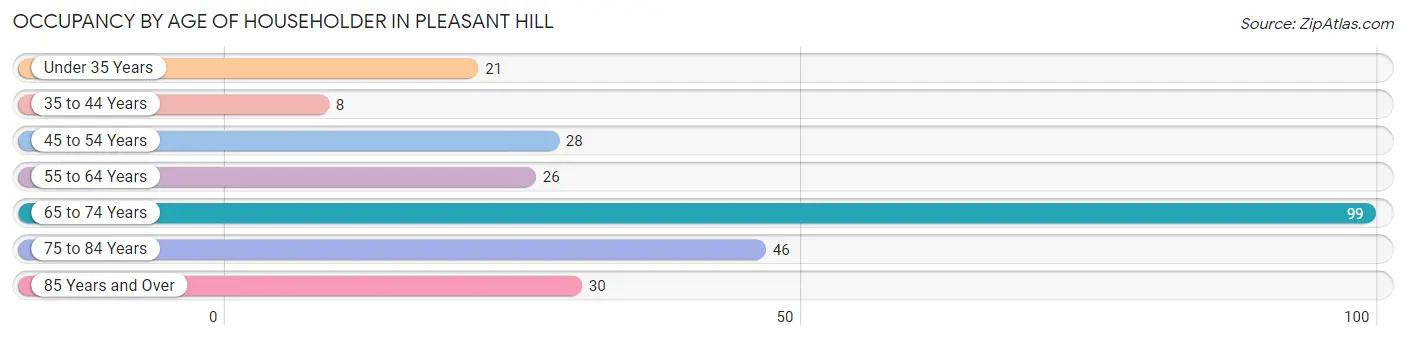
| Age Bracket | # Households | % Households |
| Under 35 Years | 21 | 8.1% |
| 35 to 44 Years | 8 | 3.1% |
| 45 to 54 Years | 28 | 10.8% |
| 55 to 64 Years | 26 | 10.1% |
| 65 to 74 Years | 99 | 38.4% |
| 75 to 84 Years | 46 | 17.8% |
| 85 Years and Over | 30 | 11.6% |
| Total | 258 | 100.0% |
Housing Finances in Pleasant Hill
Median Income by Occupancy in Pleasant Hill
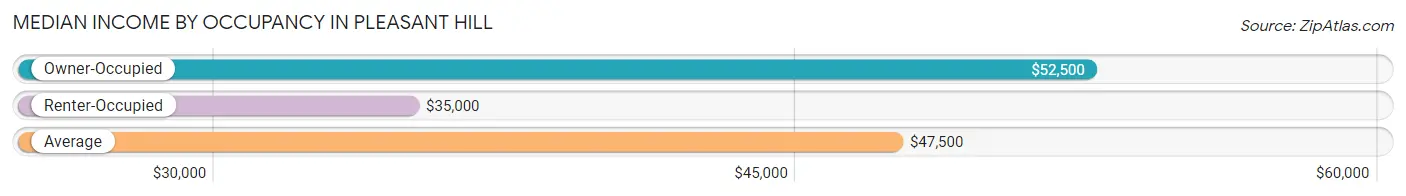
| Occupancy Type | # Households | Median Income |
| Owner-Occupied | 210 (81.4%) | $52,500 |
| Renter-Occupied | 48 (18.6%) | $35,000 |
| Average | 258 (100.0%) | $47,500 |
Occupancy by Householder Income Bracket in Pleasant Hill
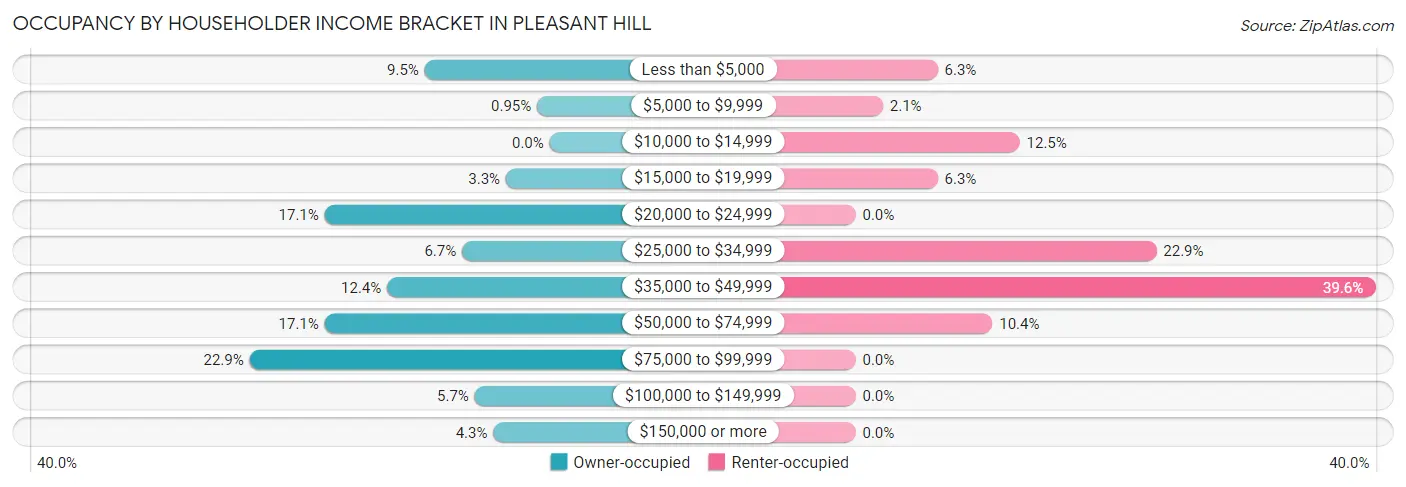
| Income Bracket | Owner-occupied | Renter-occupied |
| Less than $5,000 | 20 (9.5%) | 3 (6.2%) |
| $5,000 to $9,999 | 2 (0.9%) | 1 (2.1%) |
| $10,000 to $14,999 | 0 (0.0%) | 6 (12.5%) |
| $15,000 to $19,999 | 7 (3.3%) | 3 (6.2%) |
| $20,000 to $24,999 | 36 (17.1%) | 0 (0.0%) |
| $25,000 to $34,999 | 14 (6.7%) | 11 (22.9%) |
| $35,000 to $49,999 | 26 (12.4%) | 19 (39.6%) |
| $50,000 to $74,999 | 36 (17.1%) | 5 (10.4%) |
| $75,000 to $99,999 | 48 (22.9%) | 0 (0.0%) |
| $100,000 to $149,999 | 12 (5.7%) | 0 (0.0%) |
| $150,000 or more | 9 (4.3%) | 0 (0.0%) |
| Total | 210 (100.0%) | 48 (100.0%) |
Monthly Housing Cost Tiers in Pleasant Hill
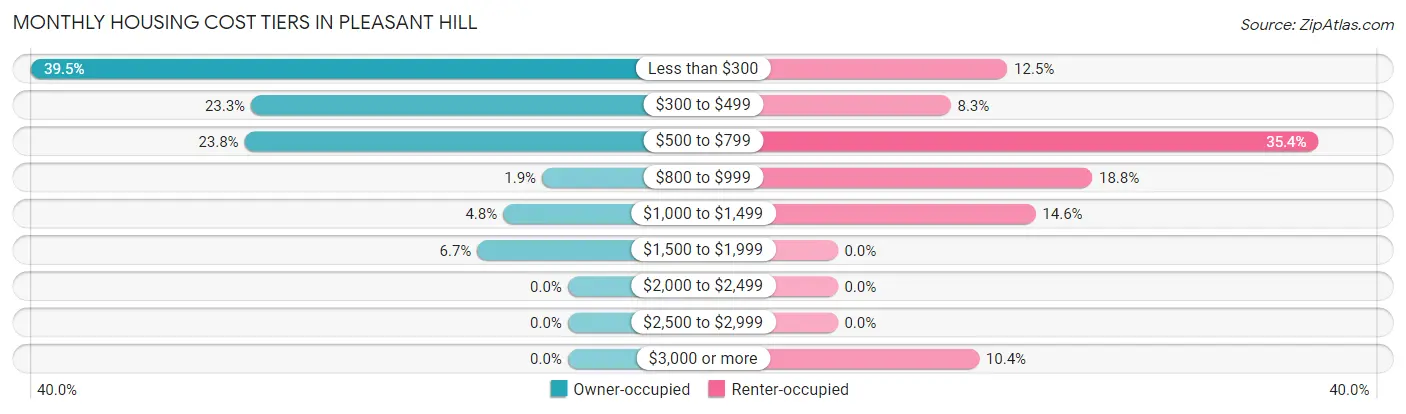
| Monthly Cost | Owner-occupied | Renter-occupied |
| Less than $300 | 83 (39.5%) | 6 (12.5%) |
| $300 to $499 | 49 (23.3%) | 4 (8.3%) |
| $500 to $799 | 50 (23.8%) | 17 (35.4%) |
| $800 to $999 | 4 (1.9%) | 9 (18.8%) |
| $1,000 to $1,499 | 10 (4.8%) | 7 (14.6%) |
| $1,500 to $1,999 | 14 (6.7%) | 0 (0.0%) |
| $2,000 to $2,499 | 0 (0.0%) | 0 (0.0%) |
| $2,500 to $2,999 | 0 (0.0%) | 0 (0.0%) |
| $3,000 or more | 0 (0.0%) | 5 (10.4%) |
| Total | 210 (100.0%) | 48 (100.0%) |
Physical Housing Characteristics in Pleasant Hill
Housing Structures in Pleasant Hill
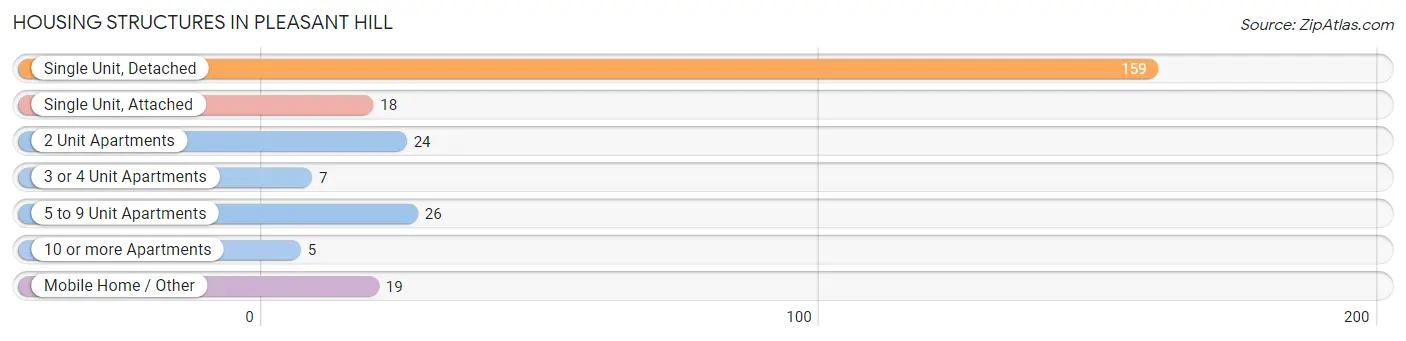
| Structure Type | # Housing Units | % Housing Units |
| Single Unit, Detached | 159 | 61.6% |
| Single Unit, Attached | 18 | 7.0% |
| 2 Unit Apartments | 24 | 9.3% |
| 3 or 4 Unit Apartments | 7 | 2.7% |
| 5 to 9 Unit Apartments | 26 | 10.1% |
| 10 or more Apartments | 5 | 1.9% |
| Mobile Home / Other | 19 | 7.4% |
| Total | 258 | 100.0% |
Housing Structures by Occupancy in Pleasant Hill
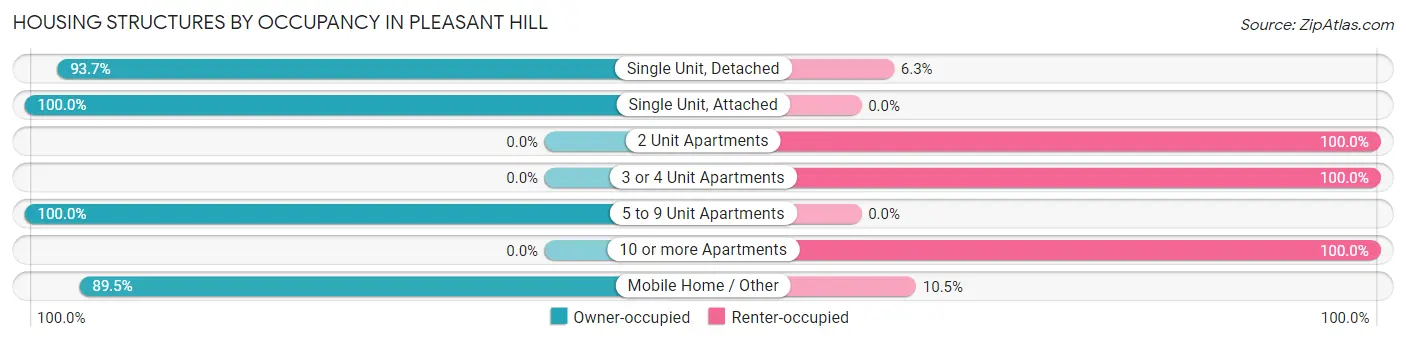
| Structure Type | Owner-occupied | Renter-occupied |
| Single Unit, Detached | 149 (93.7%) | 10 (6.3%) |
| Single Unit, Attached | 18 (100.0%) | 0 (0.0%) |
| 2 Unit Apartments | 0 (0.0%) | 24 (100.0%) |
| 3 or 4 Unit Apartments | 0 (0.0%) | 7 (100.0%) |
| 5 to 9 Unit Apartments | 26 (100.0%) | 0 (0.0%) |
| 10 or more Apartments | 0 (0.0%) | 5 (100.0%) |
| Mobile Home / Other | 17 (89.5%) | 2 (10.5%) |
| Total | 210 (81.4%) | 48 (18.6%) |
Housing Structures by Number of Rooms in Pleasant Hill
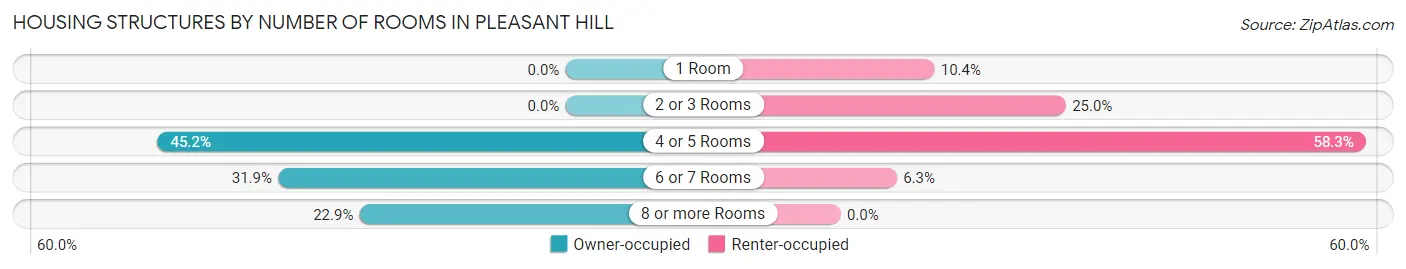
| Number of Rooms | Owner-occupied | Renter-occupied |
| 1 Room | 0 (0.0%) | 5 (10.4%) |
| 2 or 3 Rooms | 0 (0.0%) | 12 (25.0%) |
| 4 or 5 Rooms | 95 (45.2%) | 28 (58.3%) |
| 6 or 7 Rooms | 67 (31.9%) | 3 (6.2%) |
| 8 or more Rooms | 48 (22.9%) | 0 (0.0%) |
| Total | 210 (100.0%) | 48 (100.0%) |
Housing Structure by Heating Type in Pleasant Hill
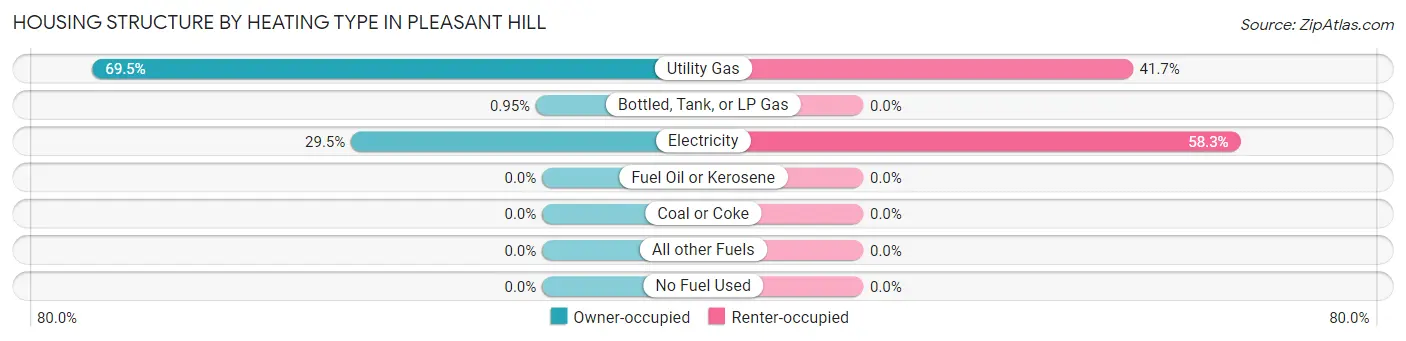
| Heating Type | Owner-occupied | Renter-occupied |
| Utility Gas | 146 (69.5%) | 20 (41.7%) |
| Bottled, Tank, or LP Gas | 2 (0.9%) | 0 (0.0%) |
| Electricity | 62 (29.5%) | 28 (58.3%) |
| Fuel Oil or Kerosene | 0 (0.0%) | 0 (0.0%) |
| Coal or Coke | 0 (0.0%) | 0 (0.0%) |
| All other Fuels | 0 (0.0%) | 0 (0.0%) |
| No Fuel Used | 0 (0.0%) | 0 (0.0%) |
| Total | 210 (100.0%) | 48 (100.0%) |
Household Vehicle Usage in Pleasant Hill
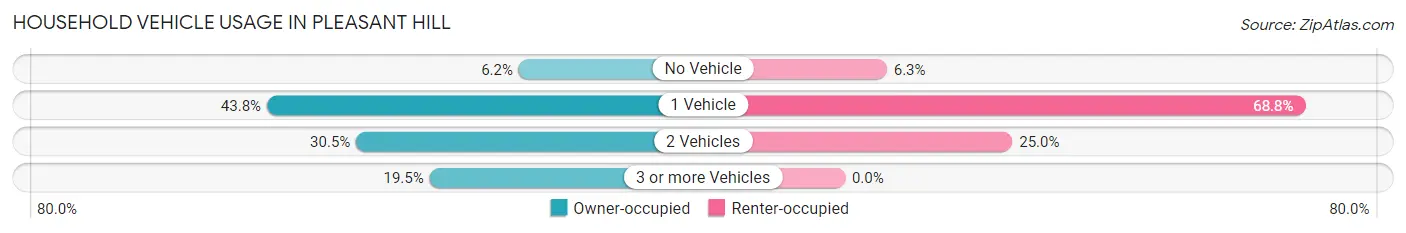
| Vehicles per Household | Owner-occupied | Renter-occupied |
| No Vehicle | 13 (6.2%) | 3 (6.2%) |
| 1 Vehicle | 92 (43.8%) | 33 (68.8%) |
| 2 Vehicles | 64 (30.5%) | 12 (25.0%) |
| 3 or more Vehicles | 41 (19.5%) | 0 (0.0%) |
| Total | 210 (100.0%) | 48 (100.0%) |
Real Estate & Mortgages in Pleasant Hill
Real Estate and Mortgage Overview in Pleasant Hill
| Characteristic | Without Mortgage | With Mortgage |
| Housing Units | 162 | 48 |
| Median Property Value | $150,000 | $146,900 |
| Median Household Income | $46,250 | $2 |
| Monthly Housing Costs | $299 | $0 |
| Real Estate Taxes | $524 | $12 |
Property Value by Mortgage Status in Pleasant Hill
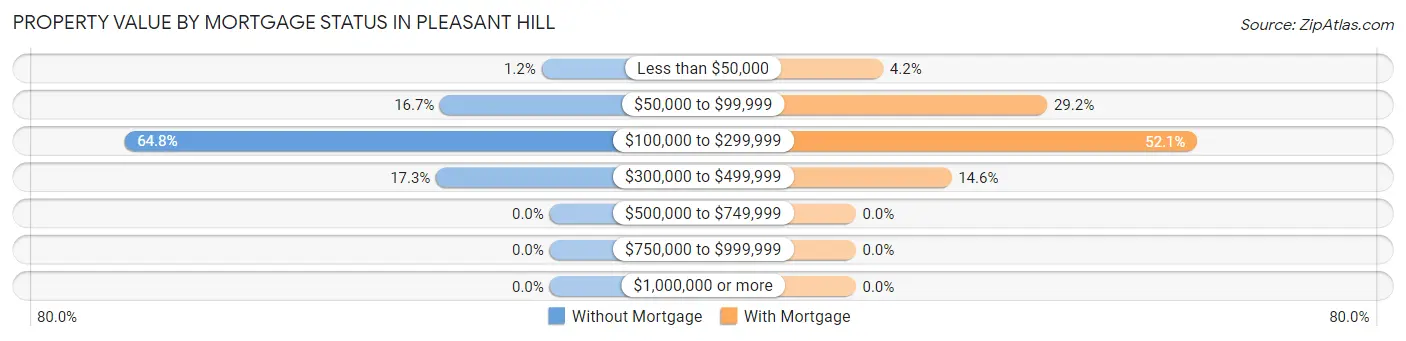
| Property Value | Without Mortgage | With Mortgage |
| Less than $50,000 | 2 (1.2%) | 2 (4.2%) |
| $50,000 to $99,999 | 27 (16.7%) | 14 (29.2%) |
| $100,000 to $299,999 | 105 (64.8%) | 25 (52.1%) |
| $300,000 to $499,999 | 28 (17.3%) | 7 (14.6%) |
| $500,000 to $749,999 | 0 (0.0%) | 0 (0.0%) |
| $750,000 to $999,999 | 0 (0.0%) | 0 (0.0%) |
| $1,000,000 or more | 0 (0.0%) | 0 (0.0%) |
| Total | 162 (100.0%) | 48 (100.0%) |
Household Income by Mortgage Status in Pleasant Hill
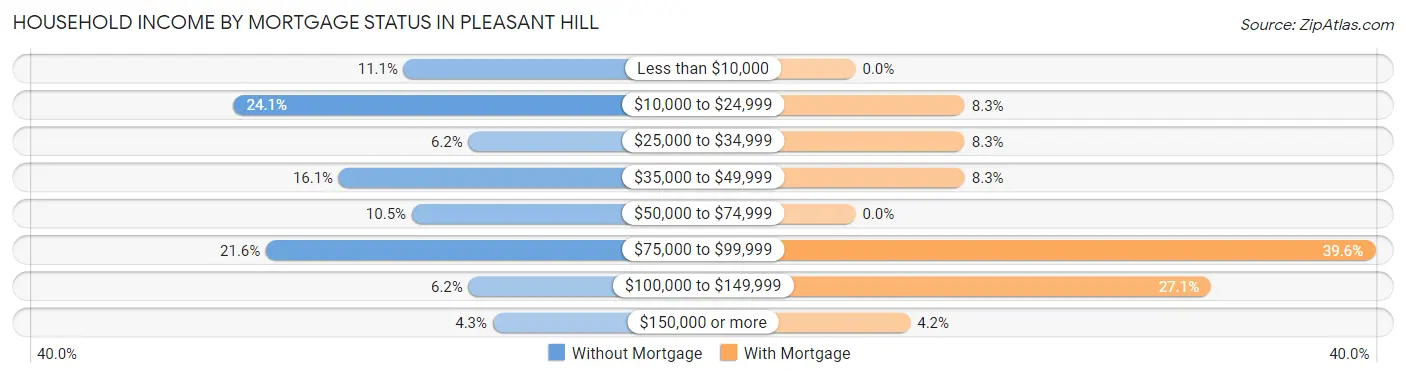
| Household Income | Without Mortgage | With Mortgage |
| Less than $10,000 | 18 (11.1%) | 0 (0.0%) |
| $10,000 to $24,999 | 39 (24.1%) | 4 (8.3%) |
| $25,000 to $34,999 | 10 (6.2%) | 4 (8.3%) |
| $35,000 to $49,999 | 26 (16.1%) | 4 (8.3%) |
| $50,000 to $74,999 | 17 (10.5%) | 0 (0.0%) |
| $75,000 to $99,999 | 35 (21.6%) | 19 (39.6%) |
| $100,000 to $149,999 | 10 (6.2%) | 13 (27.1%) |
| $150,000 or more | 7 (4.3%) | 2 (4.2%) |
| Total | 162 (100.0%) | 48 (100.0%) |
Property Value to Household Income Ratio in Pleasant Hill
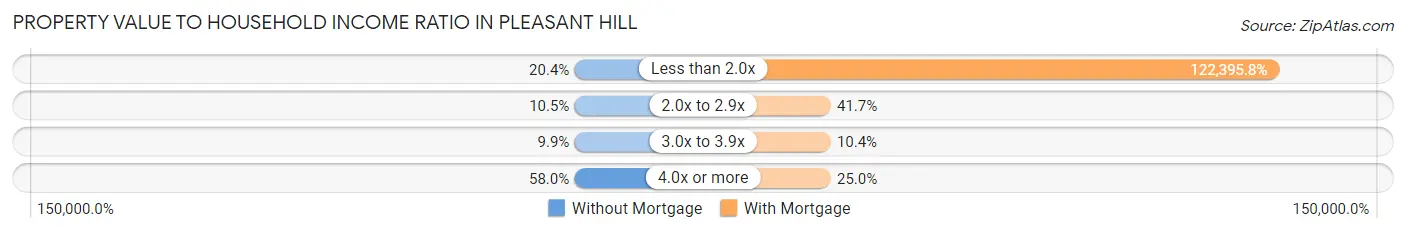
| Value-to-Income Ratio | Without Mortgage | With Mortgage |
| Less than 2.0x | 33 (20.4%) | 58,750 (122,395.8%) |
| 2.0x to 2.9x | 17 (10.5%) | 20 (41.7%) |
| 3.0x to 3.9x | 16 (9.9%) | 5 (10.4%) |
| 4.0x or more | 94 (58.0%) | 12 (25.0%) |
| Total | 162 (100.0%) | 48 (100.0%) |
Real Estate Taxes by Mortgage Status in Pleasant Hill
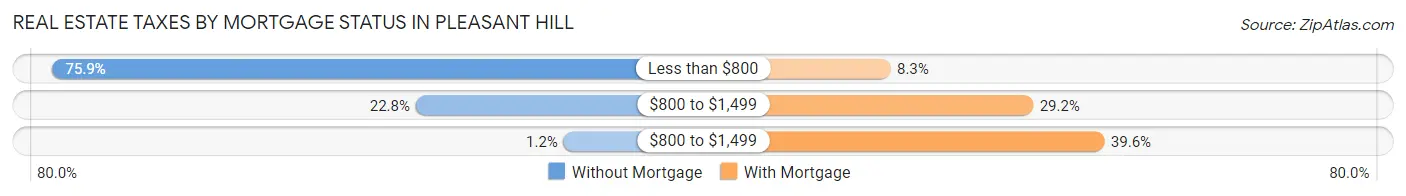
| Property Taxes | Without Mortgage | With Mortgage |
| Less than $800 | 123 (75.9%) | 4 (8.3%) |
| $800 to $1,499 | 37 (22.8%) | 14 (29.2%) |
| $800 to $1,499 | 2 (1.2%) | 19 (39.6%) |
| Total | 162 (100.0%) | 48 (100.0%) |
Health & Disability in Pleasant Hill
Health Insurance Coverage by Age in Pleasant Hill
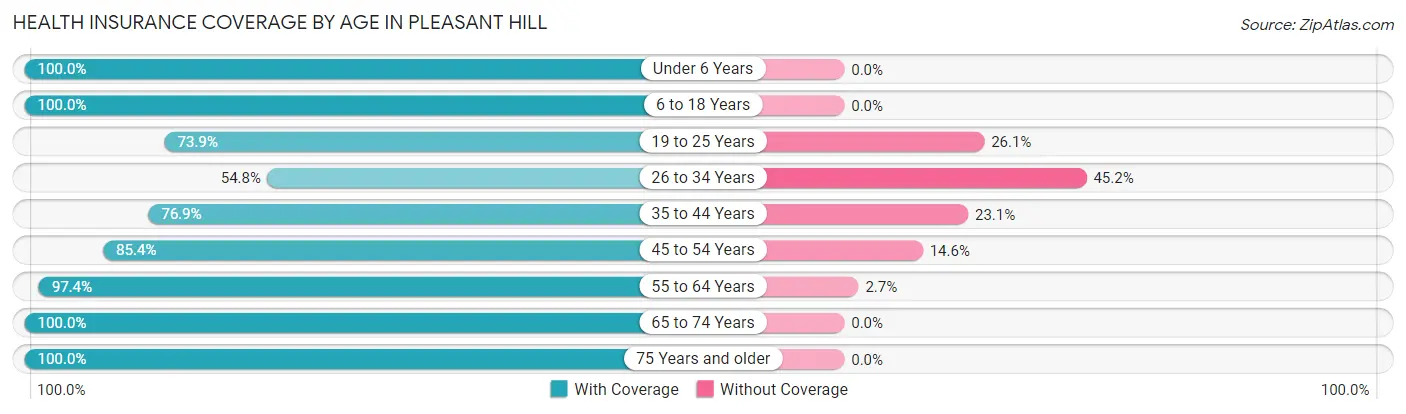
| Age Bracket | With Coverage | Without Coverage |
| Under 6 Years | 11 (100.0%) | 0 (0.0%) |
| 6 to 18 Years | 33 (100.0%) | 0 (0.0%) |
| 19 to 25 Years | 34 (73.9%) | 12 (26.1%) |
| 26 to 34 Years | 17 (54.8%) | 14 (45.2%) |
| 35 to 44 Years | 10 (76.9%) | 3 (23.1%) |
| 45 to 54 Years | 35 (85.4%) | 6 (14.6%) |
| 55 to 64 Years | 110 (97.4%) | 3 (2.6%) |
| 65 to 74 Years | 131 (100.0%) | 0 (0.0%) |
| 75 Years and older | 109 (100.0%) | 0 (0.0%) |
| Total | 490 (92.8%) | 38 (7.2%) |
Health Insurance Coverage by Citizenship Status in Pleasant Hill
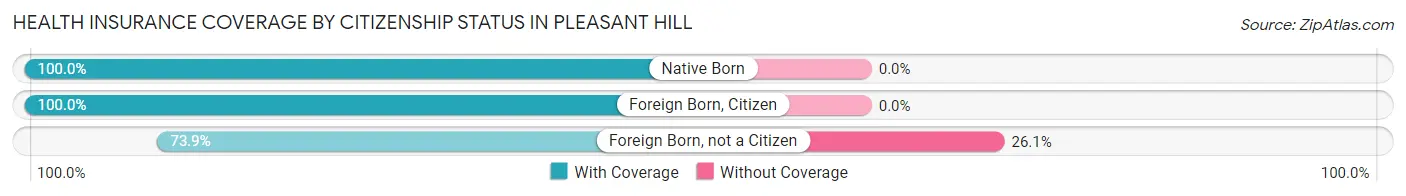
| Citizenship Status | With Coverage | Without Coverage |
| Native Born | 11 (100.0%) | 0 (0.0%) |
| Foreign Born, Citizen | 33 (100.0%) | 0 (0.0%) |
| Foreign Born, not a Citizen | 34 (73.9%) | 12 (26.1%) |
Health Insurance Coverage by Household Income in Pleasant Hill
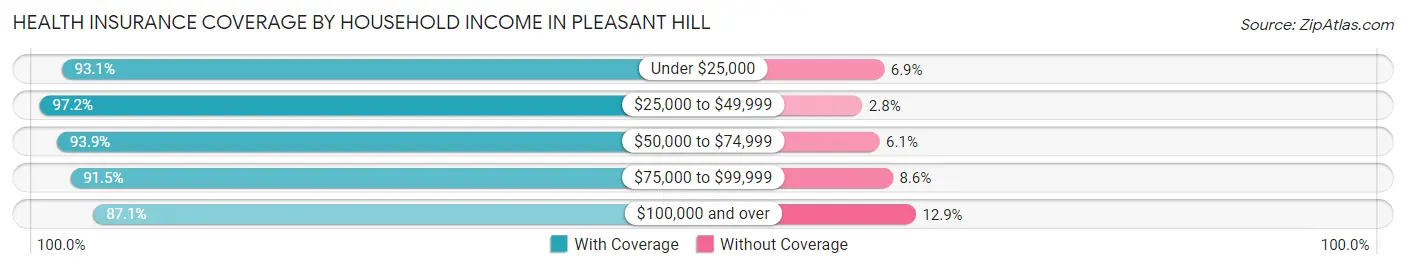
| Household Income | With Coverage | Without Coverage |
| Under $25,000 | 94 (93.1%) | 7 (6.9%) |
| $25,000 to $49,999 | 103 (97.2%) | 3 (2.8%) |
| $50,000 to $74,999 | 93 (93.9%) | 6 (6.1%) |
| $75,000 to $99,999 | 139 (91.4%) | 13 (8.6%) |
| $100,000 and over | 61 (87.1%) | 9 (12.9%) |
Public vs Private Health Insurance Coverage by Age in Pleasant Hill
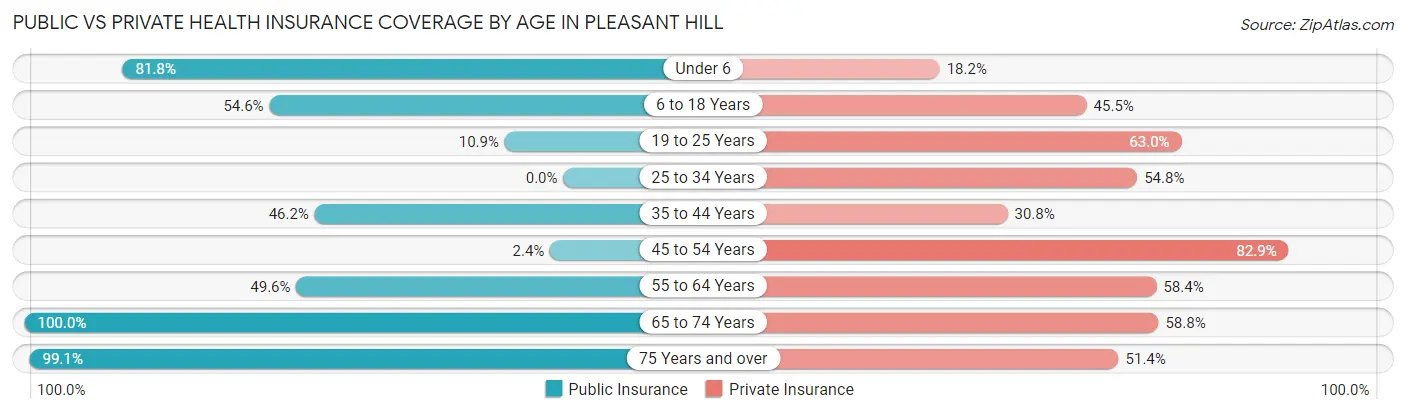
| Age Bracket | Public Insurance | Private Insurance |
| Under 6 | 9 (81.8%) | 2 (18.2%) |
| 6 to 18 Years | 18 (54.5%) | 15 (45.5%) |
| 19 to 25 Years | 5 (10.9%) | 29 (63.0%) |
| 25 to 34 Years | 0 (0.0%) | 17 (54.8%) |
| 35 to 44 Years | 6 (46.2%) | 4 (30.8%) |
| 45 to 54 Years | 1 (2.4%) | 34 (82.9%) |
| 55 to 64 Years | 56 (49.6%) | 66 (58.4%) |
| 65 to 74 Years | 131 (100.0%) | 77 (58.8%) |
| 75 Years and over | 108 (99.1%) | 56 (51.4%) |
| Total | 334 (63.3%) | 300 (56.8%) |
Disability Status by Sex by Age in Pleasant Hill
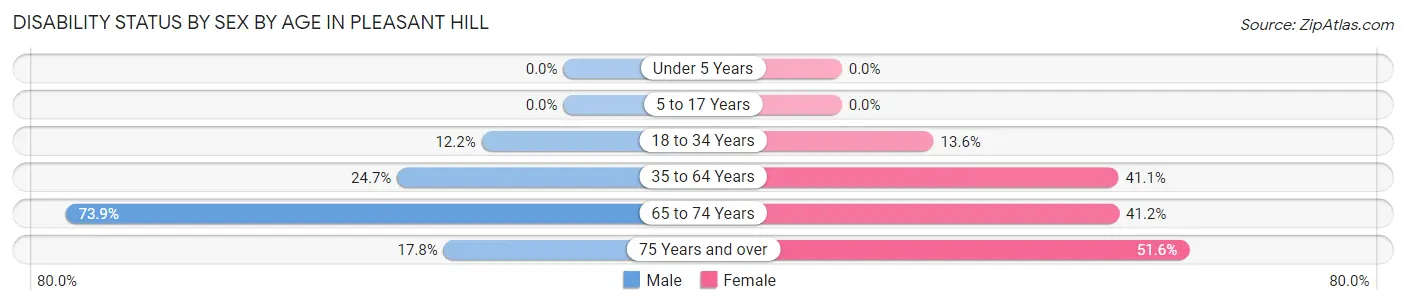
| Age Bracket | Male | Female |
| Under 5 Years | 0 (0.0%) | 0 (0.0%) |
| 5 to 17 Years | 0 (0.0%) | 0 (0.0%) |
| 18 to 34 Years | 9 (12.2%) | 3 (13.6%) |
| 35 to 64 Years | 19 (24.7%) | 37 (41.1%) |
| 65 to 74 Years | 34 (73.9%) | 35 (41.2%) |
| 75 Years and over | 8 (17.8%) | 33 (51.6%) |
Disability Class by Sex by Age in Pleasant Hill
Disability Class: Hearing Difficulty
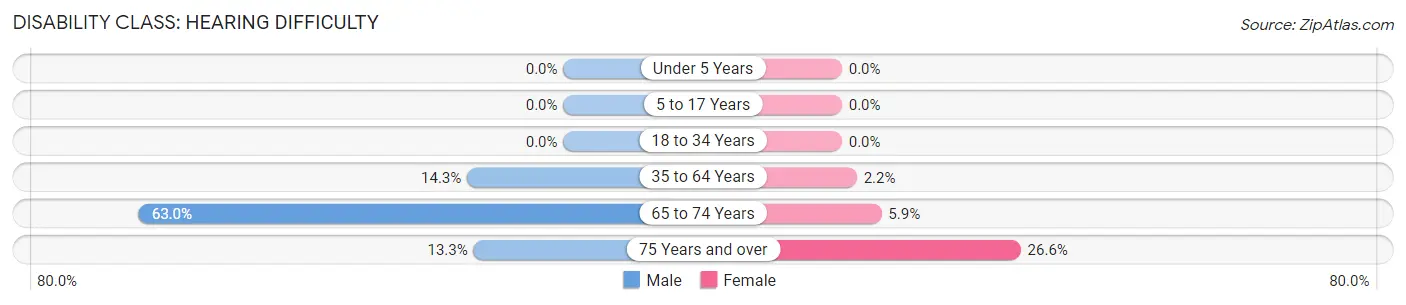
| Age Bracket | Male | Female |
| Under 5 Years | 0 (0.0%) | 0 (0.0%) |
| 5 to 17 Years | 0 (0.0%) | 0 (0.0%) |
| 18 to 34 Years | 0 (0.0%) | 0 (0.0%) |
| 35 to 64 Years | 11 (14.3%) | 2 (2.2%) |
| 65 to 74 Years | 29 (63.0%) | 5 (5.9%) |
| 75 Years and over | 6 (13.3%) | 17 (26.6%) |
Disability Class: Vision Difficulty
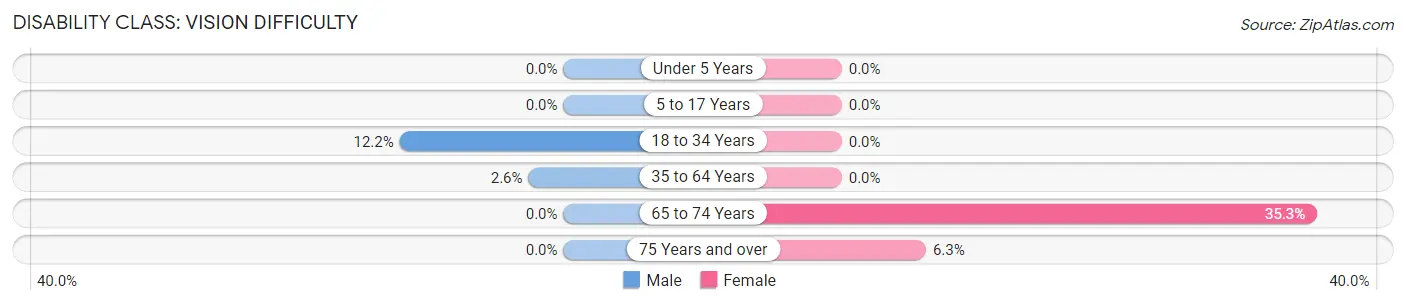
| Age Bracket | Male | Female |
| Under 5 Years | 0 (0.0%) | 0 (0.0%) |
| 5 to 17 Years | 0 (0.0%) | 0 (0.0%) |
| 18 to 34 Years | 9 (12.2%) | 0 (0.0%) |
| 35 to 64 Years | 2 (2.6%) | 0 (0.0%) |
| 65 to 74 Years | 0 (0.0%) | 30 (35.3%) |
| 75 Years and over | 0 (0.0%) | 4 (6.2%) |
Disability Class: Cognitive Difficulty
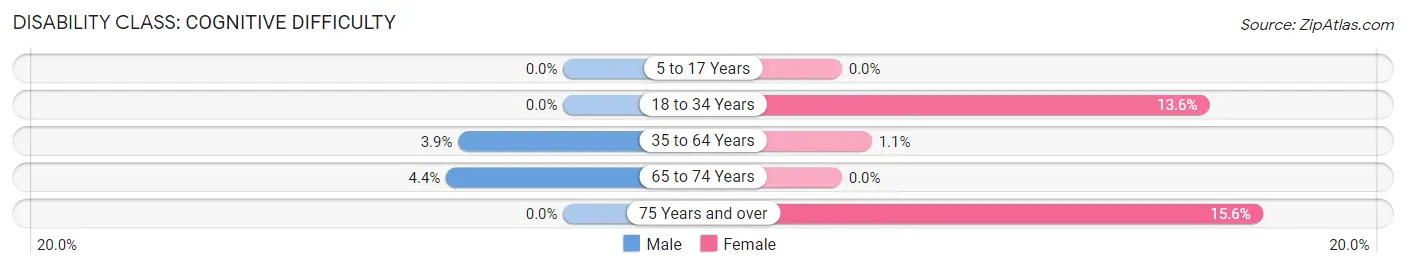
| Age Bracket | Male | Female |
| 5 to 17 Years | 0 (0.0%) | 0 (0.0%) |
| 18 to 34 Years | 0 (0.0%) | 3 (13.6%) |
| 35 to 64 Years | 3 (3.9%) | 1 (1.1%) |
| 65 to 74 Years | 2 (4.3%) | 0 (0.0%) |
| 75 Years and over | 0 (0.0%) | 10 (15.6%) |
Disability Class: Ambulatory Difficulty
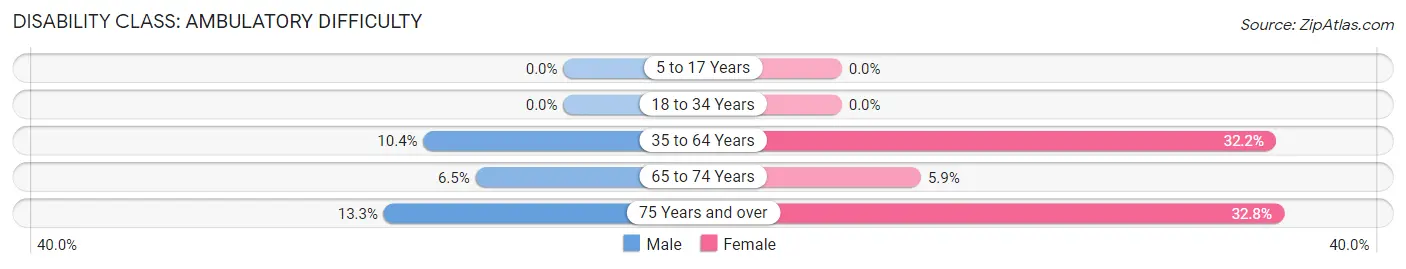
| Age Bracket | Male | Female |
| 5 to 17 Years | 0 (0.0%) | 0 (0.0%) |
| 18 to 34 Years | 0 (0.0%) | 0 (0.0%) |
| 35 to 64 Years | 8 (10.4%) | 29 (32.2%) |
| 65 to 74 Years | 3 (6.5%) | 5 (5.9%) |
| 75 Years and over | 6 (13.3%) | 21 (32.8%) |
Disability Class: Self-Care Difficulty
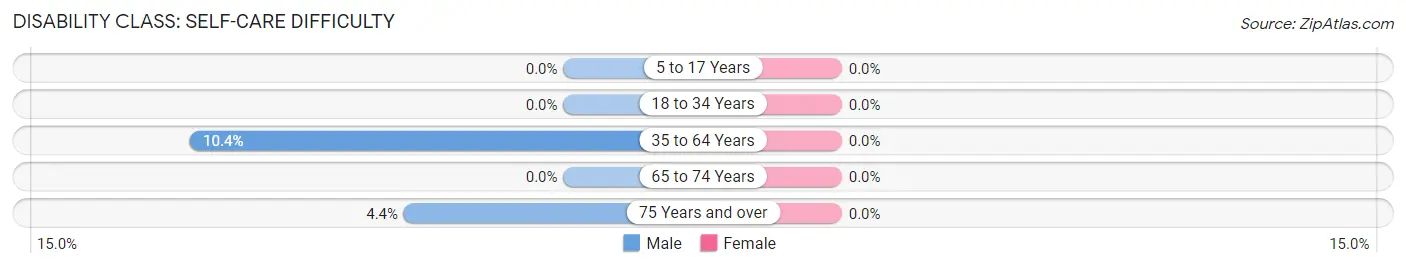
| Age Bracket | Male | Female |
| 5 to 17 Years | 0 (0.0%) | 0 (0.0%) |
| 18 to 34 Years | 0 (0.0%) | 0 (0.0%) |
| 35 to 64 Years | 8 (10.4%) | 0 (0.0%) |
| 65 to 74 Years | 0 (0.0%) | 0 (0.0%) |
| 75 Years and over | 2 (4.4%) | 0 (0.0%) |
Technology Access in Pleasant Hill
Computing Device Access in Pleasant Hill
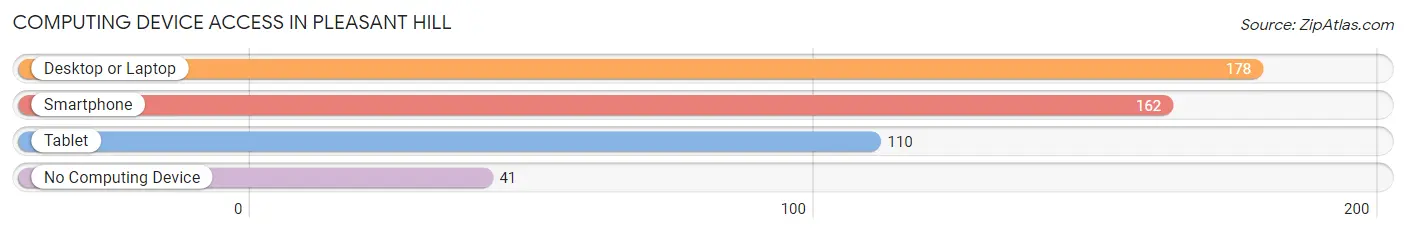
| Device Type | # Households | % Households |
| Desktop or Laptop | 178 | 69.0% |
| Smartphone | 162 | 62.8% |
| Tablet | 110 | 42.6% |
| No Computing Device | 41 | 15.9% |
| Total | 258 | 100.0% |
Internet Access in Pleasant Hill
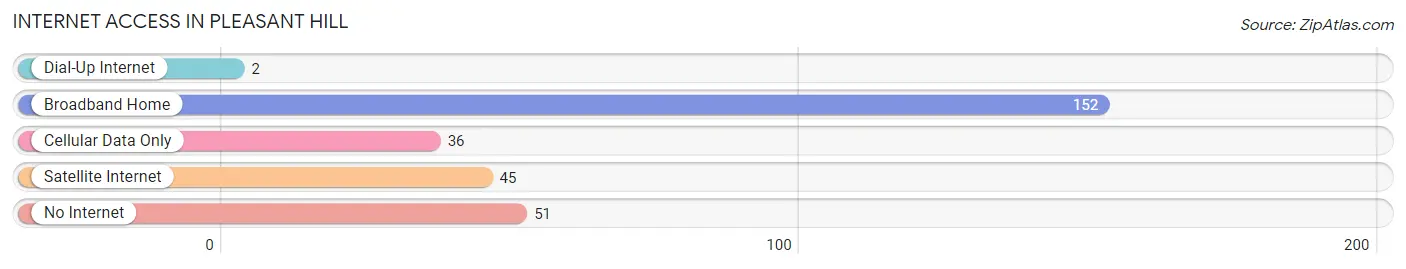
| Internet Type | # Households | % Households |
| Dial-Up Internet | 2 | 0.8% |
| Broadband Home | 152 | 58.9% |
| Cellular Data Only | 36 | 14.0% |
| Satellite Internet | 45 | 17.4% |
| No Internet | 51 | 19.8% |
| Total | 258 | 100.0% |
Pleasant Hill Summary
Pleasant Hill is a small town located in the state of Tennessee, in the United States. It is situated in the southeastern part of the state, in the foothills of the Appalachian Mountains. The town is located in Marion County, and is part of the Chattanooga metropolitan area. The population of Pleasant Hill was estimated to be 1,845 in 2019.
History
Pleasant Hill was first settled in the early 1800s by settlers from North Carolina. The town was originally known as “Pleasant Hill Settlement” and was located in the area of present-day Whitwell. The town was officially incorporated in 1845 and was named after the nearby Pleasant Hill Church.
The town was a small farming community until the late 19th century, when the railroad was built through the area. This allowed for the development of the coal mining industry in the area, which provided jobs and economic growth for the town. The coal mining industry was the main source of employment for the town until the mid-20th century, when the industry began to decline.
Geography
Pleasant Hill is located in the southeastern part of Tennessee, in the foothills of the Appalachian Mountains. The town is situated in Marion County, and is part of the Chattanooga metropolitan area. The town is located at an elevation of 1,068 feet (326 m) above sea level.
The town is located near the Sequatchie River, which flows through the area. The town is also located near the Chickamauga Lake, which is a popular recreational area. The town is located about 25 miles (40 km) from Chattanooga, and about 75 miles (120 km) from Nashville.
Economy
The economy of Pleasant Hill is largely based on agriculture and tourism. The town is home to several farms, which produce a variety of crops, including corn, soybeans, and hay. The town is also home to several wineries, which produce a variety of wines.
The town is also a popular tourist destination, due to its proximity to the Chickamauga Lake and the Appalachian Mountains. The town is home to several campgrounds, which attract visitors from all over the country. The town is also home to several restaurants, which serve a variety of local and regional cuisine.
Demographics
As of the 2019 census, the population of Pleasant Hill was estimated to be 1,845. The town has a population density of 545 people per square mile (210/km2). The median age of the population is 44.7 years, and the median household income is $41,944.
The racial makeup of the town is 97.3% White, 0.7% African American, 0.3% Native American, 0.2% Asian, 0.1% Pacific Islander, 0.2% from other races, and 1.3% from two or more races. The town has a large Hispanic population, with 8.3% of the population being of Hispanic or Latino origin.
Conclusion
Pleasant Hill is a small town located in the southeastern part of Tennessee, in the foothills of the Appalachian Mountains. The town has a long history, dating back to the early 1800s, and has a strong agricultural and tourism-based economy. The population of the town is estimated to be 1,845, with a median age of 44.7 years and a median household income of $41,944. The town has a diverse racial makeup, with 97.3% of the population being White, 0.7% African American, 0.3% Native American, 0.2% Asian, 0.1% Pacific Islander, 0.2% from other races, and 1.3% from two or more races. The town is a popular tourist destination, due to its proximity to the Chickamauga Lake and the Appalachian Mountains.
Common Questions
What is Per Capita Income in Pleasant Hill?
Per Capita income in Pleasant Hill is $24,894.
What is the Median Family Income in Pleasant Hill?
Median Family Income in Pleasant Hill is $48,750.
What is the Median Household income in Pleasant Hill?
Median Household Income in Pleasant Hill is $47,500.
What is Inequality or Gini Index in Pleasant Hill?
Inequality or Gini Index in Pleasant Hill is 0.41.
What is the Total Population of Pleasant Hill?
Total Population of Pleasant Hill is 589.
What is the Total Male Population of Pleasant Hill?
Total Male Population of Pleasant Hill is 281.
What is the Total Female Population of Pleasant Hill?
Total Female Population of Pleasant Hill is 308.
What is the Ratio of Males per 100 Females in Pleasant Hill?
There are 91.23 Males per 100 Females in Pleasant Hill.
What is the Ratio of Females per 100 Males in Pleasant Hill?
There are 109.61 Females per 100 Males in Pleasant Hill.
What is the Median Population Age in Pleasant Hill?
Median Population Age in Pleasant Hill is 64.7 Years.
What is the Average Family Size in Pleasant Hill
Average Family Size in Pleasant Hill is 2.3 People.
What is the Average Household Size in Pleasant Hill
Average Household Size in Pleasant Hill is 2.0 People.
How Large is the Labor Force in Pleasant Hill?
There are 217 People in the Labor Forcein in Pleasant Hill.
What is the Percentage of People in the Labor Force in Pleasant Hill?
38.3% of People are in the Labor Force in Pleasant Hill.
What is the Unemployment Rate in Pleasant Hill?
Unemployment Rate in Pleasant Hill is 12.4%.