Zip Codes with the Highest Percentage of Population Employed in Security & Protection in Cleveland, TN
RELATED REPORTS & OPTIONS
Security & Protection
Cleveland
Compare Zip Codes
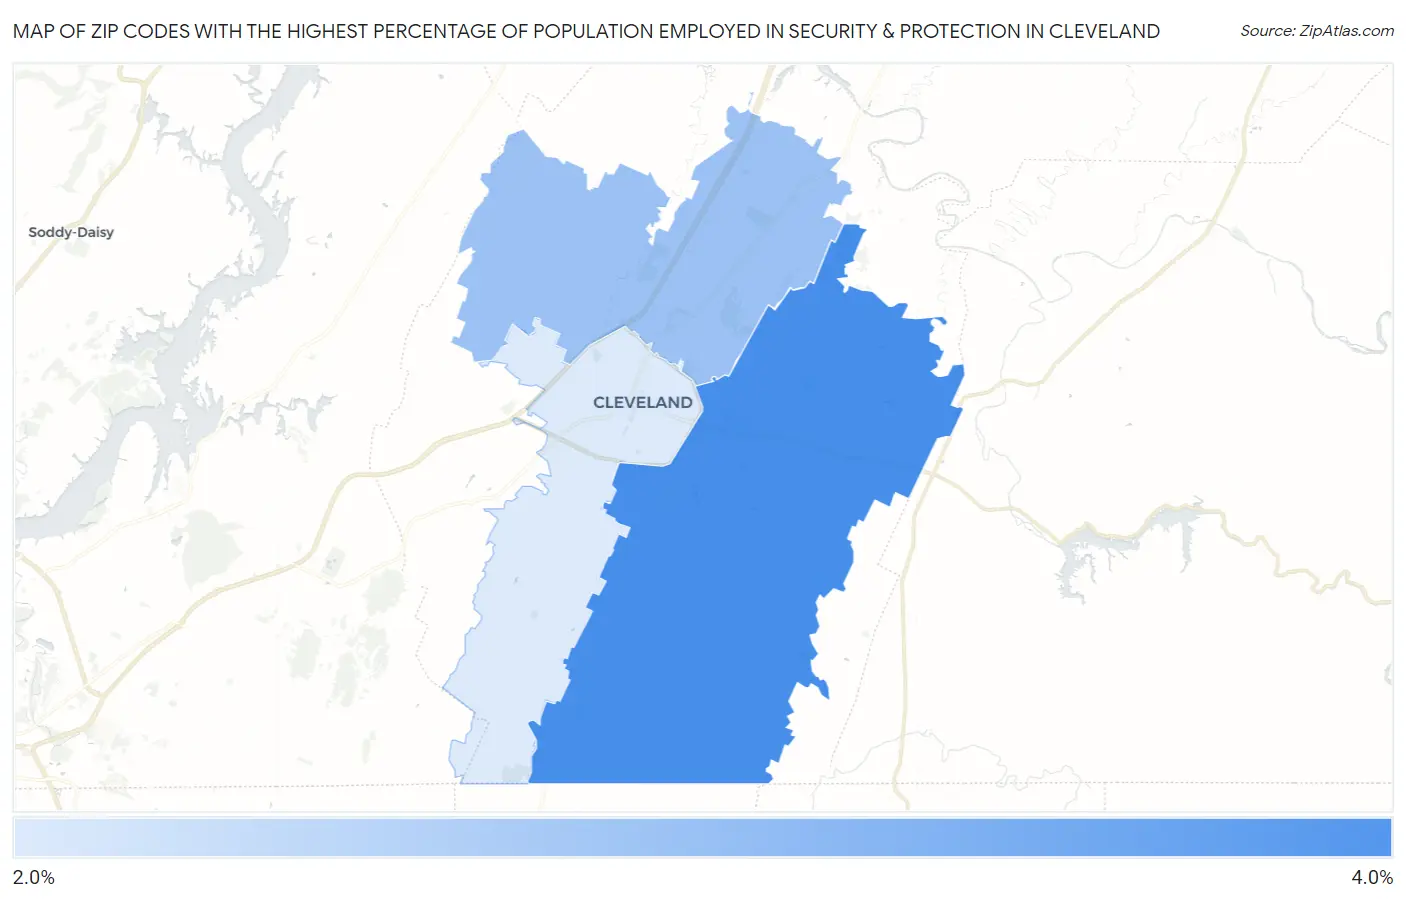
Map of Zip Codes with the Highest Percentage of Population Employed in Security & Protection in Cleveland
2.3%
3.2%
Zip Codes with the Highest Percentage of Population Employed in Security & Protection in Cleveland, TN
| Zip Code | % Employed | vs State | vs National | |
| 1. | 37323 | 3.2% | 2.1%(+1.14)#122 | 2.1%(+1.09)#6,432 |
| 2. | 37312 | 2.7% | 2.1%(+0.639)#160 | 2.1%(+0.585)#8,389 |
| 3. | 37311 | 2.3% | 2.1%(+0.247)#213 | 2.1%(+0.193)#10,383 |
1
Common Questions
What are the Top Zip Codes with the Highest Percentage of Population Employed in Security & Protection in Cleveland, TN?
Top Zip Codes with the Highest Percentage of Population Employed in Security & Protection in Cleveland, TN are:
What zip code has the Highest Percentage of Population Employed in Security & Protection in Cleveland, TN?
37323 has the Highest Percentage of Population Employed in Security & Protection in Cleveland, TN with 3.2%.
What is the Percentage of Population Employed in Security & Protection in Cleveland, TN?
Percentage of Population Employed in Security & Protection in Cleveland is 2.5%.
What is the Percentage of Population Employed in Security & Protection in Tennessee?
Percentage of Population Employed in Security & Protection in Tennessee is 2.1%.
What is the Percentage of Population Employed in Security & Protection in the United States?
Percentage of Population Employed in Security & Protection in the United States is 2.1%.