Fairmount, TN Map & Demographics
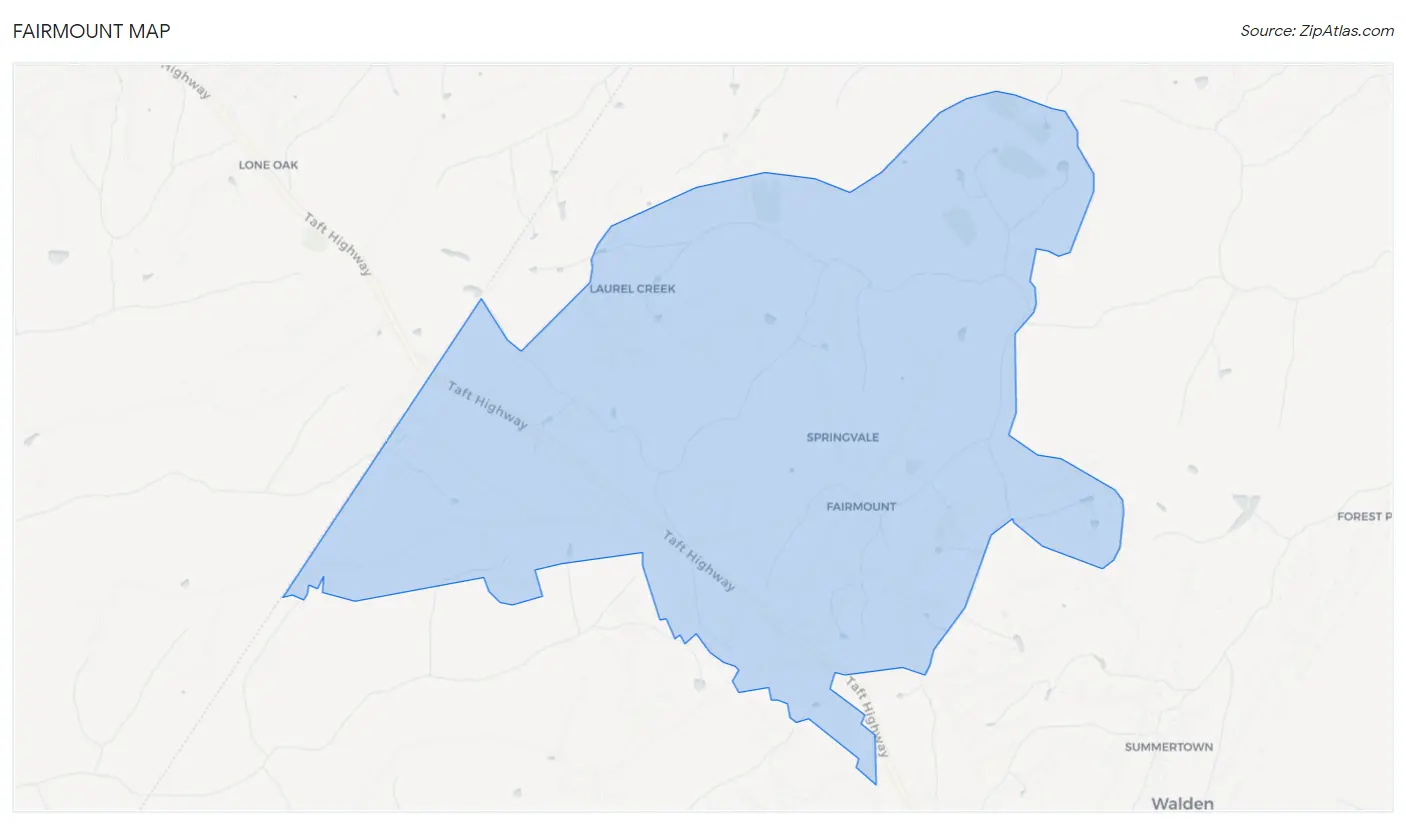
Fairmount Map
Fairmount Overview
$51,145
PER CAPITA INCOME
$116,591
AVG FAMILY INCOME
$115,227
AVG HOUSEHOLD INCOME
42.7%
WAGE / INCOME GAP [ % ]
57.3¢/ $1
WAGE / INCOME GAP [ $ ]
0.35
INEQUALITY / GINI INDEX
1,747
TOTAL POPULATION
869
MALE POPULATION
878
FEMALE POPULATION
98.97
MALES / 100 FEMALES
101.04
FEMALES / 100 MALES
43.2
MEDIAN AGE
3.2
AVG FAMILY SIZE
2.7
AVG HOUSEHOLD SIZE
732
LABOR FORCE [ PEOPLE ]
55.7%
PERCENT IN LABOR FORCE
3.3%
UNEMPLOYMENT RATE
Income in Fairmount
Income Overview in Fairmount
Per Capita Income in Fairmount is $51,145, while median incomes of families and households are $116,591 and $115,227 respectively.
| Characteristic | Number | Measure |
| Per Capita Income | 1,747 | $51,145 |
| Median Family Income | 496 | $116,591 |
| Mean Family Income | 496 | $154,555 |
| Median Household Income | 638 | $115,227 |
| Mean Household Income | 638 | $143,662 |
| Income Deficit | 496 | $0 |
| Wage / Income Gap (%) | 1,747 | 42.73% |
| Wage / Income Gap ($) | 1,747 | 57.27¢ per $1 |
| Gini / Inequality Index | 1,747 | 0.35 |
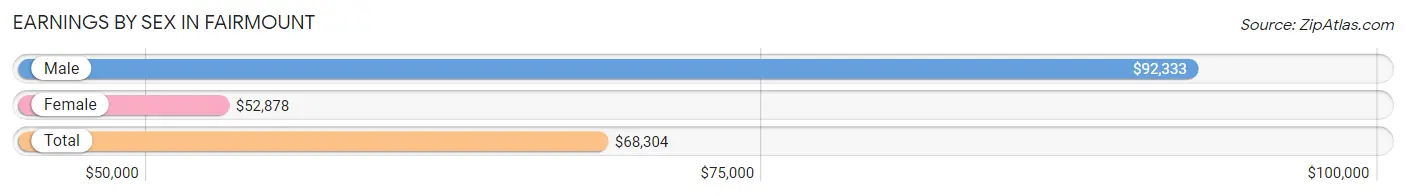
Earnings by Sex in Fairmount
Average Earnings in Fairmount are $68,304, $92,333 for men and $52,878 for women, a difference of 42.7%.
| Sex | Number | Average Earnings |
| Male | 380 (51.0%) | $92,333 |
| Female | 365 (49.0%) | $52,878 |
| Total | 745 (100.0%) | $68,304 |
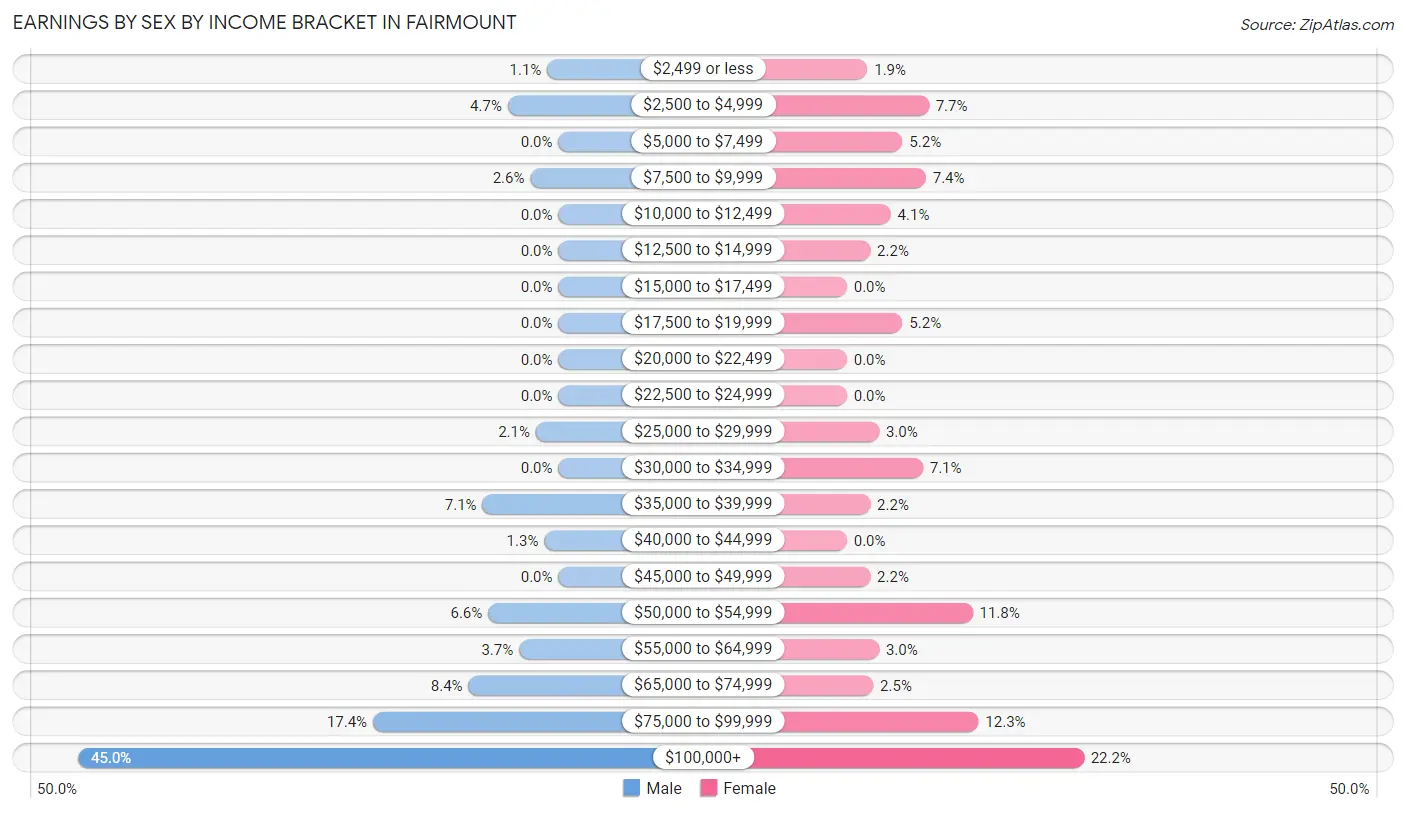
Earnings by Sex by Income Bracket in Fairmount
The most common earnings brackets in Fairmount are $100,000+ for men (171 | 45.0%) and $100,000+ for women (81 | 22.2%).
| Income | Male | Female |
| $2,499 or less | 4 (1.1%) | 7 (1.9%) |
| $2,500 to $4,999 | 18 (4.7%) | 28 (7.7%) |
| $5,000 to $7,499 | 0 (0.0%) | 19 (5.2%) |
| $7,500 to $9,999 | 10 (2.6%) | 27 (7.4%) |
| $10,000 to $12,499 | 0 (0.0%) | 15 (4.1%) |
| $12,500 to $14,999 | 0 (0.0%) | 8 (2.2%) |
| $15,000 to $17,499 | 0 (0.0%) | 0 (0.0%) |
| $17,500 to $19,999 | 0 (0.0%) | 19 (5.2%) |
| $20,000 to $22,499 | 0 (0.0%) | 0 (0.0%) |
| $22,500 to $24,999 | 0 (0.0%) | 0 (0.0%) |
| $25,000 to $29,999 | 8 (2.1%) | 11 (3.0%) |
| $30,000 to $34,999 | 0 (0.0%) | 26 (7.1%) |
| $35,000 to $39,999 | 27 (7.1%) | 8 (2.2%) |
| $40,000 to $44,999 | 5 (1.3%) | 0 (0.0%) |
| $45,000 to $49,999 | 0 (0.0%) | 8 (2.2%) |
| $50,000 to $54,999 | 25 (6.6%) | 43 (11.8%) |
| $55,000 to $64,999 | 14 (3.7%) | 11 (3.0%) |
| $65,000 to $74,999 | 32 (8.4%) | 9 (2.5%) |
| $75,000 to $99,999 | 66 (17.4%) | 45 (12.3%) |
| $100,000+ | 171 (45.0%) | 81 (22.2%) |
| Total | 380 (100.0%) | 365 (100.0%) |
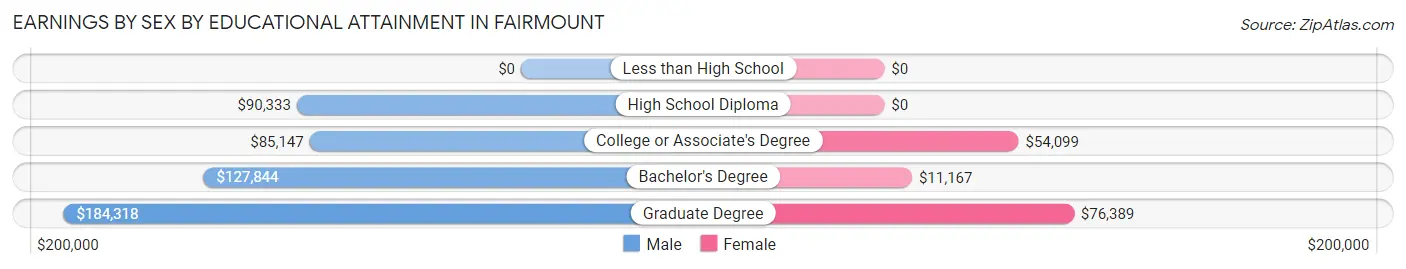
Earnings by Sex by Educational Attainment in Fairmount
Average earnings in Fairmount are $99,875 for men and $53,227 for women, a difference of 46.7%. Men with an educational attainment of graduate degree enjoy the highest average annual earnings of $184,318, while those with college or associate's degree education earn the least with $85,147. Women with an educational attainment of graduate degree earn the most with the average annual earnings of $76,389, while those with bachelor's degree education have the smallest earnings of $11,167.
| Educational Attainment | Male Income | Female Income |
| Less than High School | - | - |
| High School Diploma | $90,333 | $0 |
| College or Associate's Degree | $85,147 | $54,099 |
| Bachelor's Degree | $127,844 | $11,167 |
| Graduate Degree | $184,318 | $76,389 |
| Total | $99,875 | $53,227 |
Family Income in Fairmount
Family Income Brackets in Fairmount
According to the Fairmount family income data, there are 163 families falling into the $100,000 to $149,999 income range, which is the most common income bracket and makes up 32.9% of all families.
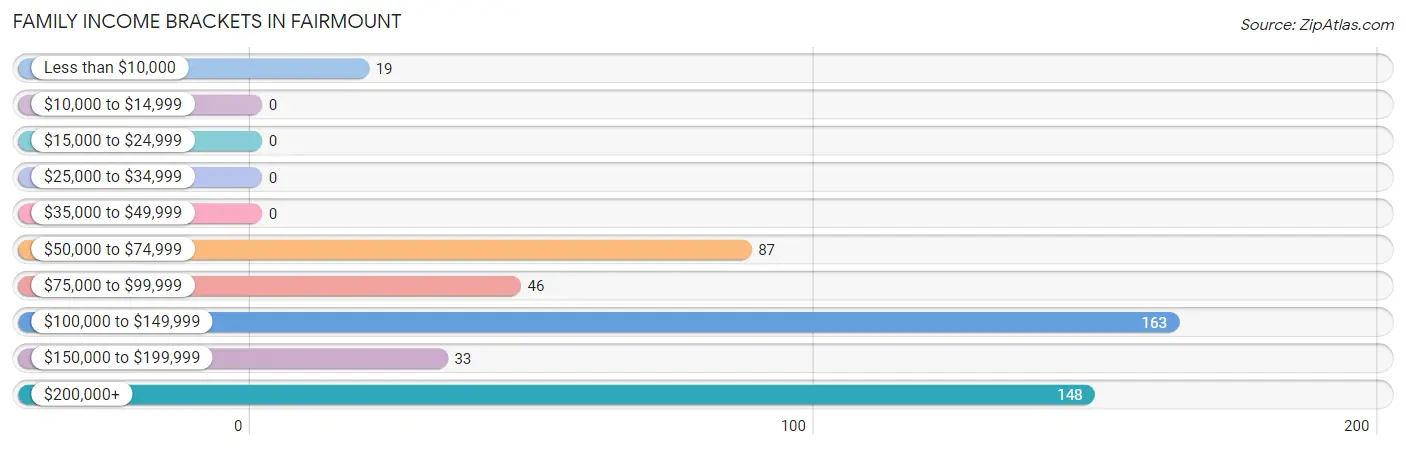
| Income Bracket | # Families | % Families |
| Less than $10,000 | 19 | 3.8% |
| $10,000 to $14,999 | 0 | 0.0% |
| $15,000 to $24,999 | 0 | 0.0% |
| $25,000 to $34,999 | 0 | 0.0% |
| $35,000 to $49,999 | 0 | 0.0% |
| $50,000 to $74,999 | 87 | 17.5% |
| $75,000 to $99,999 | 46 | 9.3% |
| $100,000 to $149,999 | 163 | 32.9% |
| $150,000 to $199,999 | 33 | 6.7% |
| $200,000+ | 148 | 29.8% |
Family Income by Famaliy Size in Fairmount
5-person families (45 | 9.1%) account for the highest median family income in Fairmount with $220,417 per family, while 2-person families (208 | 41.9%) have the highest median income of $53,875 per family member.
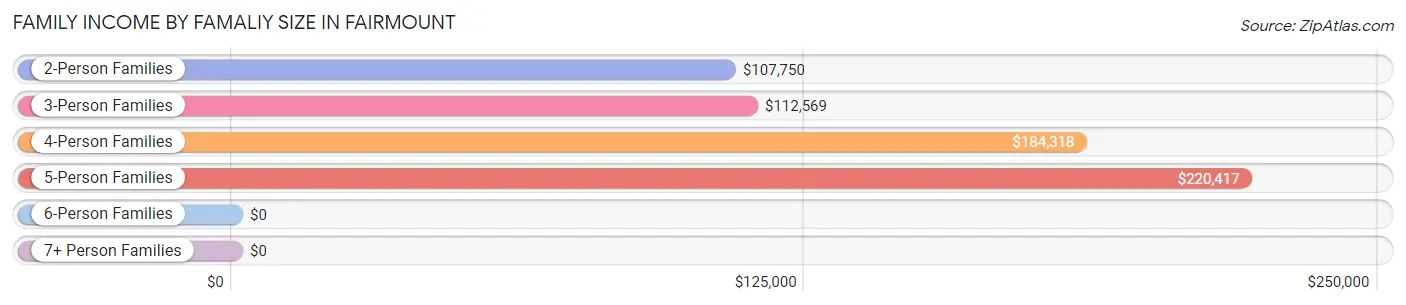
| Income Bracket | # Families | Median Income |
| 2-Person Families | 208 (41.9%) | $107,750 |
| 3-Person Families | 97 (19.6%) | $112,569 |
| 4-Person Families | 126 (25.4%) | $184,318 |
| 5-Person Families | 45 (9.1%) | $220,417 |
| 6-Person Families | 14 (2.8%) | $0 |
| 7+ Person Families | 6 (1.2%) | $0 |
| Total | 496 (100.0%) | $116,591 |
Family Income by Number of Earners in Fairmount
The median family income in Fairmount is $116,591, with families comprising 2 earners (143) having the highest median family income of $151,875, while families with no earners (125) have the lowest median family income of $51,942, accounting for 28.8% and 25.2% of families, respectively.
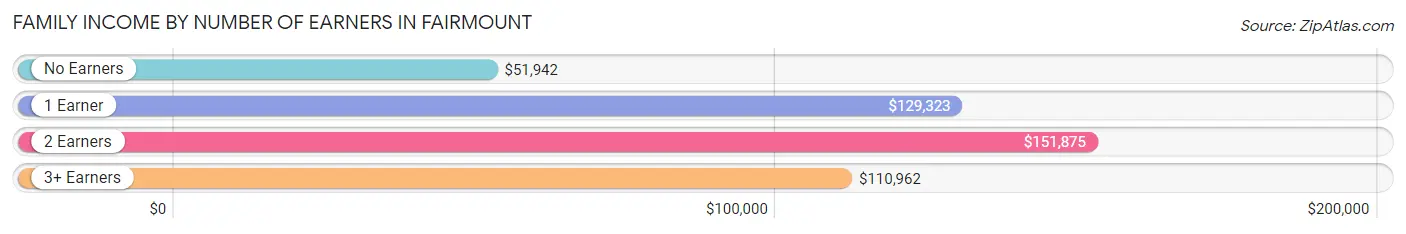
| Number of Earners | # Families | Median Income |
| No Earners | 125 (25.2%) | $51,942 |
| 1 Earner | 190 (38.3%) | $129,323 |
| 2 Earners | 143 (28.8%) | $151,875 |
| 3+ Earners | 38 (7.7%) | $110,962 |
| Total | 496 (100.0%) | $116,591 |
Household Income in Fairmount
Household Income Brackets in Fairmount
With 203 households falling in the category, the $100,000 to $149,999 income range is the most frequent in Fairmount, accounting for 31.8% of all households.
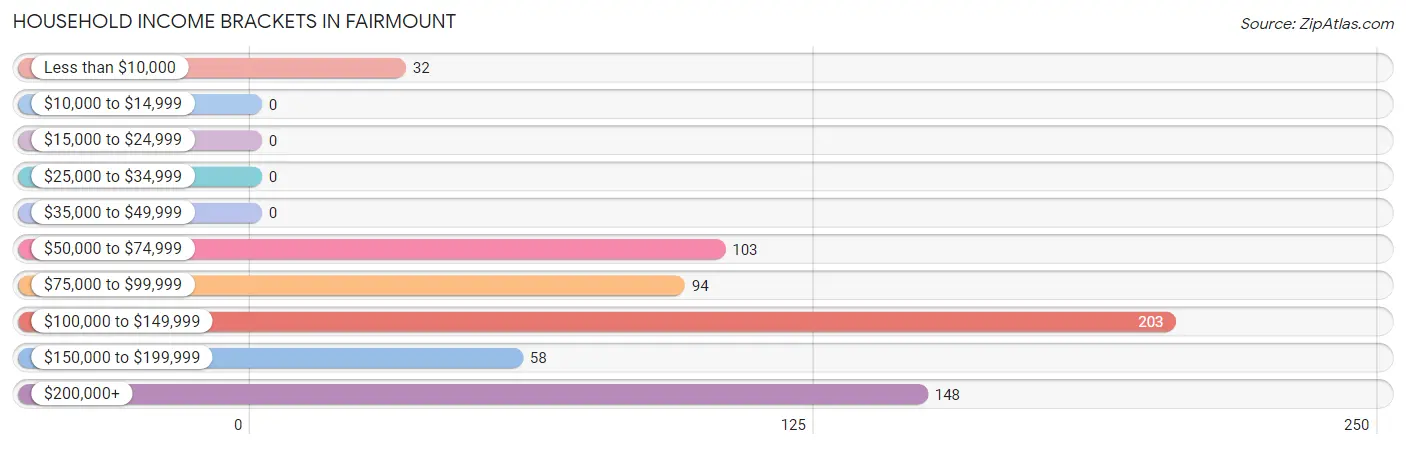
| Income Bracket | # Households | % Households |
| Less than $10,000 | 32 | 5.0% |
| $10,000 to $14,999 | 0 | 0.0% |
| $15,000 to $24,999 | 0 | 0.0% |
| $25,000 to $34,999 | 0 | 0.0% |
| $35,000 to $49,999 | 0 | 0.0% |
| $50,000 to $74,999 | 103 | 16.1% |
| $75,000 to $99,999 | 94 | 14.7% |
| $100,000 to $149,999 | 203 | 31.8% |
| $150,000 to $199,999 | 58 | 9.1% |
| $200,000+ | 148 | 23.2% |
Household Income by Householder Age in Fairmount
The median household income in Fairmount is $115,227, with the highest median household income of $220,926 found in the 25 to 44 years age bracket for the primary householder. A total of 168 households (26.3%) fall into this category.
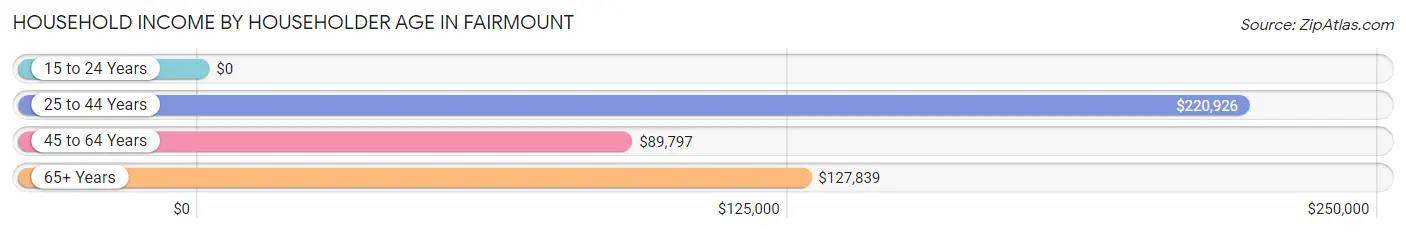
| Income Bracket | # Households | Median Income |
| 15 to 24 Years | 0 (0.0%) | $0 |
| 25 to 44 Years | 168 (26.3%) | $220,926 |
| 45 to 64 Years | 317 (49.7%) | $89,797 |
| 65+ Years | 153 (24.0%) | $127,839 |
| Total | 638 (100.0%) | $115,227 |
Poverty in Fairmount
Income Below Poverty by Sex and Age in Fairmount
With 3.8% poverty level for males and 3.5% for females among the residents of Fairmount, 5 year old males and 25 to 34 year old females are the most vulnerable to poverty, with 11 males (100.0%) and 12 females (60.0%) in their respective age groups living below the poverty level.
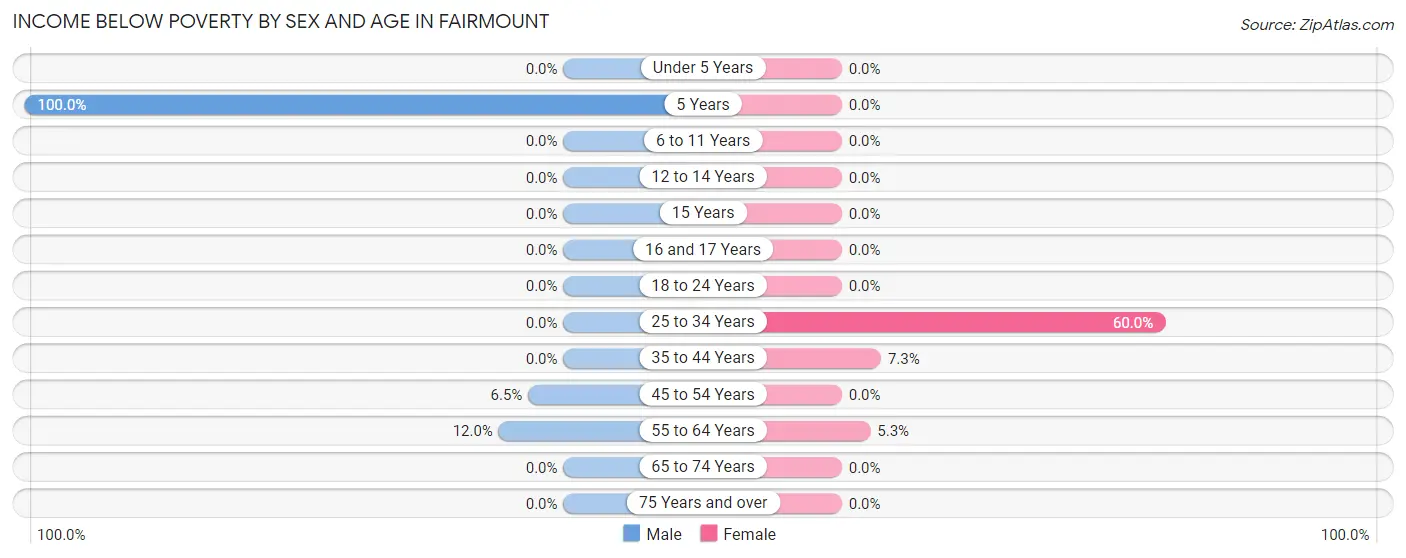
| Age Bracket | Male | Female |
| Under 5 Years | 0 (0.0%) | 0 (0.0%) |
| 5 Years | 11 (100.0%) | 0 (0.0%) |
| 6 to 11 Years | 0 (0.0%) | 0 (0.0%) |
| 12 to 14 Years | 0 (0.0%) | 0 (0.0%) |
| 15 Years | 0 (0.0%) | 0 (0.0%) |
| 16 and 17 Years | 0 (0.0%) | 0 (0.0%) |
| 18 to 24 Years | 0 (0.0%) | 0 (0.0%) |
| 25 to 34 Years | 0 (0.0%) | 12 (60.0%) |
| 35 to 44 Years | 0 (0.0%) | 12 (7.3%) |
| 45 to 54 Years | 13 (6.5%) | 0 (0.0%) |
| 55 to 64 Years | 9 (12.0%) | 7 (5.3%) |
| 65 to 74 Years | 0 (0.0%) | 0 (0.0%) |
| 75 Years and over | 0 (0.0%) | 0 (0.0%) |
| Total | 33 (3.8%) | 31 (3.5%) |
Income Above Poverty by Sex and Age in Fairmount
According to the poverty statistics in Fairmount, males aged under 5 years and females aged under 5 years are the age groups that are most secure financially, with 100.0% of males and 100.0% of females in these age groups living above the poverty line.
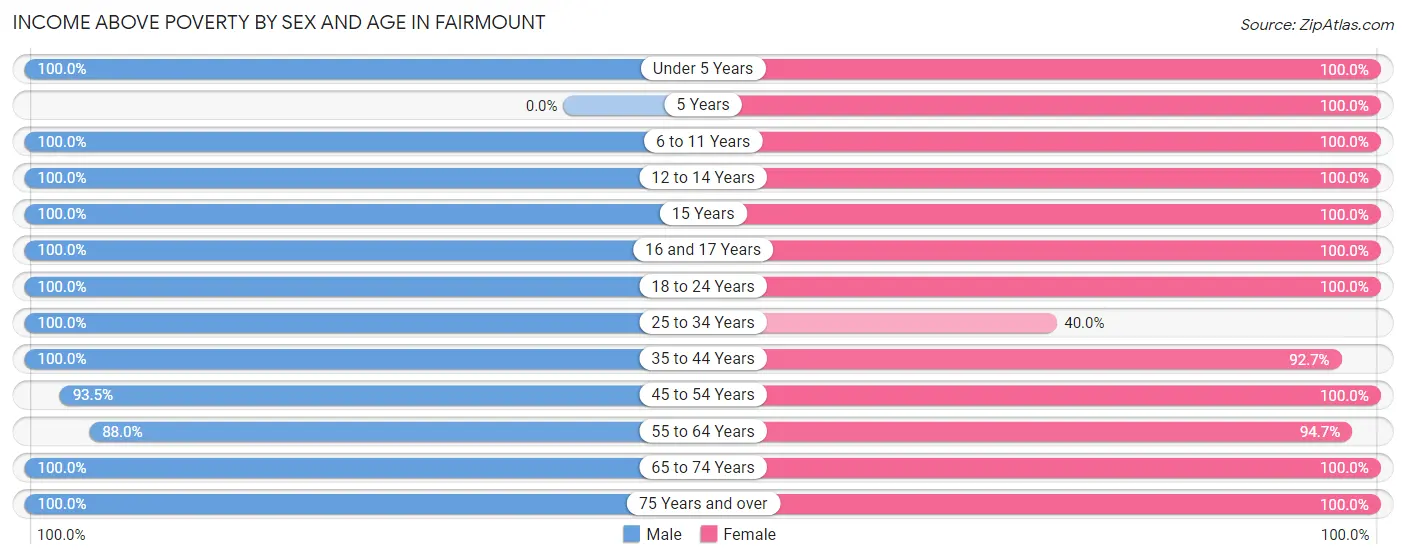
| Age Bracket | Male | Female |
| Under 5 Years | 25 (100.0%) | 107 (100.0%) |
| 5 Years | 0 (0.0%) | 37 (100.0%) |
| 6 to 11 Years | 48 (100.0%) | 41 (100.0%) |
| 12 to 14 Years | 32 (100.0%) | 54 (100.0%) |
| 15 Years | 69 (100.0%) | 8 (100.0%) |
| 16 and 17 Years | 65 (100.0%) | 24 (100.0%) |
| 18 to 24 Years | 52 (100.0%) | 12 (100.0%) |
| 25 to 34 Years | 21 (100.0%) | 8 (40.0%) |
| 35 to 44 Years | 104 (100.0%) | 153 (92.7%) |
| 45 to 54 Years | 186 (93.5%) | 123 (100.0%) |
| 55 to 64 Years | 66 (88.0%) | 125 (94.7%) |
| 65 to 74 Years | 69 (100.0%) | 104 (100.0%) |
| 75 Years and over | 99 (100.0%) | 51 (100.0%) |
| Total | 836 (96.2%) | 847 (96.5%) |
Income Below Poverty Among Married-Couple Families in Fairmount
The poverty statistics for married-couple families in Fairmount show that 1.5% or 7 of the total 463 families live below the poverty line. Families with no children have the highest poverty rate of 3.0%, comprising of 7 families. On the other hand, families with 1 or 2 children have the lowest poverty rate of 0.0%, which includes 0 families.
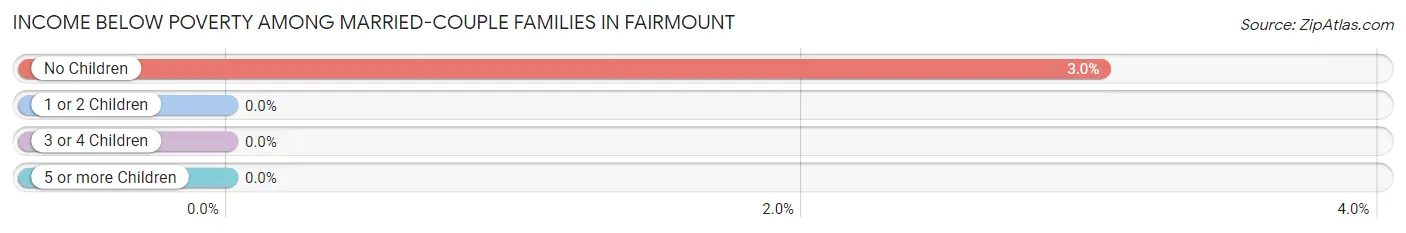
| Children | Above Poverty | Below Poverty |
| No Children | 223 (97.0%) | 7 (3.0%) |
| 1 or 2 Children | 200 (100.0%) | 0 (0.0%) |
| 3 or 4 Children | 27 (100.0%) | 0 (0.0%) |
| 5 or more Children | 6 (100.0%) | 0 (0.0%) |
| Total | 456 (98.5%) | 7 (1.5%) |
Income Below Poverty Among Single-Parent Households in Fairmount
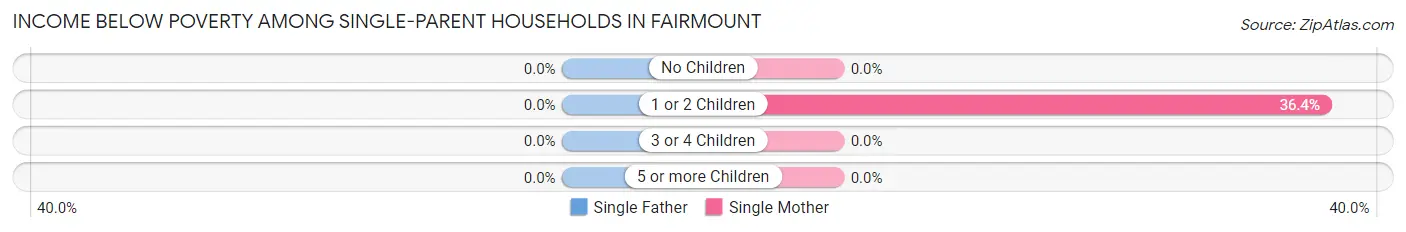
| Children | Single Father | Single Mother |
| No Children | 0 (0.0%) | 0 (0.0%) |
| 1 or 2 Children | 0 (0.0%) | 12 (36.4%) |
| 3 or 4 Children | 0 (0.0%) | 0 (0.0%) |
| 5 or more Children | 0 (0.0%) | 0 (0.0%) |
| Total | 0 (0.0%) | 12 (36.4%) |
Income Below Poverty Among Married-Couple vs Single-Parent Households in Fairmount
The poverty data for Fairmount shows that 7 of the married-couple family households (1.5%) and 12 of the single-parent households (36.4%) are living below the poverty level. Within the married-couple family households, those with no children have the highest poverty rate, with 7 households (3.0%) falling below the poverty line. Among the single-parent households, those with 1 or 2 children have the highest poverty rate, with 12 household (36.4%) living below poverty.
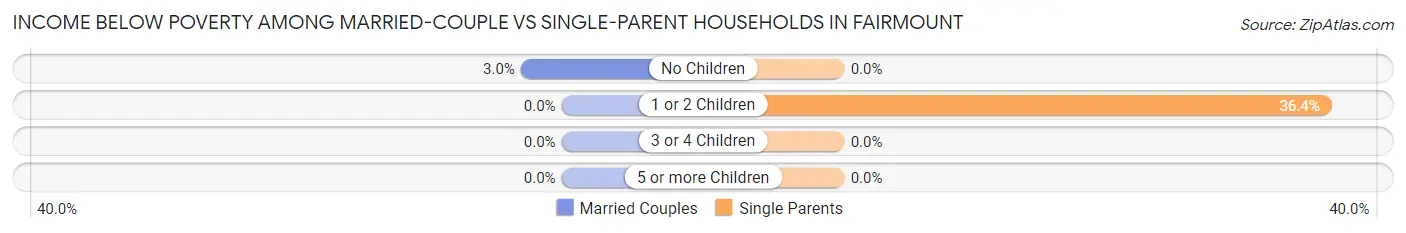
| Children | Married-Couple Families | Single-Parent Households |
| No Children | 7 (3.0%) | 0 (0.0%) |
| 1 or 2 Children | 0 (0.0%) | 12 (36.4%) |
| 3 or 4 Children | 0 (0.0%) | 0 (0.0%) |
| 5 or more Children | 0 (0.0%) | 0 (0.0%) |
| Total | 7 (1.5%) | 12 (36.4%) |
Race in Fairmount
The most populous races in Fairmount are White / Caucasian (1,503 | 86.0%), Two or more Races (140 | 8.0%), and Hawaiian / Pacific (91 | 5.2%).
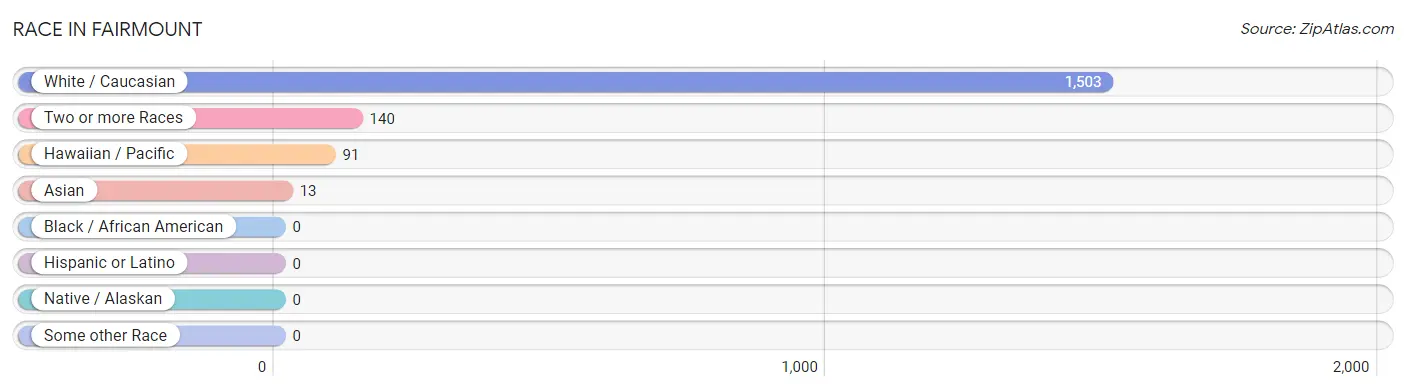
| Race | # Population | % Population |
| Asian | 13 | 0.7% |
| Black / African American | 0 | 0.0% |
| Hawaiian / Pacific | 91 | 5.2% |
| Hispanic or Latino | 0 | 0.0% |
| Native / Alaskan | 0 | 0.0% |
| White / Caucasian | 1,503 | 86.0% |
| Two or more Races | 140 | 8.0% |
| Some other Race | 0 | 0.0% |
| Total | 1,747 | 100.0% |
Ancestry in Fairmount
The most populous ancestries reported in Fairmount are English (400 | 22.9%), Irish (212 | 12.1%), American (178 | 10.2%), German (126 | 7.2%), and Samoan (91 | 5.2%), together accounting for 57.7% of all Fairmount residents.
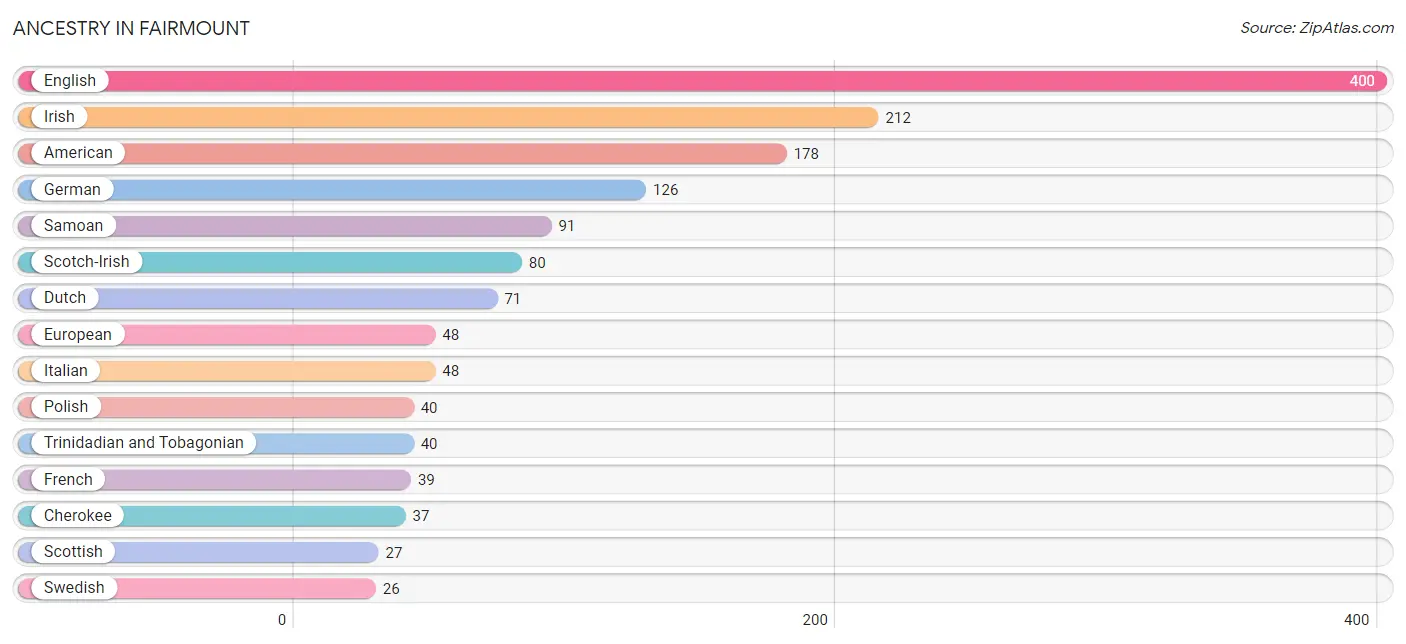
| Ancestry | # Population | % Population |
| American | 178 | 10.2% |
| British | 15 | 0.9% |
| Cajun | 11 | 0.6% |
| Cherokee | 37 | 2.1% |
| Dutch | 71 | 4.1% |
| English | 400 | 22.9% |
| European | 48 | 2.8% |
| French | 39 | 2.2% |
| German | 126 | 7.2% |
| Irish | 212 | 12.1% |
| Italian | 48 | 2.8% |
| Lithuanian | 15 | 0.9% |
| Pakistani | 1 | 0.1% |
| Polish | 40 | 2.3% |
| Samoan | 91 | 5.2% |
| Scotch-Irish | 80 | 4.6% |
| Scottish | 27 | 1.5% |
| Swedish | 26 | 1.5% |
| Thai | 12 | 0.7% |
| Trinidadian and Tobagonian | 40 | 2.3% |
| Welsh | 9 | 0.5% | View All 21 Rows |
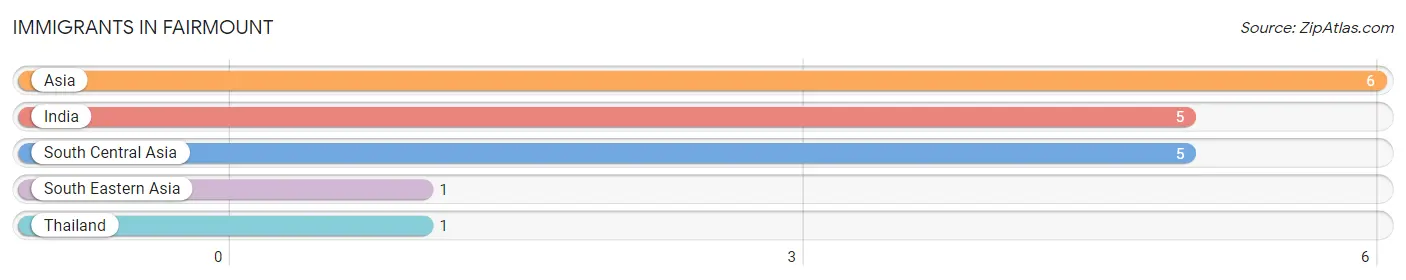
Immigrants in Fairmount
The most numerous immigrant groups reported in Fairmount came from Asia (6 | 0.3%), India (5 | 0.3%), South Central Asia (5 | 0.3%), South Eastern Asia (1 | 0.1%), and Thailand (1 | 0.1%), together accounting for 1.0% of all Fairmount residents.
| Immigration Origin | # Population | % Population |
| Asia | 6 | 0.3% |
| India | 5 | 0.3% |
| South Central Asia | 5 | 0.3% |
| South Eastern Asia | 1 | 0.1% |
| Thailand | 1 | 0.1% | View All 5 Rows |
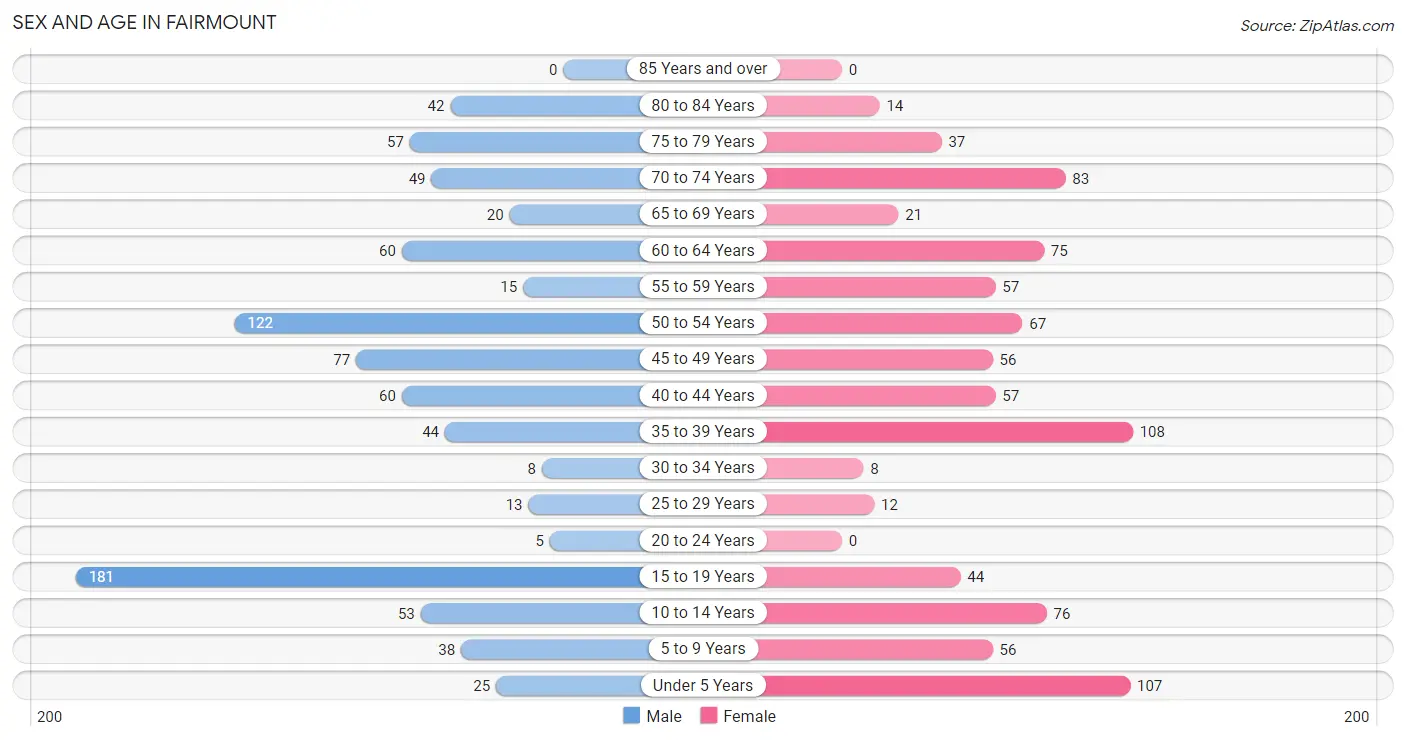
Sex and Age in Fairmount
Sex and Age in Fairmount
The most populous age groups in Fairmount are 15 to 19 Years (181 | 20.8%) for men and 35 to 39 Years (108 | 12.3%) for women.
| Age Bracket | Male | Female |
| Under 5 Years | 25 (2.9%) | 107 (12.2%) |
| 5 to 9 Years | 38 (4.4%) | 56 (6.4%) |
| 10 to 14 Years | 53 (6.1%) | 76 (8.7%) |
| 15 to 19 Years | 181 (20.8%) | 44 (5.0%) |
| 20 to 24 Years | 5 (0.6%) | 0 (0.0%) |
| 25 to 29 Years | 13 (1.5%) | 12 (1.4%) |
| 30 to 34 Years | 8 (0.9%) | 8 (0.9%) |
| 35 to 39 Years | 44 (5.1%) | 108 (12.3%) |
| 40 to 44 Years | 60 (6.9%) | 57 (6.5%) |
| 45 to 49 Years | 77 (8.9%) | 56 (6.4%) |
| 50 to 54 Years | 122 (14.0%) | 67 (7.6%) |
| 55 to 59 Years | 15 (1.7%) | 57 (6.5%) |
| 60 to 64 Years | 60 (6.9%) | 75 (8.5%) |
| 65 to 69 Years | 20 (2.3%) | 21 (2.4%) |
| 70 to 74 Years | 49 (5.6%) | 83 (9.5%) |
| 75 to 79 Years | 57 (6.6%) | 37 (4.2%) |
| 80 to 84 Years | 42 (4.8%) | 14 (1.6%) |
| 85 Years and over | 0 (0.0%) | 0 (0.0%) |
| Total | 869 (100.0%) | 878 (100.0%) |
Families and Households in Fairmount
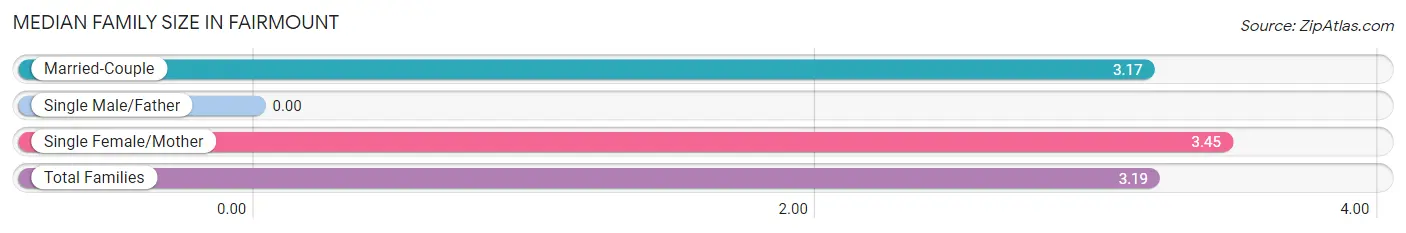
Median Family Size in Fairmount
| Family Type | # Families | Family Size |
| Married-Couple | 463 (93.3%) | 3.17 |
| Single Male/Father | 0 (0.0%) | - |
| Single Female/Mother | 33 (6.7%) | 3.45 |
| Total Families | 496 (100.0%) | 3.19 |
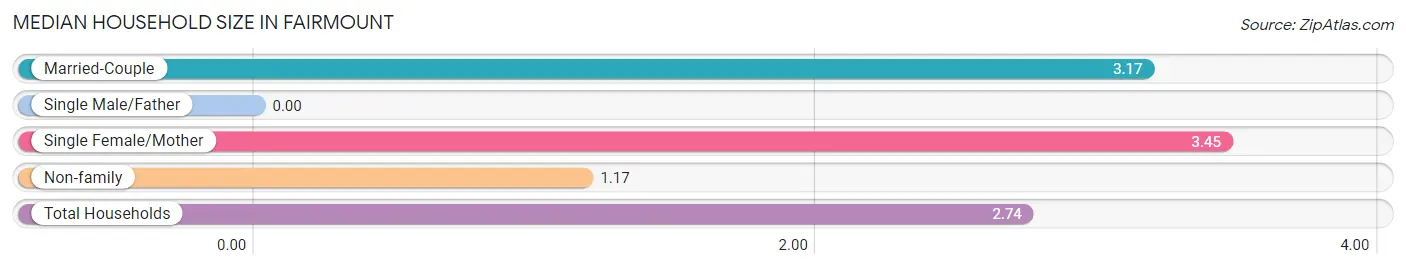
Median Household Size in Fairmount
| Household Type | # Households | Household Size |
| Married-Couple | 463 (72.6%) | 3.17 |
| Single Male/Father | 0 (0.0%) | - |
| Single Female/Mother | 33 (5.2%) | 3.45 |
| Non-family | 142 (22.3%) | 1.17 |
| Total Households | 638 (100.0%) | 2.74 |
Household Size by Marriage Status in Fairmount
Out of a total of 638 households in Fairmount, 496 (77.7%) are family households, while 142 (22.3%) are nonfamily households. The most numerous type of family households are 2-person households, comprising 208, and the most common type of nonfamily households are 1-person households, comprising 127.
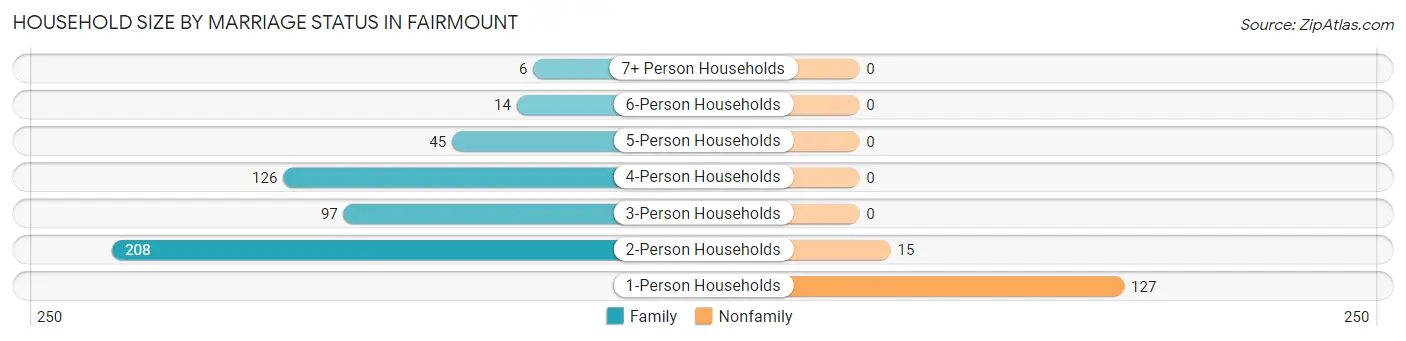
| Household Size | Family Households | Nonfamily Households |
| 1-Person Households | - | 127 (19.9%) |
| 2-Person Households | 208 (32.6%) | 15 (2.4%) |
| 3-Person Households | 97 (15.2%) | 0 (0.0%) |
| 4-Person Households | 126 (19.8%) | 0 (0.0%) |
| 5-Person Households | 45 (7.0%) | 0 (0.0%) |
| 6-Person Households | 14 (2.2%) | 0 (0.0%) |
| 7+ Person Households | 6 (0.9%) | 0 (0.0%) |
| Total | 496 (77.7%) | 142 (22.3%) |
Female Fertility in Fairmount
Fertility by Age in Fairmount
| Age Bracket | Women with Births | Births / 1,000 Women |
| 15 to 19 years | 0 (0.0%) | 0.0 |
| 20 to 34 years | 0 (0.0%) | 0.0 |
| 35 to 50 years | 0 (0.0%) | 0.0 |
| Total | 0 (0.0%) | 0.0 |
Fertility by Age by Marriage Status in Fairmount
| Age Bracket | Married | Unmarried |
| 15 to 19 years | 0 (0.0%) | 0 (0.0%) |
| 20 to 34 years | 0 (0.0%) | 0 (0.0%) |
| 35 to 50 years | 0 (0.0%) | 0 (0.0%) |
| Total | 0 (0.0%) | 0 (0.0%) |
Fertility by Education in Fairmount
| Educational Attainment | Women with Births | Births / 1,000 Women |
| Less than High School | 0 (0.0%) | 0.0 |
| High School Diploma | 0 (0.0%) | 0.0 |
| College or Associate's Degree | 0 (0.0%) | 0.0 |
| Bachelor's Degree | 0 (0.0%) | 0.0 |
| Graduate Degree | 0 (0.0%) | 0.0 |
| Total | 0 (0.0%) | 0.0 |
Fertility by Education by Marriage Status in Fairmount
| Educational Attainment | Married | Unmarried |
| Less than High School | 0 (0.0%) | 0 (0.0%) |
| High School Diploma | 0 (0.0%) | 0 (0.0%) |
| College or Associate's Degree | 0 (0.0%) | 0 (0.0%) |
| Bachelor's Degree | 0 (0.0%) | 0 (0.0%) |
| Graduate Degree | 0 (0.0%) | 0 (0.0%) |
| Total | 0 (0.0%) | 0 (0.0%) |
Employment Characteristics in Fairmount
Employment by Class of Employer in Fairmount
Among the 692 employed individuals in Fairmount, private company employees (369 | 53.3%), not-for-profit organizations (98 | 14.2%), and local government employees (85 | 12.3%) make up the most common classes of employment.
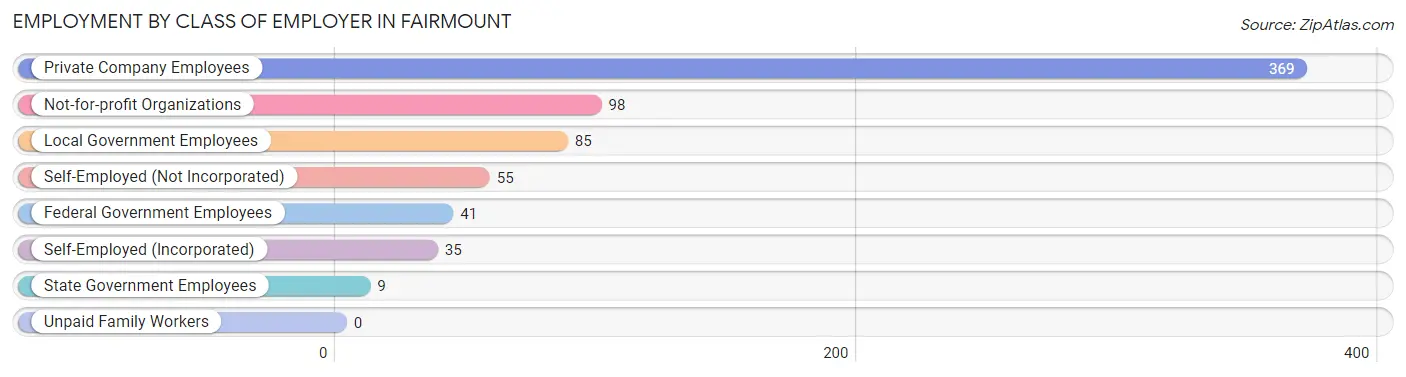
| Employer Class | # Employees | % Employees |
| Private Company Employees | 369 | 53.3% |
| Self-Employed (Incorporated) | 35 | 5.1% |
| Self-Employed (Not Incorporated) | 55 | 8.0% |
| Not-for-profit Organizations | 98 | 14.2% |
| Local Government Employees | 85 | 12.3% |
| State Government Employees | 9 | 1.3% |
| Federal Government Employees | 41 | 5.9% |
| Unpaid Family Workers | 0 | 0.0% |
| Total | 692 | 100.0% |
Employment Status by Age in Fairmount
According to the labor force statistics for Fairmount, out of the total population over 16 years of age (1,315), 55.7% or 732 individuals are in the labor force, with 3.3% or 24 of them unemployed. The age group with the highest labor force participation rate is 20 to 24 years, with 100.0% or 5 individuals in the labor force. Within the labor force, the 16 to 19 years age range has the highest percentage of unemployed individuals, with 60.0% or 24 of them being unemployed.
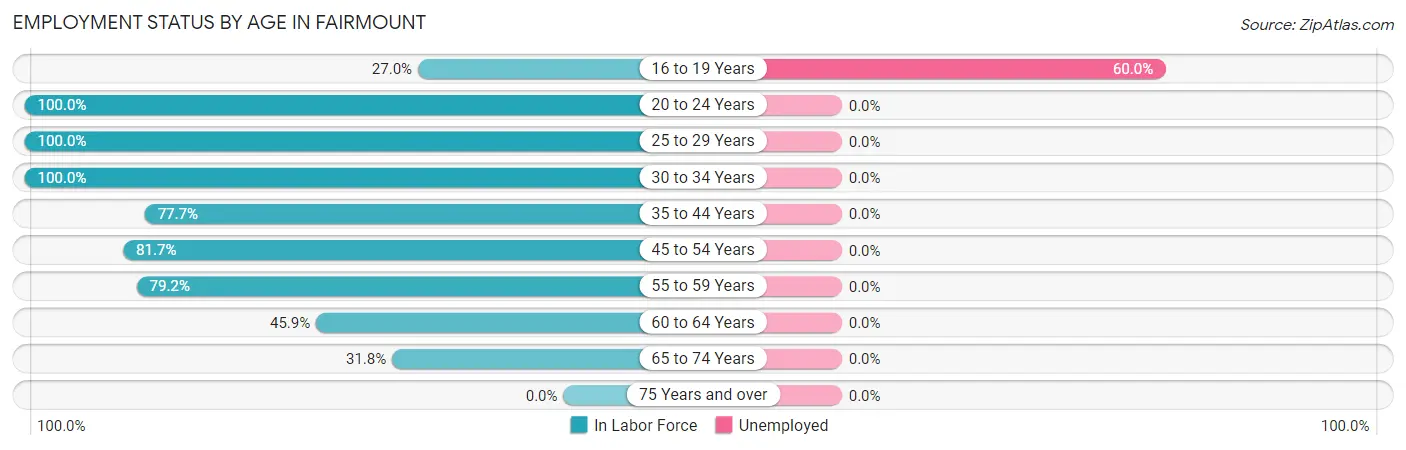
| Age Bracket | In Labor Force | Unemployed |
| 16 to 19 Years | 40 (27.0%) | 24 (60.0%) |
| 20 to 24 Years | 5 (100.0%) | 0 (0.0%) |
| 25 to 29 Years | 25 (100.0%) | 0 (0.0%) |
| 30 to 34 Years | 16 (100.0%) | 0 (0.0%) |
| 35 to 44 Years | 209 (77.7%) | 0 (0.0%) |
| 45 to 54 Years | 263 (81.7%) | 0 (0.0%) |
| 55 to 59 Years | 57 (79.2%) | 0 (0.0%) |
| 60 to 64 Years | 62 (45.9%) | 0 (0.0%) |
| 65 to 74 Years | 55 (31.8%) | 0 (0.0%) |
| 75 Years and over | 0 (0.0%) | 0 (0.0%) |
| Total | 732 (55.7%) | 24 (3.3%) |
Employment Status by Educational Attainment in Fairmount
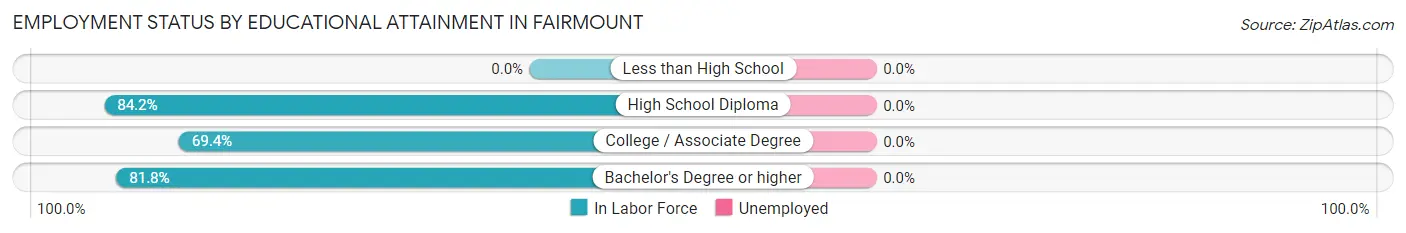
| Educational Attainment | In Labor Force | Unemployed |
| Less than High School | 0 (0.0%) | 0 (0.0%) |
| High School Diploma | 85 (84.2%) | 0 (0.0%) |
| College / Associate Degree | 188 (69.4%) | 0 (0.0%) |
| Bachelor's Degree or higher | 359 (81.8%) | 0 (0.0%) |
| Total | 632 (75.3%) | 0 (0.0%) |
Employment Occupations by Sex in Fairmount
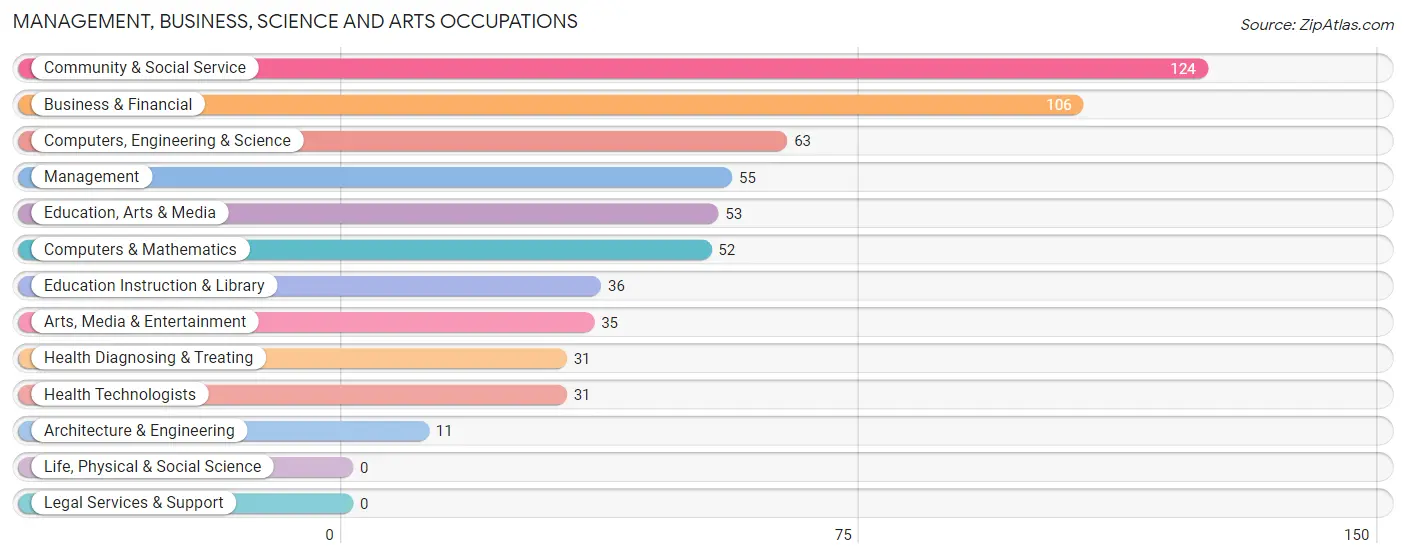
Management, Business, Science and Arts Occupations
The most common Management, Business, Science and Arts occupations in Fairmount are Community & Social Service (124 | 17.5%), Business & Financial (106 | 15.0%), Computers, Engineering & Science (63 | 8.9%), Management (55 | 7.8%), and Education, Arts & Media (53 | 7.5%).
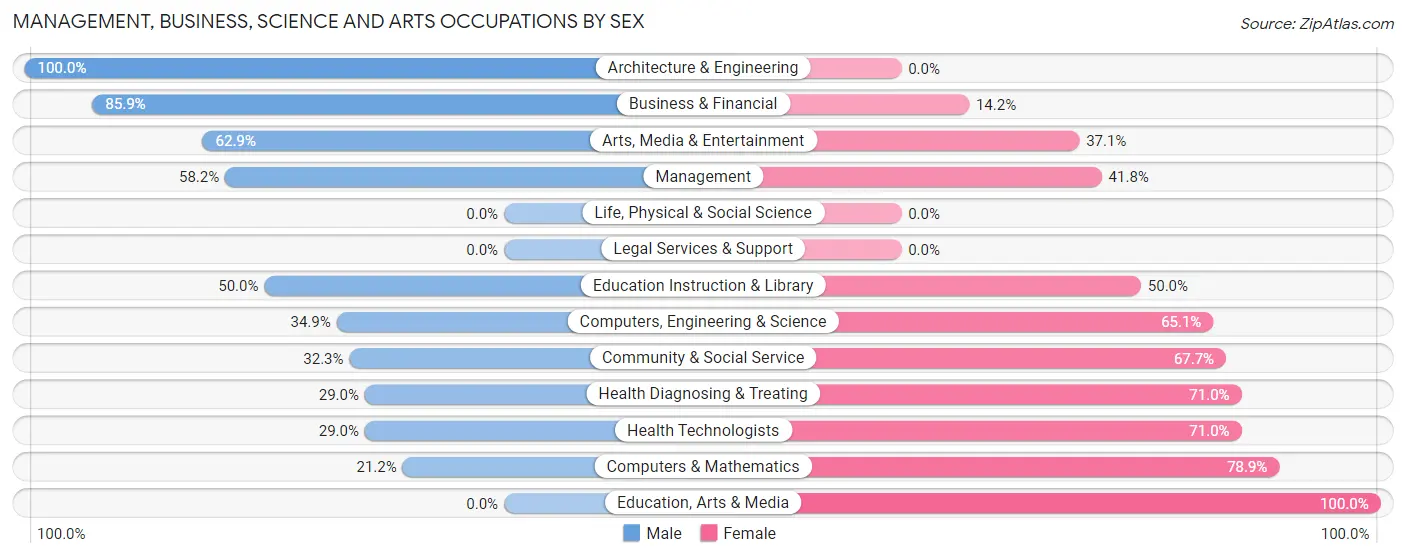
Management, Business, Science and Arts Occupations by Sex
Within the Management, Business, Science and Arts occupations in Fairmount, the most male-oriented occupations are Architecture & Engineering (100.0%), Business & Financial (85.9%), and Arts, Media & Entertainment (62.9%), while the most female-oriented occupations are Education, Arts & Media (100.0%), Computers & Mathematics (78.8%), and Health Diagnosing & Treating (71.0%).
| Occupation | Male | Female |
| Management | 32 (58.2%) | 23 (41.8%) |
| Business & Financial | 91 (85.9%) | 15 (14.1%) |
| Computers, Engineering & Science | 22 (34.9%) | 41 (65.1%) |
| Computers & Mathematics | 11 (21.1%) | 41 (78.8%) |
| Architecture & Engineering | 11 (100.0%) | 0 (0.0%) |
| Life, Physical & Social Science | 0 (0.0%) | 0 (0.0%) |
| Community & Social Service | 40 (32.3%) | 84 (67.7%) |
| Education, Arts & Media | 0 (0.0%) | 53 (100.0%) |
| Legal Services & Support | 0 (0.0%) | 0 (0.0%) |
| Education Instruction & Library | 18 (50.0%) | 18 (50.0%) |
| Arts, Media & Entertainment | 22 (62.9%) | 13 (37.1%) |
| Health Diagnosing & Treating | 9 (29.0%) | 22 (71.0%) |
| Health Technologists | 9 (29.0%) | 22 (71.0%) |
| Total (Category) | 194 (51.2%) | 185 (48.8%) |
| Total (Overall) | 346 (48.9%) | 362 (51.1%) |
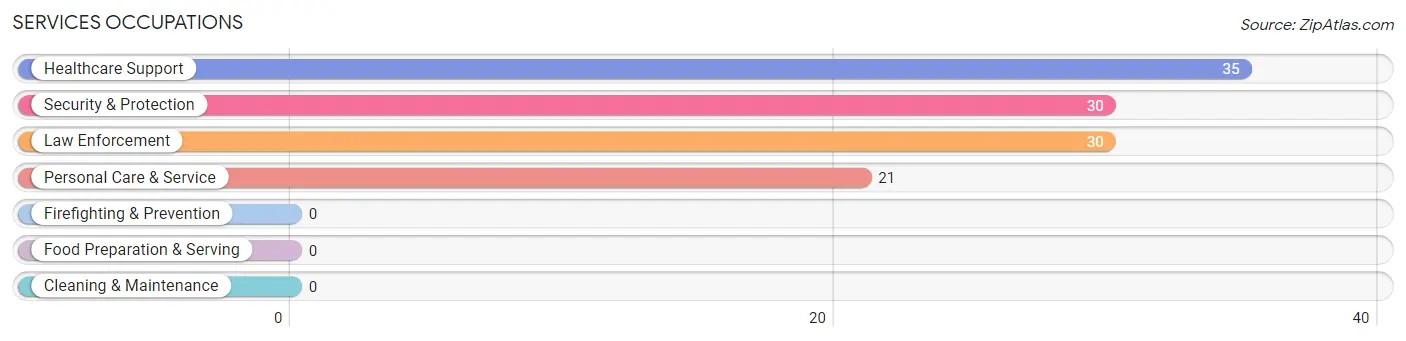
Services Occupations
The most common Services occupations in Fairmount are Healthcare Support (35 | 4.9%), Security & Protection (30 | 4.2%), Law Enforcement (30 | 4.2%), and Personal Care & Service (21 | 3.0%).
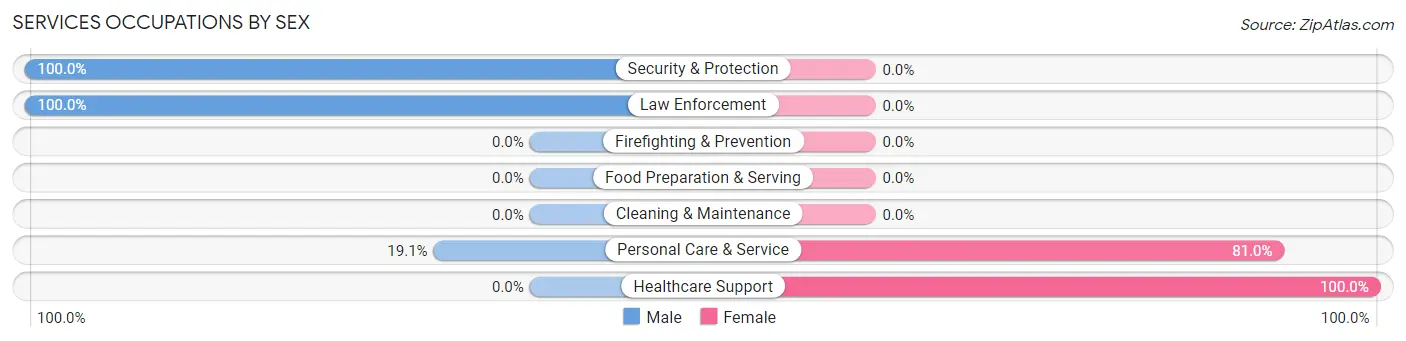
Services Occupations by Sex
Within the Services occupations in Fairmount, the most male-oriented occupations are Security & Protection (100.0%), Law Enforcement (100.0%), and Personal Care & Service (19.1%), while the most female-oriented occupations are Healthcare Support (100.0%), and Personal Care & Service (80.9%).
| Occupation | Male | Female |
| Healthcare Support | 0 (0.0%) | 35 (100.0%) |
| Security & Protection | 30 (100.0%) | 0 (0.0%) |
| Firefighting & Prevention | 0 (0.0%) | 0 (0.0%) |
| Law Enforcement | 30 (100.0%) | 0 (0.0%) |
| Food Preparation & Serving | 0 (0.0%) | 0 (0.0%) |
| Cleaning & Maintenance | 0 (0.0%) | 0 (0.0%) |
| Personal Care & Service | 4 (19.1%) | 17 (80.9%) |
| Total (Category) | 34 (39.5%) | 52 (60.5%) |
| Total (Overall) | 346 (48.9%) | 362 (51.1%) |
Sales and Office Occupations
The most common Sales and Office occupations in Fairmount are Sales & Related (96 | 13.6%), and Office & Administration (63 | 8.9%).
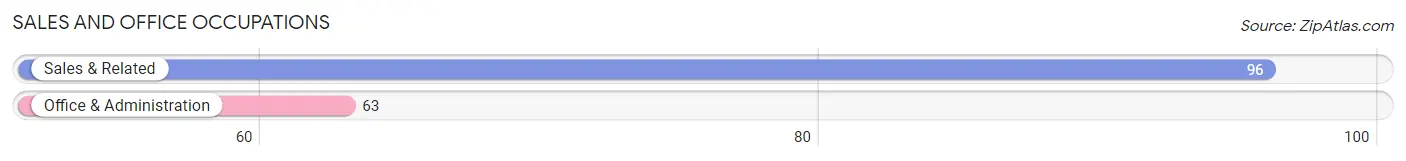
Sales and Office Occupations by Sex
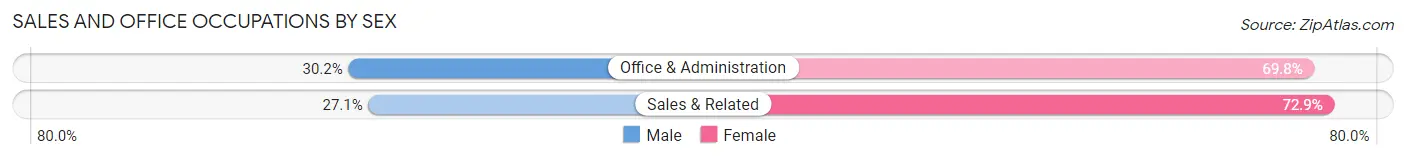
| Occupation | Male | Female |
| Sales & Related | 26 (27.1%) | 70 (72.9%) |
| Office & Administration | 19 (30.2%) | 44 (69.8%) |
| Total (Category) | 45 (28.3%) | 114 (71.7%) |
| Total (Overall) | 346 (48.9%) | 362 (51.1%) |
Natural Resources, Construction and Maintenance Occupations
The most common Natural Resources, Construction and Maintenance occupations in Fairmount are Construction & Extraction (17 | 2.4%), and Installation, Maintenance & Repair (17 | 2.4%).
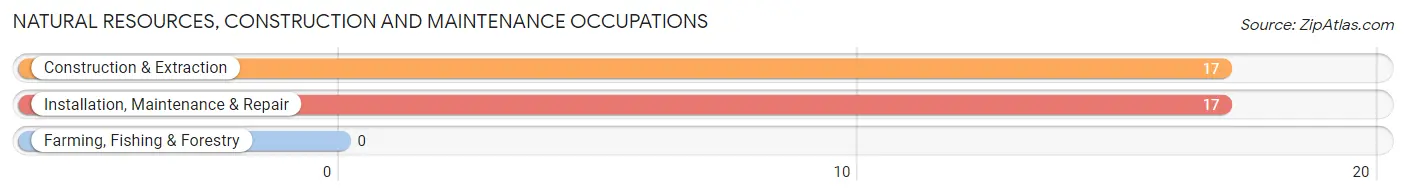
Natural Resources, Construction and Maintenance Occupations by Sex
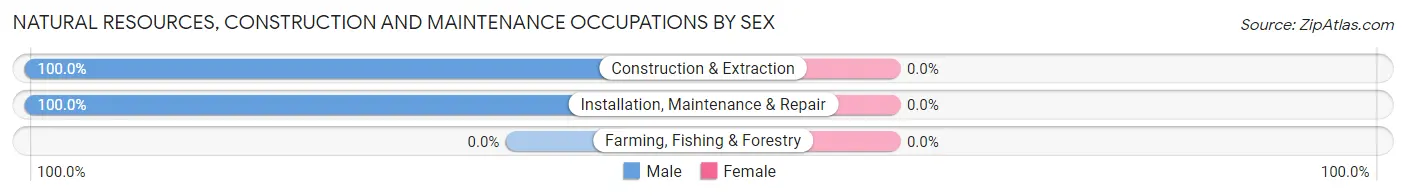
| Occupation | Male | Female |
| Farming, Fishing & Forestry | 0 (0.0%) | 0 (0.0%) |
| Construction & Extraction | 17 (100.0%) | 0 (0.0%) |
| Installation, Maintenance & Repair | 17 (100.0%) | 0 (0.0%) |
| Total (Category) | 34 (100.0%) | 0 (0.0%) |
| Total (Overall) | 346 (48.9%) | 362 (51.1%) |
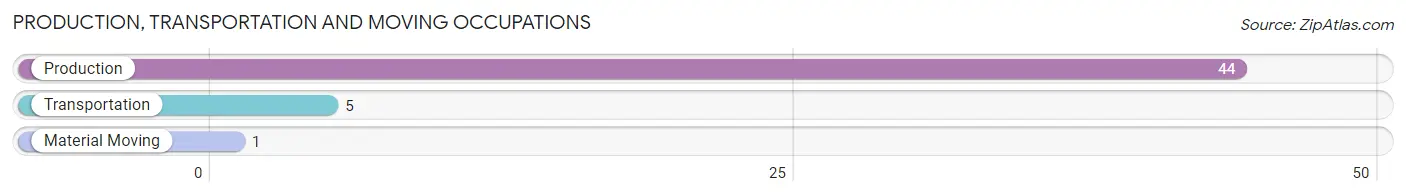
Production, Transportation and Moving Occupations
The most common Production, Transportation and Moving occupations in Fairmount are Production (44 | 6.2%), Transportation (5 | 0.7%), and Material Moving (1 | 0.1%).
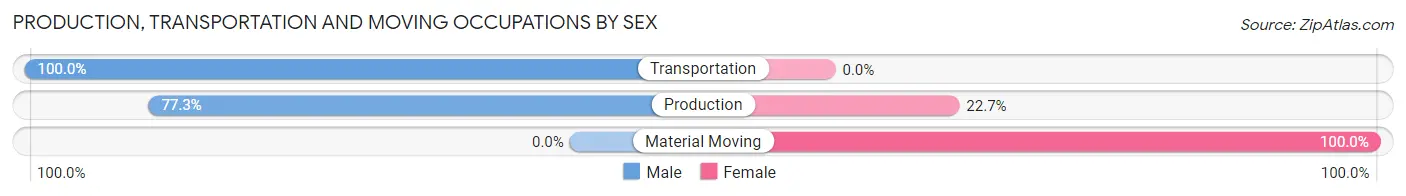
Production, Transportation and Moving Occupations by Sex
| Occupation | Male | Female |
| Production | 34 (77.3%) | 10 (22.7%) |
| Transportation | 5 (100.0%) | 0 (0.0%) |
| Material Moving | 0 (0.0%) | 1 (100.0%) |
| Total (Category) | 39 (78.0%) | 11 (22.0%) |
| Total (Overall) | 346 (48.9%) | 362 (51.1%) |
Employment Industries by Sex in Fairmount
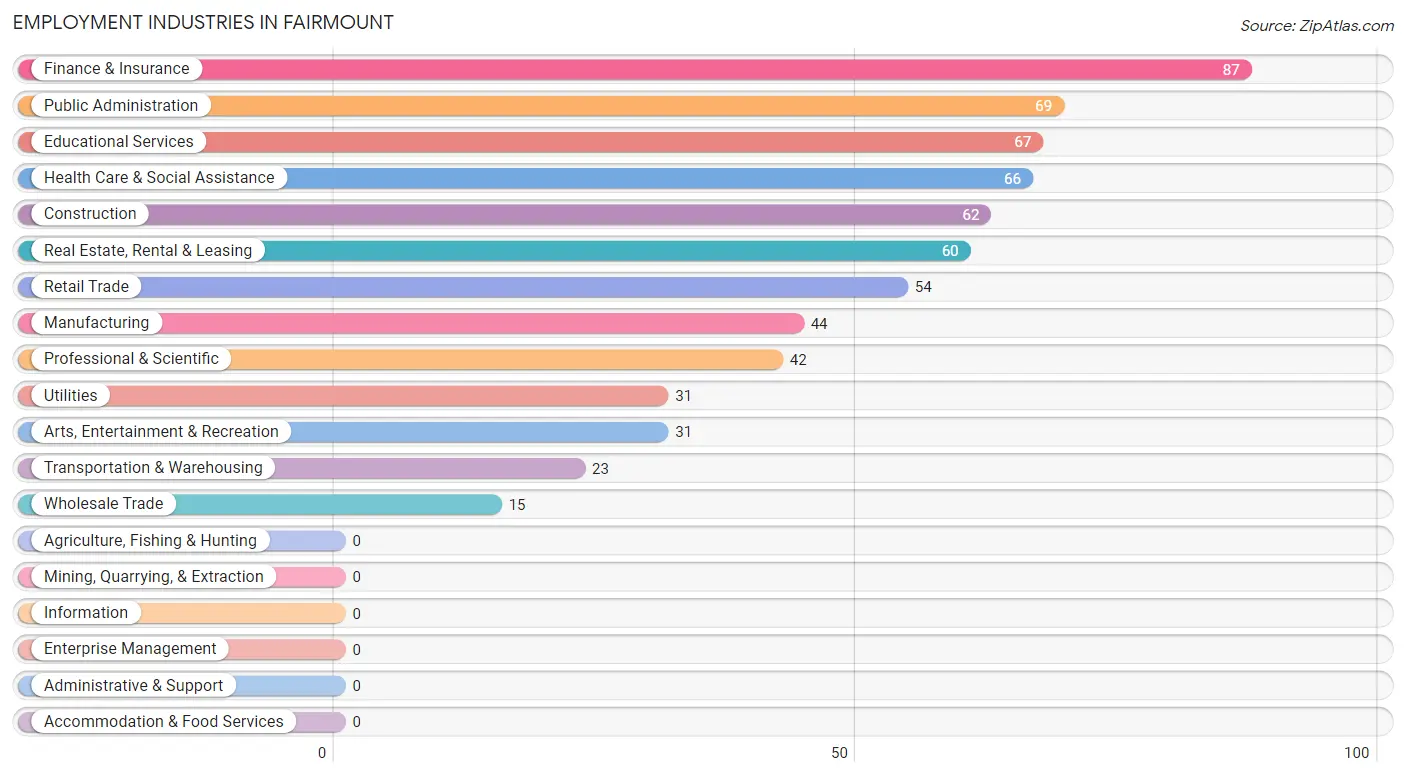
Employment Industries in Fairmount
The major employment industries in Fairmount include Finance & Insurance (87 | 12.3%), Public Administration (69 | 9.8%), Educational Services (67 | 9.5%), Health Care & Social Assistance (66 | 9.3%), and Construction (62 | 8.8%).
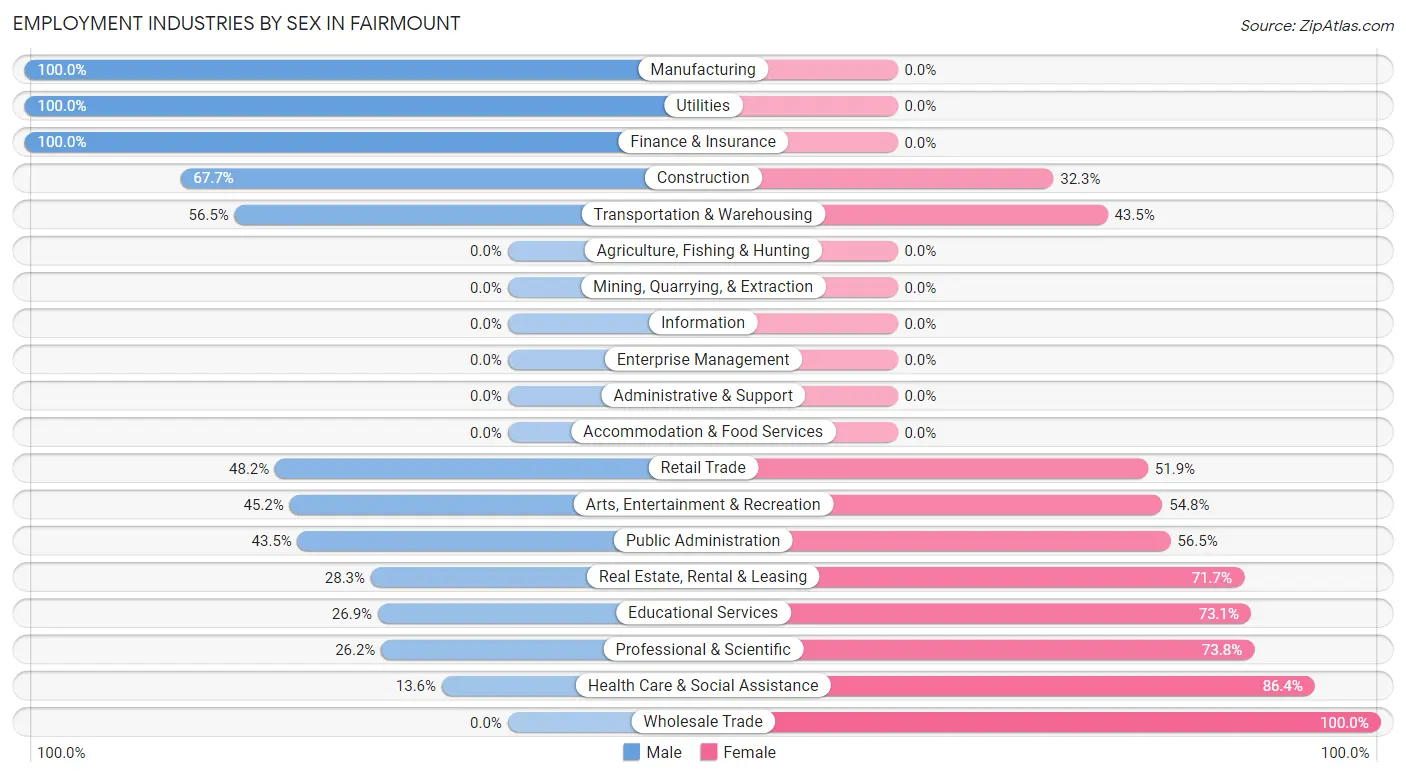
Employment Industries by Sex in Fairmount
The Fairmount industries that see more men than women are Manufacturing (100.0%), Utilities (100.0%), and Finance & Insurance (100.0%), whereas the industries that tend to have a higher number of women are Wholesale Trade (100.0%), Health Care & Social Assistance (86.4%), and Professional & Scientific (73.8%).
| Industry | Male | Female |
| Agriculture, Fishing & Hunting | 0 (0.0%) | 0 (0.0%) |
| Mining, Quarrying, & Extraction | 0 (0.0%) | 0 (0.0%) |
| Construction | 42 (67.7%) | 20 (32.3%) |
| Manufacturing | 44 (100.0%) | 0 (0.0%) |
| Wholesale Trade | 0 (0.0%) | 15 (100.0%) |
| Retail Trade | 26 (48.1%) | 28 (51.8%) |
| Transportation & Warehousing | 13 (56.5%) | 10 (43.5%) |
| Utilities | 31 (100.0%) | 0 (0.0%) |
| Information | 0 (0.0%) | 0 (0.0%) |
| Finance & Insurance | 87 (100.0%) | 0 (0.0%) |
| Real Estate, Rental & Leasing | 17 (28.3%) | 43 (71.7%) |
| Professional & Scientific | 11 (26.2%) | 31 (73.8%) |
| Enterprise Management | 0 (0.0%) | 0 (0.0%) |
| Administrative & Support | 0 (0.0%) | 0 (0.0%) |
| Educational Services | 18 (26.9%) | 49 (73.1%) |
| Health Care & Social Assistance | 9 (13.6%) | 57 (86.4%) |
| Arts, Entertainment & Recreation | 14 (45.2%) | 17 (54.8%) |
| Accommodation & Food Services | 0 (0.0%) | 0 (0.0%) |
| Public Administration | 30 (43.5%) | 39 (56.5%) |
| Total | 346 (48.9%) | 362 (51.1%) |
Education in Fairmount
School Enrollment in Fairmount
The most common levels of schooling among the 507 students in Fairmount are high school (172 | 33.9%), nursery / preschool (123 | 24.3%), and middle school (119 | 23.5%).
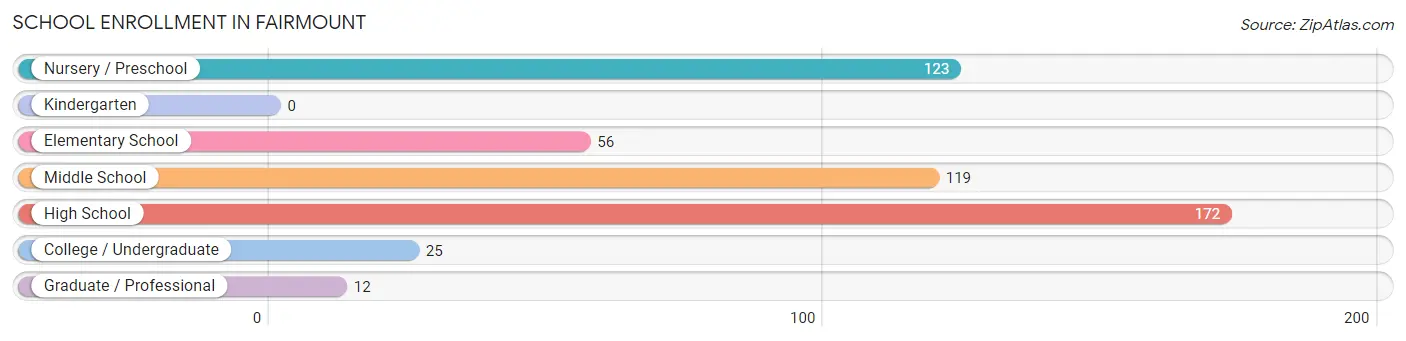
| School Level | # Students | % Students |
| Nursery / Preschool | 123 | 24.3% |
| Kindergarten | 0 | 0.0% |
| Elementary School | 56 | 11.1% |
| Middle School | 119 | 23.5% |
| High School | 172 | 33.9% |
| College / Undergraduate | 25 | 4.9% |
| Graduate / Professional | 12 | 2.4% |
| Total | 507 | 100.0% |
School Enrollment by Age by Funding Source in Fairmount
Out of a total of 507 students who are enrolled in schools in Fairmount, 83 (16.4%) attend a private institution, while the remaining 424 (83.6%) are enrolled in public schools. The age group of 15 to 17 year olds has the highest likelihood of being enrolled in private schools, with 51 (30.7% in the age bracket) enrolled. Conversely, the age group of 10 to 14 year olds has the lowest likelihood of being enrolled in a private school, with 129 (100.0% in the age bracket) attending a public institution.
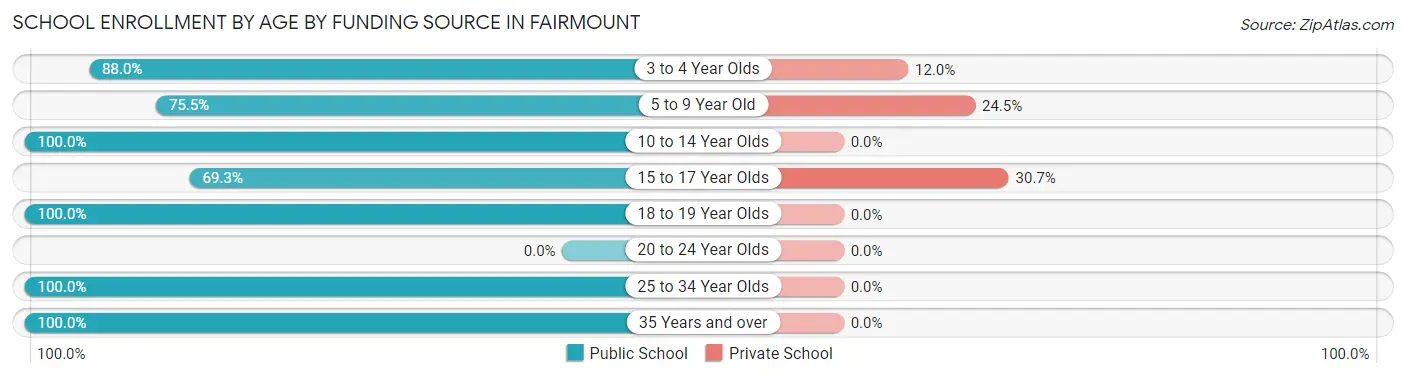
| Age Bracket | Public School | Private School |
| 3 to 4 Year Olds | 66 (88.0%) | 9 (12.0%) |
| 5 to 9 Year Old | 71 (75.5%) | 23 (24.5%) |
| 10 to 14 Year Olds | 129 (100.0%) | 0 (0.0%) |
| 15 to 17 Year Olds | 115 (69.3%) | 51 (30.7%) |
| 18 to 19 Year Olds | 19 (100.0%) | 0 (0.0%) |
| 20 to 24 Year Olds | 0 (0.0%) | 0 (0.0%) |
| 25 to 34 Year Olds | 12 (100.0%) | 0 (0.0%) |
| 35 Years and over | 12 (100.0%) | 0 (0.0%) |
| Total | 424 (83.6%) | 83 (16.4%) |
Educational Attainment by Field of Study in Fairmount
Business (146 | 26.2%), visual & performing arts (75 | 13.4%), bio, nature & agricultural (60 | 10.7%), science & technology (55 | 9.9%), and social sciences (53 | 9.5%) are the most common fields of study among 558 individuals in Fairmount who have obtained a bachelor's degree or higher.
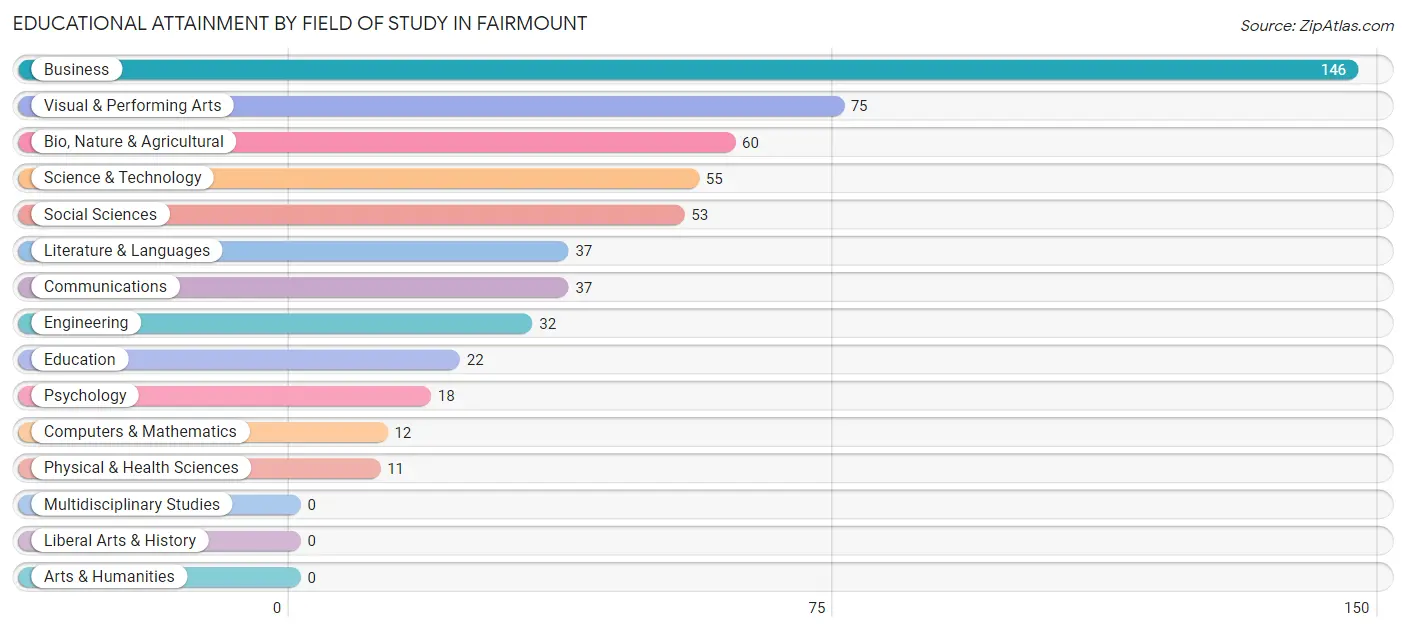
| Field of Study | # Graduates | % Graduates |
| Computers & Mathematics | 12 | 2.1% |
| Bio, Nature & Agricultural | 60 | 10.7% |
| Physical & Health Sciences | 11 | 2.0% |
| Psychology | 18 | 3.2% |
| Social Sciences | 53 | 9.5% |
| Engineering | 32 | 5.7% |
| Multidisciplinary Studies | 0 | 0.0% |
| Science & Technology | 55 | 9.9% |
| Business | 146 | 26.2% |
| Education | 22 | 3.9% |
| Literature & Languages | 37 | 6.6% |
| Liberal Arts & History | 0 | 0.0% |
| Visual & Performing Arts | 75 | 13.4% |
| Communications | 37 | 6.6% |
| Arts & Humanities | 0 | 0.0% |
| Total | 558 | 100.0% |
Transportation & Commute in Fairmount
Vehicle Availability by Sex in Fairmount
The most prevalent vehicle ownership categories in Fairmount are males with 2 vehicles (212, accounting for 61.3%) and females with 2 vehicles (132, making up 61.3%).
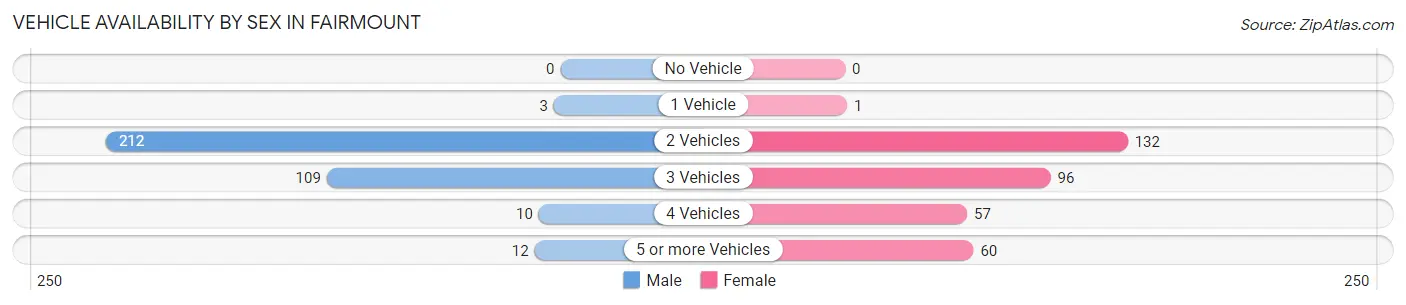
| Vehicles Available | Male | Female |
| No Vehicle | 0 (0.0%) | 0 (0.0%) |
| 1 Vehicle | 3 (0.9%) | 1 (0.3%) |
| 2 Vehicles | 212 (61.3%) | 132 (38.2%) |
| 3 Vehicles | 109 (31.5%) | 96 (27.8%) |
| 4 Vehicles | 10 (2.9%) | 57 (16.5%) |
| 5 or more Vehicles | 12 (3.5%) | 60 (17.3%) |
| Total | 346 (100.0%) | 346 (100.0%) |
Commute Time in Fairmount
The most frequently occuring commute durations in Fairmount are 30 to 34 minutes (126 commuters, 21.8%), 20 to 24 minutes (105 commuters, 18.2%), and 45 to 59 minutes (76 commuters, 13.2%).
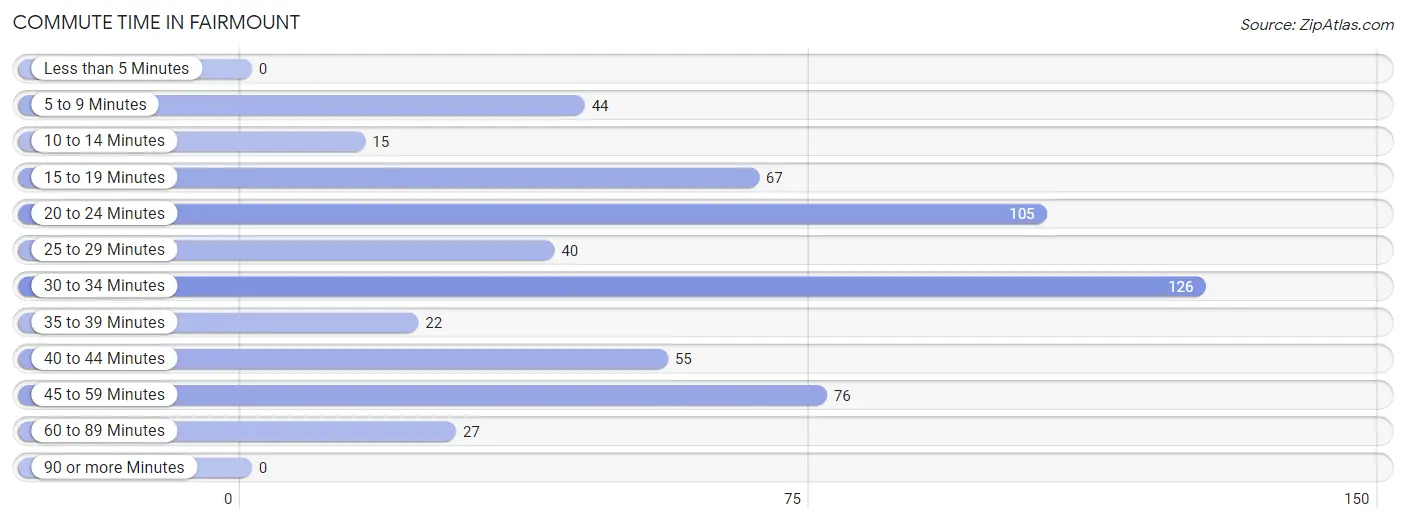
| Commute Time | # Commuters | % Commuters |
| Less than 5 Minutes | 0 | 0.0% |
| 5 to 9 Minutes | 44 | 7.6% |
| 10 to 14 Minutes | 15 | 2.6% |
| 15 to 19 Minutes | 67 | 11.6% |
| 20 to 24 Minutes | 105 | 18.2% |
| 25 to 29 Minutes | 40 | 6.9% |
| 30 to 34 Minutes | 126 | 21.8% |
| 35 to 39 Minutes | 22 | 3.8% |
| 40 to 44 Minutes | 55 | 9.5% |
| 45 to 59 Minutes | 76 | 13.2% |
| 60 to 89 Minutes | 27 | 4.7% |
| 90 or more Minutes | 0 | 0.0% |
Commute Time by Sex in Fairmount
The most common commute times in Fairmount are 45 to 59 minutes (76 commuters, 24.9%) for males and 30 to 34 minutes (98 commuters, 36.0%) for females.
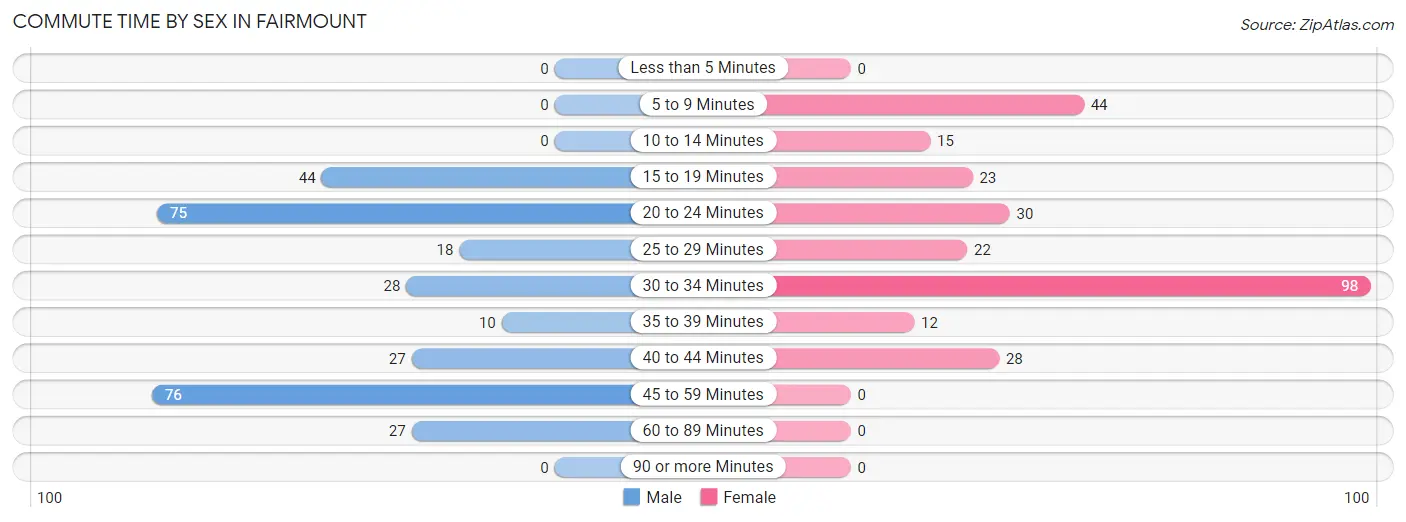
| Commute Time | Male | Female |
| Less than 5 Minutes | 0 (0.0%) | 0 (0.0%) |
| 5 to 9 Minutes | 0 (0.0%) | 44 (16.2%) |
| 10 to 14 Minutes | 0 (0.0%) | 15 (5.5%) |
| 15 to 19 Minutes | 44 (14.4%) | 23 (8.5%) |
| 20 to 24 Minutes | 75 (24.6%) | 30 (11.0%) |
| 25 to 29 Minutes | 18 (5.9%) | 22 (8.1%) |
| 30 to 34 Minutes | 28 (9.2%) | 98 (36.0%) |
| 35 to 39 Minutes | 10 (3.3%) | 12 (4.4%) |
| 40 to 44 Minutes | 27 (8.8%) | 28 (10.3%) |
| 45 to 59 Minutes | 76 (24.9%) | 0 (0.0%) |
| 60 to 89 Minutes | 27 (8.8%) | 0 (0.0%) |
| 90 or more Minutes | 0 (0.0%) | 0 (0.0%) |
Time of Departure to Work by Sex in Fairmount
The most frequent times of departure to work in Fairmount are 7:00 AM to 7:29 AM (85, 27.9%) for males and 8:30 AM to 8:59 AM (99, 36.4%) for females.
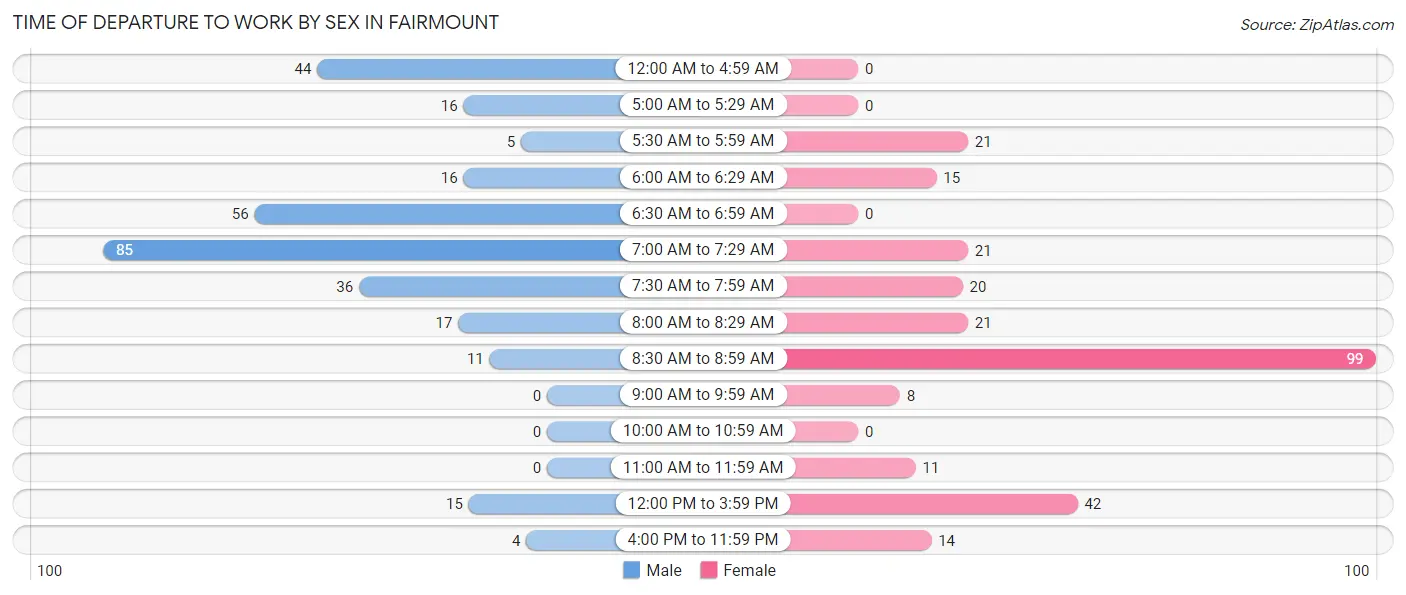
| Time of Departure | Male | Female |
| 12:00 AM to 4:59 AM | 44 (14.4%) | 0 (0.0%) |
| 5:00 AM to 5:29 AM | 16 (5.2%) | 0 (0.0%) |
| 5:30 AM to 5:59 AM | 5 (1.6%) | 21 (7.7%) |
| 6:00 AM to 6:29 AM | 16 (5.2%) | 15 (5.5%) |
| 6:30 AM to 6:59 AM | 56 (18.4%) | 0 (0.0%) |
| 7:00 AM to 7:29 AM | 85 (27.9%) | 21 (7.7%) |
| 7:30 AM to 7:59 AM | 36 (11.8%) | 20 (7.3%) |
| 8:00 AM to 8:29 AM | 17 (5.6%) | 21 (7.7%) |
| 8:30 AM to 8:59 AM | 11 (3.6%) | 99 (36.4%) |
| 9:00 AM to 9:59 AM | 0 (0.0%) | 8 (2.9%) |
| 10:00 AM to 10:59 AM | 0 (0.0%) | 0 (0.0%) |
| 11:00 AM to 11:59 AM | 0 (0.0%) | 11 (4.0%) |
| 12:00 PM to 3:59 PM | 15 (4.9%) | 42 (15.4%) |
| 4:00 PM to 11:59 PM | 4 (1.3%) | 14 (5.1%) |
| Total | 305 (100.0%) | 272 (100.0%) |
Housing Occupancy in Fairmount
Occupancy by Ownership in Fairmount
Of the total 638 dwellings in Fairmount, owner-occupied units account for 600 (94.0%), while renter-occupied units make up 38 (6.0%).
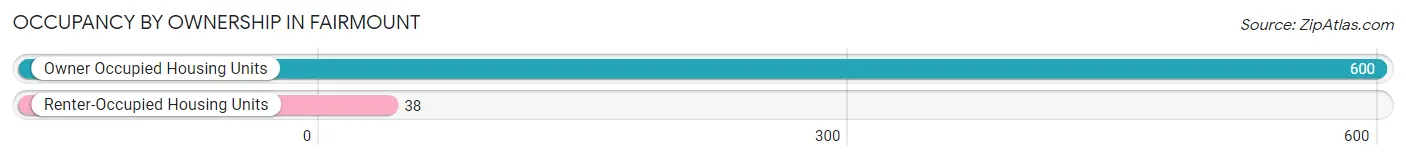
| Occupancy | # Housing Units | % Housing Units |
| Owner Occupied Housing Units | 600 | 94.0% |
| Renter-Occupied Housing Units | 38 | 6.0% |
| Total Occupied Housing Units | 638 | 100.0% |
Occupancy by Household Size in Fairmount
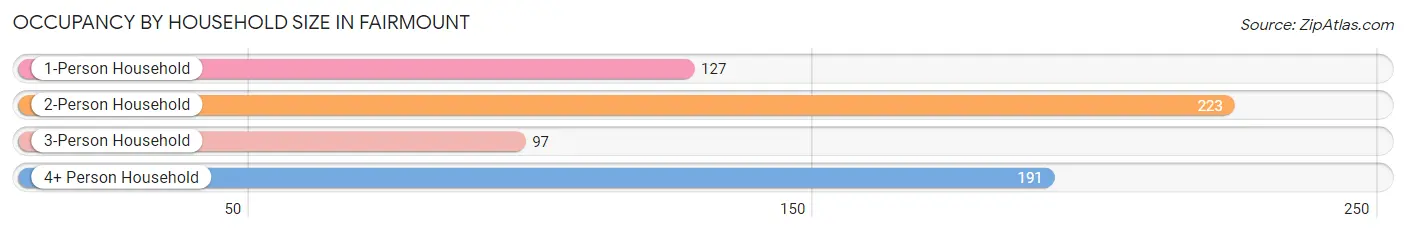
| Household Size | # Housing Units | % Housing Units |
| 1-Person Household | 127 | 19.9% |
| 2-Person Household | 223 | 34.9% |
| 3-Person Household | 97 | 15.2% |
| 4+ Person Household | 191 | 29.9% |
| Total Housing Units | 638 | 100.0% |
Occupancy by Ownership by Household Size in Fairmount
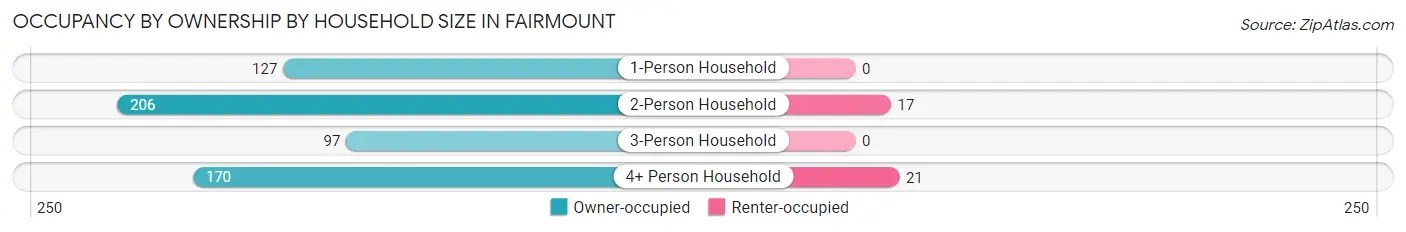
| Household Size | Owner-occupied | Renter-occupied |
| 1-Person Household | 127 (100.0%) | 0 (0.0%) |
| 2-Person Household | 206 (92.4%) | 17 (7.6%) |
| 3-Person Household | 97 (100.0%) | 0 (0.0%) |
| 4+ Person Household | 170 (89.0%) | 21 (11.0%) |
| Total Housing Units | 600 (94.0%) | 38 (6.0%) |
Occupancy by Educational Attainment in Fairmount
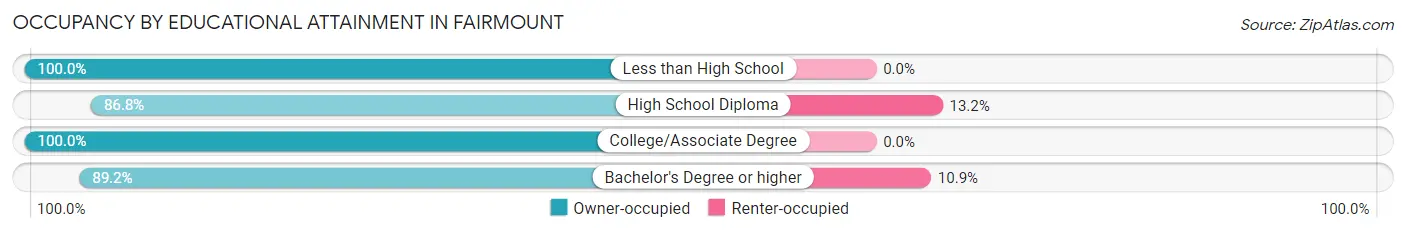
| Household Size | Owner-occupied | Renter-occupied |
| Less than High School | 76 (100.0%) | 0 (0.0%) |
| High School Diploma | 66 (86.8%) | 10 (13.2%) |
| College/Associate Degree | 228 (100.0%) | 0 (0.0%) |
| Bachelor's Degree or higher | 230 (89.1%) | 28 (10.8%) |
Occupancy by Age of Householder in Fairmount
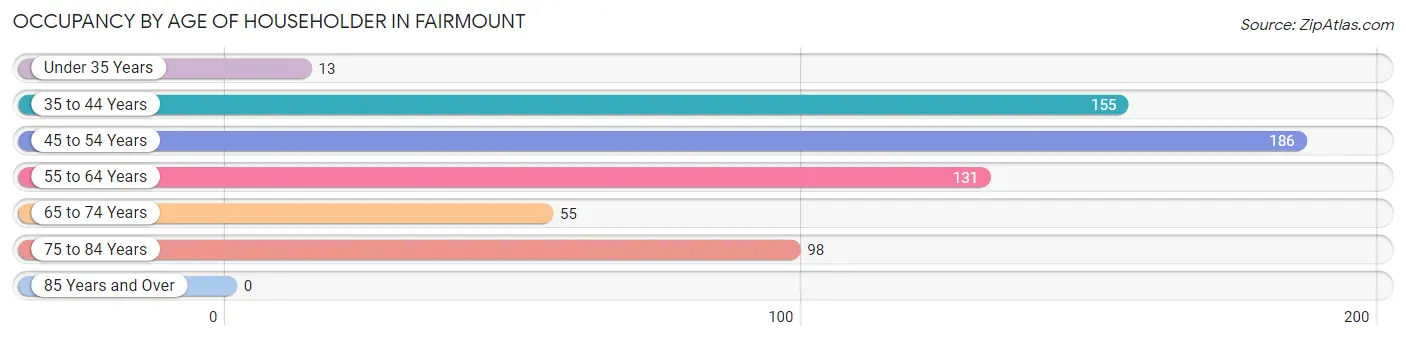
| Age Bracket | # Households | % Households |
| Under 35 Years | 13 | 2.0% |
| 35 to 44 Years | 155 | 24.3% |
| 45 to 54 Years | 186 | 29.1% |
| 55 to 64 Years | 131 | 20.5% |
| 65 to 74 Years | 55 | 8.6% |
| 75 to 84 Years | 98 | 15.4% |
| 85 Years and Over | 0 | 0.0% |
| Total | 638 | 100.0% |
Housing Finances in Fairmount
Median Income by Occupancy in Fairmount
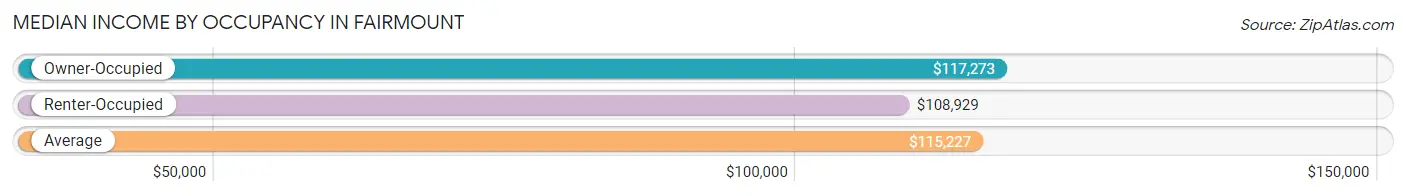
| Occupancy Type | # Households | Median Income |
| Owner-Occupied | 600 (94.0%) | $117,273 |
| Renter-Occupied | 38 (6.0%) | $108,929 |
| Average | 638 (100.0%) | $115,227 |
Occupancy by Householder Income Bracket in Fairmount
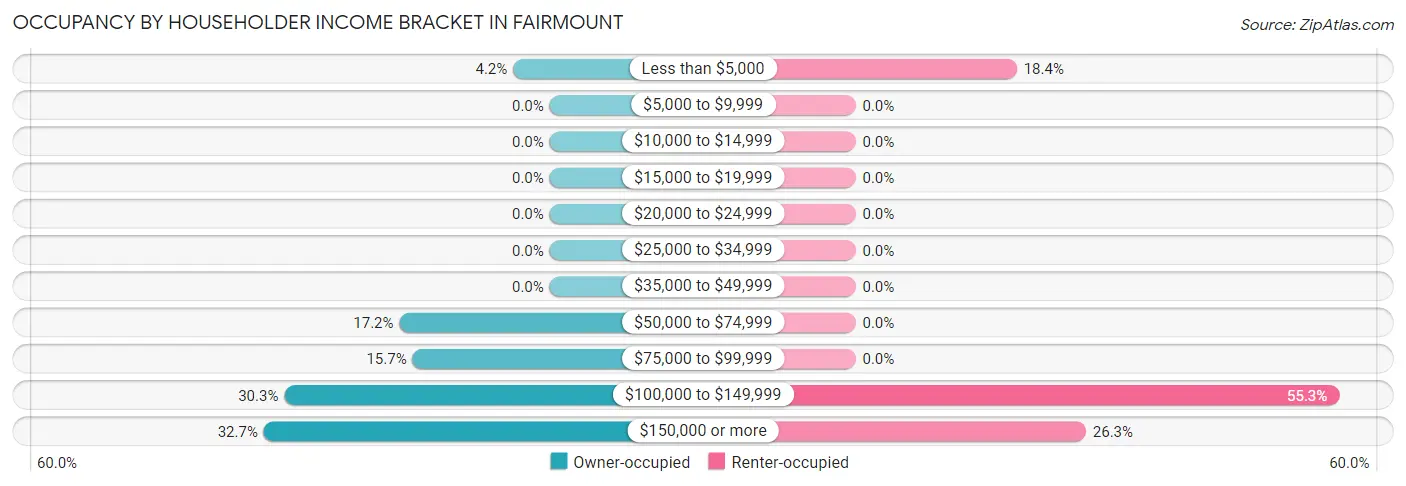
| Income Bracket | Owner-occupied | Renter-occupied |
| Less than $5,000 | 25 (4.2%) | 7 (18.4%) |
| $5,000 to $9,999 | 0 (0.0%) | 0 (0.0%) |
| $10,000 to $14,999 | 0 (0.0%) | 0 (0.0%) |
| $15,000 to $19,999 | 0 (0.0%) | 0 (0.0%) |
| $20,000 to $24,999 | 0 (0.0%) | 0 (0.0%) |
| $25,000 to $34,999 | 0 (0.0%) | 0 (0.0%) |
| $35,000 to $49,999 | 0 (0.0%) | 0 (0.0%) |
| $50,000 to $74,999 | 103 (17.2%) | 0 (0.0%) |
| $75,000 to $99,999 | 94 (15.7%) | 0 (0.0%) |
| $100,000 to $149,999 | 182 (30.3%) | 21 (55.3%) |
| $150,000 or more | 196 (32.7%) | 10 (26.3%) |
| Total | 600 (100.0%) | 38 (100.0%) |
Monthly Housing Cost Tiers in Fairmount
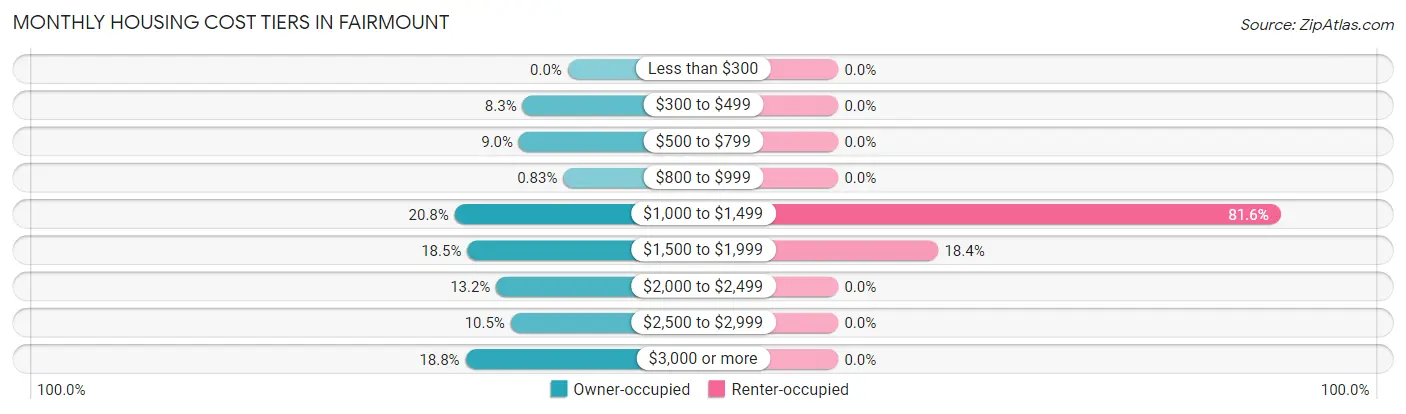
| Monthly Cost | Owner-occupied | Renter-occupied |
| Less than $300 | 0 (0.0%) | 0 (0.0%) |
| $300 to $499 | 50 (8.3%) | 0 (0.0%) |
| $500 to $799 | 54 (9.0%) | 0 (0.0%) |
| $800 to $999 | 5 (0.8%) | 0 (0.0%) |
| $1,000 to $1,499 | 125 (20.8%) | 31 (81.6%) |
| $1,500 to $1,999 | 111 (18.5%) | 7 (18.4%) |
| $2,000 to $2,499 | 79 (13.2%) | 0 (0.0%) |
| $2,500 to $2,999 | 63 (10.5%) | 0 (0.0%) |
| $3,000 or more | 113 (18.8%) | 0 (0.0%) |
| Total | 600 (100.0%) | 38 (100.0%) |
Physical Housing Characteristics in Fairmount
Housing Structures in Fairmount
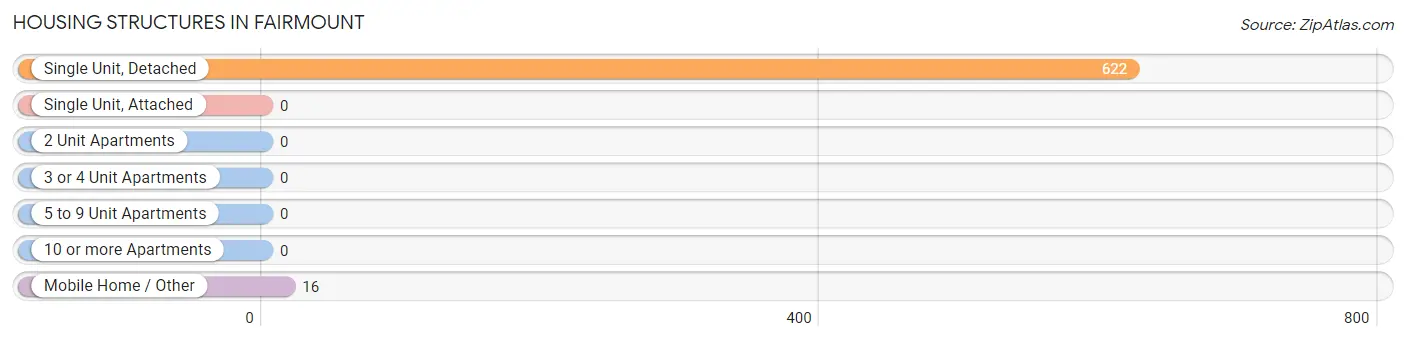
| Structure Type | # Housing Units | % Housing Units |
| Single Unit, Detached | 622 | 97.5% |
| Single Unit, Attached | 0 | 0.0% |
| 2 Unit Apartments | 0 | 0.0% |
| 3 or 4 Unit Apartments | 0 | 0.0% |
| 5 to 9 Unit Apartments | 0 | 0.0% |
| 10 or more Apartments | 0 | 0.0% |
| Mobile Home / Other | 16 | 2.5% |
| Total | 638 | 100.0% |
Housing Structures by Occupancy in Fairmount
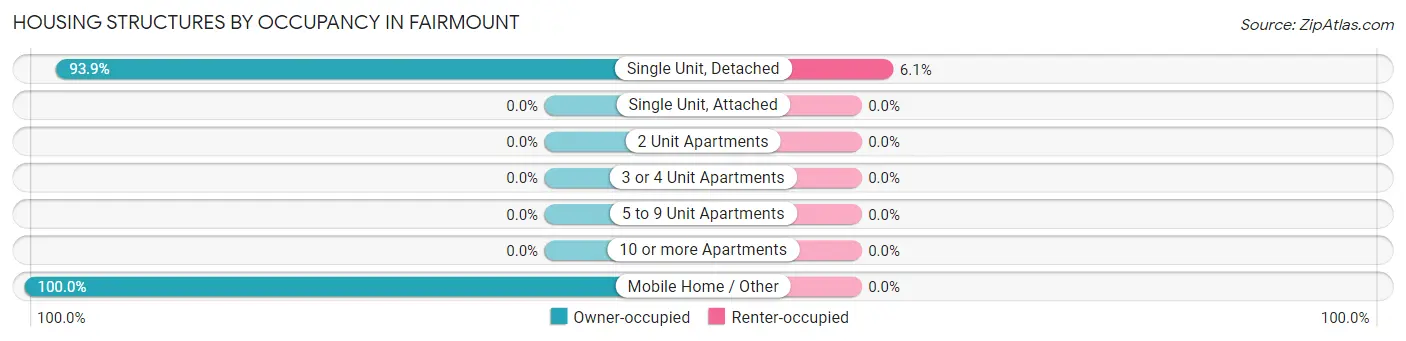
| Structure Type | Owner-occupied | Renter-occupied |
| Single Unit, Detached | 584 (93.9%) | 38 (6.1%) |
| Single Unit, Attached | 0 (0.0%) | 0 (0.0%) |
| 2 Unit Apartments | 0 (0.0%) | 0 (0.0%) |
| 3 or 4 Unit Apartments | 0 (0.0%) | 0 (0.0%) |
| 5 to 9 Unit Apartments | 0 (0.0%) | 0 (0.0%) |
| 10 or more Apartments | 0 (0.0%) | 0 (0.0%) |
| Mobile Home / Other | 16 (100.0%) | 0 (0.0%) |
| Total | 600 (94.0%) | 38 (6.0%) |
Housing Structures by Number of Rooms in Fairmount
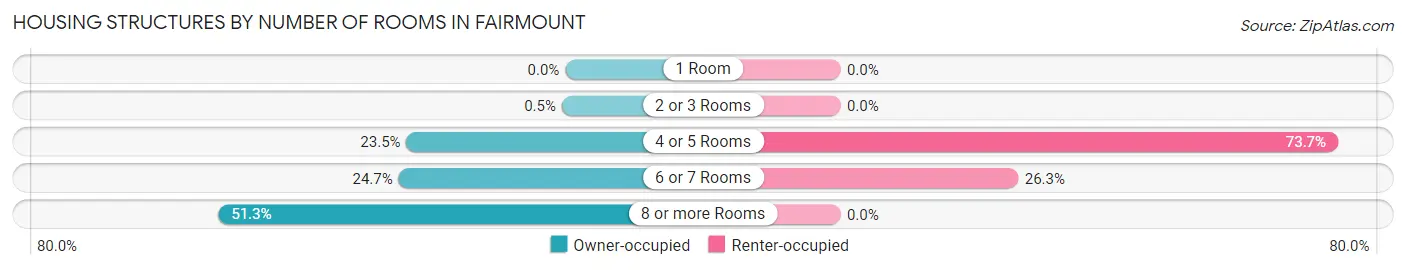
| Number of Rooms | Owner-occupied | Renter-occupied |
| 1 Room | 0 (0.0%) | 0 (0.0%) |
| 2 or 3 Rooms | 3 (0.5%) | 0 (0.0%) |
| 4 or 5 Rooms | 141 (23.5%) | 28 (73.7%) |
| 6 or 7 Rooms | 148 (24.7%) | 10 (26.3%) |
| 8 or more Rooms | 308 (51.3%) | 0 (0.0%) |
| Total | 600 (100.0%) | 38 (100.0%) |
Housing Structure by Heating Type in Fairmount
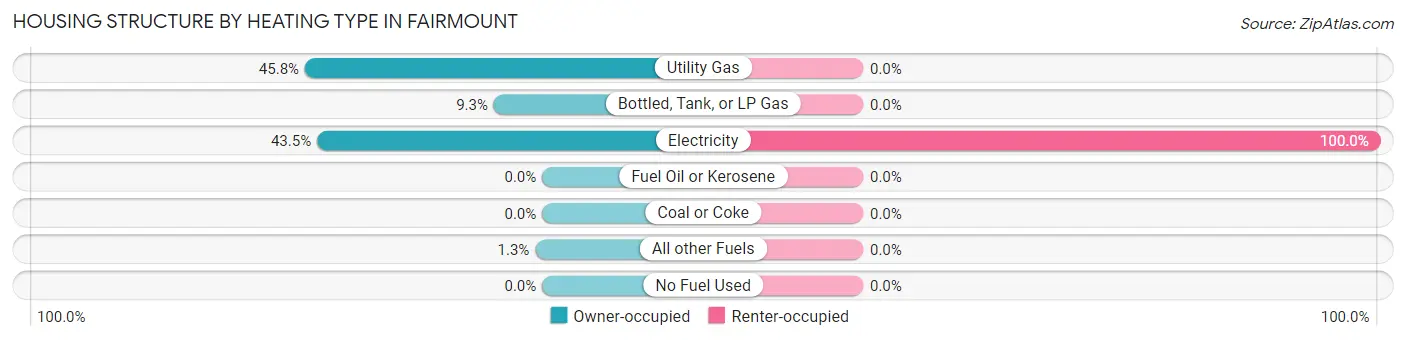
| Heating Type | Owner-occupied | Renter-occupied |
| Utility Gas | 275 (45.8%) | 0 (0.0%) |
| Bottled, Tank, or LP Gas | 56 (9.3%) | 0 (0.0%) |
| Electricity | 261 (43.5%) | 38 (100.0%) |
| Fuel Oil or Kerosene | 0 (0.0%) | 0 (0.0%) |
| Coal or Coke | 0 (0.0%) | 0 (0.0%) |
| All other Fuels | 8 (1.3%) | 0 (0.0%) |
| No Fuel Used | 0 (0.0%) | 0 (0.0%) |
| Total | 600 (100.0%) | 38 (100.0%) |
Household Vehicle Usage in Fairmount
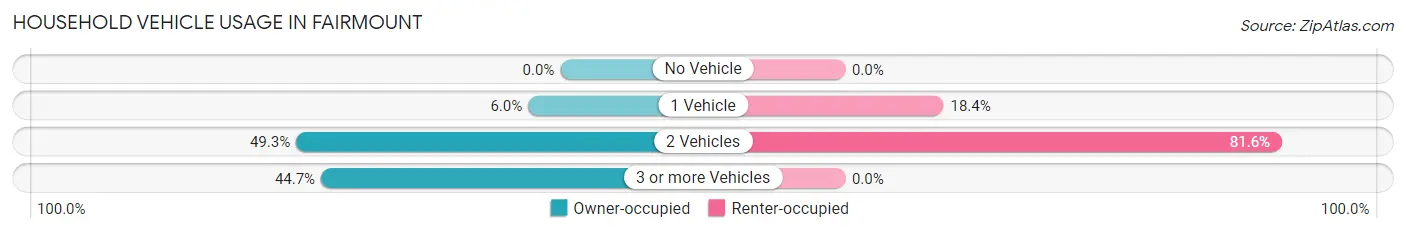
| Vehicles per Household | Owner-occupied | Renter-occupied |
| No Vehicle | 0 (0.0%) | 0 (0.0%) |
| 1 Vehicle | 36 (6.0%) | 7 (18.4%) |
| 2 Vehicles | 296 (49.3%) | 31 (81.6%) |
| 3 or more Vehicles | 268 (44.7%) | 0 (0.0%) |
| Total | 600 (100.0%) | 38 (100.0%) |
Real Estate & Mortgages in Fairmount
Real Estate and Mortgage Overview in Fairmount
| Characteristic | Without Mortgage | With Mortgage |
| Housing Units | 154 | 446 |
| Median Property Value | $290,600 | $536,600 |
| Median Household Income | $53,750 | $175 |
| Monthly Housing Costs | $577 | $113 |
| Real Estate Taxes | $1,957 | $20 |
Property Value by Mortgage Status in Fairmount
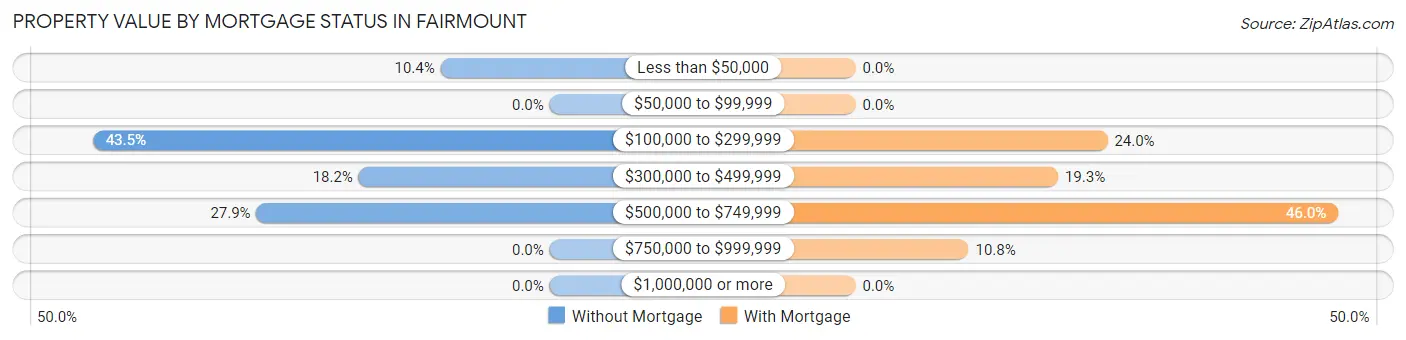
| Property Value | Without Mortgage | With Mortgage |
| Less than $50,000 | 16 (10.4%) | 0 (0.0%) |
| $50,000 to $99,999 | 0 (0.0%) | 0 (0.0%) |
| $100,000 to $299,999 | 67 (43.5%) | 107 (24.0%) |
| $300,000 to $499,999 | 28 (18.2%) | 86 (19.3%) |
| $500,000 to $749,999 | 43 (27.9%) | 205 (46.0%) |
| $750,000 to $999,999 | 0 (0.0%) | 48 (10.8%) |
| $1,000,000 or more | 0 (0.0%) | 0 (0.0%) |
| Total | 154 (100.0%) | 446 (100.0%) |
Household Income by Mortgage Status in Fairmount
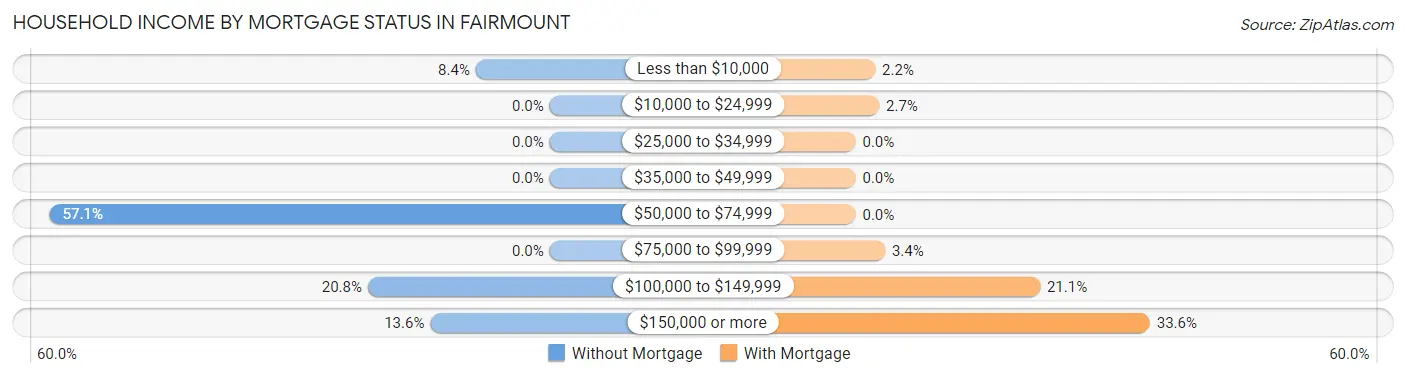
| Household Income | Without Mortgage | With Mortgage |
| Less than $10,000 | 13 (8.4%) | 10 (2.2%) |
| $10,000 to $24,999 | 0 (0.0%) | 12 (2.7%) |
| $25,000 to $34,999 | 0 (0.0%) | 0 (0.0%) |
| $35,000 to $49,999 | 0 (0.0%) | 0 (0.0%) |
| $50,000 to $74,999 | 88 (57.1%) | 0 (0.0%) |
| $75,000 to $99,999 | 0 (0.0%) | 15 (3.4%) |
| $100,000 to $149,999 | 32 (20.8%) | 94 (21.1%) |
| $150,000 or more | 21 (13.6%) | 150 (33.6%) |
| Total | 154 (100.0%) | 446 (100.0%) |
Property Value to Household Income Ratio in Fairmount
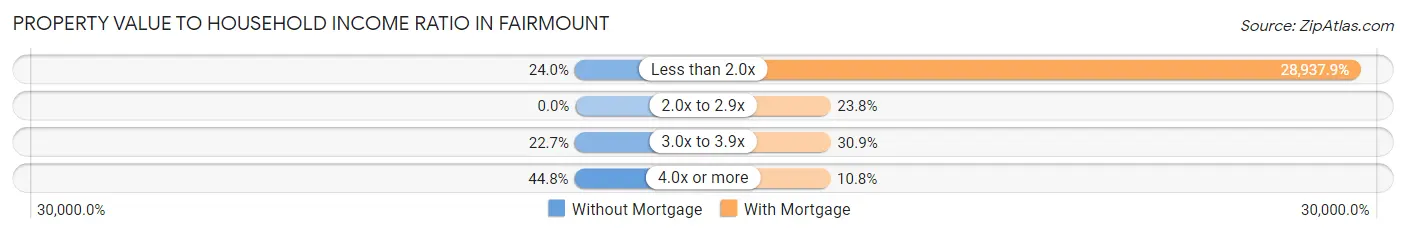
| Value-to-Income Ratio | Without Mortgage | With Mortgage |
| Less than 2.0x | 37 (24.0%) | 129,063 (28,937.9%) |
| 2.0x to 2.9x | 0 (0.0%) | 106 (23.8%) |
| 3.0x to 3.9x | 35 (22.7%) | 138 (30.9%) |
| 4.0x or more | 69 (44.8%) | 48 (10.8%) |
| Total | 154 (100.0%) | 446 (100.0%) |
Real Estate Taxes by Mortgage Status in Fairmount
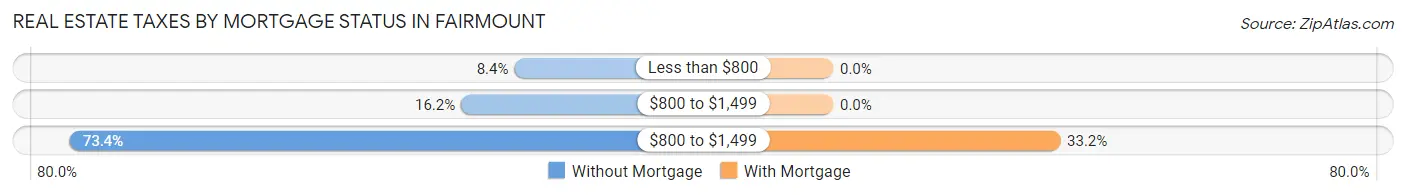
| Property Taxes | Without Mortgage | With Mortgage |
| Less than $800 | 13 (8.4%) | 0 (0.0%) |
| $800 to $1,499 | 25 (16.2%) | 0 (0.0%) |
| $800 to $1,499 | 113 (73.4%) | 148 (33.2%) |
| Total | 154 (100.0%) | 446 (100.0%) |
Health & Disability in Fairmount
Health Insurance Coverage by Age in Fairmount
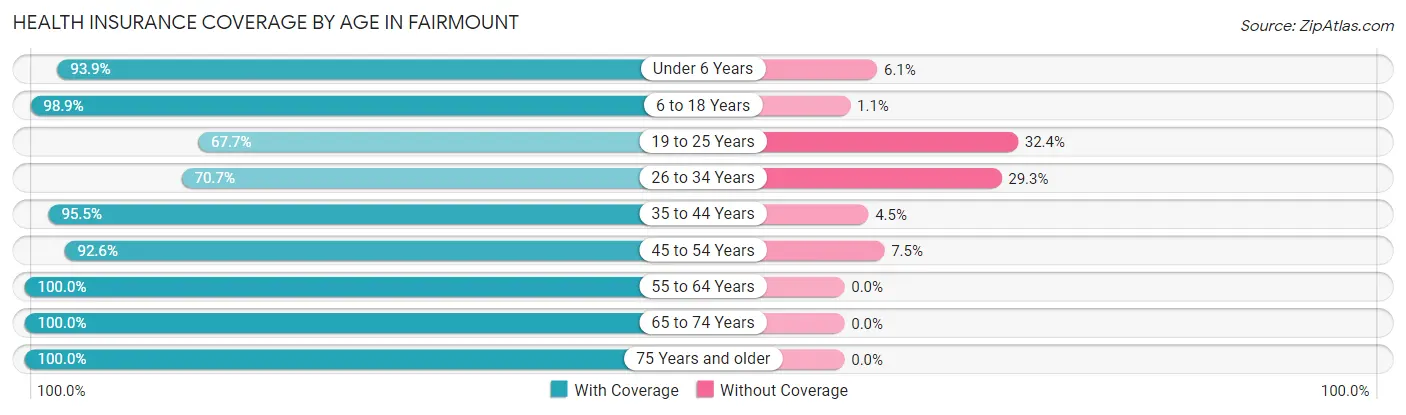
| Age Bracket | With Coverage | Without Coverage |
| Under 6 Years | 169 (93.9%) | 11 (6.1%) |
| 6 to 18 Years | 367 (98.9%) | 4 (1.1%) |
| 19 to 25 Years | 23 (67.6%) | 11 (32.4%) |
| 26 to 34 Years | 29 (70.7%) | 12 (29.3%) |
| 35 to 44 Years | 257 (95.5%) | 12 (4.5%) |
| 45 to 54 Years | 298 (92.5%) | 24 (7.4%) |
| 55 to 64 Years | 207 (100.0%) | 0 (0.0%) |
| 65 to 74 Years | 173 (100.0%) | 0 (0.0%) |
| 75 Years and older | 150 (100.0%) | 0 (0.0%) |
| Total | 1,673 (95.8%) | 74 (4.2%) |
Health Insurance Coverage by Citizenship Status in Fairmount
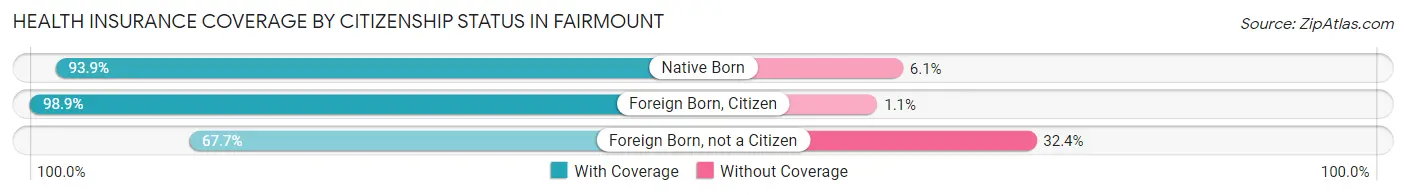
| Citizenship Status | With Coverage | Without Coverage |
| Native Born | 169 (93.9%) | 11 (6.1%) |
| Foreign Born, Citizen | 367 (98.9%) | 4 (1.1%) |
| Foreign Born, not a Citizen | 23 (67.6%) | 11 (32.4%) |
Health Insurance Coverage by Household Income in Fairmount
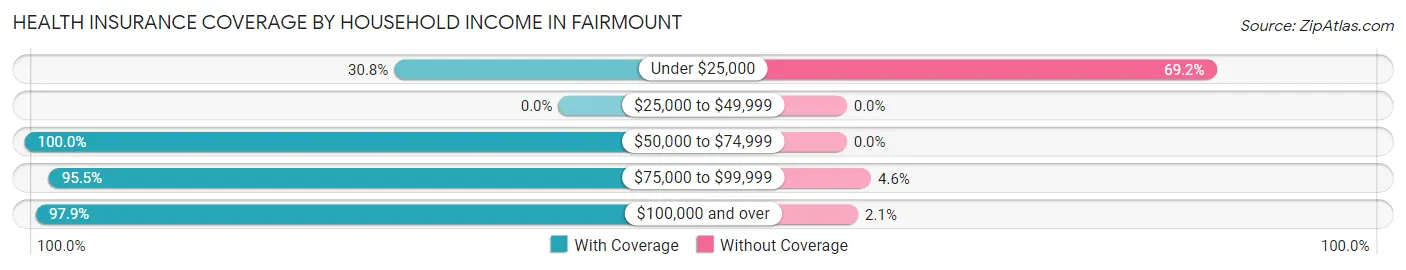
| Household Income | With Coverage | Without Coverage |
| Under $25,000 | 16 (30.8%) | 36 (69.2%) |
| $25,000 to $49,999 | 0 (0.0%) | 0 (0.0%) |
| $50,000 to $74,999 | 209 (100.0%) | 0 (0.0%) |
| $75,000 to $99,999 | 252 (95.5%) | 12 (4.5%) |
| $100,000 and over | 1,196 (97.9%) | 26 (2.1%) |
Public vs Private Health Insurance Coverage by Age in Fairmount
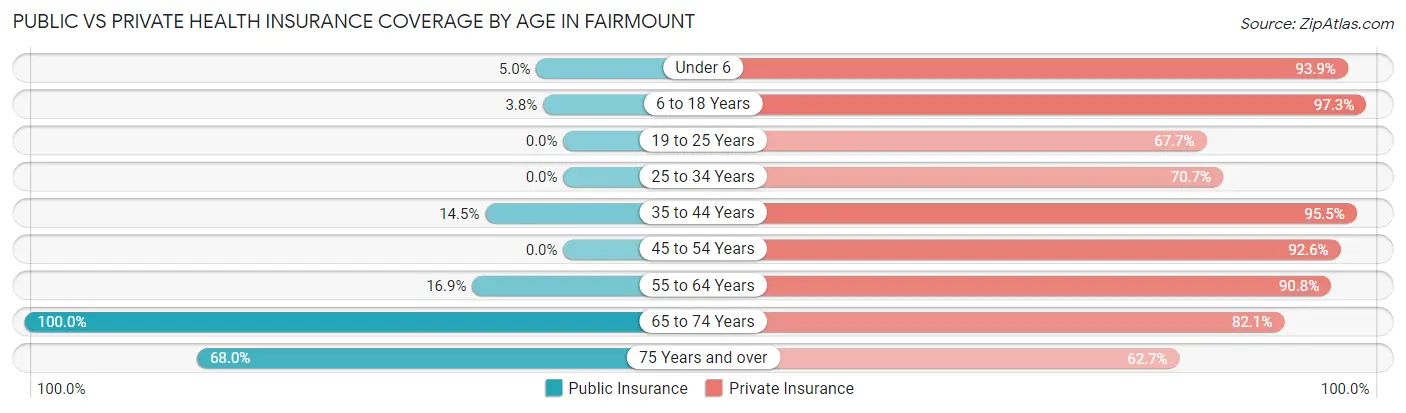
| Age Bracket | Public Insurance | Private Insurance |
| Under 6 | 9 (5.0%) | 169 (93.9%) |
| 6 to 18 Years | 14 (3.8%) | 361 (97.3%) |
| 19 to 25 Years | 0 (0.0%) | 23 (67.6%) |
| 25 to 34 Years | 0 (0.0%) | 29 (70.7%) |
| 35 to 44 Years | 39 (14.5%) | 257 (95.5%) |
| 45 to 54 Years | 0 (0.0%) | 298 (92.5%) |
| 55 to 64 Years | 35 (16.9%) | 188 (90.8%) |
| 65 to 74 Years | 173 (100.0%) | 142 (82.1%) |
| 75 Years and over | 102 (68.0%) | 94 (62.7%) |
| Total | 372 (21.3%) | 1,561 (89.3%) |
Disability Status by Sex by Age in Fairmount
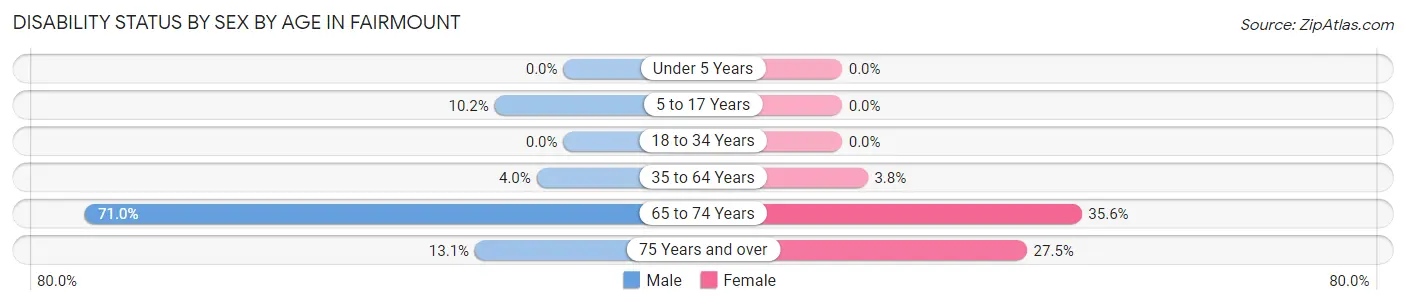
| Age Bracket | Male | Female |
| Under 5 Years | 0 (0.0%) | 0 (0.0%) |
| 5 to 17 Years | 23 (10.2%) | 0 (0.0%) |
| 18 to 34 Years | 0 (0.0%) | 0 (0.0%) |
| 35 to 64 Years | 15 (4.0%) | 16 (3.8%) |
| 65 to 74 Years | 49 (71.0%) | 37 (35.6%) |
| 75 Years and over | 13 (13.1%) | 14 (27.5%) |
Disability Class by Sex by Age in Fairmount
Disability Class: Hearing Difficulty
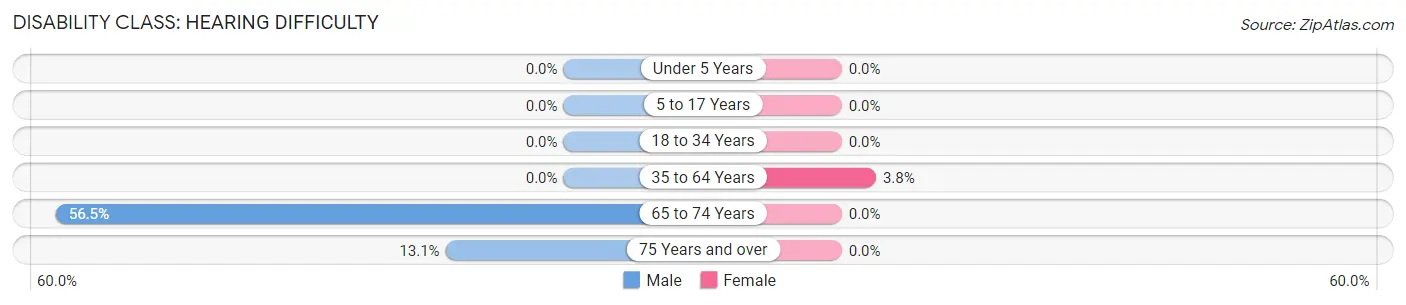
| Age Bracket | Male | Female |
| Under 5 Years | 0 (0.0%) | 0 (0.0%) |
| 5 to 17 Years | 0 (0.0%) | 0 (0.0%) |
| 18 to 34 Years | 0 (0.0%) | 0 (0.0%) |
| 35 to 64 Years | 0 (0.0%) | 16 (3.8%) |
| 65 to 74 Years | 39 (56.5%) | 0 (0.0%) |
| 75 Years and over | 13 (13.1%) | 0 (0.0%) |
Disability Class: Vision Difficulty
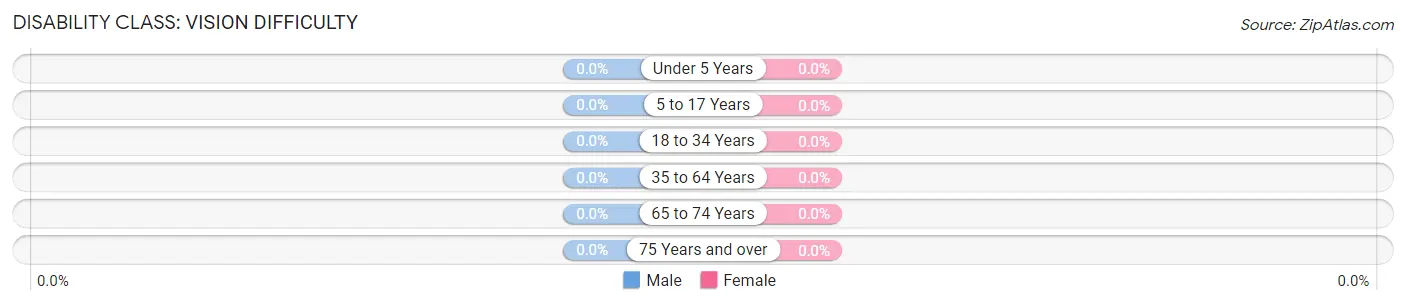
| Age Bracket | Male | Female |
| Under 5 Years | 0 (0.0%) | 0 (0.0%) |
| 5 to 17 Years | 0 (0.0%) | 0 (0.0%) |
| 18 to 34 Years | 0 (0.0%) | 0 (0.0%) |
| 35 to 64 Years | 0 (0.0%) | 0 (0.0%) |
| 65 to 74 Years | 0 (0.0%) | 0 (0.0%) |
| 75 Years and over | 0 (0.0%) | 0 (0.0%) |
Disability Class: Cognitive Difficulty
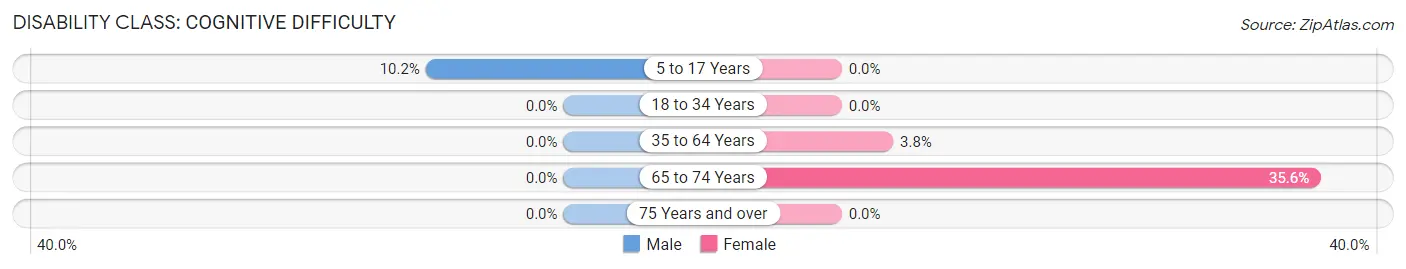
| Age Bracket | Male | Female |
| 5 to 17 Years | 23 (10.2%) | 0 (0.0%) |
| 18 to 34 Years | 0 (0.0%) | 0 (0.0%) |
| 35 to 64 Years | 0 (0.0%) | 16 (3.8%) |
| 65 to 74 Years | 0 (0.0%) | 37 (35.6%) |
| 75 Years and over | 0 (0.0%) | 0 (0.0%) |
Disability Class: Ambulatory Difficulty
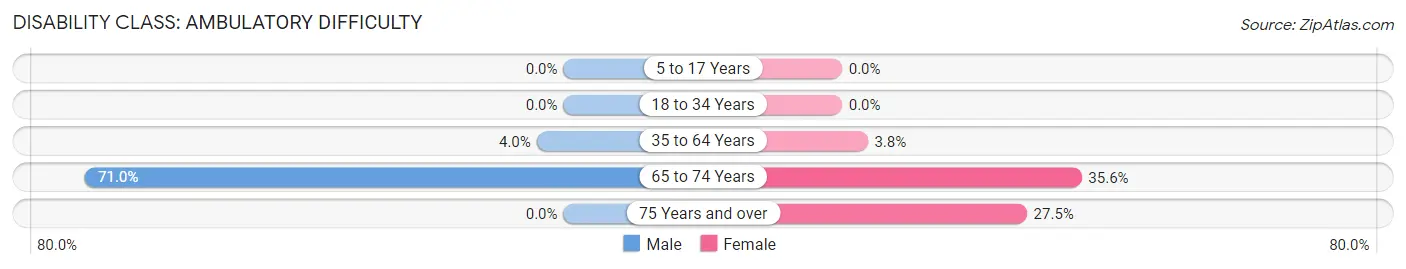
| Age Bracket | Male | Female |
| 5 to 17 Years | 0 (0.0%) | 0 (0.0%) |
| 18 to 34 Years | 0 (0.0%) | 0 (0.0%) |
| 35 to 64 Years | 15 (4.0%) | 16 (3.8%) |
| 65 to 74 Years | 49 (71.0%) | 37 (35.6%) |
| 75 Years and over | 0 (0.0%) | 14 (27.5%) |
Disability Class: Self-Care Difficulty
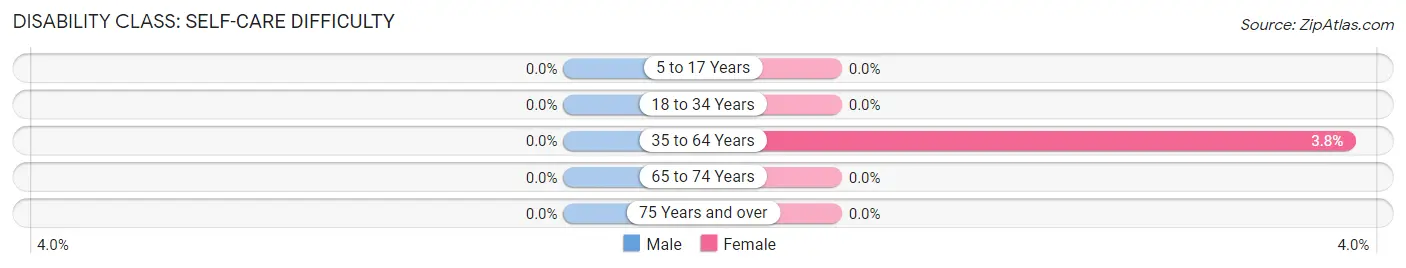
| Age Bracket | Male | Female |
| 5 to 17 Years | 0 (0.0%) | 0 (0.0%) |
| 18 to 34 Years | 0 (0.0%) | 0 (0.0%) |
| 35 to 64 Years | 0 (0.0%) | 16 (3.8%) |
| 65 to 74 Years | 0 (0.0%) | 0 (0.0%) |
| 75 Years and over | 0 (0.0%) | 0 (0.0%) |
Technology Access in Fairmount
Computing Device Access in Fairmount
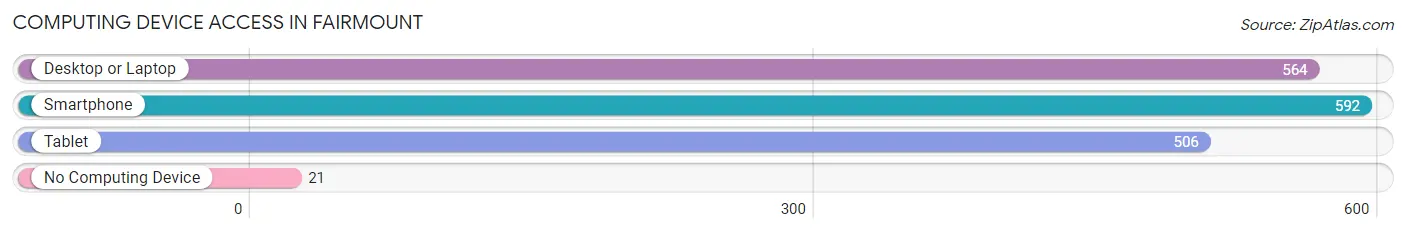
| Device Type | # Households | % Households |
| Desktop or Laptop | 564 | 88.4% |
| Smartphone | 592 | 92.8% |
| Tablet | 506 | 79.3% |
| No Computing Device | 21 | 3.3% |
| Total | 638 | 100.0% |
Internet Access in Fairmount
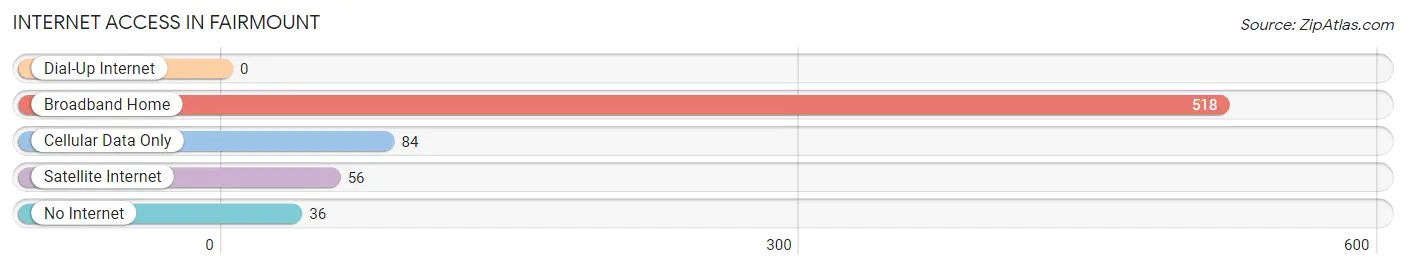
| Internet Type | # Households | % Households |
| Dial-Up Internet | 0 | 0.0% |
| Broadband Home | 518 | 81.2% |
| Cellular Data Only | 84 | 13.2% |
| Satellite Internet | 56 | 8.8% |
| No Internet | 36 | 5.6% |
| Total | 638 | 100.0% |
Fairmount Summary
History
The small town of Fairmount, Tennessee is located in the eastern part of the state, in the foothills of the Appalachian Mountains. It is situated in Marion County, and is part of the Chattanooga metropolitan area. The town was founded in 1820 by a group of settlers from North Carolina, and was originally known as Fairmount Springs. The town was named after the nearby Fairmount Springs, which were believed to have healing properties.
The town grew slowly over the years, and by the late 19th century, it had become a popular destination for tourists. The town was known for its mineral springs, which were believed to have healing properties. The town also had a number of hotels and resorts, which attracted visitors from all over the country.
In the early 20th century, the town began to decline as the popularity of the mineral springs began to wane. The Great Depression also had a negative impact on the town, and many of the businesses and hotels closed. However, the town was able to survive, and by the 1950s, it had become a popular destination for tourists once again.
Geography
Fairmount is located in the eastern part of Tennessee, in the foothills of the Appalachian Mountains. It is situated in Marion County, and is part of the Chattanooga metropolitan area. The town is located at the intersection of US Highway 41 and State Route 28. The town is surrounded by the Sequatchie Valley, which is a large valley that stretches from the Cumberland Plateau to the Tennessee River.
The town is located at an elevation of 1,000 feet above sea level, and the surrounding area is mostly hilly and forested. The town is located near the Sequatchie River, which is a tributary of the Tennessee River. The town is also located near the Cherokee National Forest, which is a large forested area that covers much of the eastern part of the state.
Economy
The economy of Fairmount is largely based on tourism. The town is known for its mineral springs, which are believed to have healing properties. The town also has a number of hotels and resorts, which attract visitors from all over the country. The town also has a number of antique stores, which attract visitors looking for unique items.
The town also has a number of manufacturing businesses, which produce a variety of products, including furniture, clothing, and automotive parts. The town also has a number of small businesses, which provide services to the local community.
Demographics
As of the 2010 census, the population of Fairmount was 1,845. The town has a total area of 2.2 square miles, and the population density is 830.7 people per square mile. The median age of the population is 44.7 years, and the median household income is $37,917.
The racial makeup of the town is 97.2% White, 0.7% African American, 0.2% Native American, 0.2% Asian, 0.1% Pacific Islander, 0.7% from other races, and 0.9% from two or more races. The town has a large number of Hispanic and Latino residents, making up 4.2% of the population.
Conclusion
Fairmount, Tennessee is a small town located in the eastern part of the state, in the foothills of the Appalachian Mountains. The town was founded in 1820, and has a long history of tourism and mineral springs. The town has a population of 1,845, and the economy is largely based on tourism and manufacturing. The town has a diverse population, with a large number of Hispanic and Latino residents.
Common Questions
What is Per Capita Income in Fairmount?
Per Capita income in Fairmount is $51,145.
What is the Median Family Income in Fairmount?
Median Family Income in Fairmount is $116,591.
What is the Median Household income in Fairmount?
Median Household Income in Fairmount is $115,227.
What is Income or Wage Gap in Fairmount?
Income or Wage Gap in Fairmount is 42.7%.
Women in Fairmount earn 57.3 cents for every dollar earned by a man.
What is Inequality or Gini Index in Fairmount?
Inequality or Gini Index in Fairmount is 0.35.
What is the Total Population of Fairmount?
Total Population of Fairmount is 1,747.
What is the Total Male Population of Fairmount?
Total Male Population of Fairmount is 869.
What is the Total Female Population of Fairmount?
Total Female Population of Fairmount is 878.
What is the Ratio of Males per 100 Females in Fairmount?
There are 98.97 Males per 100 Females in Fairmount.
What is the Ratio of Females per 100 Males in Fairmount?
There are 101.04 Females per 100 Males in Fairmount.
What is the Median Population Age in Fairmount?
Median Population Age in Fairmount is 43.2 Years.
What is the Average Family Size in Fairmount
Average Family Size in Fairmount is 3.2 People.
What is the Average Household Size in Fairmount
Average Household Size in Fairmount is 2.7 People.
How Large is the Labor Force in Fairmount?
There are 732 People in the Labor Forcein in Fairmount.
What is the Percentage of People in the Labor Force in Fairmount?
55.7% of People are in the Labor Force in Fairmount.
What is the Unemployment Rate in Fairmount?
Unemployment Rate in Fairmount is 3.3%.