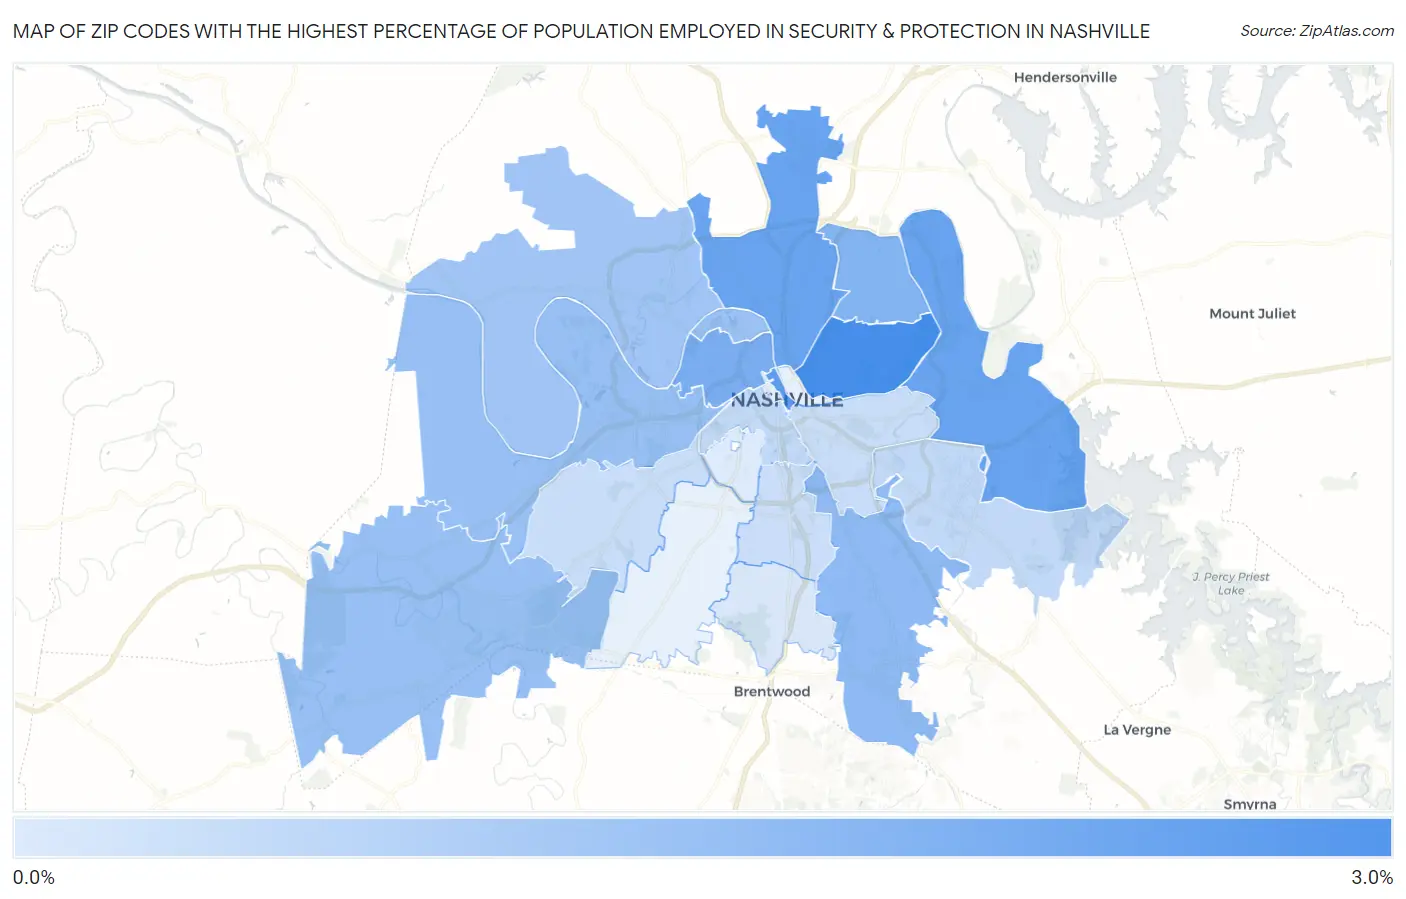
Zip Codes with the Highest Percentage of Population Employed in Security & Protection in Nashville, TN
RELATED REPORTS & OPTIONS
Security & Protection
Nashville
Compare Zip Codes
Map of Zip Codes with the Highest Percentage of Population Employed in Security & Protection in Nashville
0.24%
2.8%

Zip Codes with the Highest Percentage of Population Employed in Security & Protection in Nashville, TN
| Zip Code | % Employed | vs State | vs National | |
| 1. | 37206 | 2.8% | 2.1%(+0.677)#155 | 2.1%(+0.623)#8,237 |
| 2. | 37201 | 2.4% | 2.1%(+0.275)#210 | 2.1%(+0.220)#10,234 |
| 3. | 37214 | 2.2% | 2.1%(+0.105)#230 | 2.1%(+0.051)#11,262 |
| 4. | 37207 | 2.2% | 2.1%(+0.072)#234 | 2.1%(+0.017)#11,478 |
| 5. | 37208 | 1.9% | 2.1%(-0.204)#269 | 2.1%(-0.259)#13,303 |
| 6. | 37216 | 1.8% | 2.1%(-0.339)#292 | 2.1%(-0.393)#14,264 |
| 7. | 37211 | 1.5% | 2.1%(-0.558)#328 | 2.1%(-0.612)#15,903 |
| 8. | 37209 | 1.4% | 2.1%(-0.684)#339 | 2.1%(-0.738)#16,872 |
| 9. | 37221 | 1.4% | 2.1%(-0.696)#343 | 2.1%(-0.750)#16,965 |
| 10. | 37228 | 1.4% | 2.1%(-0.743)#353 | 2.1%(-0.798)#17,332 |
| 11. | 37218 | 1.2% | 2.1%(-0.855)#365 | 2.1%(-0.909)#18,208 |
| 12. | 37217 | 0.70% | 2.1%(-1.39)#439 | 2.1%(-1.45)#22,082 |
| 13. | 37203 | 0.70% | 2.1%(-1.39)#440 | 2.1%(-1.45)#22,101 |
| 14. | 37210 | 0.59% | 2.1%(-1.51)#454 | 2.1%(-1.56)#22,743 |
| 15. | 37205 | 0.57% | 2.1%(-1.52)#456 | 2.1%(-1.58)#22,822 |
| 16. | 37204 | 0.54% | 2.1%(-1.56)#462 | 2.1%(-1.61)#23,045 |
| 17. | 37220 | 0.31% | 2.1%(-1.78)#485 | 2.1%(-1.84)#24,134 |
| 18. | 37212 | 0.24% | 2.1%(-1.86)#494 | 2.1%(-1.91)#24,406 |
1
Common Questions
What are the Top 10 Zip Codes with the Highest Percentage of Population Employed in Security & Protection in Nashville, TN?
Top 10 Zip Codes with the Highest Percentage of Population Employed in Security & Protection in Nashville, TN are:
What zip code has the Highest Percentage of Population Employed in Security & Protection in Nashville, TN?
37206 has the Highest Percentage of Population Employed in Security & Protection in Nashville, TN with 2.8%.
What is the Percentage of Population Employed in Security & Protection in Nashville, TN?
Percentage of Population Employed in Security & Protection in Nashville is 1.5%.
What is the Percentage of Population Employed in Security & Protection in Tennessee?
Percentage of Population Employed in Security & Protection in Tennessee is 2.1%.
What is the Percentage of Population Employed in Security & Protection in the United States?
Percentage of Population Employed in Security & Protection in the United States is 2.1%.