Yorkville, TN Map & Demographics
Yorkville Map
Yorkville Overview
$39,253
PER CAPITA INCOME
$108,750
AVG FAMILY INCOME
$68,750
AVG HOUSEHOLD INCOME
19.6%
WAGE / INCOME GAP [ % ]
80.4¢/ $1
WAGE / INCOME GAP [ $ ]
0.46
INEQUALITY / GINI INDEX
311
TOTAL POPULATION
169
MALE POPULATION
142
FEMALE POPULATION
119.01
MALES / 100 FEMALES
84.02
FEMALES / 100 MALES
38.6
MEDIAN AGE
3.5
AVG FAMILY SIZE
2.8
AVG HOUSEHOLD SIZE
164
LABOR FORCE [ PEOPLE ]
67.8%
PERCENT IN LABOR FORCE
Yorkville Zip Codes
Yorkville Area Codes
Income in Yorkville
Income Overview in Yorkville
Per Capita Income in Yorkville is $39,253, while median incomes of families and households are $108,750 and $68,750 respectively.
| Characteristic | Number | Measure |
| Per Capita Income | 311 | $39,253 |
| Median Family Income | 78 | $108,750 |
| Mean Family Income | 78 | $135,677 |
| Median Household Income | 112 | $68,750 |
| Mean Household Income | 112 | $108,559 |
| Income Deficit | 78 | $0 |
| Wage / Income Gap (%) | 311 | 19.58% |
| Wage / Income Gap ($) | 311 | 80.42¢ per $1 |
| Gini / Inequality Index | 311 | 0.46 |
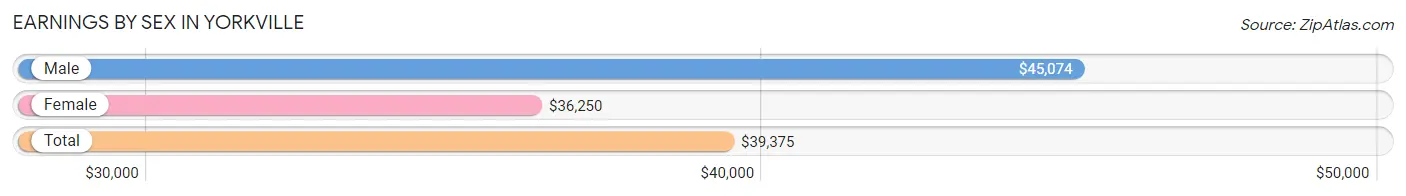
Earnings by Sex in Yorkville
Average Earnings in Yorkville are $39,375, $45,074 for men and $36,250 for women, a difference of 19.6%.
| Sex | Number | Average Earnings |
| Male | 107 (61.1%) | $45,074 |
| Female | 68 (38.9%) | $36,250 |
| Total | 175 (100.0%) | $39,375 |
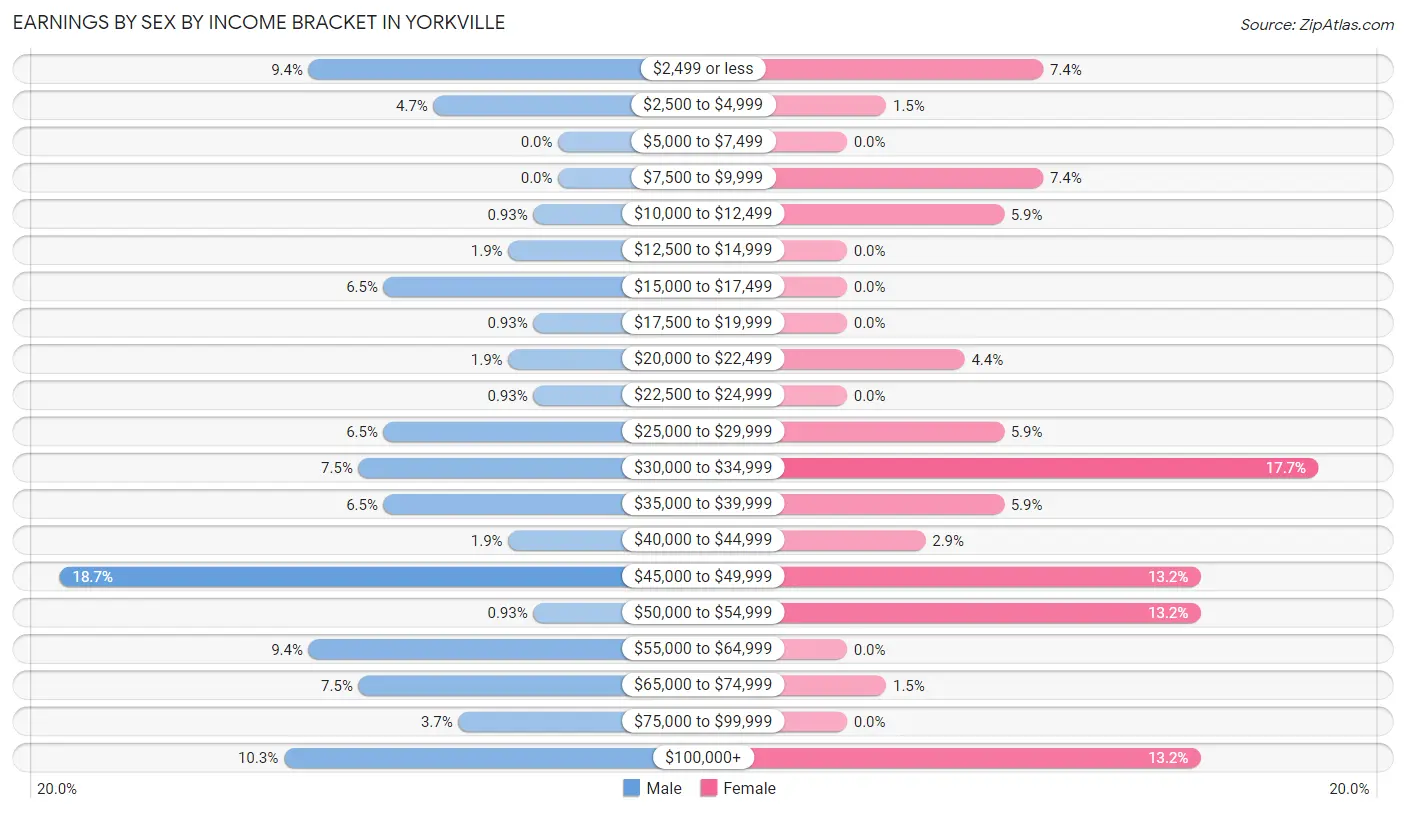
Earnings by Sex by Income Bracket in Yorkville
The most common earnings brackets in Yorkville are $45,000 to $49,999 for men (20 | 18.7%) and $30,000 to $34,999 for women (12 | 17.6%).
| Income | Male | Female |
| $2,499 or less | 10 (9.3%) | 5 (7.3%) |
| $2,500 to $4,999 | 5 (4.7%) | 1 (1.5%) |
| $5,000 to $7,499 | 0 (0.0%) | 0 (0.0%) |
| $7,500 to $9,999 | 0 (0.0%) | 5 (7.3%) |
| $10,000 to $12,499 | 1 (0.9%) | 4 (5.9%) |
| $12,500 to $14,999 | 2 (1.9%) | 0 (0.0%) |
| $15,000 to $17,499 | 7 (6.5%) | 0 (0.0%) |
| $17,500 to $19,999 | 1 (0.9%) | 0 (0.0%) |
| $20,000 to $22,499 | 2 (1.9%) | 3 (4.4%) |
| $22,500 to $24,999 | 1 (0.9%) | 0 (0.0%) |
| $25,000 to $29,999 | 7 (6.5%) | 4 (5.9%) |
| $30,000 to $34,999 | 8 (7.5%) | 12 (17.6%) |
| $35,000 to $39,999 | 7 (6.5%) | 4 (5.9%) |
| $40,000 to $44,999 | 2 (1.9%) | 2 (2.9%) |
| $45,000 to $49,999 | 20 (18.7%) | 9 (13.2%) |
| $50,000 to $54,999 | 1 (0.9%) | 9 (13.2%) |
| $55,000 to $64,999 | 10 (9.3%) | 0 (0.0%) |
| $65,000 to $74,999 | 8 (7.5%) | 1 (1.5%) |
| $75,000 to $99,999 | 4 (3.7%) | 0 (0.0%) |
| $100,000+ | 11 (10.3%) | 9 (13.2%) |
| Total | 107 (100.0%) | 68 (100.0%) |
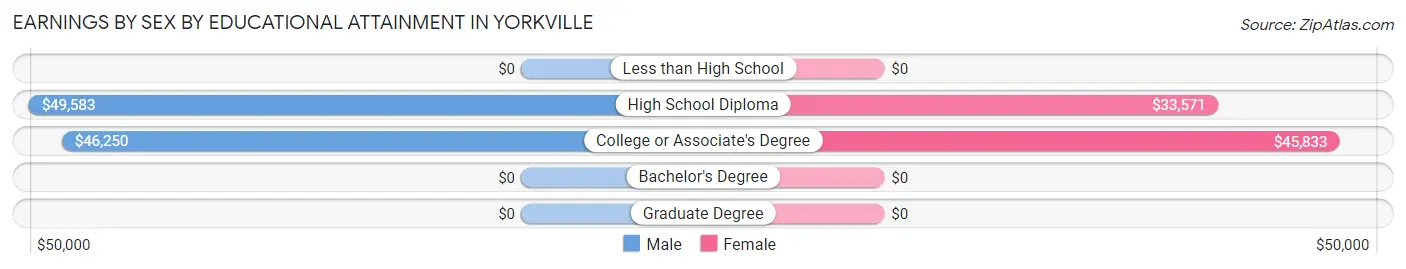
Earnings by Sex by Educational Attainment in Yorkville
Average earnings in Yorkville are $49,167 for men and $38,750 for women, a difference of 21.2%. Men with an educational attainment of high school diploma enjoy the highest average annual earnings of $49,583, while those with college or associate's degree education earn the least with $46,250. Women with an educational attainment of college or associate's degree earn the most with the average annual earnings of $45,833, while those with high school diploma education have the smallest earnings of $33,571.
| Educational Attainment | Male Income | Female Income |
| Less than High School | - | - |
| High School Diploma | $49,583 | $33,571 |
| College or Associate's Degree | $46,250 | $45,833 |
| Bachelor's Degree | - | - |
| Graduate Degree | - | - |
| Total | $49,167 | $38,750 |
Family Income in Yorkville
Family Income Brackets in Yorkville
According to the Yorkville family income data, there are 18 families falling into the $100,000 to $149,999 income range, which is the most common income bracket and makes up 23.1% of all families.
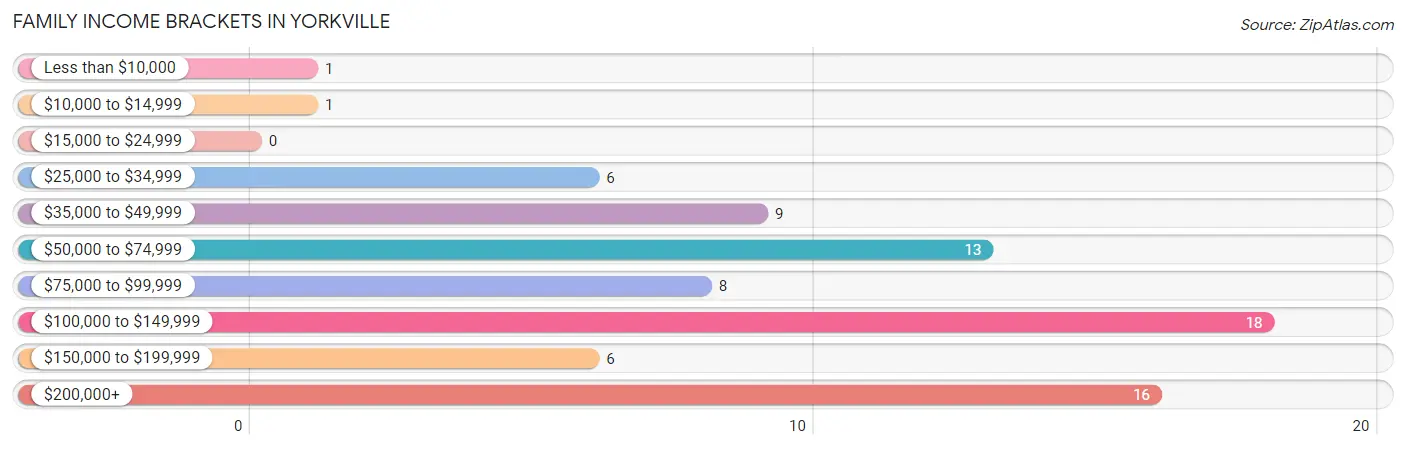
| Income Bracket | # Families | % Families |
| Less than $10,000 | 1 | 1.3% |
| $10,000 to $14,999 | 1 | 1.3% |
| $15,000 to $24,999 | 0 | 0.0% |
| $25,000 to $34,999 | 6 | 7.7% |
| $35,000 to $49,999 | 9 | 11.5% |
| $50,000 to $74,999 | 13 | 16.7% |
| $75,000 to $99,999 | 8 | 10.3% |
| $100,000 to $149,999 | 18 | 23.1% |
| $150,000 to $199,999 | 6 | 7.7% |
| $200,000+ | 16 | 20.5% |
Family Income by Famaliy Size in Yorkville
3-person families (20 | 25.6%) account for the highest median family income in Yorkville with $197,500 per family, while 3-person families (20 | 25.6%) have the highest median income of $65,833 per family member.
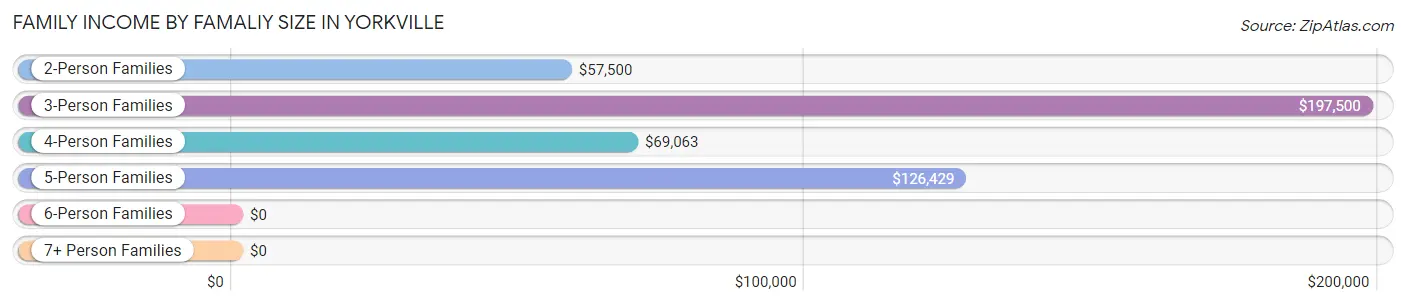
| Income Bracket | # Families | Median Income |
| 2-Person Families | 28 (35.9%) | $57,500 |
| 3-Person Families | 20 (25.6%) | $197,500 |
| 4-Person Families | 9 (11.5%) | $69,063 |
| 5-Person Families | 18 (23.1%) | $126,429 |
| 6-Person Families | 3 (3.8%) | $0 |
| 7+ Person Families | 0 (0.0%) | $0 |
| Total | 78 (100.0%) | $108,750 |
Family Income by Number of Earners in Yorkville
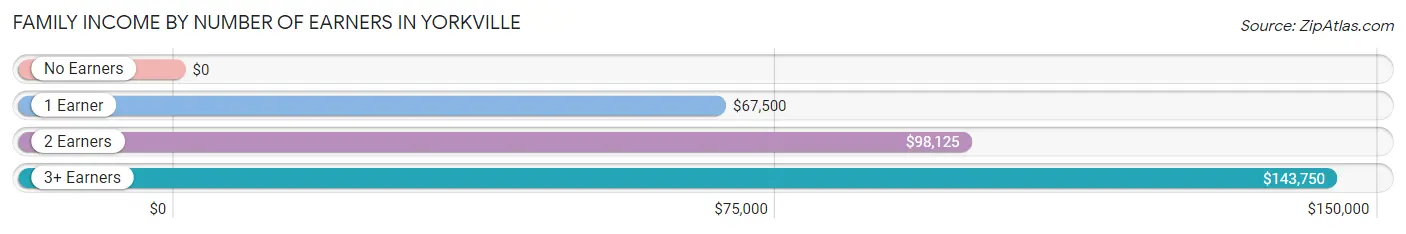
| Number of Earners | # Families | Median Income |
| No Earners | 10 (12.8%) | $0 |
| 1 Earner | 28 (35.9%) | $67,500 |
| 2 Earners | 11 (14.1%) | $98,125 |
| 3+ Earners | 29 (37.2%) | $143,750 |
| Total | 78 (100.0%) | $108,750 |
Household Income in Yorkville
Household Income Brackets in Yorkville
With 32 households falling in the category, the $50,000 to $74,999 income range is the most frequent in Yorkville, accounting for 28.6% of all households. In contrast, only 1 households (0.9%) fall into the less than $10,000 income bracket, making it the least populous group.
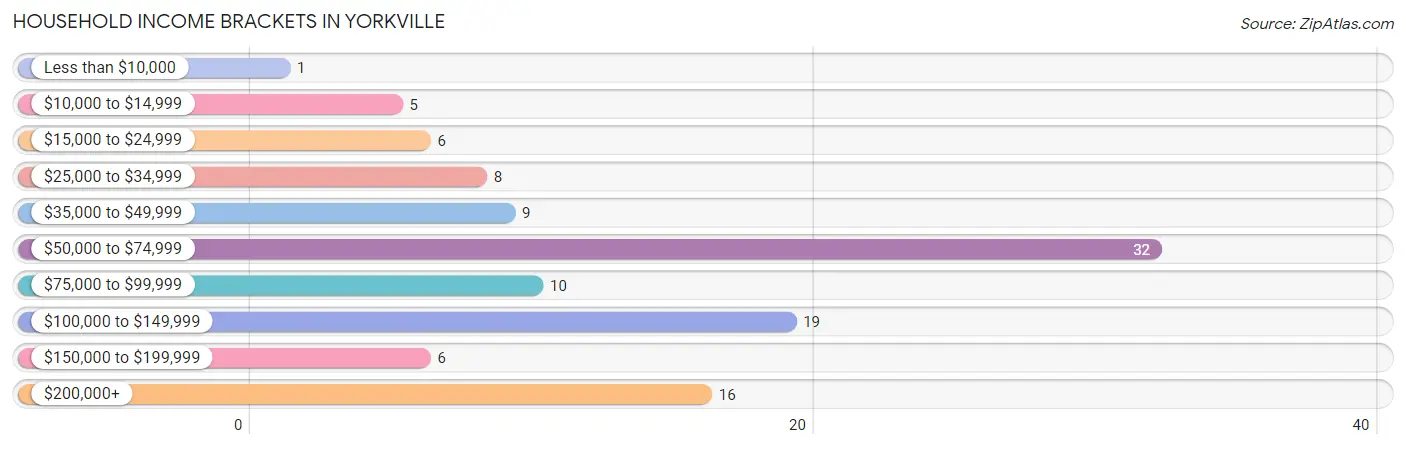
| Income Bracket | # Households | % Households |
| Less than $10,000 | 1 | 0.9% |
| $10,000 to $14,999 | 5 | 4.5% |
| $15,000 to $24,999 | 6 | 5.4% |
| $25,000 to $34,999 | 8 | 7.1% |
| $35,000 to $49,999 | 9 | 8.0% |
| $50,000 to $74,999 | 32 | 28.6% |
| $75,000 to $99,999 | 10 | 8.9% |
| $100,000 to $149,999 | 19 | 17.0% |
| $150,000 to $199,999 | 6 | 5.4% |
| $200,000+ | 16 | 14.3% |
Household Income by Householder Age in Yorkville
The median household income in Yorkville is $68,750, with the highest median household income of $88,750 found in the 45 to 64 years age bracket for the primary householder. A total of 40 households (35.7%) fall into this category.
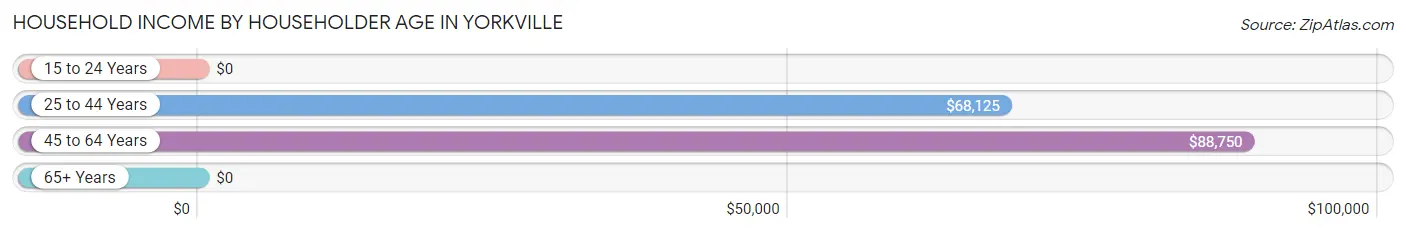
| Income Bracket | # Households | Median Income |
| 15 to 24 Years | 0 (0.0%) | $0 |
| 25 to 44 Years | 44 (39.3%) | $68,125 |
| 45 to 64 Years | 40 (35.7%) | $88,750 |
| 65+ Years | 28 (25.0%) | $0 |
| Total | 112 (100.0%) | $68,750 |
Poverty in Yorkville
Income Below Poverty by Sex and Age in Yorkville
With 1.2% poverty level for males and 4.9% for females among the residents of Yorkville, 65 to 74 year old males and 65 to 74 year old females are the most vulnerable to poverty, with 1 males (8.3%) and 4 females (26.7%) in their respective age groups living below the poverty level.
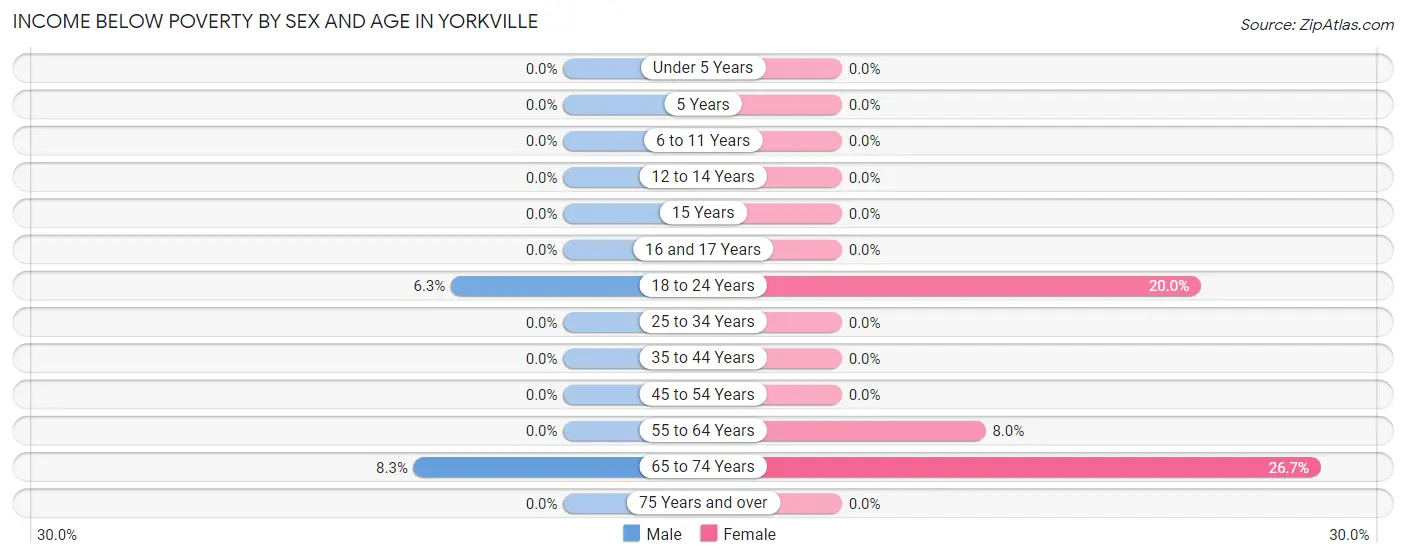
| Age Bracket | Male | Female |
| Under 5 Years | 0 (0.0%) | 0 (0.0%) |
| 5 Years | 0 (0.0%) | 0 (0.0%) |
| 6 to 11 Years | 0 (0.0%) | 0 (0.0%) |
| 12 to 14 Years | 0 (0.0%) | 0 (0.0%) |
| 15 Years | 0 (0.0%) | 0 (0.0%) |
| 16 and 17 Years | 0 (0.0%) | 0 (0.0%) |
| 18 to 24 Years | 1 (6.2%) | 1 (20.0%) |
| 25 to 34 Years | 0 (0.0%) | 0 (0.0%) |
| 35 to 44 Years | 0 (0.0%) | 0 (0.0%) |
| 45 to 54 Years | 0 (0.0%) | 0 (0.0%) |
| 55 to 64 Years | 0 (0.0%) | 2 (8.0%) |
| 65 to 74 Years | 1 (8.3%) | 4 (26.7%) |
| 75 Years and over | 0 (0.0%) | 0 (0.0%) |
| Total | 2 (1.2%) | 7 (4.9%) |
Income Above Poverty by Sex and Age in Yorkville
According to the poverty statistics in Yorkville, males aged 5 years and females aged 5 years are the age groups that are most secure financially, with 100.0% of males and 100.0% of females in these age groups living above the poverty line.
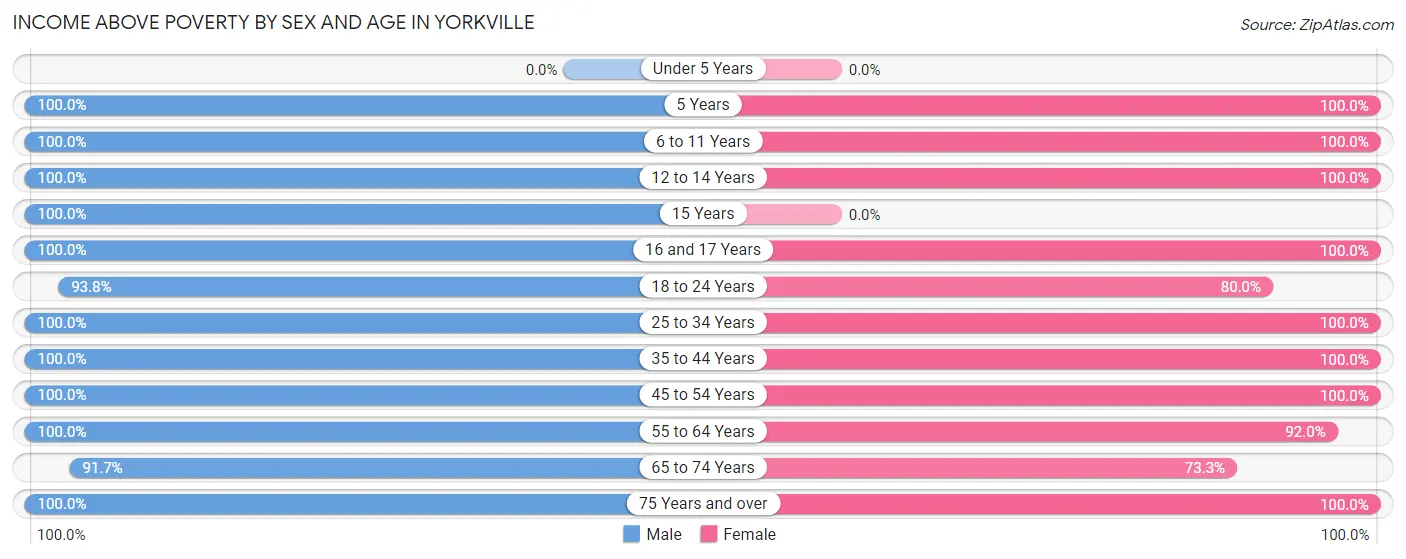
| Age Bracket | Male | Female |
| Under 5 Years | 0 (0.0%) | 0 (0.0%) |
| 5 Years | 2 (100.0%) | 4 (100.0%) |
| 6 to 11 Years | 7 (100.0%) | 10 (100.0%) |
| 12 to 14 Years | 12 (100.0%) | 22 (100.0%) |
| 15 Years | 12 (100.0%) | 0 (0.0%) |
| 16 and 17 Years | 24 (100.0%) | 6 (100.0%) |
| 18 to 24 Years | 15 (93.8%) | 4 (80.0%) |
| 25 to 34 Years | 2 (100.0%) | 8 (100.0%) |
| 35 to 44 Years | 37 (100.0%) | 24 (100.0%) |
| 45 to 54 Years | 16 (100.0%) | 15 (100.0%) |
| 55 to 64 Years | 20 (100.0%) | 23 (92.0%) |
| 65 to 74 Years | 11 (91.7%) | 11 (73.3%) |
| 75 Years and over | 9 (100.0%) | 8 (100.0%) |
| Total | 167 (98.8%) | 135 (95.1%) |
Income Below Poverty Among Married-Couple Families in Yorkville
The poverty statistics for married-couple families in Yorkville show that 1.6% or 1 of the total 64 families live below the poverty line. Families with no children have the highest poverty rate of 2.6%, comprising of 1 families. On the other hand, families with 1 or 2 children have the lowest poverty rate of 0.0%, which includes 0 families.
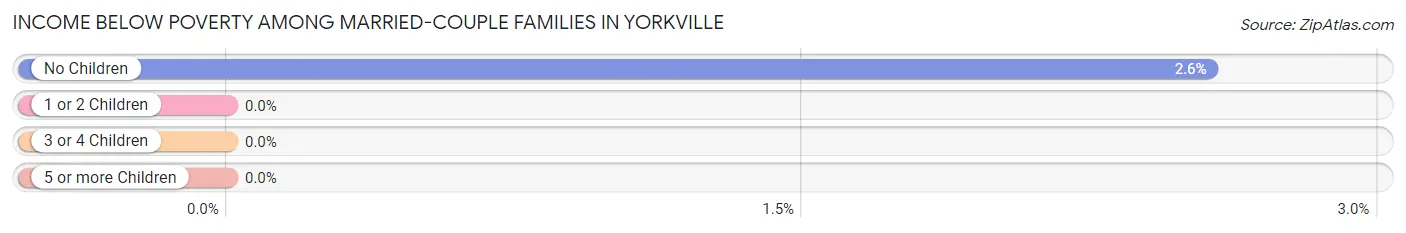
| Children | Above Poverty | Below Poverty |
| No Children | 38 (97.4%) | 1 (2.6%) |
| 1 or 2 Children | 10 (100.0%) | 0 (0.0%) |
| 3 or 4 Children | 15 (100.0%) | 0 (0.0%) |
| 5 or more Children | 0 (0.0%) | 0 (0.0%) |
| Total | 63 (98.4%) | 1 (1.6%) |
Income Below Poverty Among Single-Parent Households in Yorkville
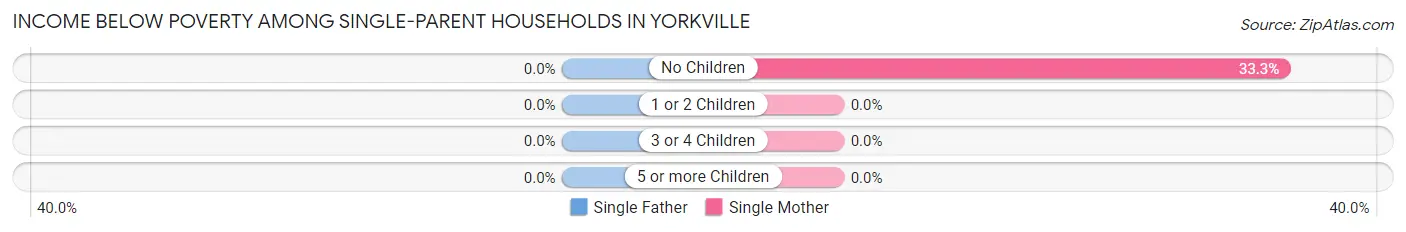
| Children | Single Father | Single Mother |
| No Children | 0 (0.0%) | 1 (33.3%) |
| 1 or 2 Children | 0 (0.0%) | 0 (0.0%) |
| 3 or 4 Children | 0 (0.0%) | 0 (0.0%) |
| 5 or more Children | 0 (0.0%) | 0 (0.0%) |
| Total | 0 (0.0%) | 1 (11.1%) |
Income Below Poverty Among Married-Couple vs Single-Parent Households in Yorkville
The poverty data for Yorkville shows that 1 of the married-couple family households (1.6%) and 1 of the single-parent households (7.1%) are living below the poverty level. Within the married-couple family households, those with no children have the highest poverty rate, with 1 households (2.6%) falling below the poverty line. Among the single-parent households, those with no children have the highest poverty rate, with 1 household (33.3%) living below poverty.
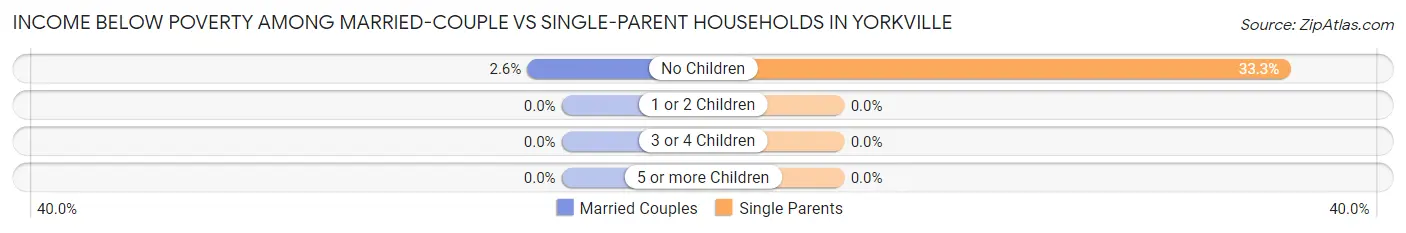
| Children | Married-Couple Families | Single-Parent Households |
| No Children | 1 (2.6%) | 1 (33.3%) |
| 1 or 2 Children | 0 (0.0%) | 0 (0.0%) |
| 3 or 4 Children | 0 (0.0%) | 0 (0.0%) |
| 5 or more Children | 0 (0.0%) | 0 (0.0%) |
| Total | 1 (1.6%) | 1 (7.1%) |
Race in Yorkville
The most populous races in Yorkville are White / Caucasian (303 | 97.4%), Two or more Races (6 | 1.9%), and Native / Alaskan (2 | 0.6%).
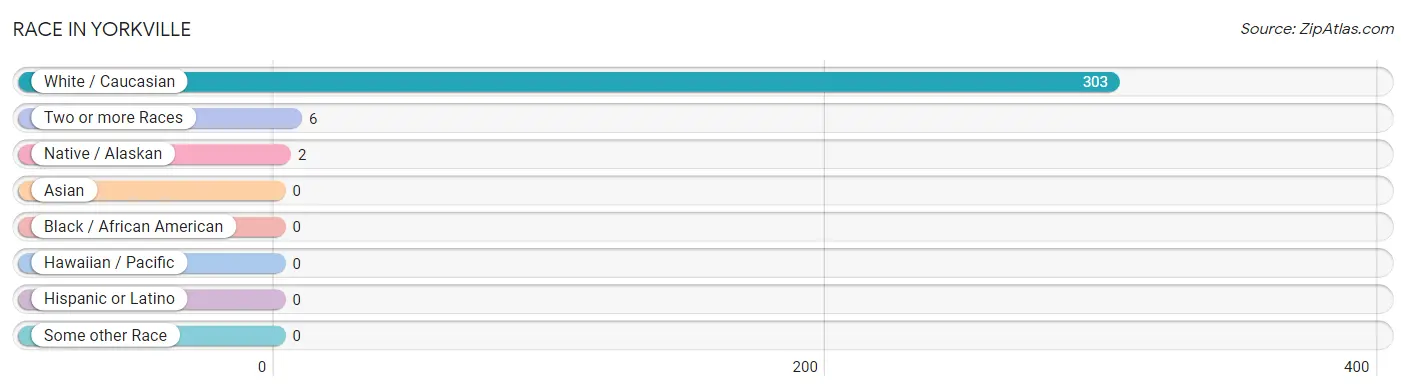
| Race | # Population | % Population |
| Asian | 0 | 0.0% |
| Black / African American | 0 | 0.0% |
| Hawaiian / Pacific | 0 | 0.0% |
| Hispanic or Latino | 0 | 0.0% |
| Native / Alaskan | 2 | 0.6% |
| White / Caucasian | 303 | 97.4% |
| Two or more Races | 6 | 1.9% |
| Some other Race | 0 | 0.0% |
| Total | 311 | 100.0% |
Ancestry in Yorkville
The most populous ancestries reported in Yorkville are American (71 | 22.8%), Irish (49 | 15.8%), English (25 | 8.0%), Dutch (20 | 6.4%), and European (6 | 1.9%), together accounting for 55.0% of all Yorkville residents.
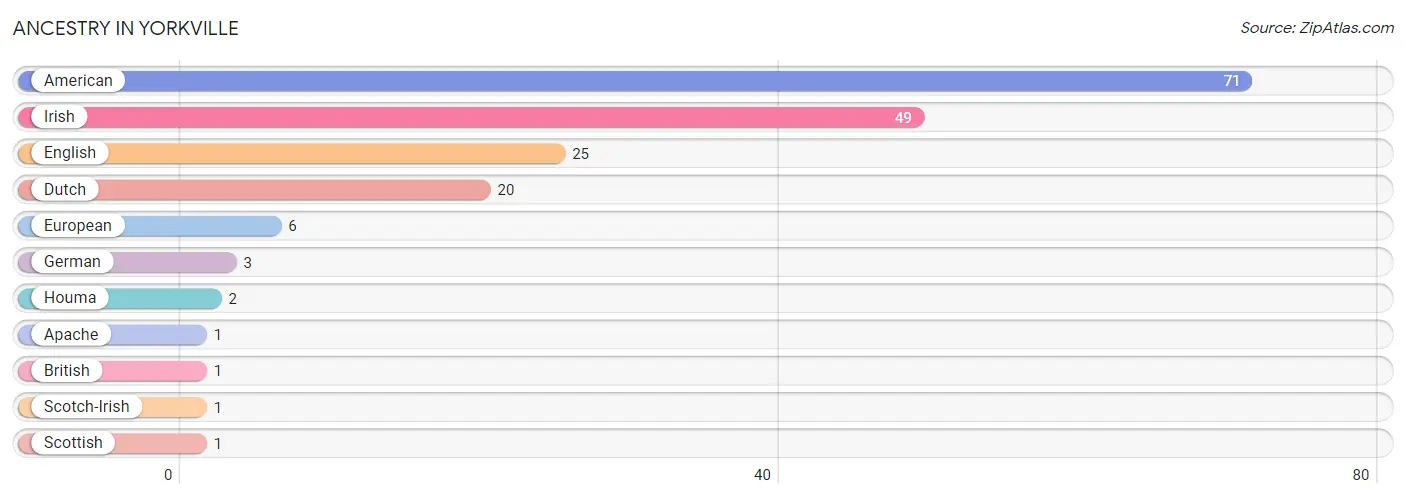
| Ancestry | # Population | % Population |
| American | 71 | 22.8% |
| Apache | 1 | 0.3% |
| British | 1 | 0.3% |
| Dutch | 20 | 6.4% |
| English | 25 | 8.0% |
| European | 6 | 1.9% |
| German | 3 | 1.0% |
| Houma | 2 | 0.6% |
| Irish | 49 | 15.8% |
| Scotch-Irish | 1 | 0.3% |
| Scottish | 1 | 0.3% | View All 11 Rows |
Immigrants in Yorkville

| Immigration Origin | # Population | % Population | View All 0 Rows |
Sex and Age in Yorkville
Sex and Age in Yorkville
The most populous age groups in Yorkville are 15 to 19 Years (37 | 21.9%) for men and 10 to 14 Years (22 | 15.5%) for women.
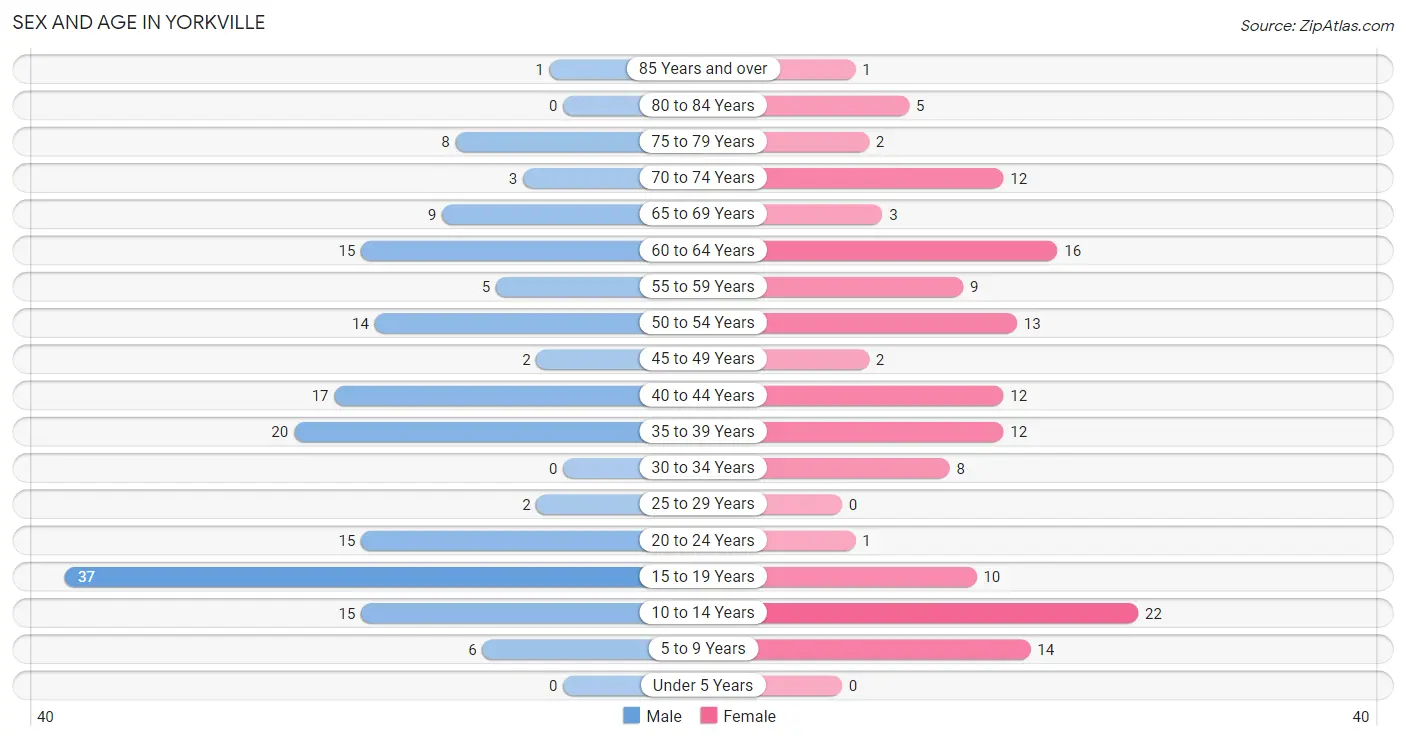
| Age Bracket | Male | Female |
| Under 5 Years | 0 (0.0%) | 0 (0.0%) |
| 5 to 9 Years | 6 (3.5%) | 14 (9.9%) |
| 10 to 14 Years | 15 (8.9%) | 22 (15.5%) |
| 15 to 19 Years | 37 (21.9%) | 10 (7.0%) |
| 20 to 24 Years | 15 (8.9%) | 1 (0.7%) |
| 25 to 29 Years | 2 (1.2%) | 0 (0.0%) |
| 30 to 34 Years | 0 (0.0%) | 8 (5.6%) |
| 35 to 39 Years | 20 (11.8%) | 12 (8.5%) |
| 40 to 44 Years | 17 (10.1%) | 12 (8.5%) |
| 45 to 49 Years | 2 (1.2%) | 2 (1.4%) |
| 50 to 54 Years | 14 (8.3%) | 13 (9.1%) |
| 55 to 59 Years | 5 (3.0%) | 9 (6.3%) |
| 60 to 64 Years | 15 (8.9%) | 16 (11.3%) |
| 65 to 69 Years | 9 (5.3%) | 3 (2.1%) |
| 70 to 74 Years | 3 (1.8%) | 12 (8.5%) |
| 75 to 79 Years | 8 (4.7%) | 2 (1.4%) |
| 80 to 84 Years | 0 (0.0%) | 5 (3.5%) |
| 85 Years and over | 1 (0.6%) | 1 (0.7%) |
| Total | 169 (100.0%) | 142 (100.0%) |
Families and Households in Yorkville
Median Family Size in Yorkville
The median family size in Yorkville is 3.49 persons per family, with married-couple families (64 | 82.1%) accounting for the largest median family size of 3.53 persons per family. On the other hand, single male/father families (5 | 6.4%) represent the smallest median family size with 3.20 persons per family.
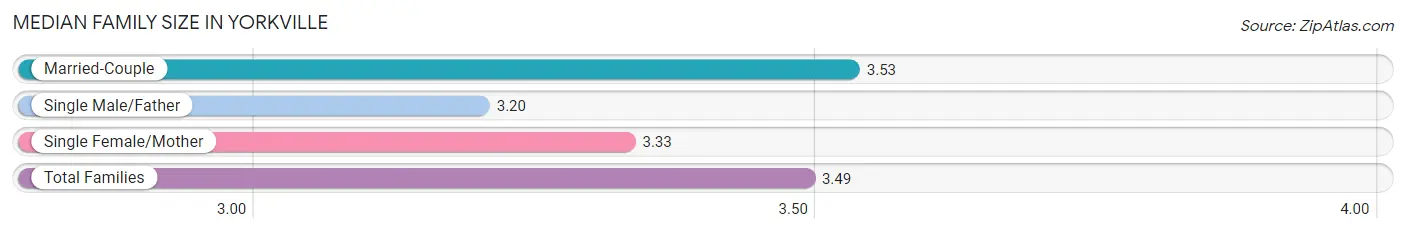
| Family Type | # Families | Family Size |
| Married-Couple | 64 (82.1%) | 3.53 |
| Single Male/Father | 5 (6.4%) | 3.20 |
| Single Female/Mother | 9 (11.5%) | 3.33 |
| Total Families | 78 (100.0%) | 3.49 |
Median Household Size in Yorkville
The median household size in Yorkville is 2.78 persons per household, with married-couple households (64 | 57.1%) accounting for the largest median household size of 3.55 persons per household. non-family households (34 | 30.4%) represent the smallest median household size with 1.12 persons per household.
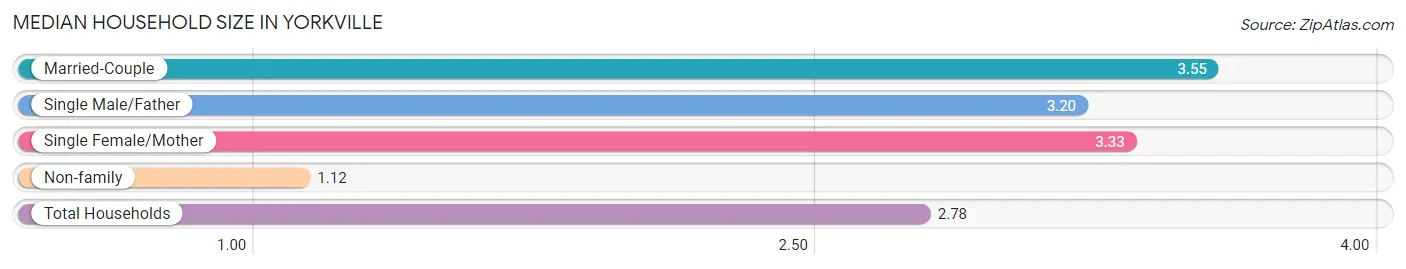
| Household Type | # Households | Household Size |
| Married-Couple | 64 (57.1%) | 3.55 |
| Single Male/Father | 5 (4.5%) | 3.20 |
| Single Female/Mother | 9 (8.0%) | 3.33 |
| Non-family | 34 (30.4%) | 1.12 |
| Total Households | 112 (100.0%) | 2.78 |
Household Size by Marriage Status in Yorkville
Out of a total of 112 households in Yorkville, 78 (69.6%) are family households, while 34 (30.4%) are nonfamily households. The most numerous type of family households are 2-person households, comprising 27, and the most common type of nonfamily households are 1-person households, comprising 30.
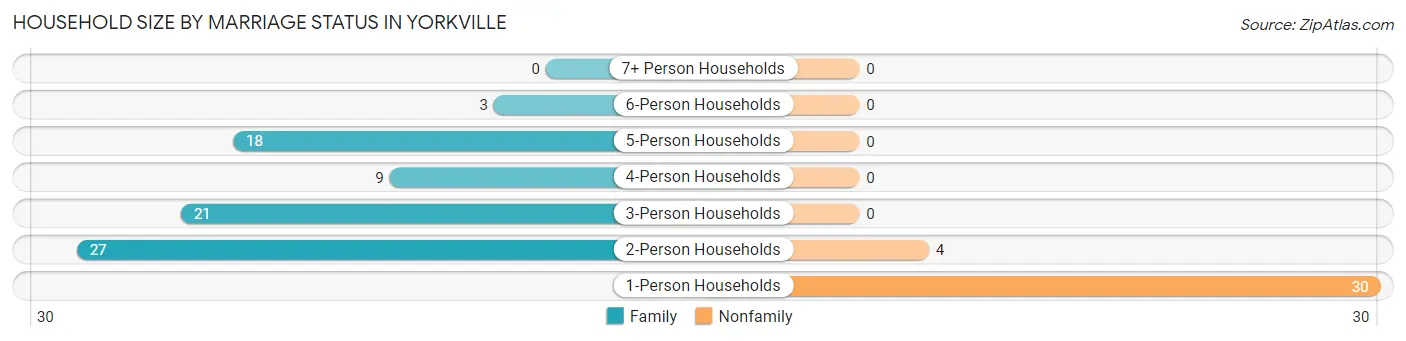
| Household Size | Family Households | Nonfamily Households |
| 1-Person Households | - | 30 (26.8%) |
| 2-Person Households | 27 (24.1%) | 4 (3.6%) |
| 3-Person Households | 21 (18.8%) | 0 (0.0%) |
| 4-Person Households | 9 (8.0%) | 0 (0.0%) |
| 5-Person Households | 18 (16.1%) | 0 (0.0%) |
| 6-Person Households | 3 (2.7%) | 0 (0.0%) |
| 7+ Person Households | 0 (0.0%) | 0 (0.0%) |
| Total | 78 (69.6%) | 34 (30.4%) |
Female Fertility in Yorkville
Fertility by Age in Yorkville
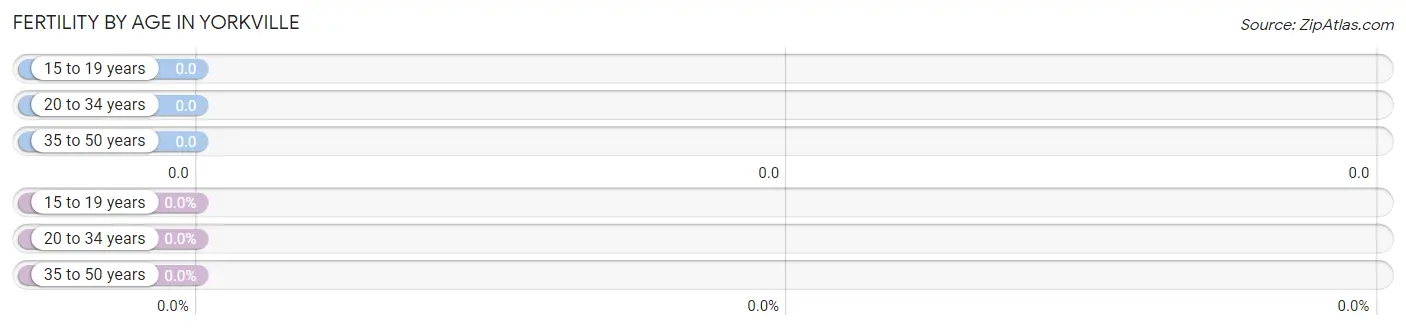
| Age Bracket | Women with Births | Births / 1,000 Women |
| 15 to 19 years | 0 (0.0%) | 0.0 |
| 20 to 34 years | 0 (0.0%) | 0.0 |
| 35 to 50 years | 0 (0.0%) | 0.0 |
| Total | 0 (0.0%) | 0.0 |
Fertility by Age by Marriage Status in Yorkville
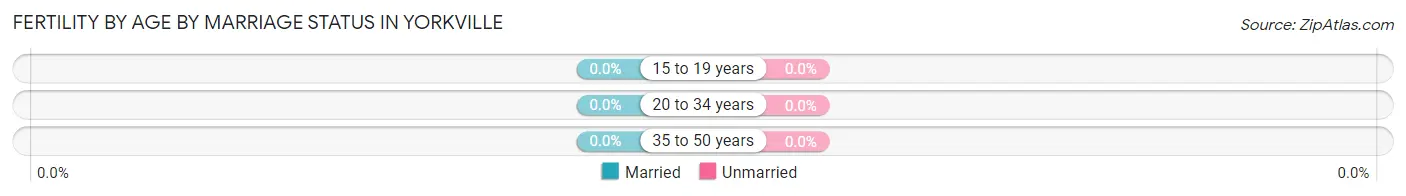
| Age Bracket | Married | Unmarried |
| 15 to 19 years | 0 (0.0%) | 0 (0.0%) |
| 20 to 34 years | 0 (0.0%) | 0 (0.0%) |
| 35 to 50 years | 0 (0.0%) | 0 (0.0%) |
| Total | 0 (0.0%) | 0 (0.0%) |
Fertility by Education in Yorkville
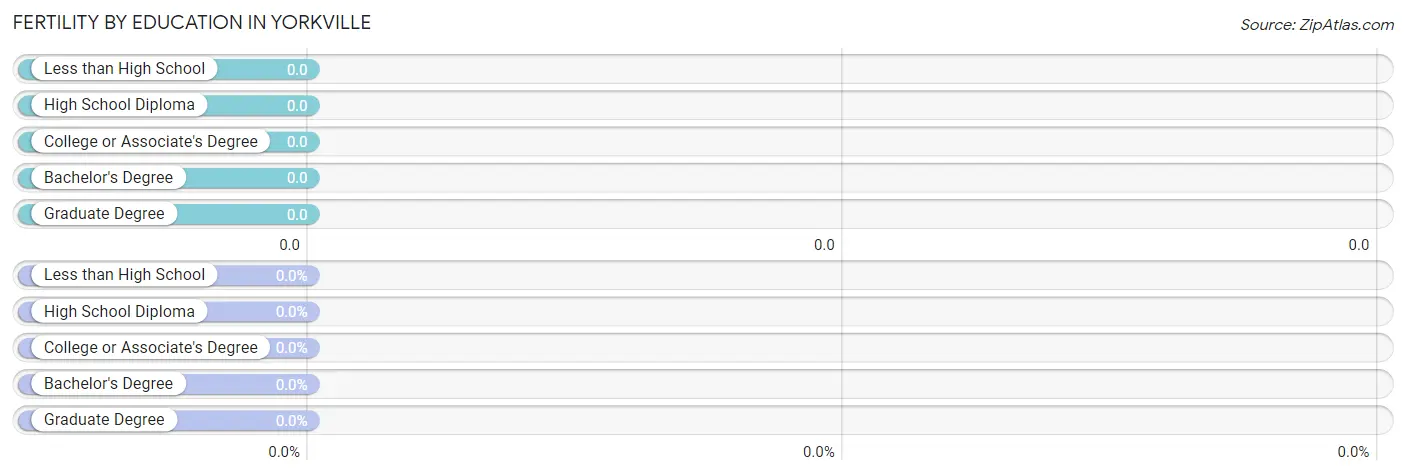
| Educational Attainment | Women with Births | Births / 1,000 Women |
| Less than High School | 0 (0.0%) | 0.0 |
| High School Diploma | 0 (0.0%) | 0.0 |
| College or Associate's Degree | 0 (0.0%) | 0.0 |
| Bachelor's Degree | 0 (0.0%) | 0.0 |
| Graduate Degree | 0 (0.0%) | 0.0 |
| Total | 0 (0.0%) | 0.0 |
Fertility by Education by Marriage Status in Yorkville
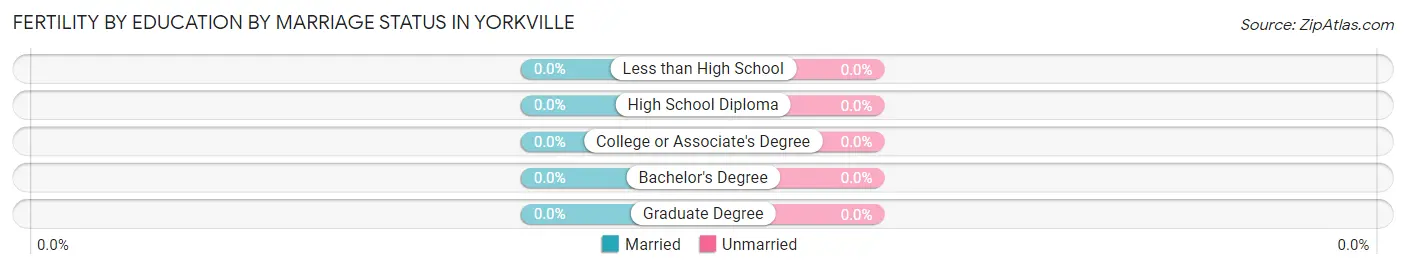
| Educational Attainment | Married | Unmarried |
| Less than High School | 0 (0.0%) | 0 (0.0%) |
| High School Diploma | 0 (0.0%) | 0 (0.0%) |
| College or Associate's Degree | 0 (0.0%) | 0 (0.0%) |
| Bachelor's Degree | 0 (0.0%) | 0 (0.0%) |
| Graduate Degree | 0 (0.0%) | 0 (0.0%) |
| Total | 0 (0.0%) | 0 (0.0%) |
Employment Characteristics in Yorkville
Employment by Class of Employer in Yorkville
Among the 163 employed individuals in Yorkville, private company employees (76 | 46.6%), local government employees (29 | 17.8%), and state government employees (20 | 12.3%) make up the most common classes of employment.
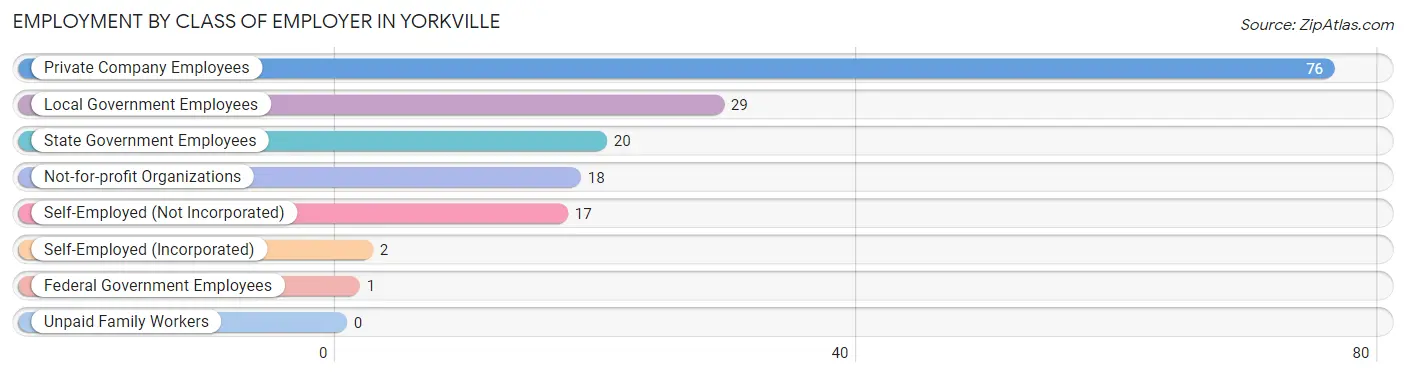
| Employer Class | # Employees | % Employees |
| Private Company Employees | 76 | 46.6% |
| Self-Employed (Incorporated) | 2 | 1.2% |
| Self-Employed (Not Incorporated) | 17 | 10.4% |
| Not-for-profit Organizations | 18 | 11.0% |
| Local Government Employees | 29 | 17.8% |
| State Government Employees | 20 | 12.3% |
| Federal Government Employees | 1 | 0.6% |
| Unpaid Family Workers | 0 | 0.0% |
| Total | 163 | 100.0% |
Employment Status by Age in Yorkville
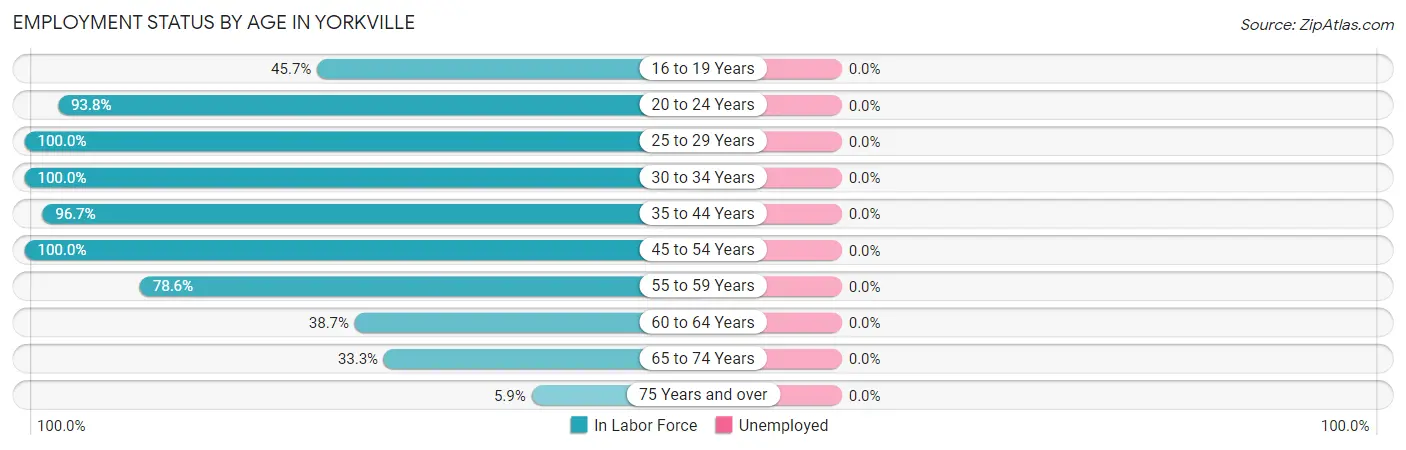
| Age Bracket | In Labor Force | Unemployed |
| 16 to 19 Years | 16 (45.7%) | 0 (0.0%) |
| 20 to 24 Years | 15 (93.8%) | 0 (0.0%) |
| 25 to 29 Years | 2 (100.0%) | 0 (0.0%) |
| 30 to 34 Years | 8 (100.0%) | 0 (0.0%) |
| 35 to 44 Years | 59 (96.7%) | 0 (0.0%) |
| 45 to 54 Years | 31 (100.0%) | 0 (0.0%) |
| 55 to 59 Years | 11 (78.6%) | 0 (0.0%) |
| 60 to 64 Years | 12 (38.7%) | 0 (0.0%) |
| 65 to 74 Years | 9 (33.3%) | 0 (0.0%) |
| 75 Years and over | 1 (5.9%) | 0 (0.0%) |
| Total | 164 (67.8%) | 0 (0.0%) |
Employment Status by Educational Attainment in Yorkville
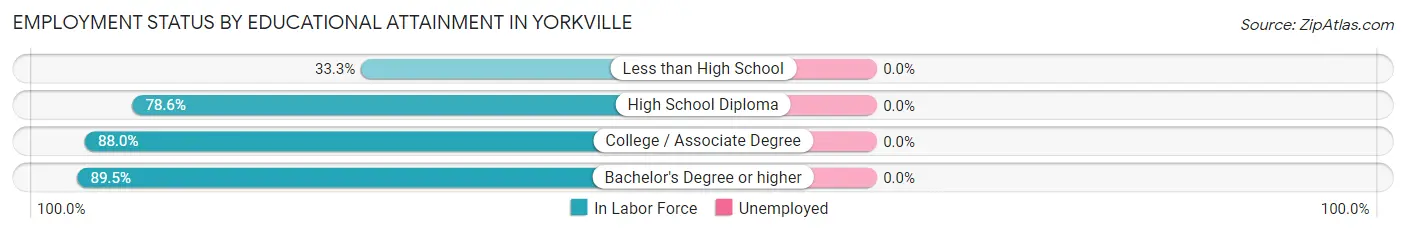
| Educational Attainment | In Labor Force | Unemployed |
| Less than High School | 1 (33.3%) | 0 (0.0%) |
| High School Diploma | 44 (78.6%) | 0 (0.0%) |
| College / Associate Degree | 44 (88.0%) | 0 (0.0%) |
| Bachelor's Degree or higher | 34 (89.5%) | 0 (0.0%) |
| Total | 123 (83.7%) | 0 (0.0%) |
Employment Occupations by Sex in Yorkville
Management, Business, Science and Arts Occupations
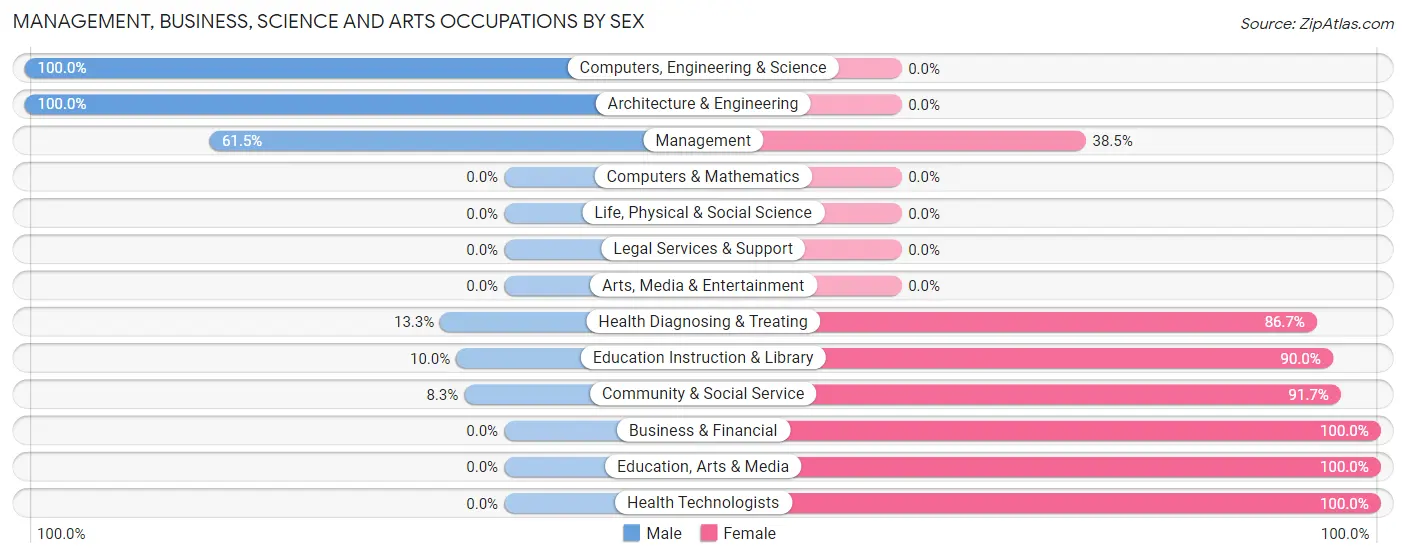
The most common Management, Business, Science and Arts occupations in Yorkville are Community & Social Service (24 | 14.6%), Education Instruction & Library (20 | 12.2%), Health Diagnosing & Treating (15 | 9.1%), Management (13 | 7.9%), and Health Technologists (6 | 3.7%).
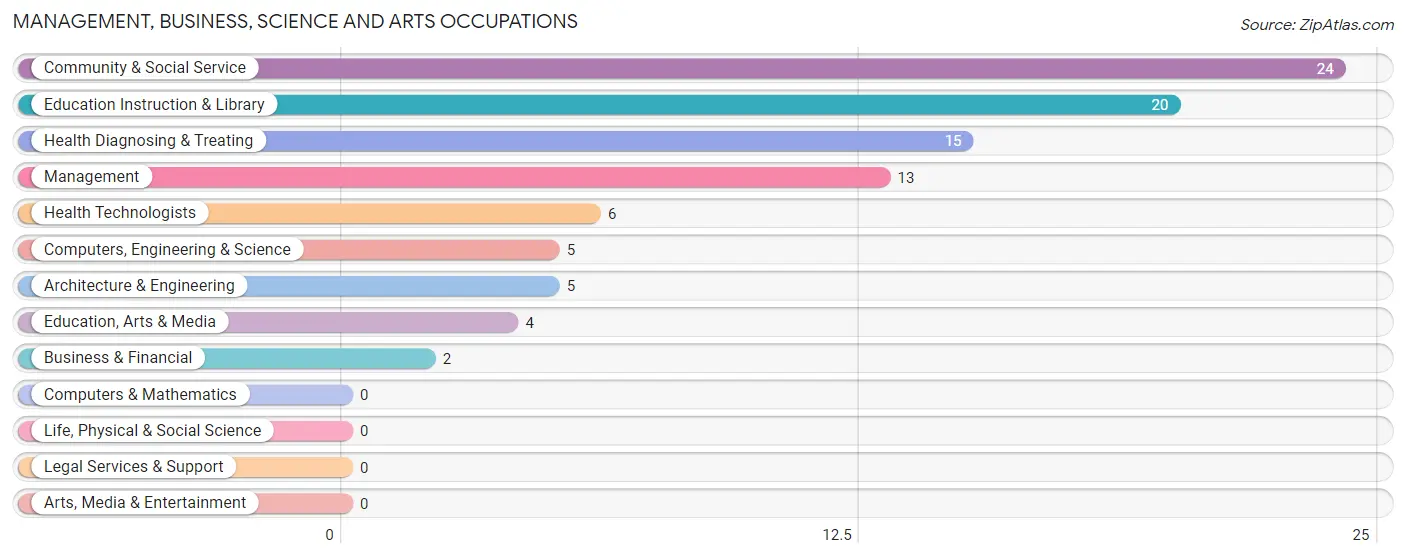
Management, Business, Science and Arts Occupations by Sex
Within the Management, Business, Science and Arts occupations in Yorkville, the most male-oriented occupations are Computers, Engineering & Science (100.0%), Architecture & Engineering (100.0%), and Management (61.5%), while the most female-oriented occupations are Business & Financial (100.0%), Education, Arts & Media (100.0%), and Health Technologists (100.0%).
| Occupation | Male | Female |
| Management | 8 (61.5%) | 5 (38.5%) |
| Business & Financial | 0 (0.0%) | 2 (100.0%) |
| Computers, Engineering & Science | 5 (100.0%) | 0 (0.0%) |
| Computers & Mathematics | 0 (0.0%) | 0 (0.0%) |
| Architecture & Engineering | 5 (100.0%) | 0 (0.0%) |
| Life, Physical & Social Science | 0 (0.0%) | 0 (0.0%) |
| Community & Social Service | 2 (8.3%) | 22 (91.7%) |
| Education, Arts & Media | 0 (0.0%) | 4 (100.0%) |
| Legal Services & Support | 0 (0.0%) | 0 (0.0%) |
| Education Instruction & Library | 2 (10.0%) | 18 (90.0%) |
| Arts, Media & Entertainment | 0 (0.0%) | 0 (0.0%) |
| Health Diagnosing & Treating | 2 (13.3%) | 13 (86.7%) |
| Health Technologists | 0 (0.0%) | 6 (100.0%) |
| Total (Category) | 17 (28.8%) | 42 (71.2%) |
| Total (Overall) | 97 (59.2%) | 67 (40.8%) |
Services Occupations
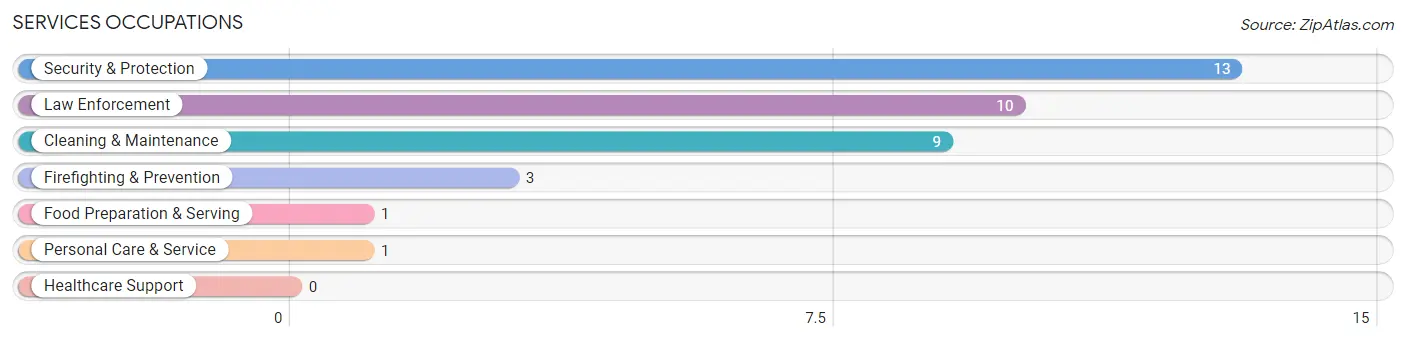
The most common Services occupations in Yorkville are Security & Protection (13 | 7.9%), Law Enforcement (10 | 6.1%), Cleaning & Maintenance (9 | 5.5%), Firefighting & Prevention (3 | 1.8%), and Food Preparation & Serving (1 | 0.6%).
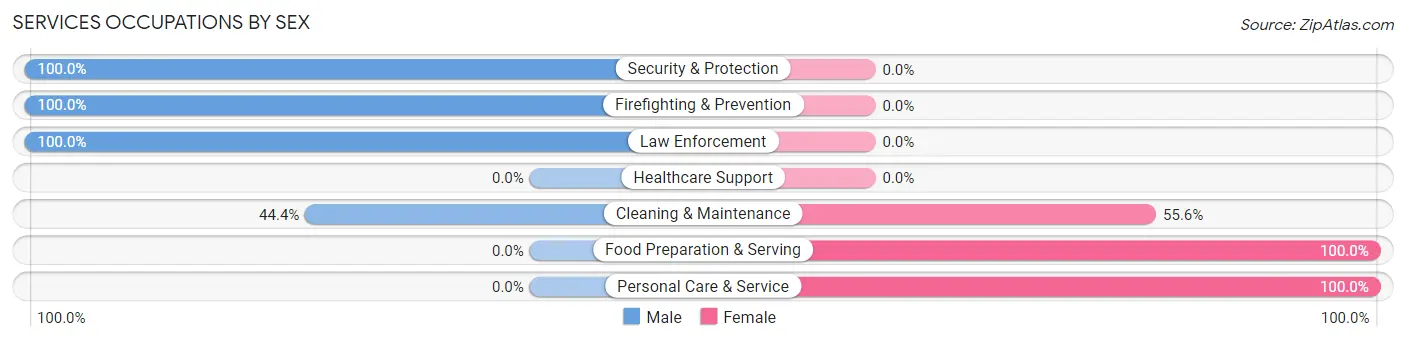
Services Occupations by Sex
Within the Services occupations in Yorkville, the most male-oriented occupations are Security & Protection (100.0%), Firefighting & Prevention (100.0%), and Law Enforcement (100.0%), while the most female-oriented occupations are Food Preparation & Serving (100.0%), Personal Care & Service (100.0%), and Cleaning & Maintenance (55.6%).
| Occupation | Male | Female |
| Healthcare Support | 0 (0.0%) | 0 (0.0%) |
| Security & Protection | 13 (100.0%) | 0 (0.0%) |
| Firefighting & Prevention | 3 (100.0%) | 0 (0.0%) |
| Law Enforcement | 10 (100.0%) | 0 (0.0%) |
| Food Preparation & Serving | 0 (0.0%) | 1 (100.0%) |
| Cleaning & Maintenance | 4 (44.4%) | 5 (55.6%) |
| Personal Care & Service | 0 (0.0%) | 1 (100.0%) |
| Total (Category) | 17 (70.8%) | 7 (29.2%) |
| Total (Overall) | 97 (59.2%) | 67 (40.8%) |
Sales and Office Occupations
The most common Sales and Office occupations in Yorkville are Sales & Related (13 | 7.9%), and Office & Administration (13 | 7.9%).
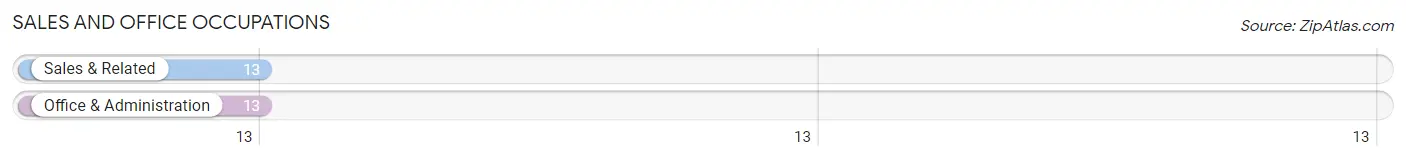
Sales and Office Occupations by Sex

| Occupation | Male | Female |
| Sales & Related | 10 (76.9%) | 3 (23.1%) |
| Office & Administration | 1 (7.7%) | 12 (92.3%) |
| Total (Category) | 11 (42.3%) | 15 (57.7%) |
| Total (Overall) | 97 (59.2%) | 67 (40.8%) |
Natural Resources, Construction and Maintenance Occupations
The most common Natural Resources, Construction and Maintenance occupations in Yorkville are Farming, Fishing & Forestry (17 | 10.4%), Installation, Maintenance & Repair (4 | 2.4%), and Construction & Extraction (2 | 1.2%).
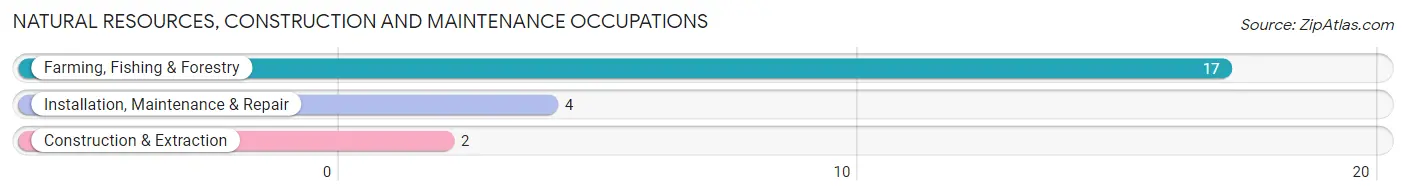
Natural Resources, Construction and Maintenance Occupations by Sex

| Occupation | Male | Female |
| Farming, Fishing & Forestry | 17 (100.0%) | 0 (0.0%) |
| Construction & Extraction | 2 (100.0%) | 0 (0.0%) |
| Installation, Maintenance & Repair | 4 (100.0%) | 0 (0.0%) |
| Total (Category) | 23 (100.0%) | 0 (0.0%) |
| Total (Overall) | 97 (59.2%) | 67 (40.8%) |
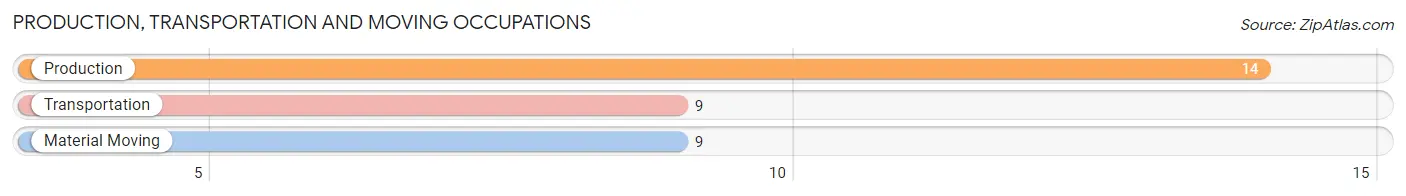
Production, Transportation and Moving Occupations
The most common Production, Transportation and Moving occupations in Yorkville are Production (14 | 8.5%), Transportation (9 | 5.5%), and Material Moving (9 | 5.5%).
Production, Transportation and Moving Occupations by Sex
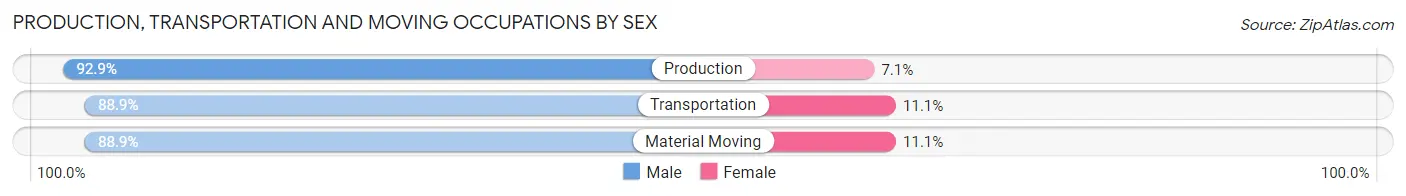
| Occupation | Male | Female |
| Production | 13 (92.9%) | 1 (7.1%) |
| Transportation | 8 (88.9%) | 1 (11.1%) |
| Material Moving | 8 (88.9%) | 1 (11.1%) |
| Total (Category) | 29 (90.6%) | 3 (9.4%) |
| Total (Overall) | 97 (59.2%) | 67 (40.8%) |
Employment Industries by Sex in Yorkville
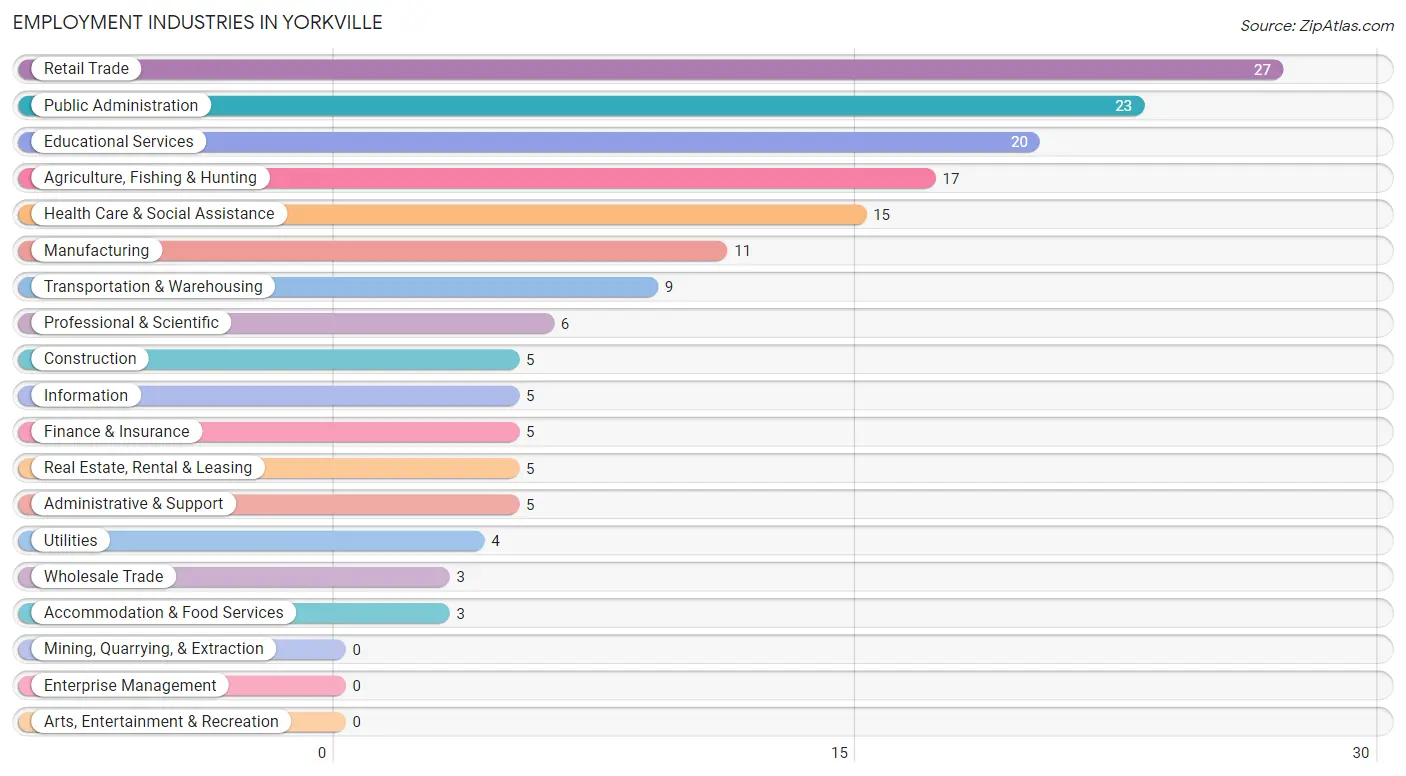
Employment Industries in Yorkville
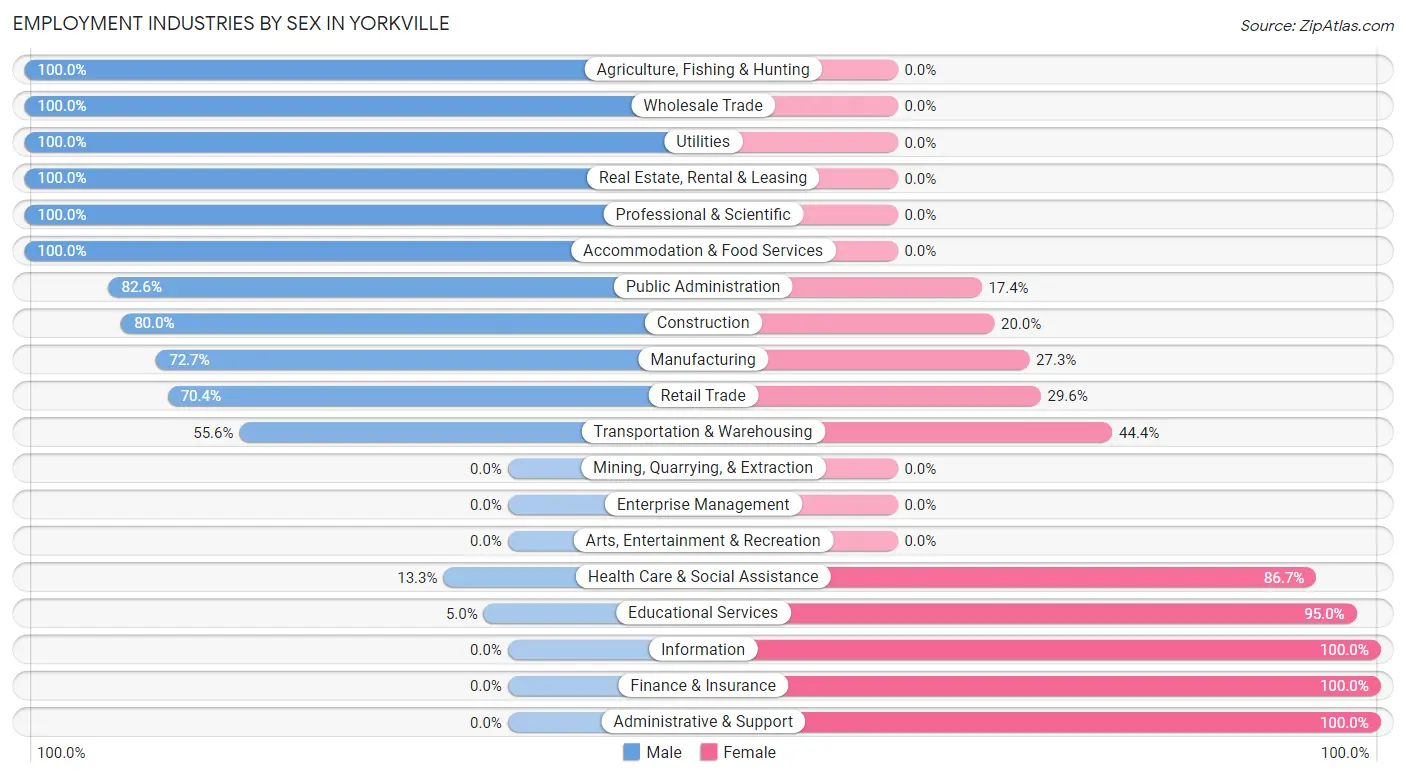
The major employment industries in Yorkville include Retail Trade (27 | 16.5%), Public Administration (23 | 14.0%), Educational Services (20 | 12.2%), Agriculture, Fishing & Hunting (17 | 10.4%), and Health Care & Social Assistance (15 | 9.1%).
Employment Industries by Sex in Yorkville
The Yorkville industries that see more men than women are Agriculture, Fishing & Hunting (100.0%), Wholesale Trade (100.0%), and Utilities (100.0%), whereas the industries that tend to have a higher number of women are Information (100.0%), Finance & Insurance (100.0%), and Administrative & Support (100.0%).
| Industry | Male | Female |
| Agriculture, Fishing & Hunting | 17 (100.0%) | 0 (0.0%) |
| Mining, Quarrying, & Extraction | 0 (0.0%) | 0 (0.0%) |
| Construction | 4 (80.0%) | 1 (20.0%) |
| Manufacturing | 8 (72.7%) | 3 (27.3%) |
| Wholesale Trade | 3 (100.0%) | 0 (0.0%) |
| Retail Trade | 19 (70.4%) | 8 (29.6%) |
| Transportation & Warehousing | 5 (55.6%) | 4 (44.4%) |
| Utilities | 4 (100.0%) | 0 (0.0%) |
| Information | 0 (0.0%) | 5 (100.0%) |
| Finance & Insurance | 0 (0.0%) | 5 (100.0%) |
| Real Estate, Rental & Leasing | 5 (100.0%) | 0 (0.0%) |
| Professional & Scientific | 6 (100.0%) | 0 (0.0%) |
| Enterprise Management | 0 (0.0%) | 0 (0.0%) |
| Administrative & Support | 0 (0.0%) | 5 (100.0%) |
| Educational Services | 1 (5.0%) | 19 (95.0%) |
| Health Care & Social Assistance | 2 (13.3%) | 13 (86.7%) |
| Arts, Entertainment & Recreation | 0 (0.0%) | 0 (0.0%) |
| Accommodation & Food Services | 3 (100.0%) | 0 (0.0%) |
| Public Administration | 19 (82.6%) | 4 (17.4%) |
| Total | 97 (59.2%) | 67 (40.8%) |
Education in Yorkville
School Enrollment in Yorkville
The most common levels of schooling among the 107 students in Yorkville are high school (43 | 40.2%), middle school (34 | 31.8%), and elementary school (17 | 15.9%).
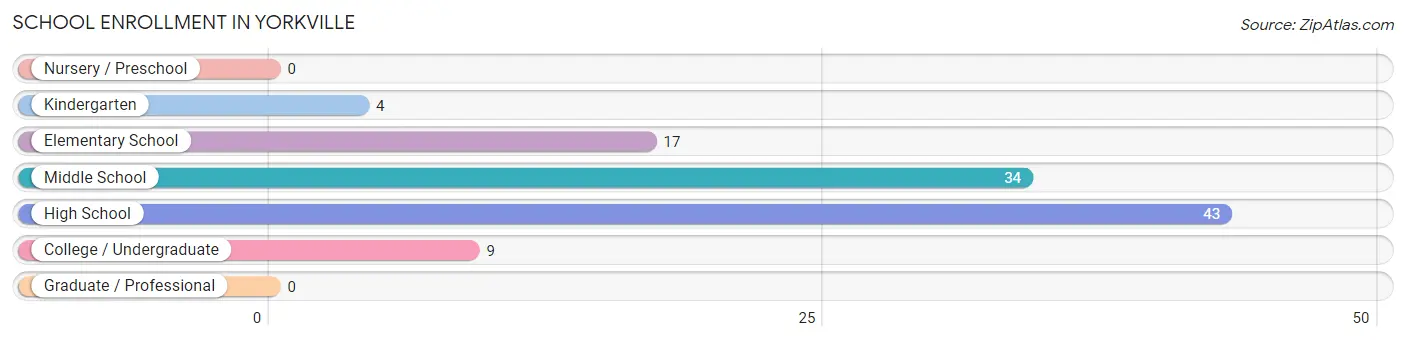
| School Level | # Students | % Students |
| Nursery / Preschool | 0 | 0.0% |
| Kindergarten | 4 | 3.7% |
| Elementary School | 17 | 15.9% |
| Middle School | 34 | 31.8% |
| High School | 43 | 40.2% |
| College / Undergraduate | 9 | 8.4% |
| Graduate / Professional | 0 | 0.0% |
| Total | 107 | 100.0% |
School Enrollment by Age by Funding Source in Yorkville
Out of a total of 107 students who are enrolled in schools in Yorkville, 7 (6.5%) attend a private institution, while the remaining 100 (93.5%) are enrolled in public schools. The age group of 20 to 24 year olds has the highest likelihood of being enrolled in private schools, with 1 (25.0% in the age bracket) enrolled. Conversely, the age group of 5 to 9 year old has the lowest likelihood of being enrolled in a private school, with 18 (100.0% in the age bracket) attending a public institution.
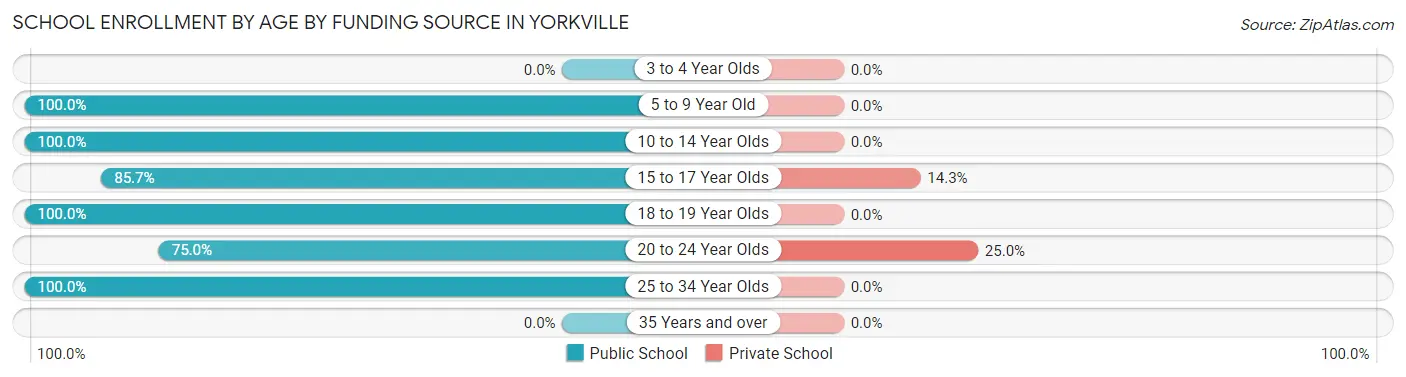
| Age Bracket | Public School | Private School |
| 3 to 4 Year Olds | 0 (0.0%) | 0 (0.0%) |
| 5 to 9 Year Old | 18 (100.0%) | 0 (0.0%) |
| 10 to 14 Year Olds | 37 (100.0%) | 0 (0.0%) |
| 15 to 17 Year Olds | 36 (85.7%) | 6 (14.3%) |
| 18 to 19 Year Olds | 4 (100.0%) | 0 (0.0%) |
| 20 to 24 Year Olds | 3 (75.0%) | 1 (25.0%) |
| 25 to 34 Year Olds | 2 (100.0%) | 0 (0.0%) |
| 35 Years and over | 0 (0.0%) | 0 (0.0%) |
| Total | 100 (93.5%) | 7 (6.5%) |
Educational Attainment by Field of Study in Yorkville
Business (15 | 33.3%), education (7 | 15.6%), computers & mathematics (6 | 13.3%), bio, nature & agricultural (5 | 11.1%), and engineering (5 | 11.1%) are the most common fields of study among 45 individuals in Yorkville who have obtained a bachelor's degree or higher.
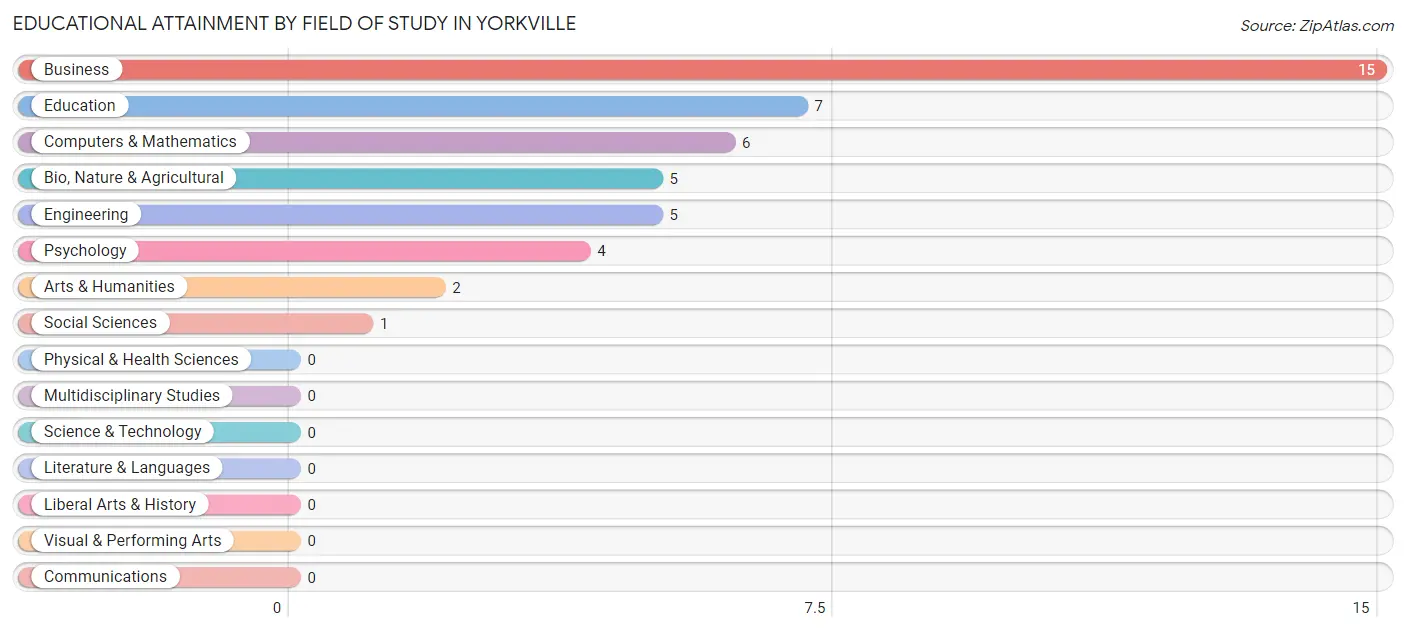
| Field of Study | # Graduates | % Graduates |
| Computers & Mathematics | 6 | 13.3% |
| Bio, Nature & Agricultural | 5 | 11.1% |
| Physical & Health Sciences | 0 | 0.0% |
| Psychology | 4 | 8.9% |
| Social Sciences | 1 | 2.2% |
| Engineering | 5 | 11.1% |
| Multidisciplinary Studies | 0 | 0.0% |
| Science & Technology | 0 | 0.0% |
| Business | 15 | 33.3% |
| Education | 7 | 15.6% |
| Literature & Languages | 0 | 0.0% |
| Liberal Arts & History | 0 | 0.0% |
| Visual & Performing Arts | 0 | 0.0% |
| Communications | 0 | 0.0% |
| Arts & Humanities | 2 | 4.4% |
| Total | 45 | 100.0% |
Transportation & Commute in Yorkville
Vehicle Availability by Sex in Yorkville
The most prevalent vehicle ownership categories in Yorkville are males with 5 or more vehicles (24, accounting for 24.7%) and females with 5 or more vehicles (8, making up 36.4%).
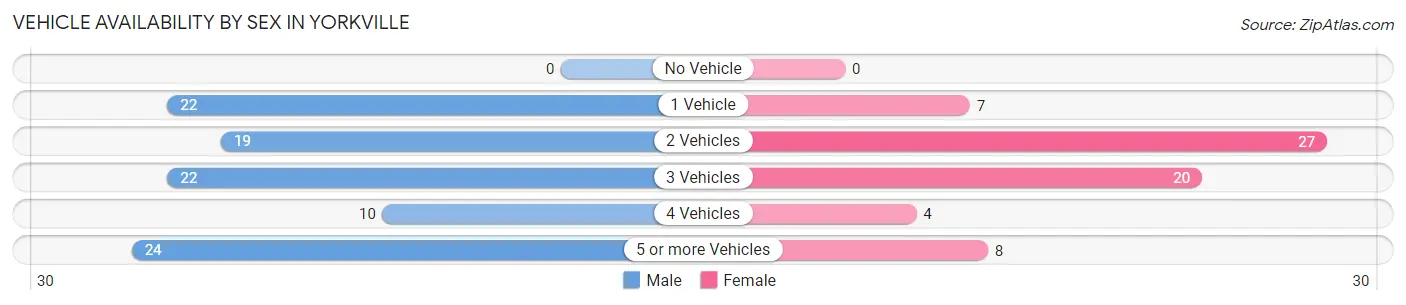
| Vehicles Available | Male | Female |
| No Vehicle | 0 (0.0%) | 0 (0.0%) |
| 1 Vehicle | 22 (22.7%) | 7 (10.6%) |
| 2 Vehicles | 19 (19.6%) | 27 (40.9%) |
| 3 Vehicles | 22 (22.7%) | 20 (30.3%) |
| 4 Vehicles | 10 (10.3%) | 4 (6.1%) |
| 5 or more Vehicles | 24 (24.7%) | 8 (12.1%) |
| Total | 97 (100.0%) | 66 (100.0%) |
Commute Time in Yorkville
The most frequently occuring commute durations in Yorkville are 30 to 34 minutes (27 commuters, 18.5%), 15 to 19 minutes (21 commuters, 14.4%), and 5 to 9 minutes (18 commuters, 12.3%).
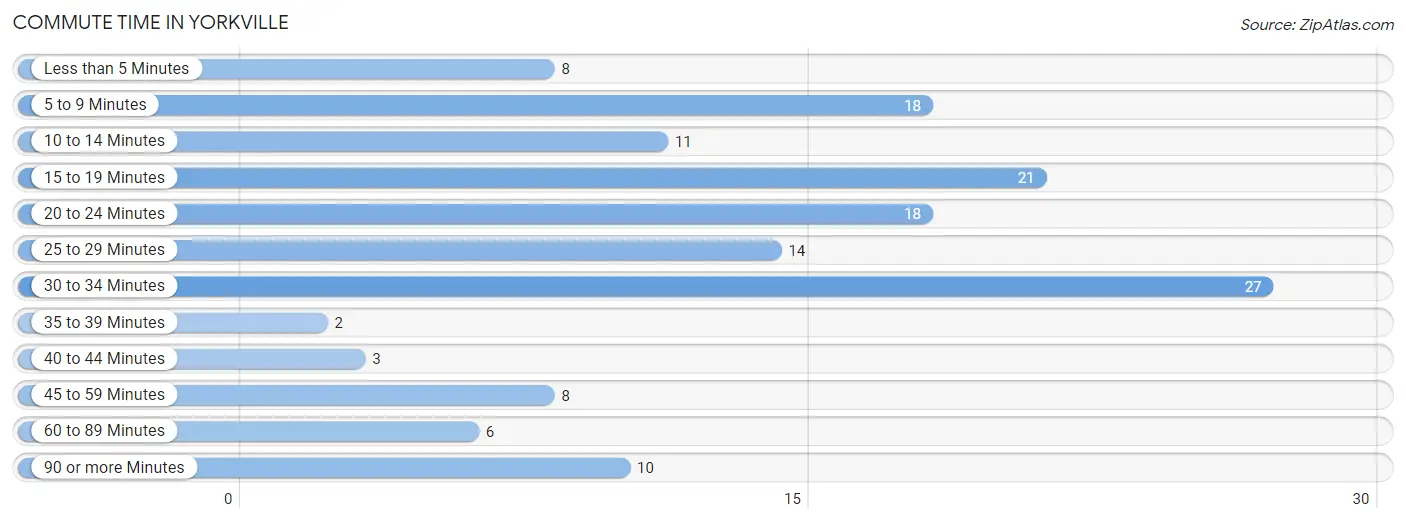
| Commute Time | # Commuters | % Commuters |
| Less than 5 Minutes | 8 | 5.5% |
| 5 to 9 Minutes | 18 | 12.3% |
| 10 to 14 Minutes | 11 | 7.5% |
| 15 to 19 Minutes | 21 | 14.4% |
| 20 to 24 Minutes | 18 | 12.3% |
| 25 to 29 Minutes | 14 | 9.6% |
| 30 to 34 Minutes | 27 | 18.5% |
| 35 to 39 Minutes | 2 | 1.4% |
| 40 to 44 Minutes | 3 | 2.1% |
| 45 to 59 Minutes | 8 | 5.5% |
| 60 to 89 Minutes | 6 | 4.1% |
| 90 or more Minutes | 10 | 6.9% |
Commute Time by Sex in Yorkville
The most common commute times in Yorkville are 5 to 9 minutes (18 commuters, 19.8%) for males and 30 to 34 minutes (14 commuters, 25.5%) for females.
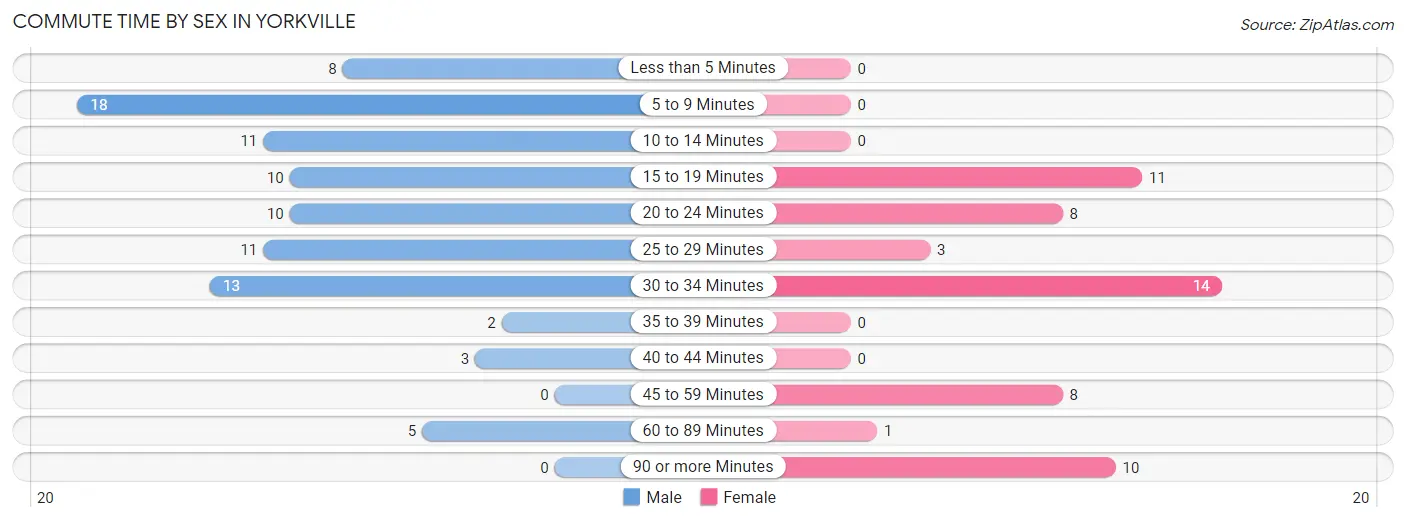
| Commute Time | Male | Female |
| Less than 5 Minutes | 8 (8.8%) | 0 (0.0%) |
| 5 to 9 Minutes | 18 (19.8%) | 0 (0.0%) |
| 10 to 14 Minutes | 11 (12.1%) | 0 (0.0%) |
| 15 to 19 Minutes | 10 (11.0%) | 11 (20.0%) |
| 20 to 24 Minutes | 10 (11.0%) | 8 (14.5%) |
| 25 to 29 Minutes | 11 (12.1%) | 3 (5.4%) |
| 30 to 34 Minutes | 13 (14.3%) | 14 (25.5%) |
| 35 to 39 Minutes | 2 (2.2%) | 0 (0.0%) |
| 40 to 44 Minutes | 3 (3.3%) | 0 (0.0%) |
| 45 to 59 Minutes | 0 (0.0%) | 8 (14.5%) |
| 60 to 89 Minutes | 5 (5.5%) | 1 (1.8%) |
| 90 or more Minutes | 0 (0.0%) | 10 (18.2%) |
Time of Departure to Work by Sex in Yorkville
The most frequent times of departure to work in Yorkville are 6:00 AM to 6:29 AM (29, 31.9%) for males and 6:30 AM to 6:59 AM (10, 18.2%) for females.
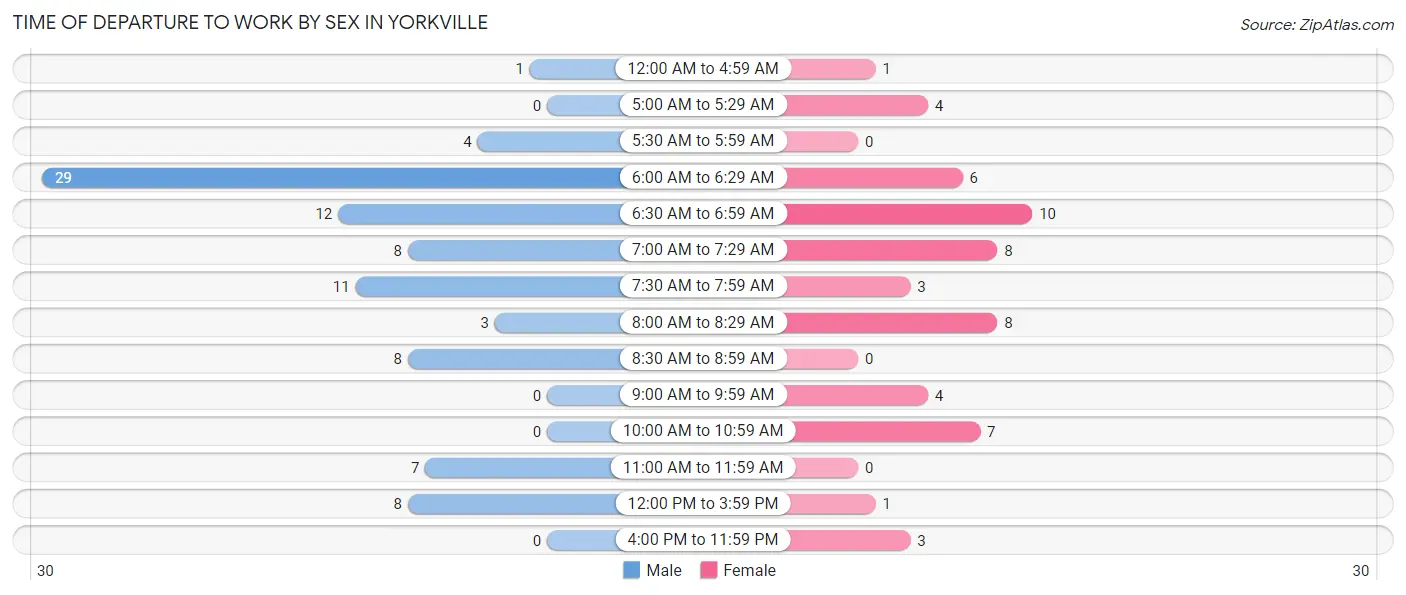
| Time of Departure | Male | Female |
| 12:00 AM to 4:59 AM | 1 (1.1%) | 1 (1.8%) |
| 5:00 AM to 5:29 AM | 0 (0.0%) | 4 (7.3%) |
| 5:30 AM to 5:59 AM | 4 (4.4%) | 0 (0.0%) |
| 6:00 AM to 6:29 AM | 29 (31.9%) | 6 (10.9%) |
| 6:30 AM to 6:59 AM | 12 (13.2%) | 10 (18.2%) |
| 7:00 AM to 7:29 AM | 8 (8.8%) | 8 (14.5%) |
| 7:30 AM to 7:59 AM | 11 (12.1%) | 3 (5.4%) |
| 8:00 AM to 8:29 AM | 3 (3.3%) | 8 (14.5%) |
| 8:30 AM to 8:59 AM | 8 (8.8%) | 0 (0.0%) |
| 9:00 AM to 9:59 AM | 0 (0.0%) | 4 (7.3%) |
| 10:00 AM to 10:59 AM | 0 (0.0%) | 7 (12.7%) |
| 11:00 AM to 11:59 AM | 7 (7.7%) | 0 (0.0%) |
| 12:00 PM to 3:59 PM | 8 (8.8%) | 1 (1.8%) |
| 4:00 PM to 11:59 PM | 0 (0.0%) | 3 (5.4%) |
| Total | 91 (100.0%) | 55 (100.0%) |
Housing Occupancy in Yorkville
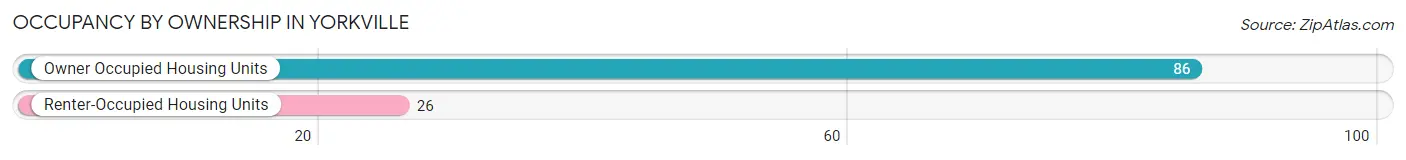
Occupancy by Ownership in Yorkville
Of the total 112 dwellings in Yorkville, owner-occupied units account for 86 (76.8%), while renter-occupied units make up 26 (23.2%).
| Occupancy | # Housing Units | % Housing Units |
| Owner Occupied Housing Units | 86 | 76.8% |
| Renter-Occupied Housing Units | 26 | 23.2% |
| Total Occupied Housing Units | 112 | 100.0% |
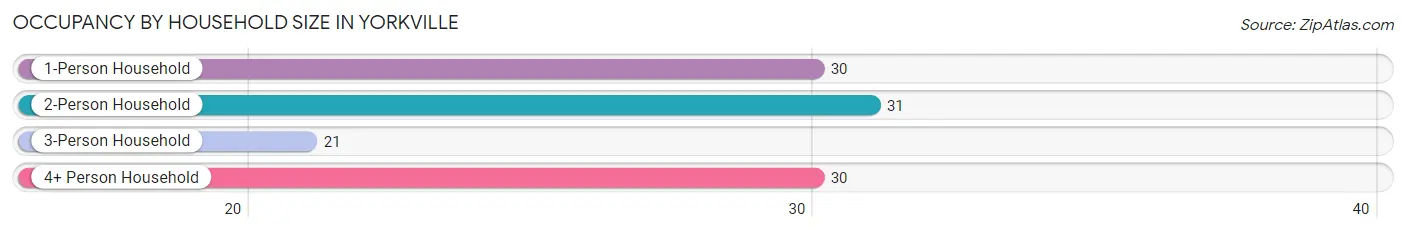
Occupancy by Household Size in Yorkville
| Household Size | # Housing Units | % Housing Units |
| 1-Person Household | 30 | 26.8% |
| 2-Person Household | 31 | 27.7% |
| 3-Person Household | 21 | 18.8% |
| 4+ Person Household | 30 | 26.8% |
| Total Housing Units | 112 | 100.0% |
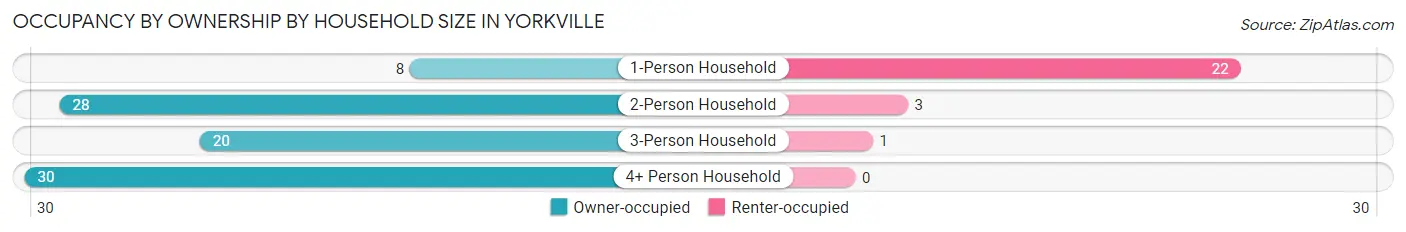
Occupancy by Ownership by Household Size in Yorkville
| Household Size | Owner-occupied | Renter-occupied |
| 1-Person Household | 8 (26.7%) | 22 (73.3%) |
| 2-Person Household | 28 (90.3%) | 3 (9.7%) |
| 3-Person Household | 20 (95.2%) | 1 (4.8%) |
| 4+ Person Household | 30 (100.0%) | 0 (0.0%) |
| Total Housing Units | 86 (76.8%) | 26 (23.2%) |
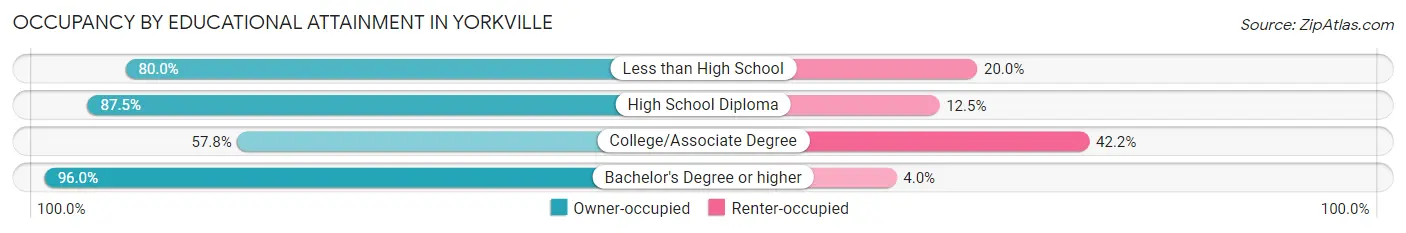
Occupancy by Educational Attainment in Yorkville
| Household Size | Owner-occupied | Renter-occupied |
| Less than High School | 8 (80.0%) | 2 (20.0%) |
| High School Diploma | 28 (87.5%) | 4 (12.5%) |
| College/Associate Degree | 26 (57.8%) | 19 (42.2%) |
| Bachelor's Degree or higher | 24 (96.0%) | 1 (4.0%) |
Occupancy by Age of Householder in Yorkville
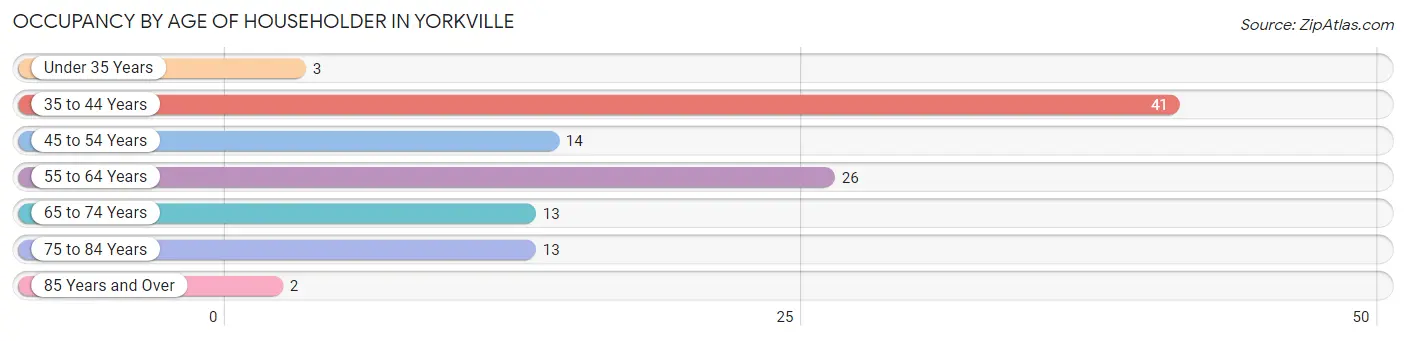
| Age Bracket | # Households | % Households |
| Under 35 Years | 3 | 2.7% |
| 35 to 44 Years | 41 | 36.6% |
| 45 to 54 Years | 14 | 12.5% |
| 55 to 64 Years | 26 | 23.2% |
| 65 to 74 Years | 13 | 11.6% |
| 75 to 84 Years | 13 | 11.6% |
| 85 Years and Over | 2 | 1.8% |
| Total | 112 | 100.0% |
Housing Finances in Yorkville
Median Income by Occupancy in Yorkville
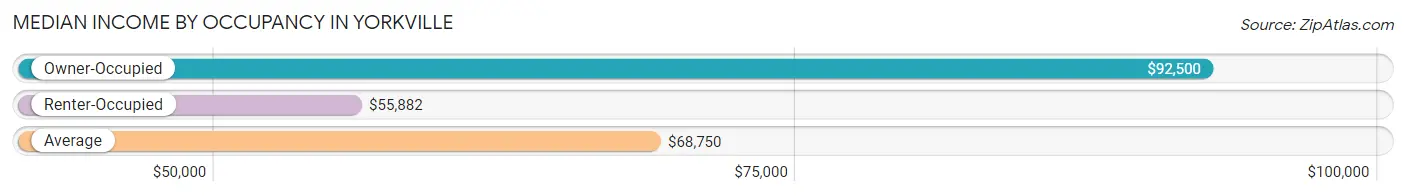
| Occupancy Type | # Households | Median Income |
| Owner-Occupied | 86 (76.8%) | $92,500 |
| Renter-Occupied | 26 (23.2%) | $55,882 |
| Average | 112 (100.0%) | $68,750 |
Occupancy by Householder Income Bracket in Yorkville
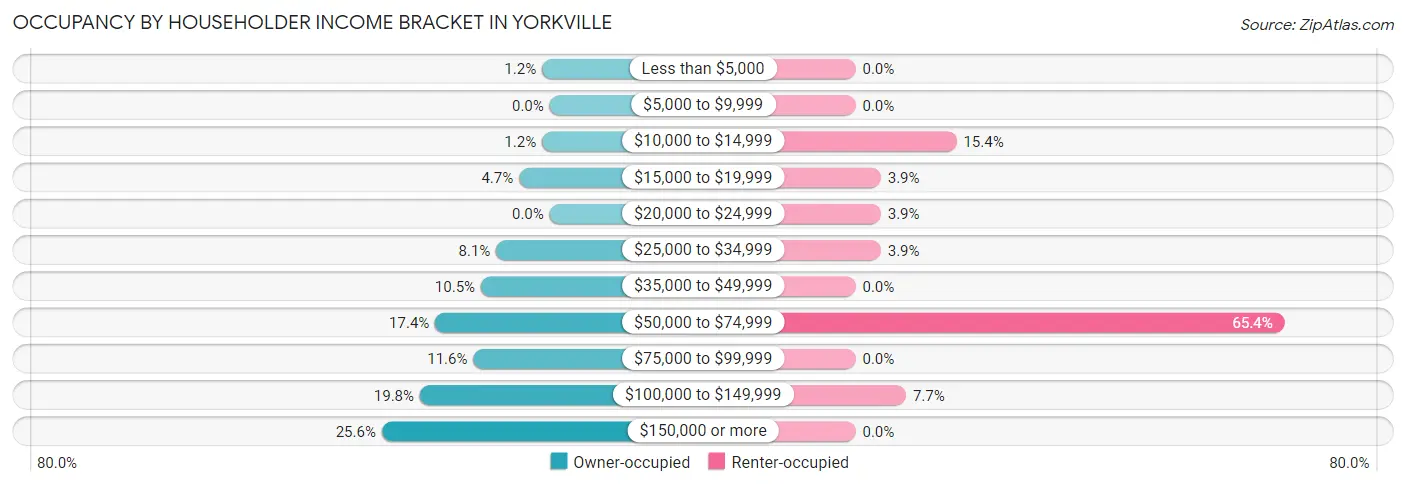
| Income Bracket | Owner-occupied | Renter-occupied |
| Less than $5,000 | 1 (1.2%) | 0 (0.0%) |
| $5,000 to $9,999 | 0 (0.0%) | 0 (0.0%) |
| $10,000 to $14,999 | 1 (1.2%) | 4 (15.4%) |
| $15,000 to $19,999 | 4 (4.6%) | 1 (3.8%) |
| $20,000 to $24,999 | 0 (0.0%) | 1 (3.8%) |
| $25,000 to $34,999 | 7 (8.1%) | 1 (3.8%) |
| $35,000 to $49,999 | 9 (10.5%) | 0 (0.0%) |
| $50,000 to $74,999 | 15 (17.4%) | 17 (65.4%) |
| $75,000 to $99,999 | 10 (11.6%) | 0 (0.0%) |
| $100,000 to $149,999 | 17 (19.8%) | 2 (7.7%) |
| $150,000 or more | 22 (25.6%) | 0 (0.0%) |
| Total | 86 (100.0%) | 26 (100.0%) |
Monthly Housing Cost Tiers in Yorkville
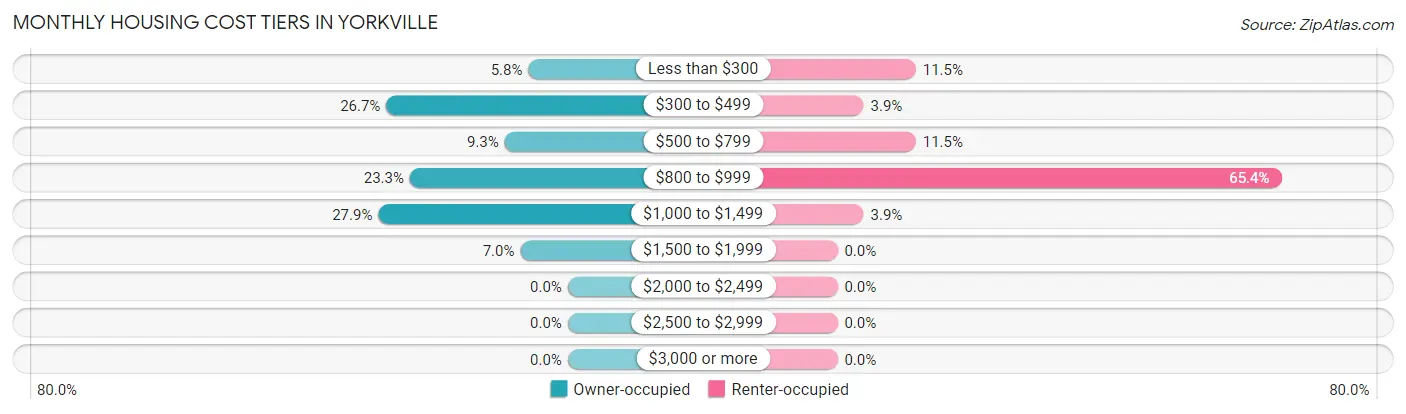
| Monthly Cost | Owner-occupied | Renter-occupied |
| Less than $300 | 5 (5.8%) | 3 (11.5%) |
| $300 to $499 | 23 (26.7%) | 1 (3.8%) |
| $500 to $799 | 8 (9.3%) | 3 (11.5%) |
| $800 to $999 | 20 (23.3%) | 17 (65.4%) |
| $1,000 to $1,499 | 24 (27.9%) | 1 (3.8%) |
| $1,500 to $1,999 | 6 (7.0%) | 0 (0.0%) |
| $2,000 to $2,499 | 0 (0.0%) | 0 (0.0%) |
| $2,500 to $2,999 | 0 (0.0%) | 0 (0.0%) |
| $3,000 or more | 0 (0.0%) | 0 (0.0%) |
| Total | 86 (100.0%) | 26 (100.0%) |
Physical Housing Characteristics in Yorkville
Housing Structures in Yorkville
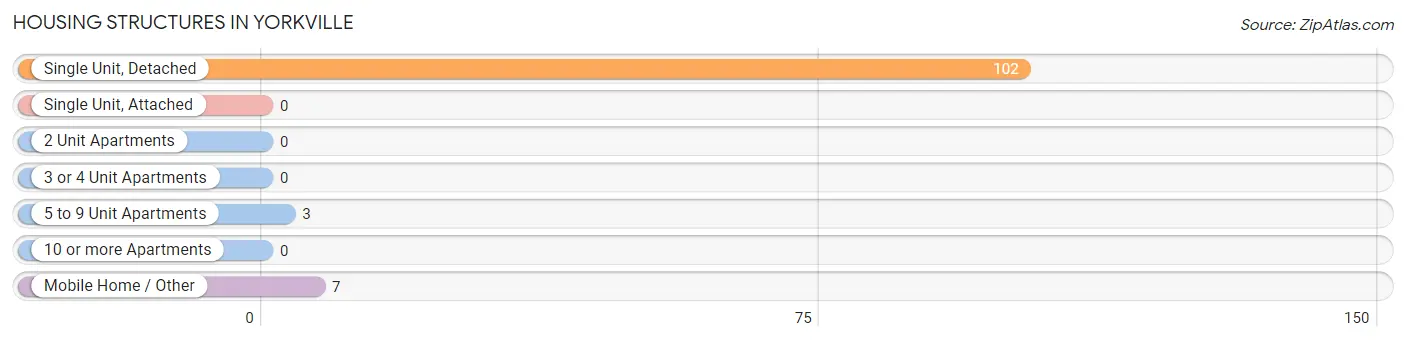
| Structure Type | # Housing Units | % Housing Units |
| Single Unit, Detached | 102 | 91.1% |
| Single Unit, Attached | 0 | 0.0% |
| 2 Unit Apartments | 0 | 0.0% |
| 3 or 4 Unit Apartments | 0 | 0.0% |
| 5 to 9 Unit Apartments | 3 | 2.7% |
| 10 or more Apartments | 0 | 0.0% |
| Mobile Home / Other | 7 | 6.2% |
| Total | 112 | 100.0% |
Housing Structures by Occupancy in Yorkville
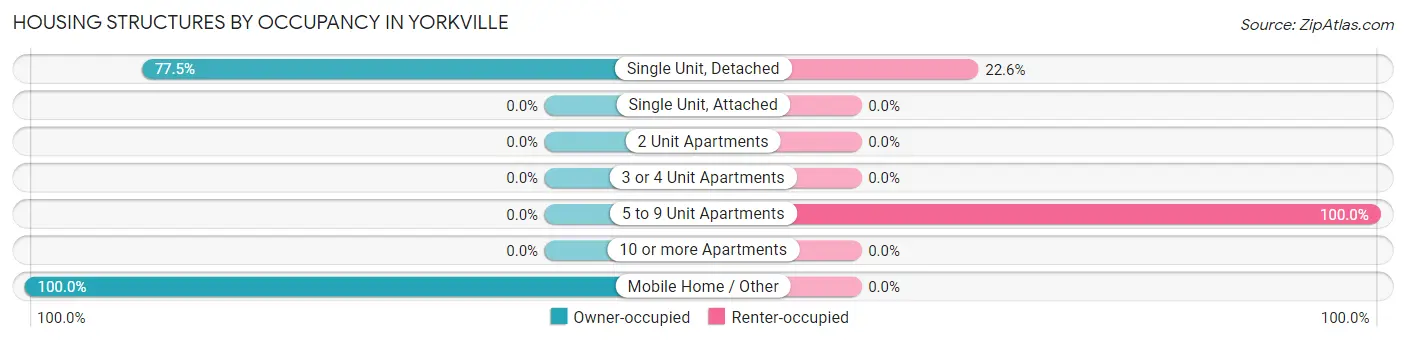
| Structure Type | Owner-occupied | Renter-occupied |
| Single Unit, Detached | 79 (77.4%) | 23 (22.6%) |
| Single Unit, Attached | 0 (0.0%) | 0 (0.0%) |
| 2 Unit Apartments | 0 (0.0%) | 0 (0.0%) |
| 3 or 4 Unit Apartments | 0 (0.0%) | 0 (0.0%) |
| 5 to 9 Unit Apartments | 0 (0.0%) | 3 (100.0%) |
| 10 or more Apartments | 0 (0.0%) | 0 (0.0%) |
| Mobile Home / Other | 7 (100.0%) | 0 (0.0%) |
| Total | 86 (76.8%) | 26 (23.2%) |
Housing Structures by Number of Rooms in Yorkville
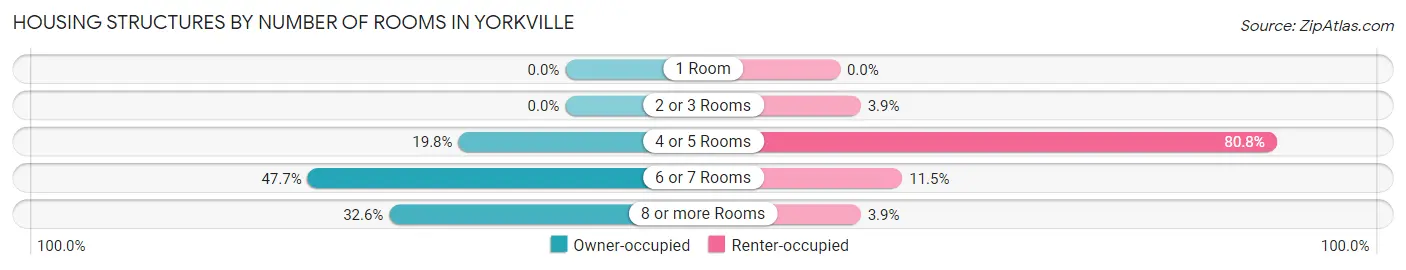
| Number of Rooms | Owner-occupied | Renter-occupied |
| 1 Room | 0 (0.0%) | 0 (0.0%) |
| 2 or 3 Rooms | 0 (0.0%) | 1 (3.8%) |
| 4 or 5 Rooms | 17 (19.8%) | 21 (80.8%) |
| 6 or 7 Rooms | 41 (47.7%) | 3 (11.5%) |
| 8 or more Rooms | 28 (32.6%) | 1 (3.8%) |
| Total | 86 (100.0%) | 26 (100.0%) |
Housing Structure by Heating Type in Yorkville
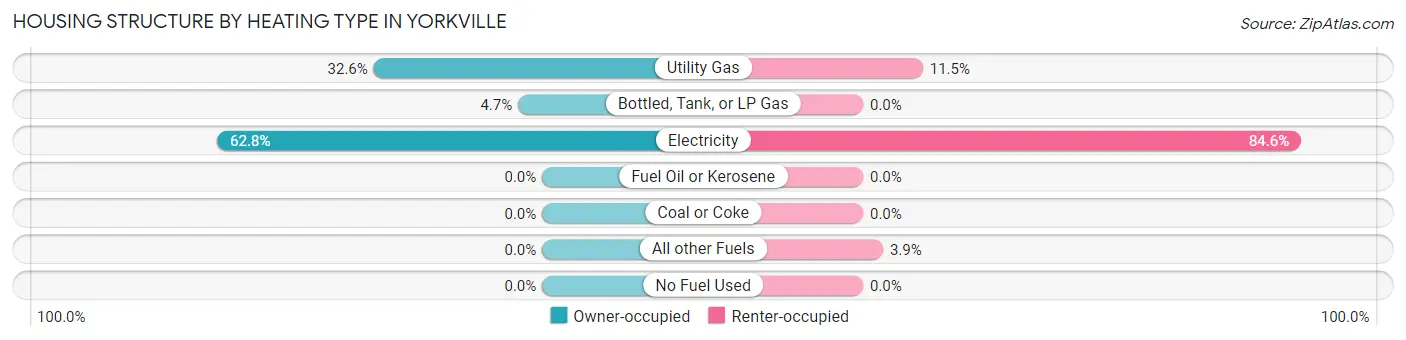
| Heating Type | Owner-occupied | Renter-occupied |
| Utility Gas | 28 (32.6%) | 3 (11.5%) |
| Bottled, Tank, or LP Gas | 4 (4.6%) | 0 (0.0%) |
| Electricity | 54 (62.8%) | 22 (84.6%) |
| Fuel Oil or Kerosene | 0 (0.0%) | 0 (0.0%) |
| Coal or Coke | 0 (0.0%) | 0 (0.0%) |
| All other Fuels | 0 (0.0%) | 1 (3.8%) |
| No Fuel Used | 0 (0.0%) | 0 (0.0%) |
| Total | 86 (100.0%) | 26 (100.0%) |
Household Vehicle Usage in Yorkville
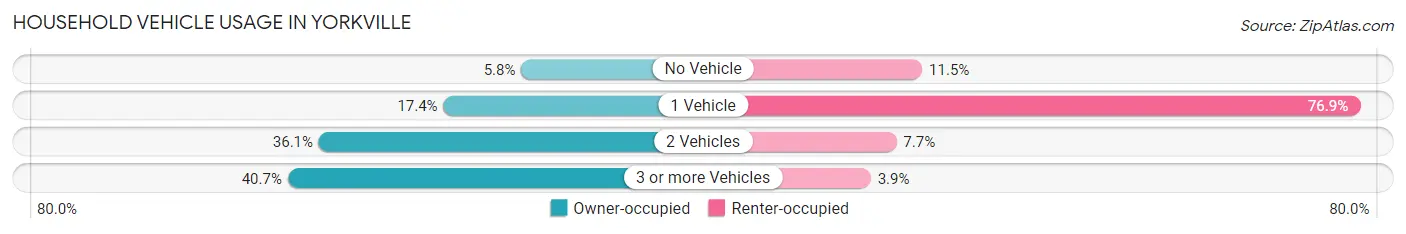
| Vehicles per Household | Owner-occupied | Renter-occupied |
| No Vehicle | 5 (5.8%) | 3 (11.5%) |
| 1 Vehicle | 15 (17.4%) | 20 (76.9%) |
| 2 Vehicles | 31 (36.0%) | 2 (7.7%) |
| 3 or more Vehicles | 35 (40.7%) | 1 (3.8%) |
| Total | 86 (100.0%) | 26 (100.0%) |
Real Estate & Mortgages in Yorkville
Real Estate and Mortgage Overview in Yorkville
| Characteristic | Without Mortgage | With Mortgage |
| Housing Units | 29 | 57 |
| Median Property Value | $96,300 | $95,000 |
| Median Household Income | $73,125 | $14 |
| Monthly Housing Costs | $392 | $0 |
| Real Estate Taxes | $838 | $3 |
Property Value by Mortgage Status in Yorkville
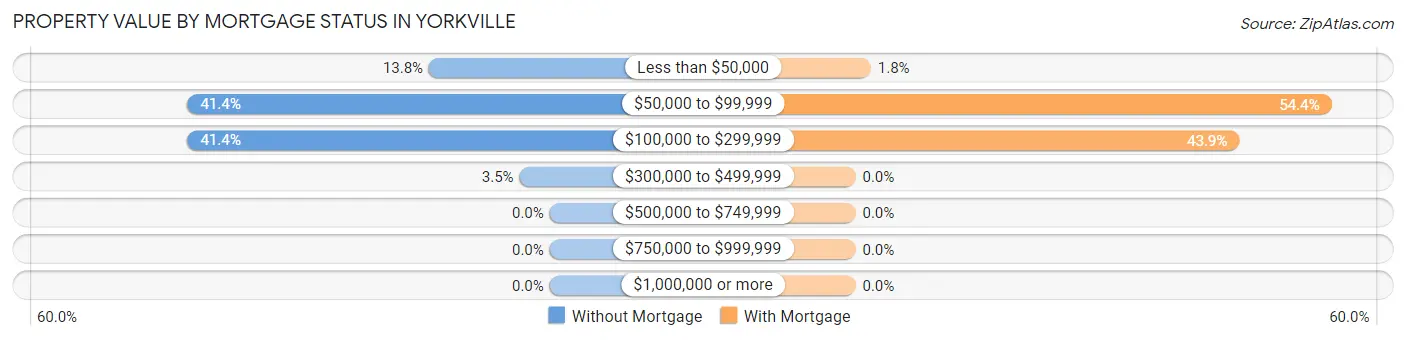
| Property Value | Without Mortgage | With Mortgage |
| Less than $50,000 | 4 (13.8%) | 1 (1.8%) |
| $50,000 to $99,999 | 12 (41.4%) | 31 (54.4%) |
| $100,000 to $299,999 | 12 (41.4%) | 25 (43.9%) |
| $300,000 to $499,999 | 1 (3.5%) | 0 (0.0%) |
| $500,000 to $749,999 | 0 (0.0%) | 0 (0.0%) |
| $750,000 to $999,999 | 0 (0.0%) | 0 (0.0%) |
| $1,000,000 or more | 0 (0.0%) | 0 (0.0%) |
| Total | 29 (100.0%) | 57 (100.0%) |
Household Income by Mortgage Status in Yorkville
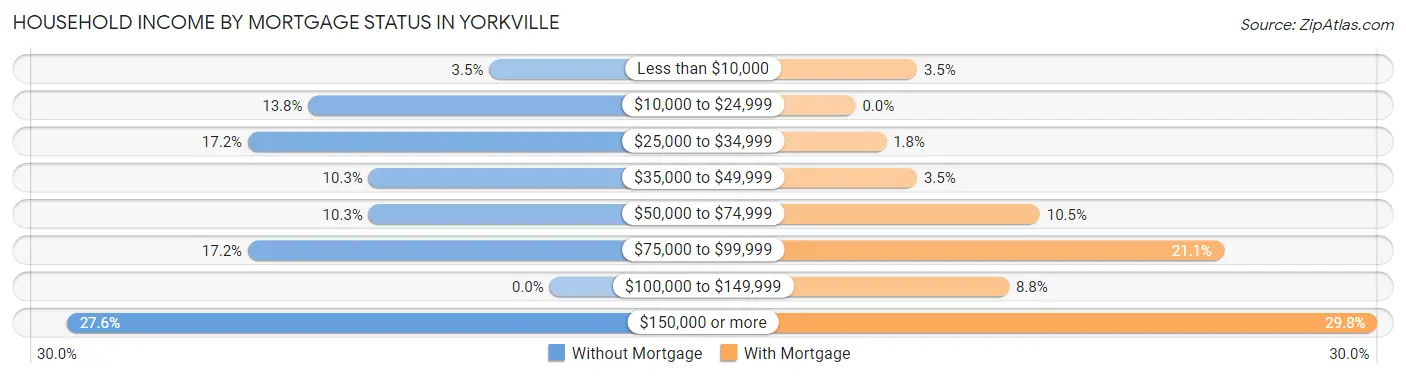
| Household Income | Without Mortgage | With Mortgage |
| Less than $10,000 | 1 (3.5%) | 2 (3.5%) |
| $10,000 to $24,999 | 4 (13.8%) | 0 (0.0%) |
| $25,000 to $34,999 | 5 (17.2%) | 1 (1.8%) |
| $35,000 to $49,999 | 3 (10.3%) | 2 (3.5%) |
| $50,000 to $74,999 | 3 (10.3%) | 6 (10.5%) |
| $75,000 to $99,999 | 5 (17.2%) | 12 (21.0%) |
| $100,000 to $149,999 | 0 (0.0%) | 5 (8.8%) |
| $150,000 or more | 8 (27.6%) | 17 (29.8%) |
| Total | 29 (100.0%) | 57 (100.0%) |
Property Value to Household Income Ratio in Yorkville
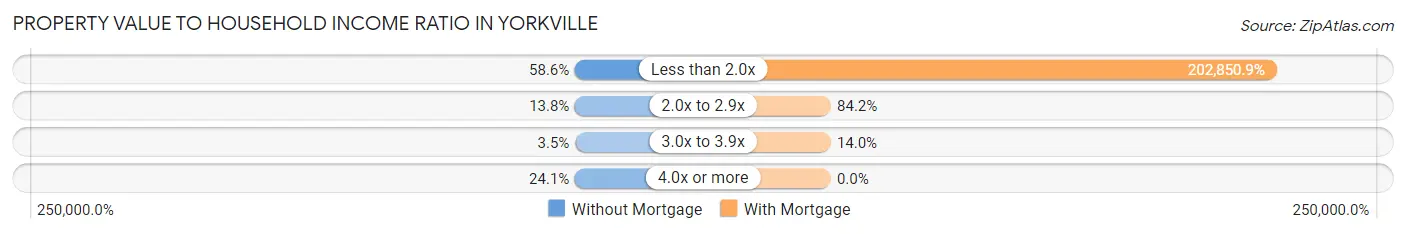
| Value-to-Income Ratio | Without Mortgage | With Mortgage |
| Less than 2.0x | 17 (58.6%) | 115,625 (202,850.9%) |
| 2.0x to 2.9x | 4 (13.8%) | 48 (84.2%) |
| 3.0x to 3.9x | 1 (3.5%) | 8 (14.0%) |
| 4.0x or more | 7 (24.1%) | 0 (0.0%) |
| Total | 29 (100.0%) | 57 (100.0%) |
Real Estate Taxes by Mortgage Status in Yorkville
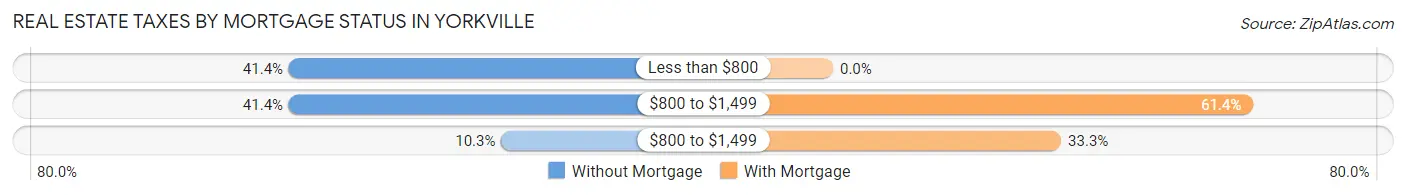
| Property Taxes | Without Mortgage | With Mortgage |
| Less than $800 | 12 (41.4%) | 0 (0.0%) |
| $800 to $1,499 | 12 (41.4%) | 35 (61.4%) |
| $800 to $1,499 | 3 (10.3%) | 19 (33.3%) |
| Total | 29 (100.0%) | 57 (100.0%) |
Health & Disability in Yorkville
Health Insurance Coverage by Age in Yorkville
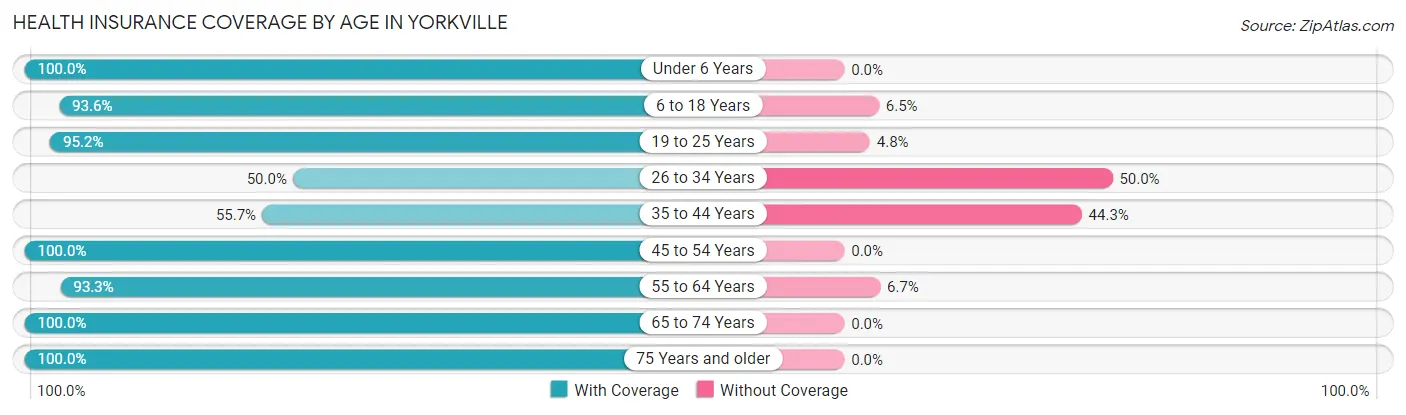
| Age Bracket | With Coverage | Without Coverage |
| Under 6 Years | 6 (100.0%) | 0 (0.0%) |
| 6 to 18 Years | 87 (93.5%) | 6 (6.5%) |
| 19 to 25 Years | 20 (95.2%) | 1 (4.8%) |
| 26 to 34 Years | 5 (50.0%) | 5 (50.0%) |
| 35 to 44 Years | 34 (55.7%) | 27 (44.3%) |
| 45 to 54 Years | 31 (100.0%) | 0 (0.0%) |
| 55 to 64 Years | 42 (93.3%) | 3 (6.7%) |
| 65 to 74 Years | 27 (100.0%) | 0 (0.0%) |
| 75 Years and older | 17 (100.0%) | 0 (0.0%) |
| Total | 269 (86.5%) | 42 (13.5%) |
Health Insurance Coverage by Citizenship Status in Yorkville
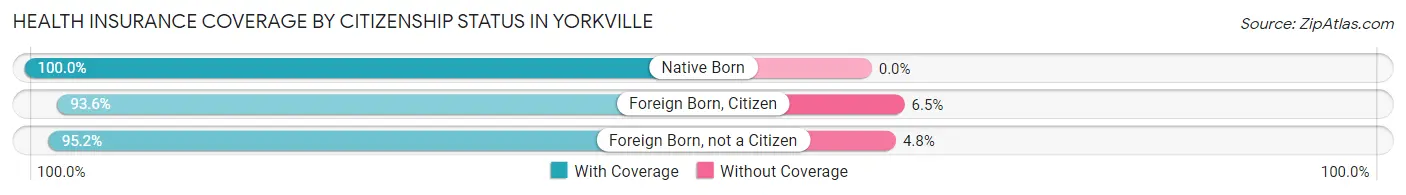
| Citizenship Status | With Coverage | Without Coverage |
| Native Born | 6 (100.0%) | 0 (0.0%) |
| Foreign Born, Citizen | 87 (93.5%) | 6 (6.5%) |
| Foreign Born, not a Citizen | 20 (95.2%) | 1 (4.8%) |
Health Insurance Coverage by Household Income in Yorkville
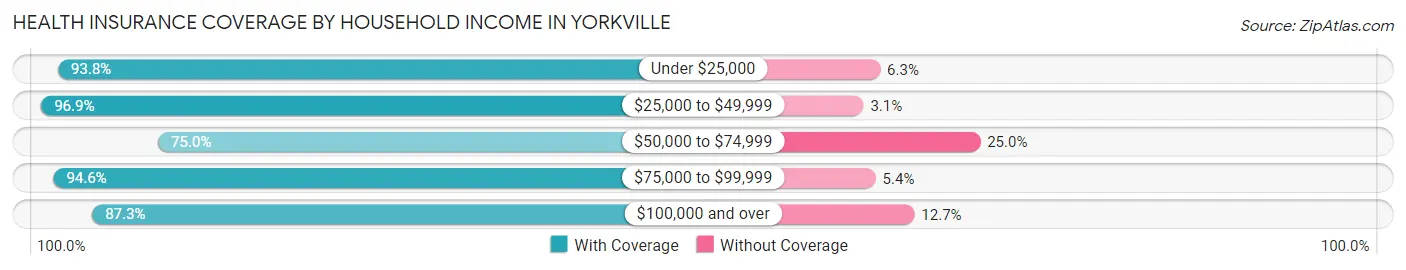
| Household Income | With Coverage | Without Coverage |
| Under $25,000 | 15 (93.8%) | 1 (6.2%) |
| $25,000 to $49,999 | 31 (96.9%) | 1 (3.1%) |
| $50,000 to $74,999 | 57 (75.0%) | 19 (25.0%) |
| $75,000 to $99,999 | 35 (94.6%) | 2 (5.4%) |
| $100,000 and over | 131 (87.3%) | 19 (12.7%) |
Public vs Private Health Insurance Coverage by Age in Yorkville
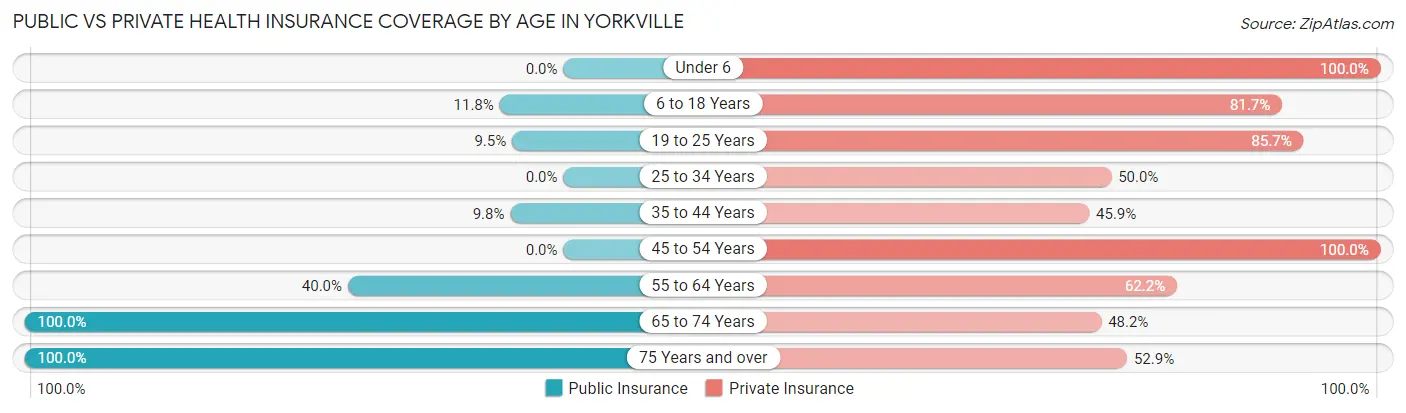
| Age Bracket | Public Insurance | Private Insurance |
| Under 6 | 0 (0.0%) | 6 (100.0%) |
| 6 to 18 Years | 11 (11.8%) | 76 (81.7%) |
| 19 to 25 Years | 2 (9.5%) | 18 (85.7%) |
| 25 to 34 Years | 0 (0.0%) | 5 (50.0%) |
| 35 to 44 Years | 6 (9.8%) | 28 (45.9%) |
| 45 to 54 Years | 0 (0.0%) | 31 (100.0%) |
| 55 to 64 Years | 18 (40.0%) | 28 (62.2%) |
| 65 to 74 Years | 27 (100.0%) | 13 (48.1%) |
| 75 Years and over | 17 (100.0%) | 9 (52.9%) |
| Total | 81 (26.1%) | 214 (68.8%) |
Disability Status by Sex by Age in Yorkville
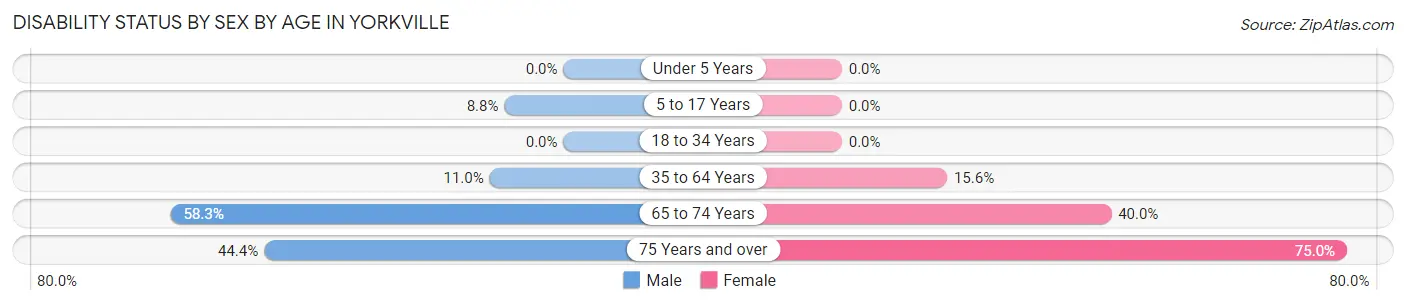
| Age Bracket | Male | Female |
| Under 5 Years | 0 (0.0%) | 0 (0.0%) |
| 5 to 17 Years | 5 (8.8%) | 0 (0.0%) |
| 18 to 34 Years | 0 (0.0%) | 0 (0.0%) |
| 35 to 64 Years | 8 (11.0%) | 10 (15.6%) |
| 65 to 74 Years | 7 (58.3%) | 6 (40.0%) |
| 75 Years and over | 4 (44.4%) | 6 (75.0%) |
Disability Class by Sex by Age in Yorkville
Disability Class: Hearing Difficulty
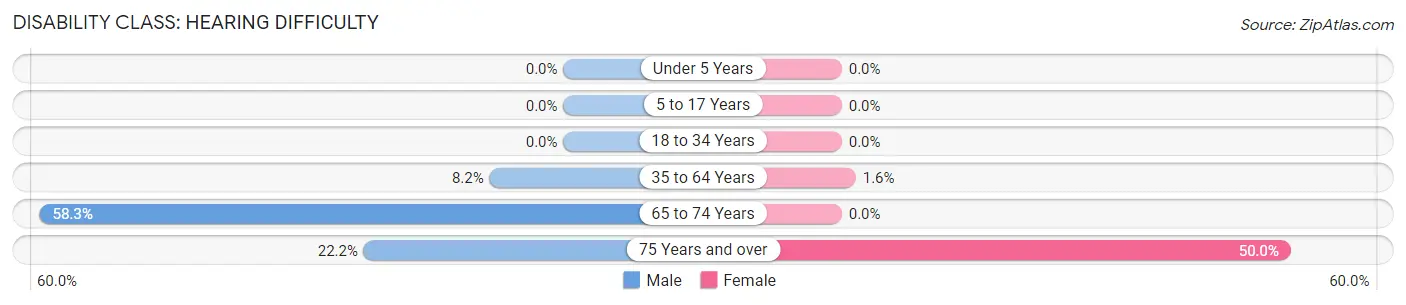
| Age Bracket | Male | Female |
| Under 5 Years | 0 (0.0%) | 0 (0.0%) |
| 5 to 17 Years | 0 (0.0%) | 0 (0.0%) |
| 18 to 34 Years | 0 (0.0%) | 0 (0.0%) |
| 35 to 64 Years | 6 (8.2%) | 1 (1.6%) |
| 65 to 74 Years | 7 (58.3%) | 0 (0.0%) |
| 75 Years and over | 2 (22.2%) | 4 (50.0%) |
Disability Class: Vision Difficulty
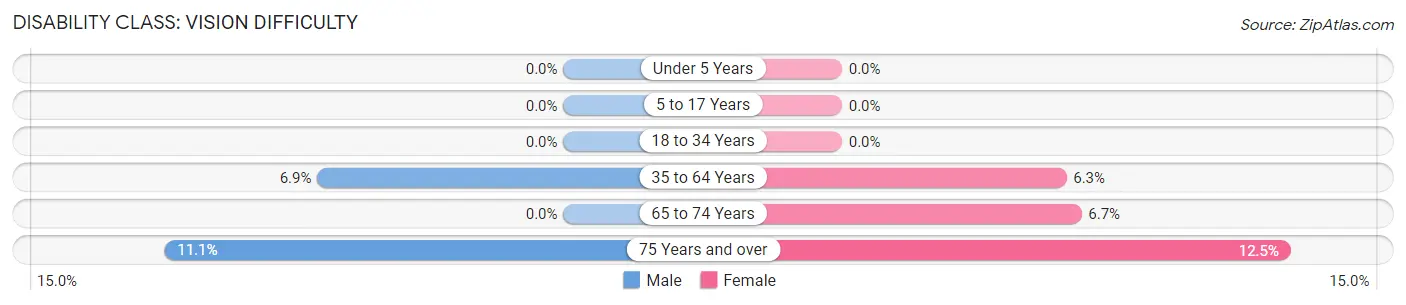
| Age Bracket | Male | Female |
| Under 5 Years | 0 (0.0%) | 0 (0.0%) |
| 5 to 17 Years | 0 (0.0%) | 0 (0.0%) |
| 18 to 34 Years | 0 (0.0%) | 0 (0.0%) |
| 35 to 64 Years | 5 (6.9%) | 4 (6.2%) |
| 65 to 74 Years | 0 (0.0%) | 1 (6.7%) |
| 75 Years and over | 1 (11.1%) | 1 (12.5%) |
Disability Class: Cognitive Difficulty
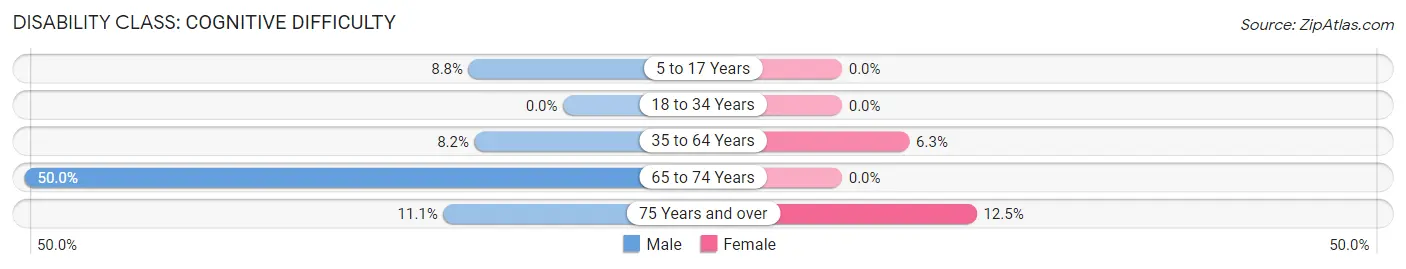
| Age Bracket | Male | Female |
| 5 to 17 Years | 5 (8.8%) | 0 (0.0%) |
| 18 to 34 Years | 0 (0.0%) | 0 (0.0%) |
| 35 to 64 Years | 6 (8.2%) | 4 (6.2%) |
| 65 to 74 Years | 6 (50.0%) | 0 (0.0%) |
| 75 Years and over | 1 (11.1%) | 1 (12.5%) |
Disability Class: Ambulatory Difficulty
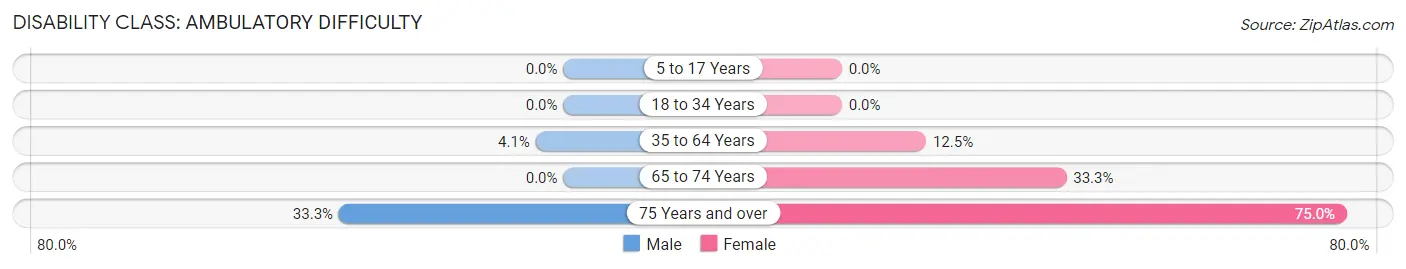
| Age Bracket | Male | Female |
| 5 to 17 Years | 0 (0.0%) | 0 (0.0%) |
| 18 to 34 Years | 0 (0.0%) | 0 (0.0%) |
| 35 to 64 Years | 3 (4.1%) | 8 (12.5%) |
| 65 to 74 Years | 0 (0.0%) | 5 (33.3%) |
| 75 Years and over | 3 (33.3%) | 6 (75.0%) |
Disability Class: Self-Care Difficulty
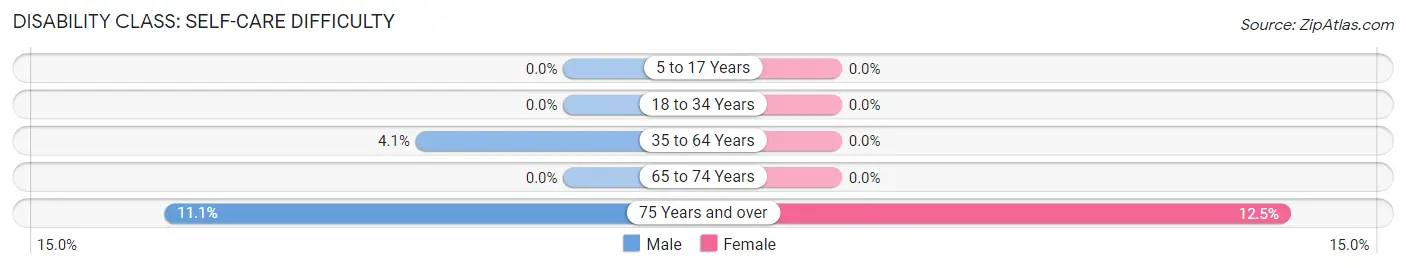
| Age Bracket | Male | Female |
| 5 to 17 Years | 0 (0.0%) | 0 (0.0%) |
| 18 to 34 Years | 0 (0.0%) | 0 (0.0%) |
| 35 to 64 Years | 3 (4.1%) | 0 (0.0%) |
| 65 to 74 Years | 0 (0.0%) | 0 (0.0%) |
| 75 Years and over | 1 (11.1%) | 1 (12.5%) |
Technology Access in Yorkville
Computing Device Access in Yorkville
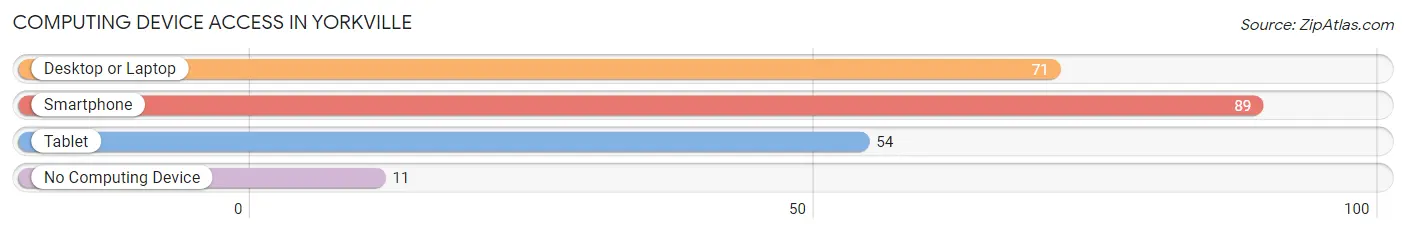
| Device Type | # Households | % Households |
| Desktop or Laptop | 71 | 63.4% |
| Smartphone | 89 | 79.5% |
| Tablet | 54 | 48.2% |
| No Computing Device | 11 | 9.8% |
| Total | 112 | 100.0% |
Internet Access in Yorkville
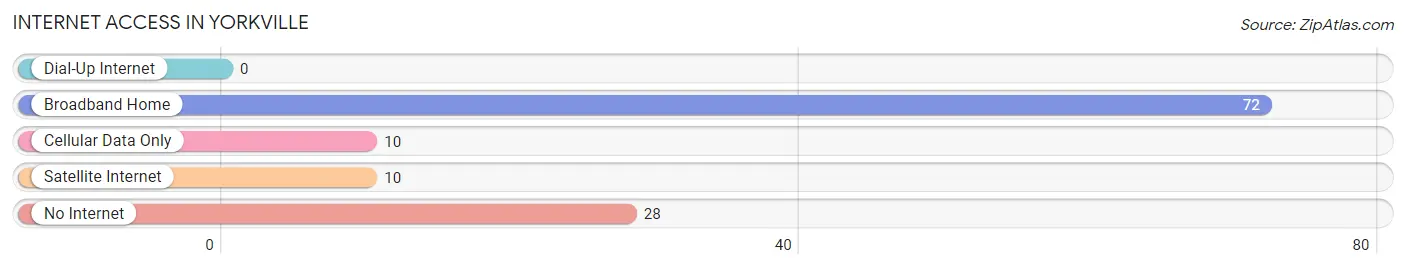
| Internet Type | # Households | % Households |
| Dial-Up Internet | 0 | 0.0% |
| Broadband Home | 72 | 64.3% |
| Cellular Data Only | 10 | 8.9% |
| Satellite Internet | 10 | 8.9% |
| No Internet | 28 | 25.0% |
| Total | 112 | 100.0% |
Yorkville Summary
Yorkville is a small town located in the state of Tennessee, in the United States of America. It is situated in the eastern part of the state, in the foothills of the Appalachian Mountains. The town is located in the county of Blount, and is part of the Knoxville Metropolitan Statistical Area. The population of Yorkville was estimated to be 1,845 in the year 2020.
History
Yorkville was founded in 1820 by a group of settlers from North Carolina. The town was named after the city of York, England, and was originally known as York’s Crossroads. The town was incorporated in 1836, and the first post office was established in 1837.
The town was an important stop on the stagecoach route between Knoxville and Chattanooga. The town was also a major stop on the East Tennessee and Georgia Railroad, which was completed in 1855.
The town was the site of a major Civil War battle in 1863, when Union forces under General Ambrose Burnside defeated Confederate forces under General James Longstreet. The town was also the site of a major battle in the Knoxville Campaign of 1864, when Union forces under General William T. Sherman defeated Confederate forces under General John Bell Hood.
Geography
Yorkville is located in the foothills of the Appalachian Mountains, in the eastern part of Tennessee. The town is situated in the county of Blount, and is part of the Knoxville Metropolitan Statistical Area. The town is located at an elevation of 890 feet above sea level.
The town is located in a valley, surrounded by hills and mountains. The nearest major city is Knoxville, which is located about 25 miles to the west. The nearest major airport is McGhee Tyson Airport, which is located about 30 miles to the west.
Economy
The economy of Yorkville is largely based on agriculture and tourism. The town is home to several farms, which produce a variety of crops, including corn, soybeans, wheat, and hay. The town is also home to several wineries, which produce a variety of wines.
The town is also a popular tourist destination, due to its proximity to the Great Smoky Mountains National Park. The town is home to several bed and breakfasts, as well as several restaurants and shops.
Demographics
The population of Yorkville was estimated to be 1,845 in the year 2020. The population is predominantly white, with a small minority of African Americans. The median household income is $41,945, and the median home value is $133,400. The town has a poverty rate of 16.3%, which is higher than the national average.
Conclusion
Yorkville is a small town located in the eastern part of Tennessee, in the foothills of the Appalachian Mountains. The town was founded in 1820, and was an important stop on the stagecoach route between Knoxville and Chattanooga. The town was also the site of a major Civil War battle in 1863, and a major battle in the Knoxville Campaign of 1864. The economy of Yorkville is largely based on agriculture and tourism, and the population of the town was estimated to be 1,845 in the year 2020.
Common Questions
What is Per Capita Income in Yorkville?
Per Capita income in Yorkville is $39,253.
What is the Median Family Income in Yorkville?
Median Family Income in Yorkville is $108,750.
What is the Median Household income in Yorkville?
Median Household Income in Yorkville is $68,750.
What is Income or Wage Gap in Yorkville?
Income or Wage Gap in Yorkville is 19.6%.
Women in Yorkville earn 80.4 cents for every dollar earned by a man.
What is Inequality or Gini Index in Yorkville?
Inequality or Gini Index in Yorkville is 0.46.
What is the Total Population of Yorkville?
Total Population of Yorkville is 311.
What is the Total Male Population of Yorkville?
Total Male Population of Yorkville is 169.
What is the Total Female Population of Yorkville?
Total Female Population of Yorkville is 142.
What is the Ratio of Males per 100 Females in Yorkville?
There are 119.01 Males per 100 Females in Yorkville.
What is the Ratio of Females per 100 Males in Yorkville?
There are 84.02 Females per 100 Males in Yorkville.
What is the Median Population Age in Yorkville?
Median Population Age in Yorkville is 38.6 Years.
What is the Average Family Size in Yorkville
Average Family Size in Yorkville is 3.5 People.
What is the Average Household Size in Yorkville
Average Household Size in Yorkville is 2.8 People.
How Large is the Labor Force in Yorkville?
There are 164 People in the Labor Forcein in Yorkville.
What is the Percentage of People in the Labor Force in Yorkville?
67.8% of People are in the Labor Force in Yorkville.