Newport East, RI Map & Demographics
Newport East Map
Newport East Overview
$49,155
PER CAPITA INCOME
$106,658
AVG FAMILY INCOME
$90,659
AVG HOUSEHOLD INCOME
33.2%
WAGE / INCOME GAP [ % ]
66.8¢/ $1
WAGE / INCOME GAP [ $ ]
0.44
INEQUALITY / GINI INDEX
11,644
TOTAL POPULATION
5,591
MALE POPULATION
6,053
FEMALE POPULATION
92.37
MALES / 100 FEMALES
108.26
FEMALES / 100 MALES
45.2
MEDIAN AGE
2.8
AVG FAMILY SIZE
2.2
AVG HOUSEHOLD SIZE
6,547
LABOR FORCE [ PEOPLE ]
66.6%
PERCENT IN LABOR FORCE
5.8%
UNEMPLOYMENT RATE
Income in Newport East
Income Overview in Newport East
Per Capita Income in Newport East is $49,155, while median incomes of families and households are $106,658 and $90,659 respectively.
| Characteristic | Number | Measure |
| Per Capita Income | 11,644 | $49,155 |
| Median Family Income | 2,958 | $106,658 |
| Mean Family Income | 2,958 | $127,533 |
| Median Household Income | 5,131 | $90,659 |
| Mean Household Income | 5,131 | $109,310 |
| Income Deficit | 2,958 | $0 |
| Wage / Income Gap (%) | 11,644 | 33.20% |
| Wage / Income Gap ($) | 11,644 | 66.80¢ per $1 |
| Gini / Inequality Index | 11,644 | 0.44 |
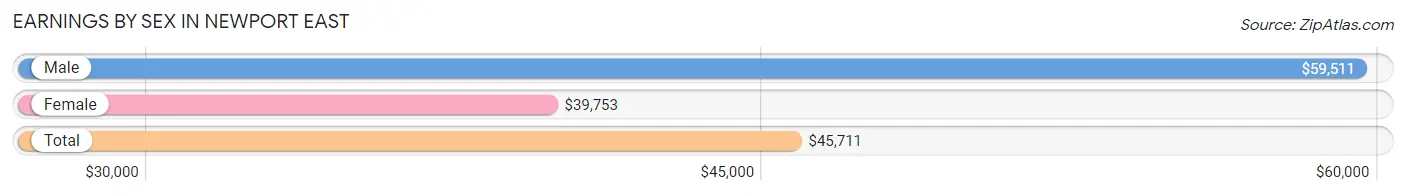
Earnings by Sex in Newport East
Average Earnings in Newport East are $45,711, $59,511 for men and $39,753 for women, a difference of 33.2%.
| Sex | Number | Average Earnings |
| Male | 3,403 (50.3%) | $59,511 |
| Female | 3,365 (49.7%) | $39,753 |
| Total | 6,768 (100.0%) | $45,711 |
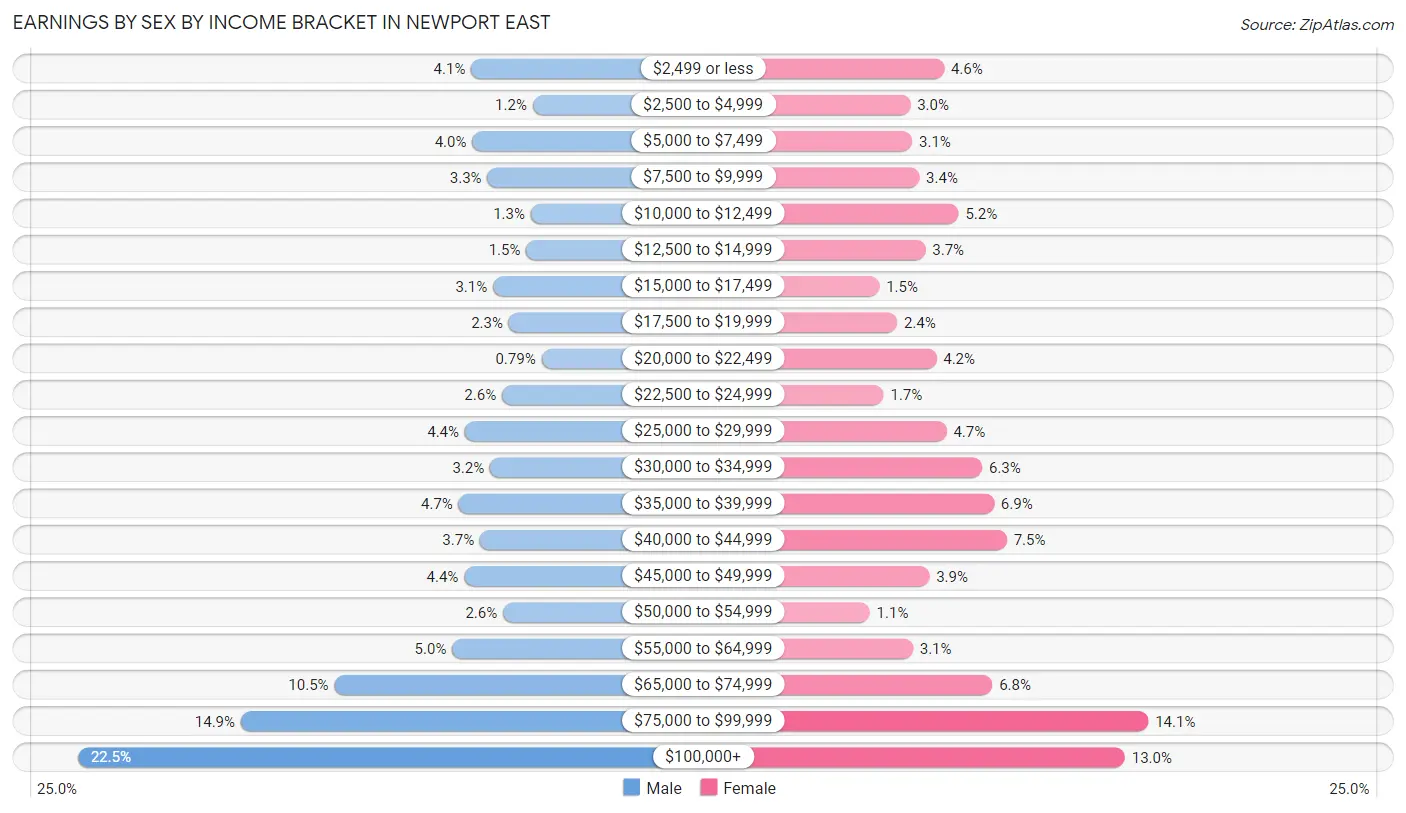
Earnings by Sex by Income Bracket in Newport East
The most common earnings brackets in Newport East are $100,000+ for men (766 | 22.5%) and $75,000 to $99,999 for women (475 | 14.1%).
| Income | Male | Female |
| $2,499 or less | 139 (4.1%) | 153 (4.5%) |
| $2,500 to $4,999 | 41 (1.2%) | 100 (3.0%) |
| $5,000 to $7,499 | 137 (4.0%) | 103 (3.1%) |
| $7,500 to $9,999 | 113 (3.3%) | 114 (3.4%) |
| $10,000 to $12,499 | 44 (1.3%) | 176 (5.2%) |
| $12,500 to $14,999 | 51 (1.5%) | 124 (3.7%) |
| $15,000 to $17,499 | 104 (3.1%) | 51 (1.5%) |
| $17,500 to $19,999 | 79 (2.3%) | 79 (2.4%) |
| $20,000 to $22,499 | 27 (0.8%) | 141 (4.2%) |
| $22,500 to $24,999 | 90 (2.6%) | 58 (1.7%) |
| $25,000 to $29,999 | 149 (4.4%) | 157 (4.7%) |
| $30,000 to $34,999 | 109 (3.2%) | 213 (6.3%) |
| $35,000 to $39,999 | 159 (4.7%) | 232 (6.9%) |
| $40,000 to $44,999 | 125 (3.7%) | 252 (7.5%) |
| $45,000 to $49,999 | 150 (4.4%) | 130 (3.9%) |
| $50,000 to $54,999 | 88 (2.6%) | 36 (1.1%) |
| $55,000 to $64,999 | 169 (5.0%) | 104 (3.1%) |
| $65,000 to $74,999 | 357 (10.5%) | 229 (6.8%) |
| $75,000 to $99,999 | 506 (14.9%) | 475 (14.1%) |
| $100,000+ | 766 (22.5%) | 438 (13.0%) |
| Total | 3,403 (100.0%) | 3,365 (100.0%) |
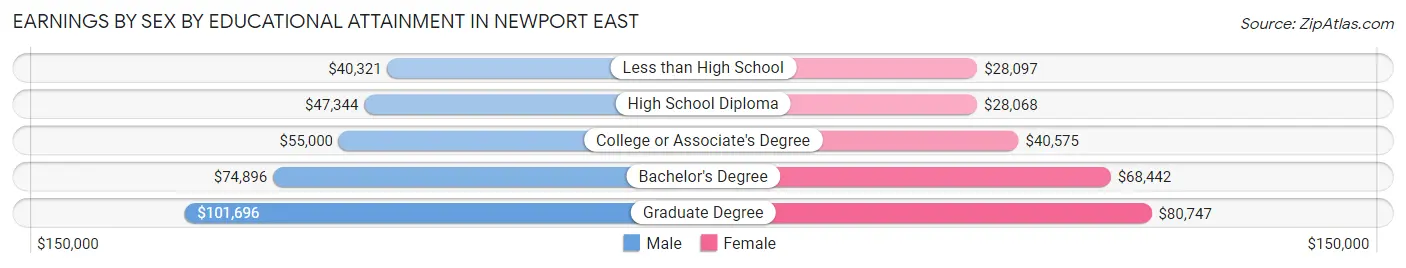
Earnings by Sex by Educational Attainment in Newport East
Average earnings in Newport East are $67,866 for men and $42,703 for women, a difference of 37.1%. Men with an educational attainment of graduate degree enjoy the highest average annual earnings of $101,696, while those with less than high school education earn the least with $40,321. Women with an educational attainment of graduate degree earn the most with the average annual earnings of $80,747, while those with high school diploma education have the smallest earnings of $28,068.
| Educational Attainment | Male Income | Female Income |
| Less than High School | $40,321 | $28,097 |
| High School Diploma | $47,344 | $28,068 |
| College or Associate's Degree | $55,000 | $40,575 |
| Bachelor's Degree | $74,896 | $68,442 |
| Graduate Degree | $101,696 | $80,747 |
| Total | $67,866 | $42,703 |
Family Income in Newport East
Family Income Brackets in Newport East
According to the Newport East family income data, there are 600 families falling into the $100,000 to $149,999 income range, which is the most common income bracket and makes up 20.3% of all families. Conversely, the $10,000 to $14,999 income bracket is the least frequent group with only 38 families (1.3%) belonging to this category.
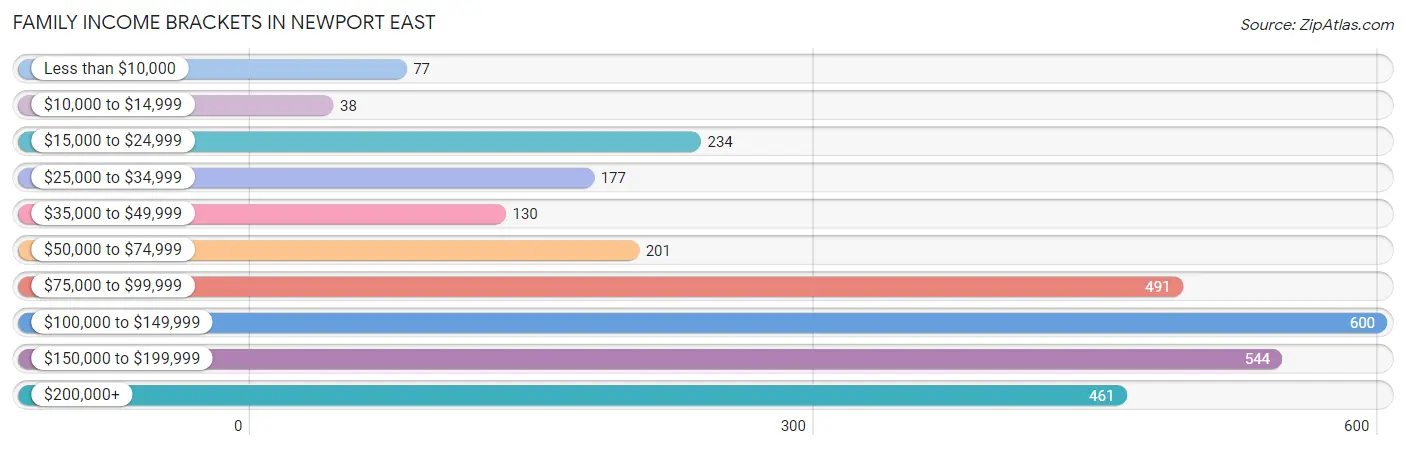
| Income Bracket | # Families | % Families |
| Less than $10,000 | 77 | 2.6% |
| $10,000 to $14,999 | 38 | 1.3% |
| $15,000 to $24,999 | 234 | 7.9% |
| $25,000 to $34,999 | 177 | 6.0% |
| $35,000 to $49,999 | 130 | 4.4% |
| $50,000 to $74,999 | 201 | 6.8% |
| $75,000 to $99,999 | 491 | 16.6% |
| $100,000 to $149,999 | 600 | 20.3% |
| $150,000 to $199,999 | 544 | 18.4% |
| $200,000+ | 461 | 15.6% |
Family Income by Famaliy Size in Newport East
3-person families (698 | 23.6%) account for the highest median family income in Newport East with $122,847 per family, while 2-person families (1,569 | 53.0%) have the highest median income of $48,775 per family member.
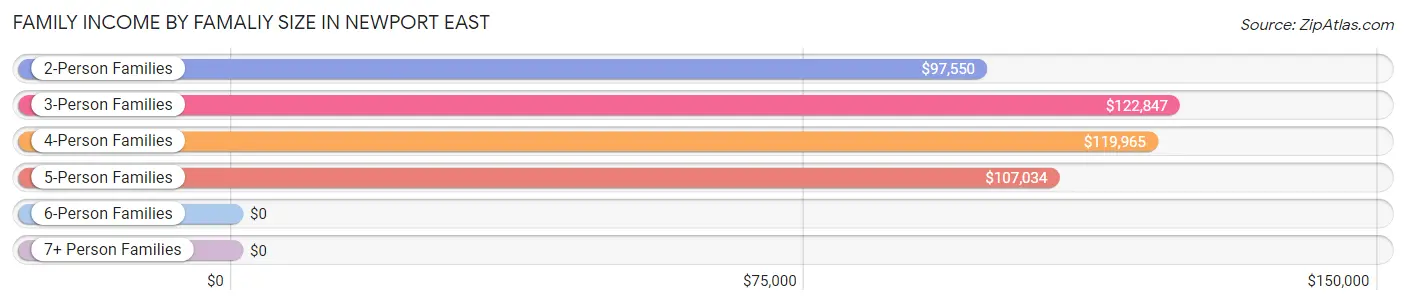
| Income Bracket | # Families | Median Income |
| 2-Person Families | 1,569 (53.0%) | $97,550 |
| 3-Person Families | 698 (23.6%) | $122,847 |
| 4-Person Families | 479 (16.2%) | $119,965 |
| 5-Person Families | 170 (5.8%) | $107,034 |
| 6-Person Families | 29 (1.0%) | $0 |
| 7+ Person Families | 13 (0.4%) | $0 |
| Total | 2,958 (100.0%) | $106,658 |
Family Income by Number of Earners in Newport East
The median family income in Newport East is $106,658, with families comprising 3+ earners (423) having the highest median family income of $153,359, while families with no earners (407) have the lowest median family income of $54,438, accounting for 14.3% and 13.8% of families, respectively.
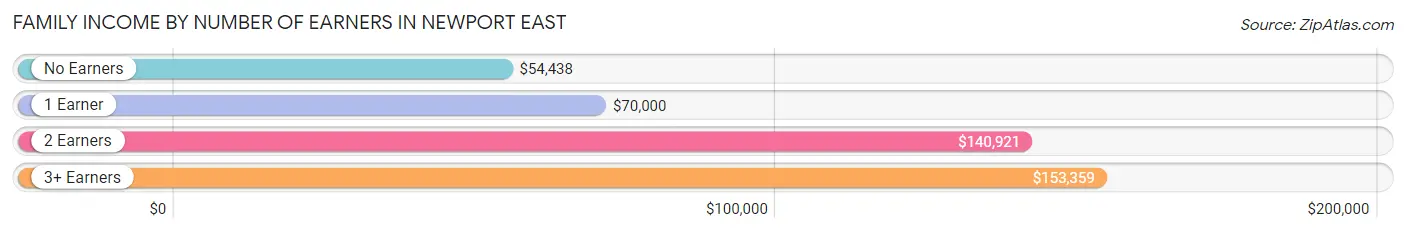
| Number of Earners | # Families | Median Income |
| No Earners | 407 (13.8%) | $54,438 |
| 1 Earner | 980 (33.1%) | $70,000 |
| 2 Earners | 1,148 (38.8%) | $140,921 |
| 3+ Earners | 423 (14.3%) | $153,359 |
| Total | 2,958 (100.0%) | $106,658 |
Household Income in Newport East
Household Income Brackets in Newport East
With 1,001 households falling in the category, the $100,000 to $149,999 income range is the most frequent in Newport East, accounting for 19.5% of all households. In contrast, only 133 households (2.6%) fall into the $10,000 to $14,999 income bracket, making it the least populous group.
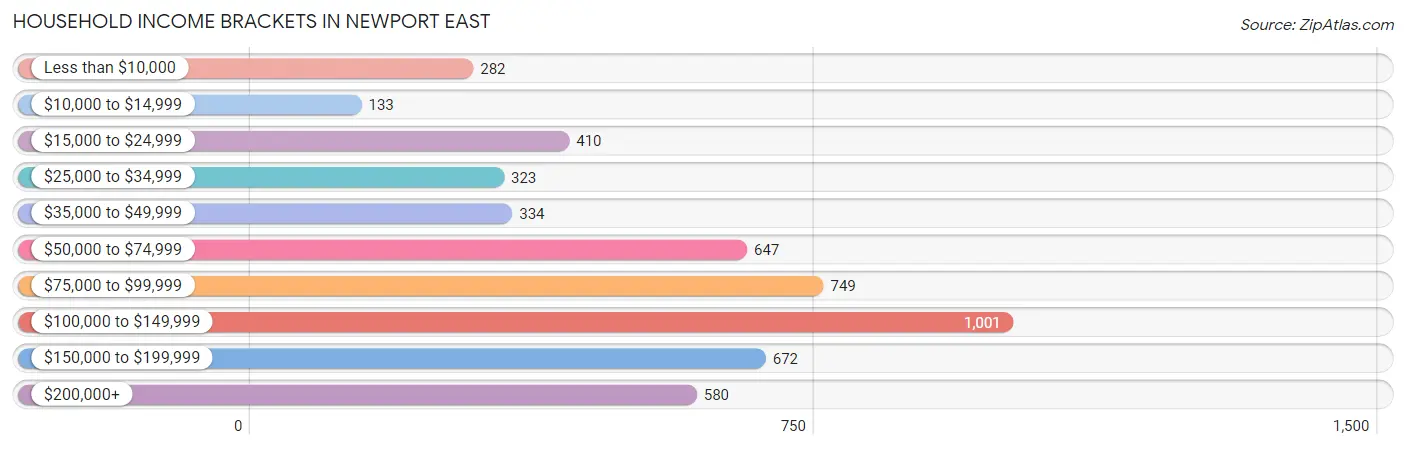
| Income Bracket | # Households | % Households |
| Less than $10,000 | 282 | 5.5% |
| $10,000 to $14,999 | 133 | 2.6% |
| $15,000 to $24,999 | 410 | 8.0% |
| $25,000 to $34,999 | 323 | 6.3% |
| $35,000 to $49,999 | 334 | 6.5% |
| $50,000 to $74,999 | 647 | 12.6% |
| $75,000 to $99,999 | 749 | 14.6% |
| $100,000 to $149,999 | 1,001 | 19.5% |
| $150,000 to $199,999 | 672 | 13.1% |
| $200,000+ | 580 | 11.3% |
Household Income by Householder Age in Newport East
The median household income in Newport East is $90,659, with the highest median household income of $126,179 found in the 45 to 64 years age bracket for the primary householder. A total of 1,809 households (35.3%) fall into this category. Meanwhile, the 15 to 24 years age bracket for the primary householder has the lowest median household income of $0, with 146 households (2.9%) in this group.
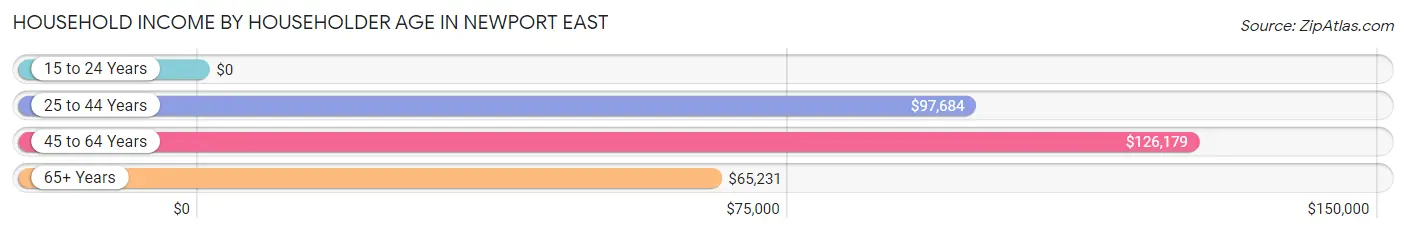
| Income Bracket | # Households | Median Income |
| 15 to 24 Years | 146 (2.9%) | $0 |
| 25 to 44 Years | 1,379 (26.9%) | $97,684 |
| 45 to 64 Years | 1,809 (35.3%) | $126,179 |
| 65+ Years | 1,797 (35.0%) | $65,231 |
| Total | 5,131 (100.0%) | $90,659 |
Poverty in Newport East
Income Below Poverty by Sex and Age in Newport East
With 8.1% poverty level for males and 11.6% for females among the residents of Newport East, 5 year old males and under 5 year old females are the most vulnerable to poverty, with 57 males (67.9%) and 84 females (36.8%) in their respective age groups living below the poverty level.
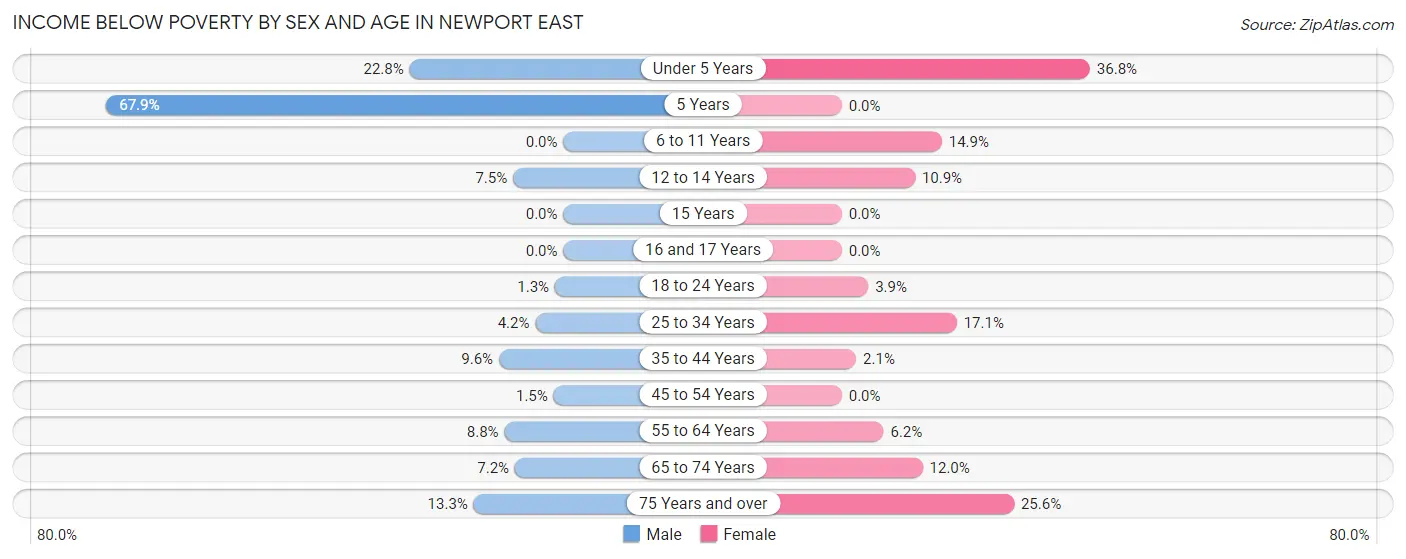
| Age Bracket | Male | Female |
| Under 5 Years | 95 (22.8%) | 84 (36.8%) |
| 5 Years | 57 (67.9%) | 0 (0.0%) |
| 6 to 11 Years | 0 (0.0%) | 30 (14.8%) |
| 12 to 14 Years | 13 (7.5%) | 19 (10.9%) |
| 15 Years | 0 (0.0%) | 0 (0.0%) |
| 16 and 17 Years | 0 (0.0%) | 0 (0.0%) |
| 18 to 24 Years | 5 (1.3%) | 13 (3.9%) |
| 25 to 34 Years | 39 (4.2%) | 177 (17.1%) |
| 35 to 44 Years | 50 (9.6%) | 12 (2.1%) |
| 45 to 54 Years | 11 (1.5%) | 0 (0.0%) |
| 55 to 64 Years | 63 (8.7%) | 51 (6.2%) |
| 65 to 74 Years | 48 (7.2%) | 96 (12.0%) |
| 75 Years and over | 63 (13.3%) | 203 (25.6%) |
| Total | 444 (8.1%) | 685 (11.6%) |
Income Above Poverty by Sex and Age in Newport East
According to the poverty statistics in Newport East, males aged 6 to 11 years and females aged 5 years are the age groups that are most secure financially, with 100.0% of males and 100.0% of females in these age groups living above the poverty line.
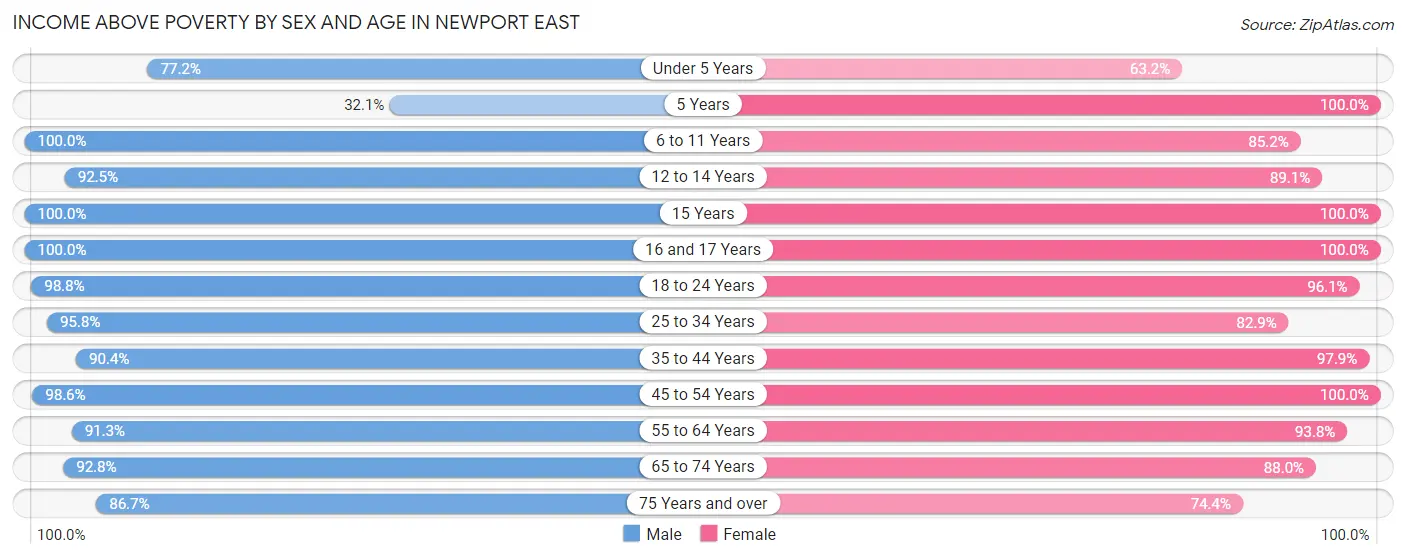
| Age Bracket | Male | Female |
| Under 5 Years | 321 (77.2%) | 144 (63.2%) |
| 5 Years | 27 (32.1%) | 182 (100.0%) |
| 6 to 11 Years | 271 (100.0%) | 172 (85.2%) |
| 12 to 14 Years | 161 (92.5%) | 156 (89.1%) |
| 15 Years | 18 (100.0%) | 49 (100.0%) |
| 16 and 17 Years | 61 (100.0%) | 121 (100.0%) |
| 18 to 24 Years | 395 (98.8%) | 319 (96.1%) |
| 25 to 34 Years | 898 (95.8%) | 860 (82.9%) |
| 35 to 44 Years | 473 (90.4%) | 552 (97.9%) |
| 45 to 54 Years | 750 (98.6%) | 608 (100.0%) |
| 55 to 64 Years | 657 (91.2%) | 772 (93.8%) |
| 65 to 74 Years | 620 (92.8%) | 704 (88.0%) |
| 75 Years and over | 410 (86.7%) | 591 (74.4%) |
| Total | 5,062 (91.9%) | 5,230 (88.4%) |
Income Below Poverty Among Married-Couple Families in Newport East
The poverty statistics for married-couple families in Newport East show that 6.2% or 127 of the total 2,059 families live below the poverty line. Families with no children have the highest poverty rate of 7.1%, comprising of 100 families. On the other hand, families with 3 or 4 children have the lowest poverty rate of 0.0%, which includes 0 families.
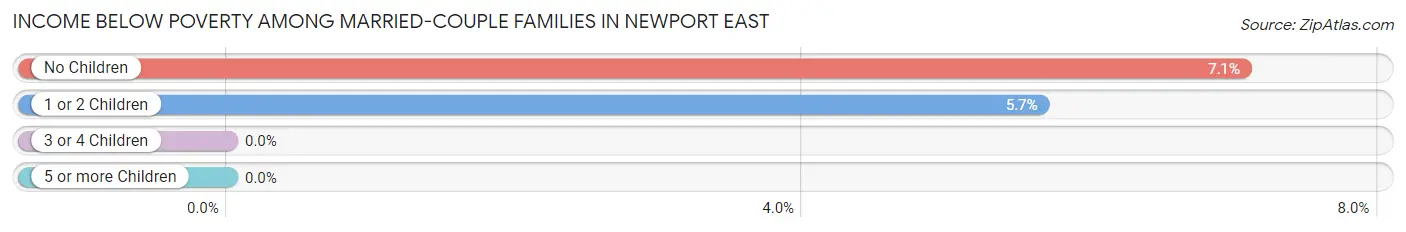
| Children | Above Poverty | Below Poverty |
| No Children | 1,317 (92.9%) | 100 (7.1%) |
| 1 or 2 Children | 451 (94.4%) | 27 (5.7%) |
| 3 or 4 Children | 151 (100.0%) | 0 (0.0%) |
| 5 or more Children | 13 (100.0%) | 0 (0.0%) |
| Total | 1,932 (93.8%) | 127 (6.2%) |
Income Below Poverty Among Single-Parent Households in Newport East
According to the poverty data in Newport East, 3.4% or 9 single-father households and 17.7% or 112 single-mother households are living below the poverty line. Among single-father households, those with 1 or 2 children have the highest poverty rate, with 9 households (5.3%) experiencing poverty. Likewise, among single-mother households, those with 3 or 4 children have the highest poverty rate, with 26 households (100.0%) falling below the poverty line.
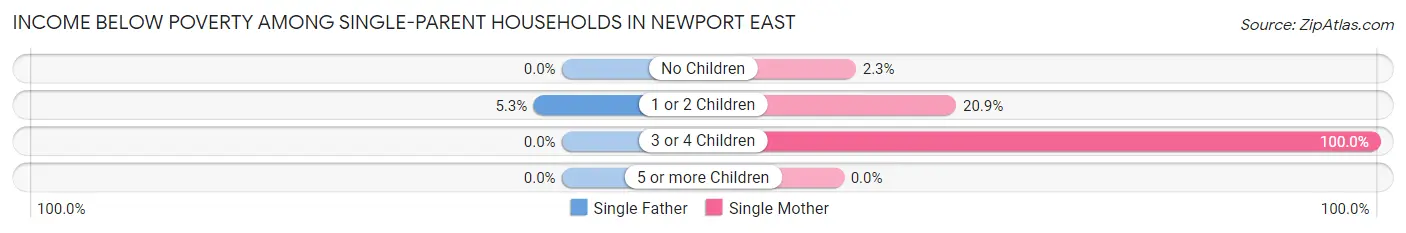
| Children | Single Father | Single Mother |
| No Children | 0 (0.0%) | 5 (2.3%) |
| 1 or 2 Children | 9 (5.3%) | 81 (20.9%) |
| 3 or 4 Children | 0 (0.0%) | 26 (100.0%) |
| 5 or more Children | 0 (0.0%) | 0 (0.0%) |
| Total | 9 (3.4%) | 112 (17.7%) |
Income Below Poverty Among Married-Couple vs Single-Parent Households in Newport East
The poverty data for Newport East shows that 127 of the married-couple family households (6.2%) and 121 of the single-parent households (13.5%) are living below the poverty level. Within the married-couple family households, those with no children have the highest poverty rate, with 100 households (7.1%) falling below the poverty line. Among the single-parent households, those with 3 or 4 children have the highest poverty rate, with 26 household (100.0%) living below poverty.
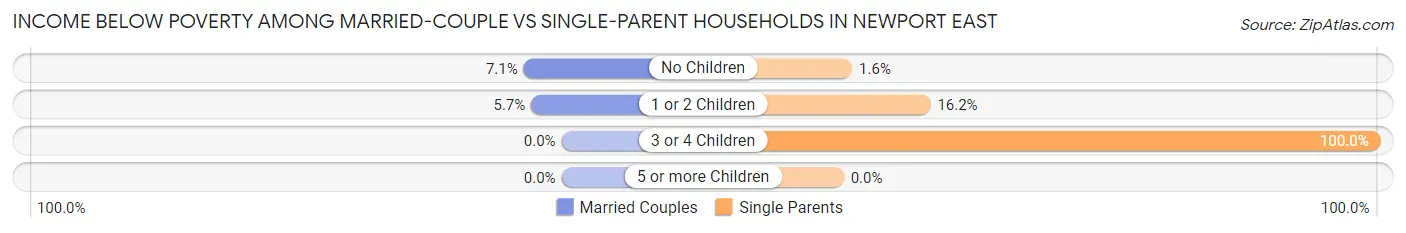
| Children | Married-Couple Families | Single-Parent Households |
| No Children | 100 (7.1%) | 5 (1.6%) |
| 1 or 2 Children | 27 (5.7%) | 90 (16.2%) |
| 3 or 4 Children | 0 (0.0%) | 26 (100.0%) |
| 5 or more Children | 0 (0.0%) | 0 (0.0%) |
| Total | 127 (6.2%) | 121 (13.5%) |
Race in Newport East
The most populous races in Newport East are White / Caucasian (9,322 | 80.1%), Black / African American (917 | 7.9%), and Two or more Races (750 | 6.4%).
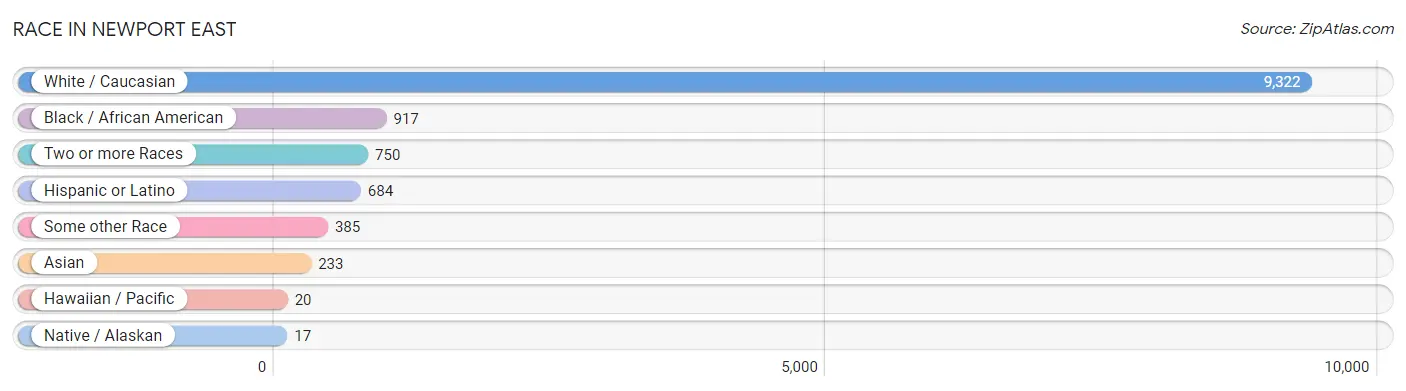
| Race | # Population | % Population |
| Asian | 233 | 2.0% |
| Black / African American | 917 | 7.9% |
| Hawaiian / Pacific | 20 | 0.2% |
| Hispanic or Latino | 684 | 5.9% |
| Native / Alaskan | 17 | 0.2% |
| White / Caucasian | 9,322 | 80.1% |
| Two or more Races | 750 | 6.4% |
| Some other Race | 385 | 3.3% |
| Total | 11,644 | 100.0% |
Ancestry in Newport East
The most populous ancestries reported in Newport East are Irish (3,141 | 27.0%), Italian (1,613 | 13.9%), English (1,572 | 13.5%), Portuguese (1,510 | 13.0%), and German (821 | 7.0%), together accounting for 74.4% of all Newport East residents.
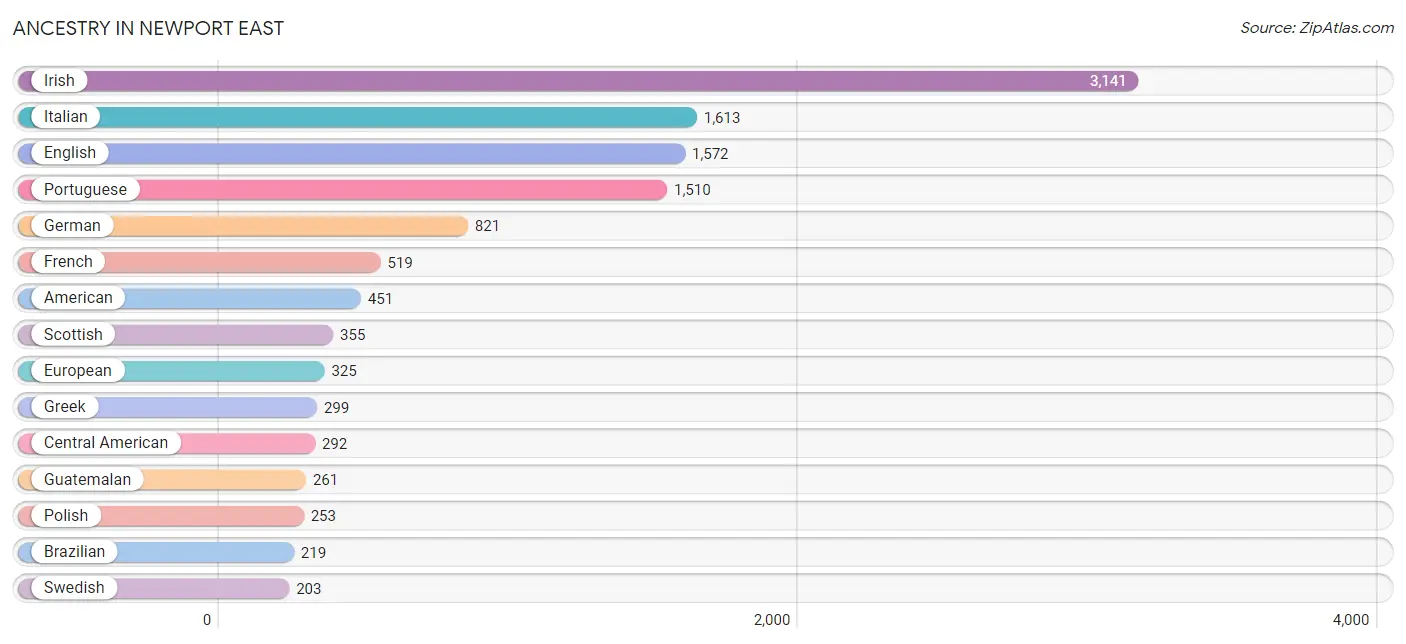
| Ancestry | # Population | % Population |
| African | 117 | 1.0% |
| American | 451 | 3.9% |
| Arab | 155 | 1.3% |
| Armenian | 13 | 0.1% |
| Assyrian / Chaldean / Syriac | 18 | 0.2% |
| Barbadian | 9 | 0.1% |
| Basque | 80 | 0.7% |
| Bhutanese | 91 | 0.8% |
| Brazilian | 219 | 1.9% |
| British | 47 | 0.4% |
| British West Indian | 12 | 0.1% |
| Burmese | 39 | 0.3% |
| Cape Verdean | 43 | 0.4% |
| Central American | 292 | 2.5% |
| Cherokee | 10 | 0.1% |
| Czech | 20 | 0.2% |
| Dominican | 34 | 0.3% |
| Dutch | 29 | 0.3% |
| Eastern European | 16 | 0.1% |
| Ecuadorian | 59 | 0.5% |
| English | 1,572 | 13.5% |
| European | 325 | 2.8% |
| Finnish | 28 | 0.2% |
| French | 519 | 4.5% |
| French Canadian | 139 | 1.2% |
| German | 821 | 7.0% |
| Ghanaian | 13 | 0.1% |
| Greek | 299 | 2.6% |
| Guatemalan | 261 | 2.2% |
| Hungarian | 25 | 0.2% |
| Indian (Asian) | 117 | 1.0% |
| Irish | 3,141 | 27.0% |
| Italian | 1,613 | 13.9% |
| Jamaican | 194 | 1.7% |
| Korean | 112 | 1.0% |
| Lebanese | 141 | 1.2% |
| Lithuanian | 68 | 0.6% |
| Lumbee | 4 | 0.0% |
| Mexican | 24 | 0.2% |
| Native Hawaiian | 21 | 0.2% |
| Nigerian | 15 | 0.1% |
| Norwegian | 61 | 0.5% |
| Polish | 253 | 2.2% |
| Portuguese | 1,510 | 13.0% |
| Puerto Rican | 197 | 1.7% |
| Russian | 37 | 0.3% |
| Salvadoran | 31 | 0.3% |
| Scandinavian | 40 | 0.3% |
| Scotch-Irish | 55 | 0.5% |
| Scottish | 355 | 3.0% |
| Sioux | 10 | 0.1% |
| Slovak | 40 | 0.3% |
| South American | 59 | 0.5% |
| Spaniard | 32 | 0.3% |
| Sri Lankan | 114 | 1.0% |
| Subsaharan African | 188 | 1.6% |
| Swedish | 203 | 1.7% |
| Swiss | 5 | 0.0% |
| Syrian | 14 | 0.1% |
| Trinidadian and Tobagonian | 25 | 0.2% |
| Welsh | 152 | 1.3% |
| West Indian | 16 | 0.1% | View All 62 Rows |
Immigrants in Newport East
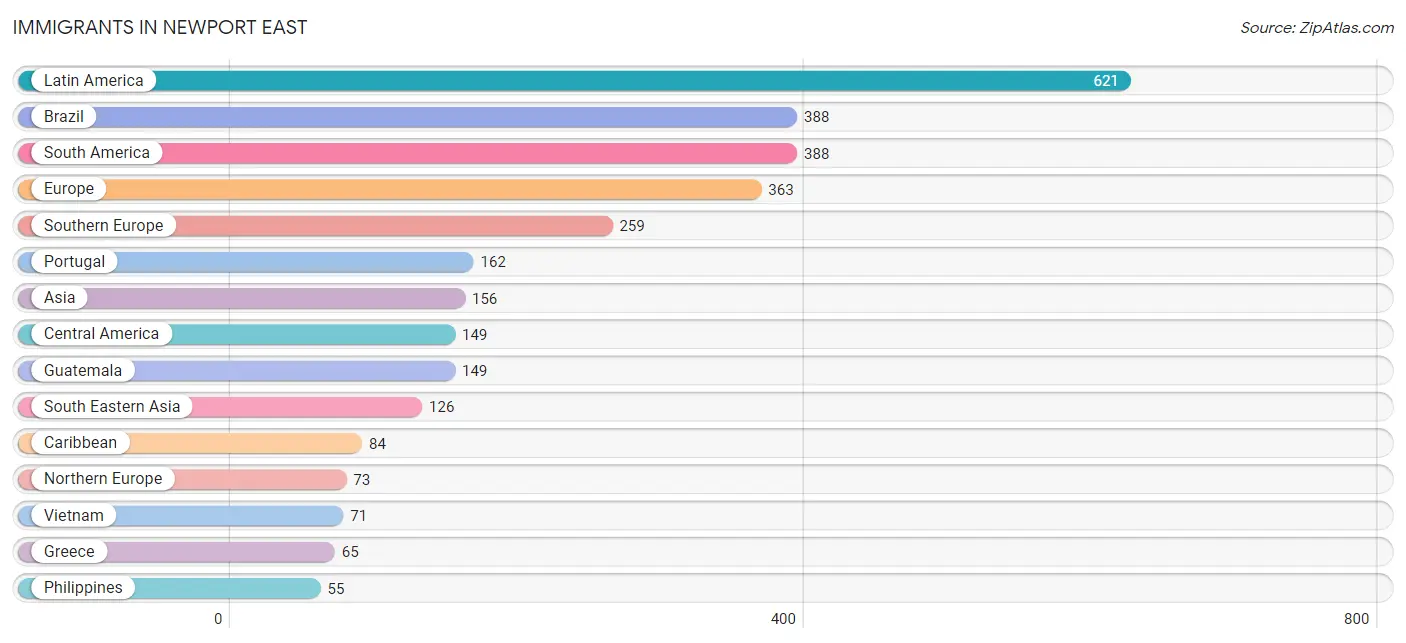
The most numerous immigrant groups reported in Newport East came from Latin America (621 | 5.3%), Brazil (388 | 3.3%), South America (388 | 3.3%), Europe (363 | 3.1%), and Southern Europe (259 | 2.2%), together accounting for 17.3% of all Newport East residents.
| Immigration Origin | # Population | % Population |
| Africa | 44 | 0.4% |
| Asia | 156 | 1.3% |
| Barbados | 9 | 0.1% |
| Brazil | 388 | 3.3% |
| Cabo Verde | 14 | 0.1% |
| Caribbean | 84 | 0.7% |
| Central America | 149 | 1.3% |
| China | 18 | 0.2% |
| Czechoslovakia | 17 | 0.2% |
| Dominican Republic | 16 | 0.1% |
| Eastern Asia | 30 | 0.3% |
| Eastern Europe | 17 | 0.2% |
| England | 3 | 0.0% |
| Europe | 363 | 3.1% |
| Germany | 14 | 0.1% |
| Greece | 65 | 0.6% |
| Guatemala | 149 | 1.3% |
| Hong Kong | 18 | 0.2% |
| Ireland | 44 | 0.4% |
| Jamaica | 22 | 0.2% |
| Korea | 12 | 0.1% |
| Latin America | 621 | 5.3% |
| Northern Europe | 73 | 0.6% |
| Philippines | 55 | 0.5% |
| Portugal | 162 | 1.4% |
| Scotland | 8 | 0.1% |
| Senegal | 17 | 0.2% |
| South America | 388 | 3.3% |
| South Eastern Asia | 126 | 1.1% |
| Southern Europe | 259 | 2.2% |
| Spain | 32 | 0.3% |
| Trinidad and Tobago | 25 | 0.2% |
| Vietnam | 71 | 0.6% |
| Western Africa | 44 | 0.4% |
| Western Europe | 14 | 0.1% | View All 35 Rows |
Sex and Age in Newport East
Sex and Age in Newport East
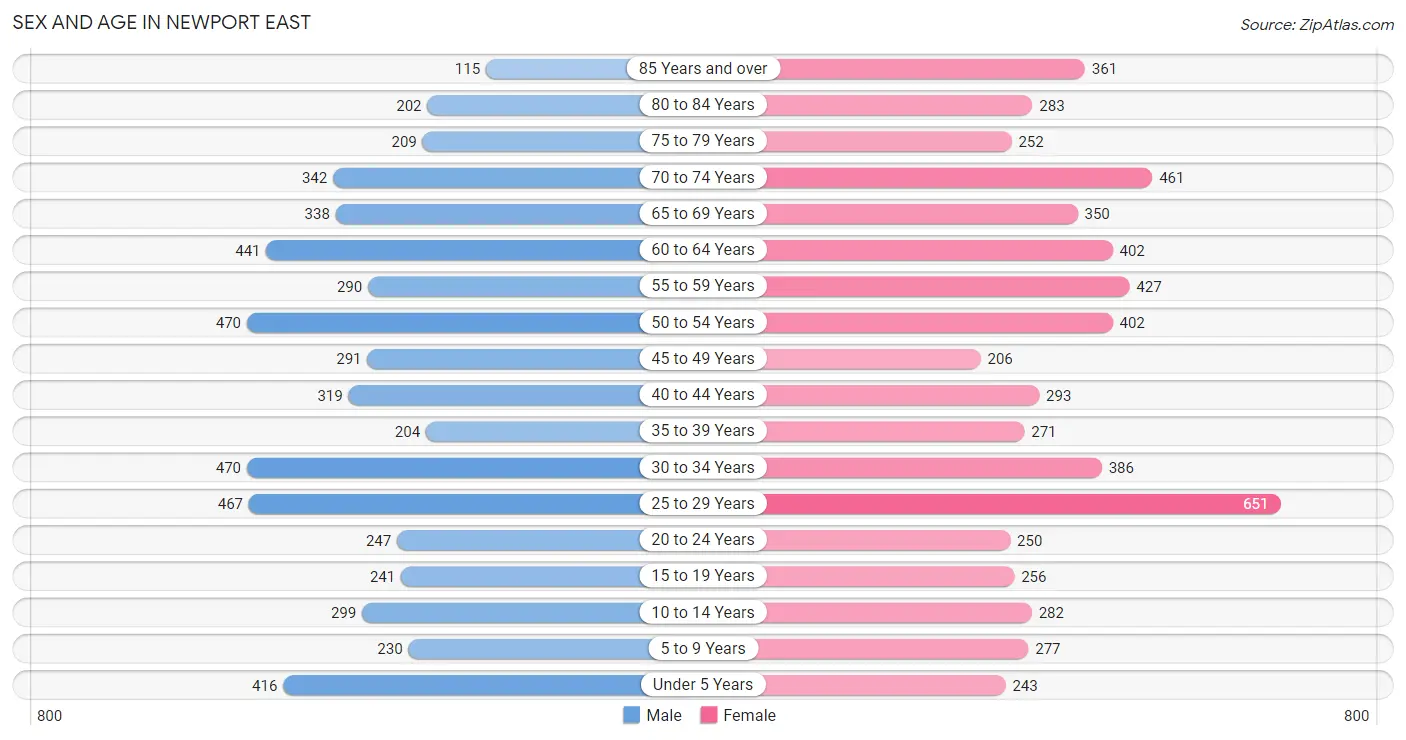
The most populous age groups in Newport East are 30 to 34 Years (470 | 8.4%) for men and 25 to 29 Years (651 | 10.7%) for women.
| Age Bracket | Male | Female |
| Under 5 Years | 416 (7.4%) | 243 (4.0%) |
| 5 to 9 Years | 230 (4.1%) | 277 (4.6%) |
| 10 to 14 Years | 299 (5.3%) | 282 (4.7%) |
| 15 to 19 Years | 241 (4.3%) | 256 (4.2%) |
| 20 to 24 Years | 247 (4.4%) | 250 (4.1%) |
| 25 to 29 Years | 467 (8.4%) | 651 (10.7%) |
| 30 to 34 Years | 470 (8.4%) | 386 (6.4%) |
| 35 to 39 Years | 204 (3.6%) | 271 (4.5%) |
| 40 to 44 Years | 319 (5.7%) | 293 (4.8%) |
| 45 to 49 Years | 291 (5.2%) | 206 (3.4%) |
| 50 to 54 Years | 470 (8.4%) | 402 (6.6%) |
| 55 to 59 Years | 290 (5.2%) | 427 (7.0%) |
| 60 to 64 Years | 441 (7.9%) | 402 (6.6%) |
| 65 to 69 Years | 338 (6.0%) | 350 (5.8%) |
| 70 to 74 Years | 342 (6.1%) | 461 (7.6%) |
| 75 to 79 Years | 209 (3.7%) | 252 (4.2%) |
| 80 to 84 Years | 202 (3.6%) | 283 (4.7%) |
| 85 Years and over | 115 (2.1%) | 361 (6.0%) |
| Total | 5,591 (100.0%) | 6,053 (100.0%) |
Families and Households in Newport East
Median Family Size in Newport East
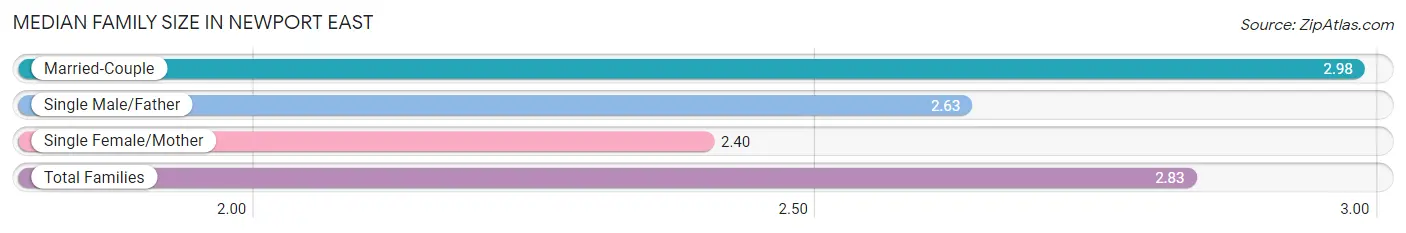
The median family size in Newport East is 2.83 persons per family, with married-couple families (2,059 | 69.6%) accounting for the largest median family size of 2.98 persons per family. On the other hand, single female/mother families (634 | 21.4%) represent the smallest median family size with 2.40 persons per family.
| Family Type | # Families | Family Size |
| Married-Couple | 2,059 (69.6%) | 2.98 |
| Single Male/Father | 265 (9.0%) | 2.63 |
| Single Female/Mother | 634 (21.4%) | 2.40 |
| Total Families | 2,958 (100.0%) | 2.83 |
Median Household Size in Newport East
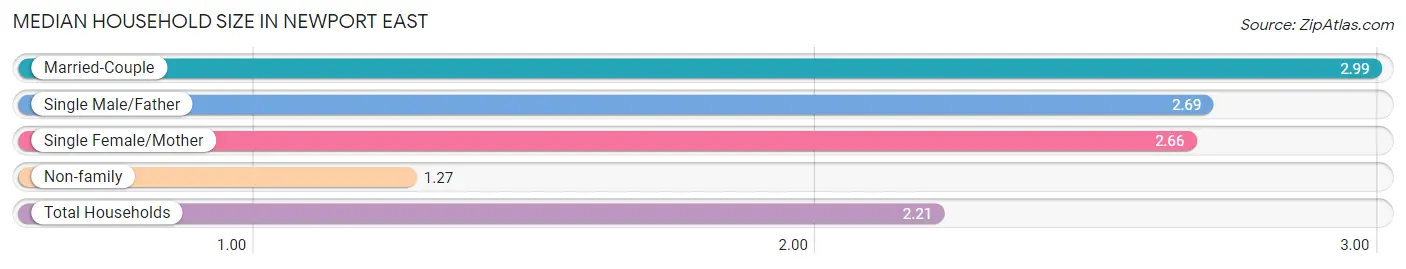
The median household size in Newport East is 2.21 persons per household, with married-couple households (2,059 | 40.1%) accounting for the largest median household size of 2.99 persons per household. non-family households (2,173 | 42.3%) represent the smallest median household size with 1.27 persons per household.
| Household Type | # Households | Household Size |
| Married-Couple | 2,059 (40.1%) | 2.99 |
| Single Male/Father | 265 (5.2%) | 2.69 |
| Single Female/Mother | 634 (12.4%) | 2.66 |
| Non-family | 2,173 (42.3%) | 1.27 |
| Total Households | 5,131 (100.0%) | 2.21 |
Household Size by Marriage Status in Newport East
Out of a total of 5,131 households in Newport East, 2,958 (57.7%) are family households, while 2,173 (42.3%) are nonfamily households. The most numerous type of family households are 2-person households, comprising 1,453, and the most common type of nonfamily households are 1-person households, comprising 1,604.
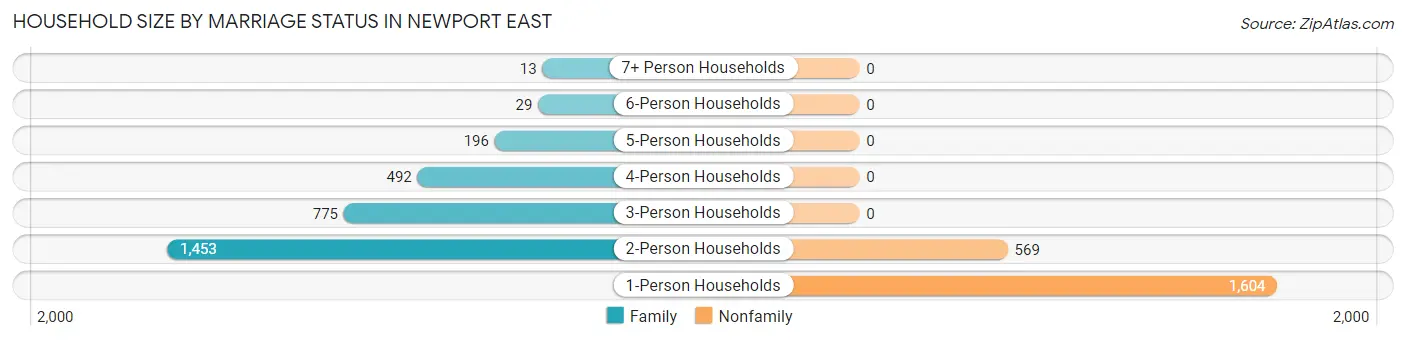
| Household Size | Family Households | Nonfamily Households |
| 1-Person Households | - | 1,604 (31.3%) |
| 2-Person Households | 1,453 (28.3%) | 569 (11.1%) |
| 3-Person Households | 775 (15.1%) | 0 (0.0%) |
| 4-Person Households | 492 (9.6%) | 0 (0.0%) |
| 5-Person Households | 196 (3.8%) | 0 (0.0%) |
| 6-Person Households | 29 (0.6%) | 0 (0.0%) |
| 7+ Person Households | 13 (0.3%) | 0 (0.0%) |
| Total | 2,958 (57.7%) | 2,173 (42.3%) |
Female Fertility in Newport East
Fertility by Age in Newport East
Average fertility rate in Newport East is 70.0 births per 1,000 women. Women in the age bracket of 20 to 34 years have the highest fertility rate with 110.0 births per 1,000 women. Women in the age bracket of 20 to 34 years acount for 82.9% of all women with births.
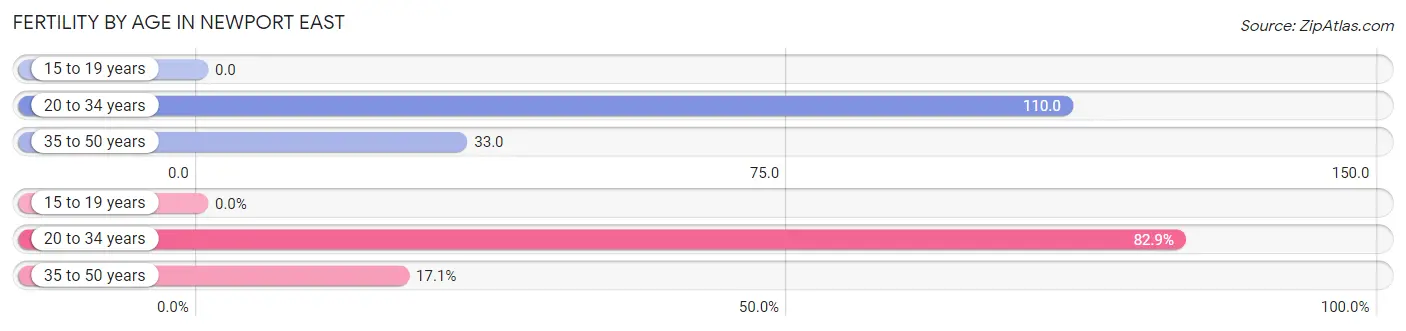
| Age Bracket | Women with Births | Births / 1,000 Women |
| 15 to 19 years | 0 (0.0%) | 0.0 |
| 20 to 34 years | 141 (82.9%) | 110.0 |
| 35 to 50 years | 29 (17.1%) | 33.0 |
| Total | 170 (100.0%) | 70.0 |
Fertility by Age by Marriage Status in Newport East
48.8% of women with births (170) in Newport East are married. The highest percentage of unmarried women with births falls into 20 to 34 years age bracket with 61.7% of them unmarried at the time of birth, while the lowest percentage of unmarried women with births belong to 35 to 50 years age bracket with 0.0% of them unmarried.
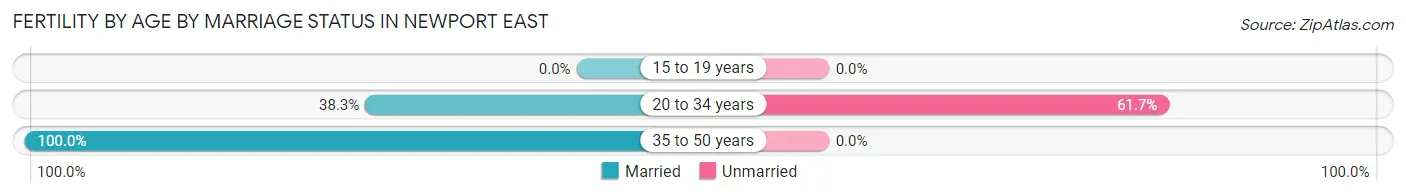
| Age Bracket | Married | Unmarried |
| 15 to 19 years | 0 (0.0%) | 0 (0.0%) |
| 20 to 34 years | 54 (38.3%) | 87 (61.7%) |
| 35 to 50 years | 29 (100.0%) | 0 (0.0%) |
| Total | 83 (48.8%) | 87 (51.2%) |
Fertility by Education in Newport East
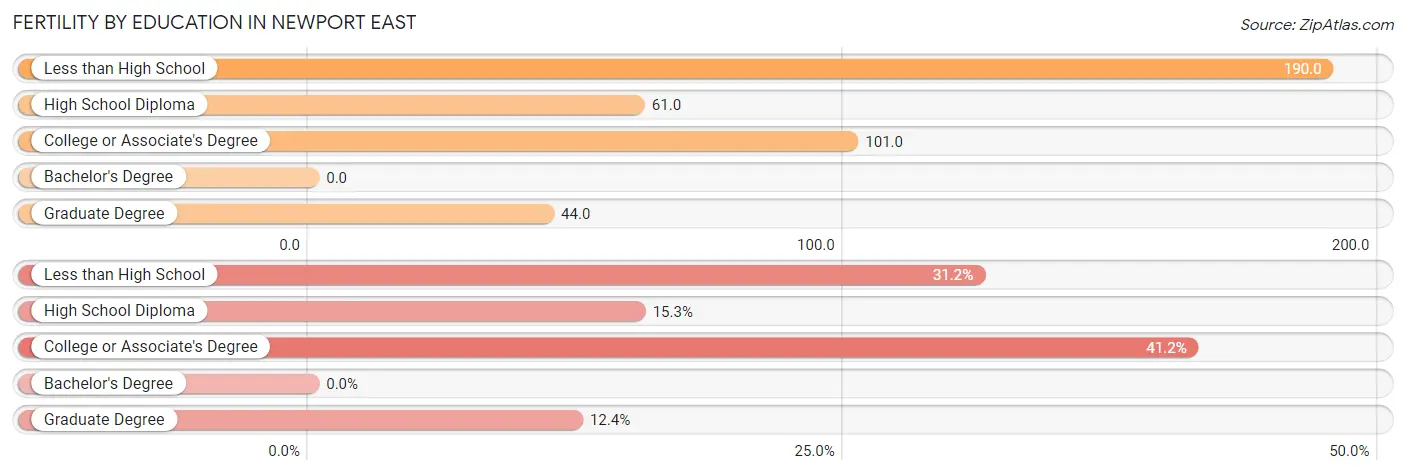
| Educational Attainment | Women with Births | Births / 1,000 Women |
| Less than High School | 53 (31.2%) | 190.0 |
| High School Diploma | 26 (15.3%) | 61.0 |
| College or Associate's Degree | 70 (41.2%) | 101.0 |
| Bachelor's Degree | 0 (0.0%) | 0.0 |
| Graduate Degree | 21 (12.3%) | 44.0 |
| Total | 170 (100.0%) | 70.0 |
Fertility by Education by Marriage Status in Newport East
51.2% of women with births in Newport East are unmarried. Women with the educational attainment of less than high school are most likely to be married with 100.0% of them married at childbirth, while women with the educational attainment of high school diploma are least likely to be married with 100.0% of them unmarried at childbirth.
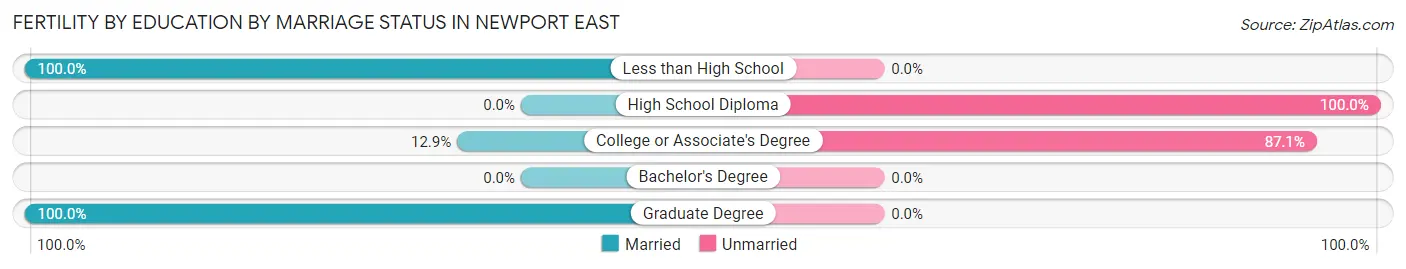
| Educational Attainment | Married | Unmarried |
| Less than High School | 53 (100.0%) | 0 (0.0%) |
| High School Diploma | 0 (0.0%) | 26 (100.0%) |
| College or Associate's Degree | 9 (12.9%) | 61 (87.1%) |
| Bachelor's Degree | 0 (0.0%) | 0 (0.0%) |
| Graduate Degree | 21 (100.0%) | 0 (0.0%) |
| Total | 83 (48.8%) | 87 (51.2%) |
Employment Characteristics in Newport East
Employment by Class of Employer in Newport East
Among the 6,058 employed individuals in Newport East, private company employees (3,656 | 60.4%), not-for-profit organizations (918 | 15.1%), and federal government employees (657 | 10.8%) make up the most common classes of employment.
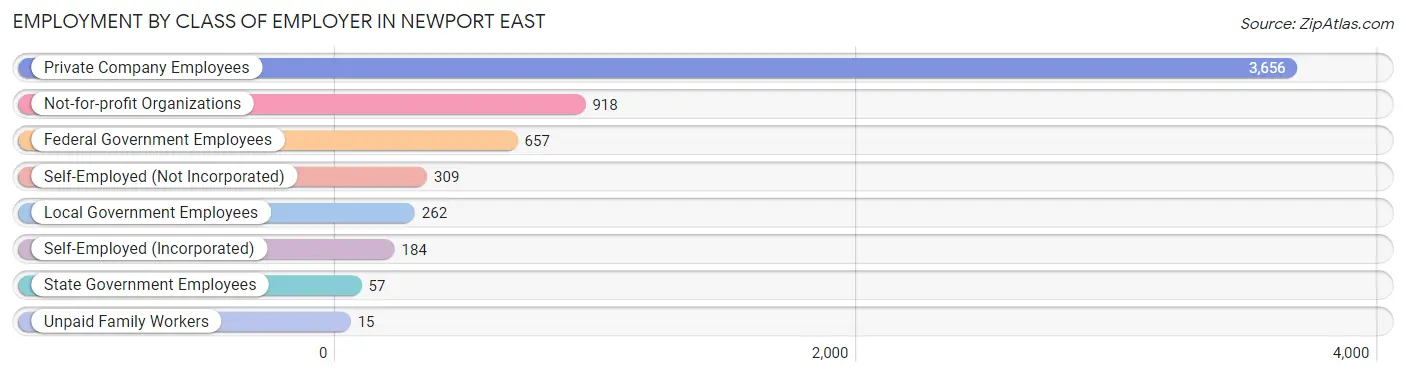
| Employer Class | # Employees | % Employees |
| Private Company Employees | 3,656 | 60.4% |
| Self-Employed (Incorporated) | 184 | 3.0% |
| Self-Employed (Not Incorporated) | 309 | 5.1% |
| Not-for-profit Organizations | 918 | 15.1% |
| Local Government Employees | 262 | 4.3% |
| State Government Employees | 57 | 0.9% |
| Federal Government Employees | 657 | 10.8% |
| Unpaid Family Workers | 15 | 0.3% |
| Total | 6,058 | 100.0% |
Employment Status by Age in Newport East
According to the labor force statistics for Newport East, out of the total population over 16 years of age (9,830), 66.6% or 6,547 individuals are in the labor force, with 5.8% or 380 of them unemployed. The age group with the highest labor force participation rate is 45 to 54 years, with 93.6% or 1,281 individuals in the labor force. Within the labor force, the 35 to 44 years age range has the highest percentage of unemployed individuals, with 9.4% or 89 of them being unemployed.
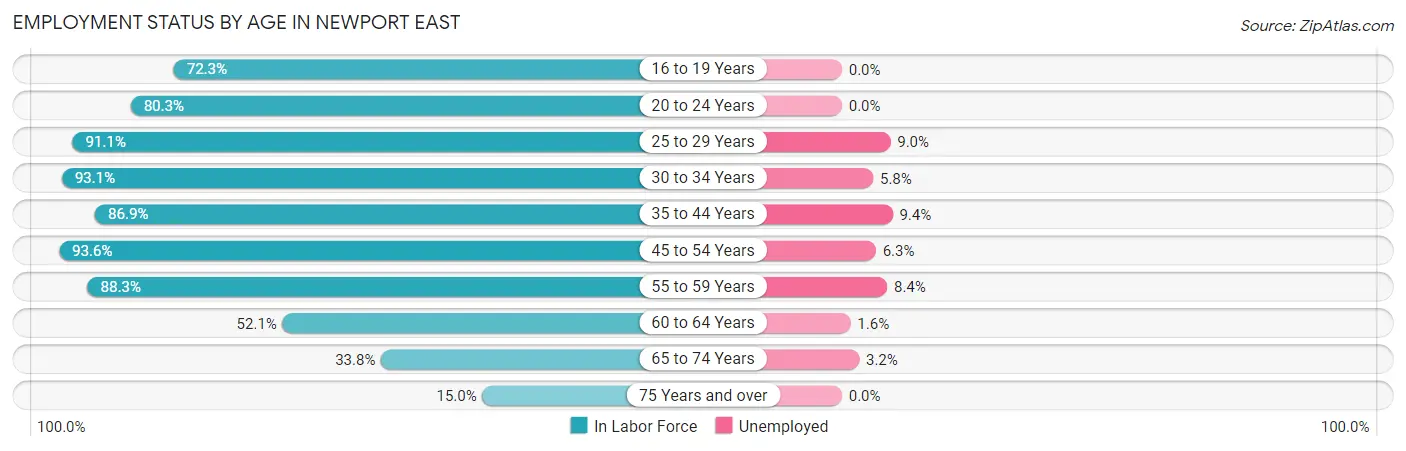
| Age Bracket | In Labor Force | Unemployed |
| 16 to 19 Years | 311 (72.3%) | 0 (0.0%) |
| 20 to 24 Years | 399 (80.3%) | 0 (0.0%) |
| 25 to 29 Years | 1,018 (91.1%) | 92 (9.0%) |
| 30 to 34 Years | 797 (93.1%) | 46 (5.8%) |
| 35 to 44 Years | 945 (86.9%) | 89 (9.4%) |
| 45 to 54 Years | 1,281 (93.6%) | 81 (6.3%) |
| 55 to 59 Years | 633 (88.3%) | 53 (8.4%) |
| 60 to 64 Years | 439 (52.1%) | 7 (1.6%) |
| 65 to 74 Years | 504 (33.8%) | 16 (3.2%) |
| 75 Years and over | 213 (15.0%) | 0 (0.0%) |
| Total | 6,547 (66.6%) | 380 (5.8%) |
Employment Status by Educational Attainment in Newport East
According to labor force statistics for Newport East, 85.4% of individuals (5,115) out of the total population between 25 and 64 years of age (5,990) are in the labor force, with 7.1% or 363 of them being unemployed. The group with the highest labor force participation rate are those with the educational attainment of high school diploma, with 88.2% or 1,295 individuals in the labor force. Within the labor force, individuals with less than high school education have the highest percentage of unemployment, with 40.7% or 104 of them being unemployed.
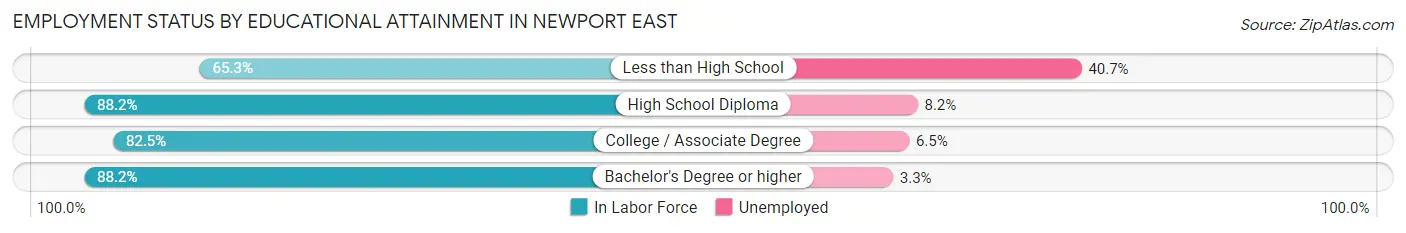
| Educational Attainment | In Labor Force | Unemployed |
| Less than High School | 256 (65.3%) | 160 (40.7%) |
| High School Diploma | 1,295 (88.2%) | 120 (8.2%) |
| College / Associate Degree | 1,139 (82.5%) | 90 (6.5%) |
| Bachelor's Degree or higher | 2,425 (88.2%) | 91 (3.3%) |
| Total | 5,115 (85.4%) | 425 (7.1%) |
Employment Occupations by Sex in Newport East
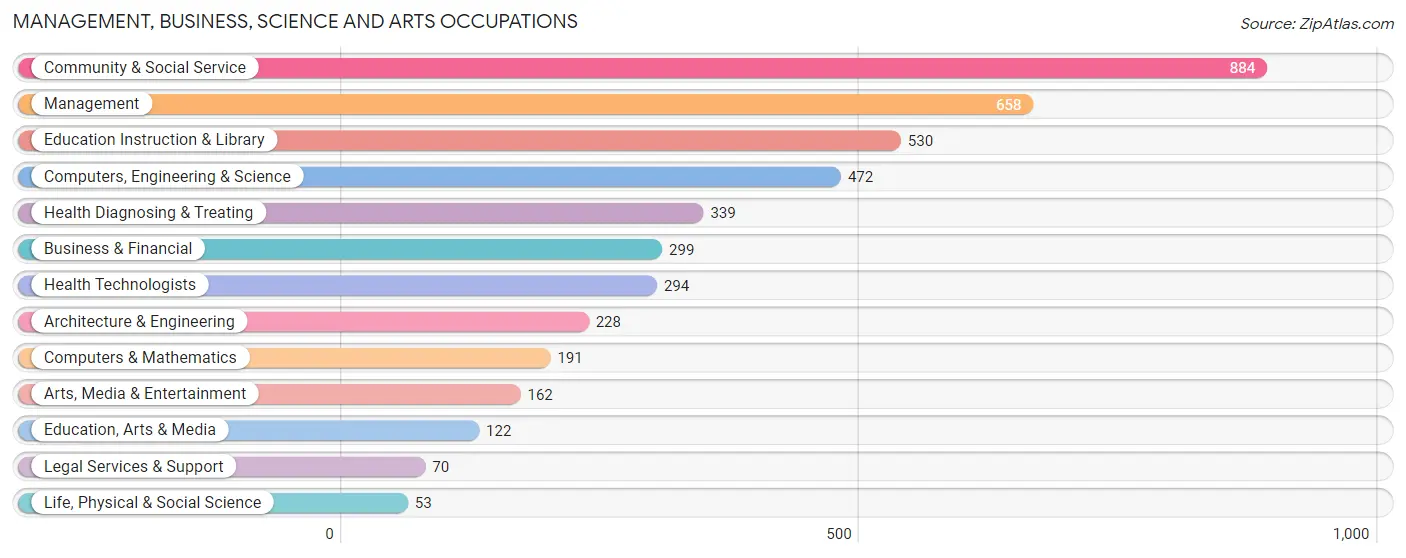
Management, Business, Science and Arts Occupations
The most common Management, Business, Science and Arts occupations in Newport East are Community & Social Service (884 | 14.8%), Management (658 | 11.0%), Education Instruction & Library (530 | 8.9%), Computers, Engineering & Science (472 | 7.9%), and Health Diagnosing & Treating (339 | 5.7%).
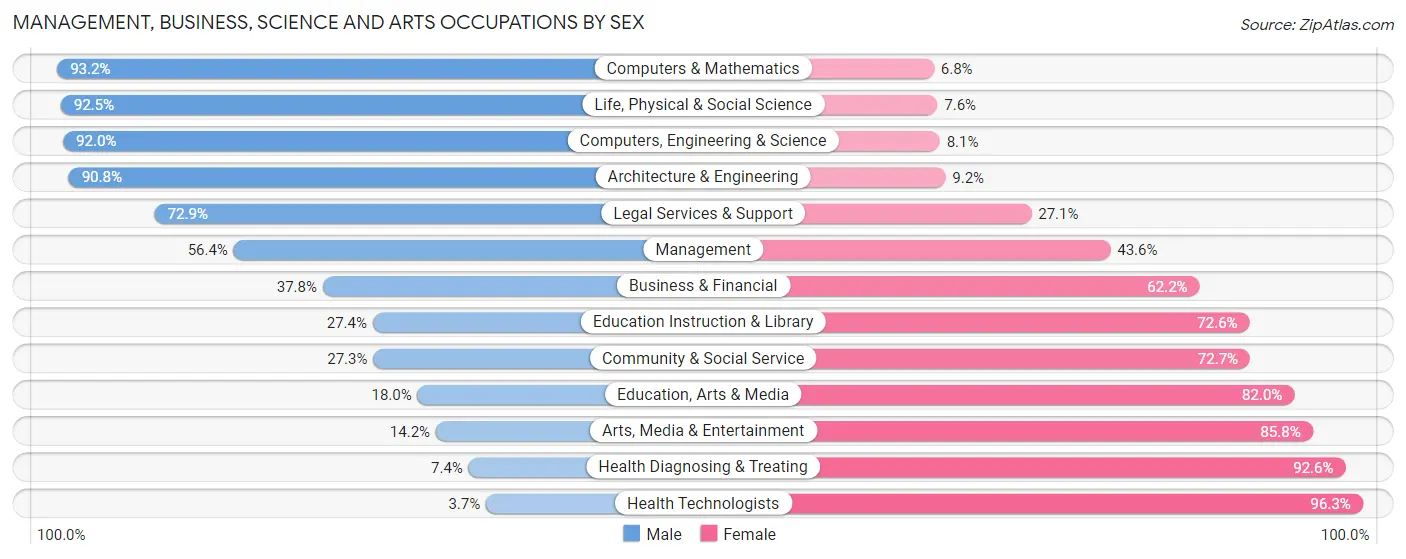
Management, Business, Science and Arts Occupations by Sex
Within the Management, Business, Science and Arts occupations in Newport East, the most male-oriented occupations are Computers & Mathematics (93.2%), Life, Physical & Social Science (92.4%), and Computers, Engineering & Science (91.9%), while the most female-oriented occupations are Health Technologists (96.3%), Health Diagnosing & Treating (92.6%), and Arts, Media & Entertainment (85.8%).
| Occupation | Male | Female |
| Management | 371 (56.4%) | 287 (43.6%) |
| Business & Financial | 113 (37.8%) | 186 (62.2%) |
| Computers, Engineering & Science | 434 (91.9%) | 38 (8.1%) |
| Computers & Mathematics | 178 (93.2%) | 13 (6.8%) |
| Architecture & Engineering | 207 (90.8%) | 21 (9.2%) |
| Life, Physical & Social Science | 49 (92.4%) | 4 (7.5%) |
| Community & Social Service | 241 (27.3%) | 643 (72.7%) |
| Education, Arts & Media | 22 (18.0%) | 100 (82.0%) |
| Legal Services & Support | 51 (72.9%) | 19 (27.1%) |
| Education Instruction & Library | 145 (27.4%) | 385 (72.6%) |
| Arts, Media & Entertainment | 23 (14.2%) | 139 (85.8%) |
| Health Diagnosing & Treating | 25 (7.4%) | 314 (92.6%) |
| Health Technologists | 11 (3.7%) | 283 (96.3%) |
| Total (Category) | 1,184 (44.7%) | 1,468 (55.3%) |
| Total (Overall) | 2,920 (49.0%) | 3,040 (51.0%) |
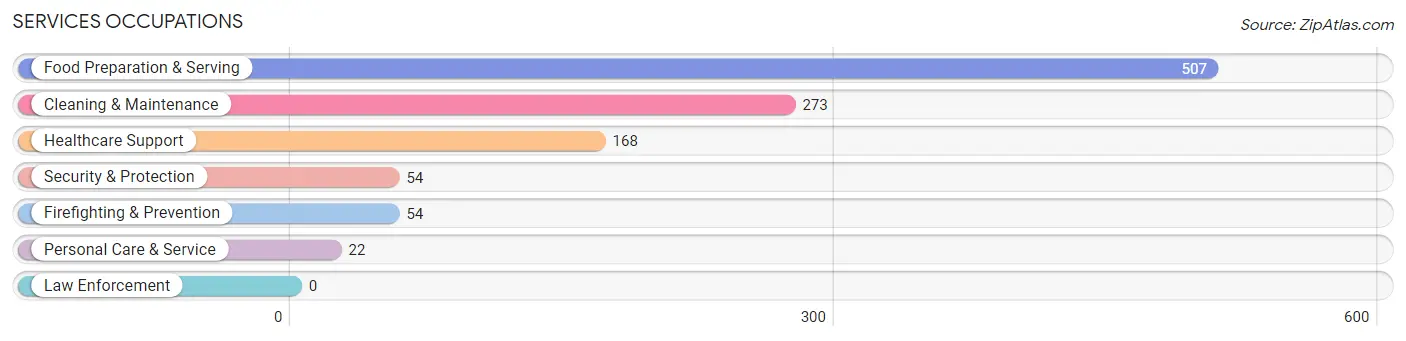
Services Occupations
The most common Services occupations in Newport East are Food Preparation & Serving (507 | 8.5%), Cleaning & Maintenance (273 | 4.6%), Healthcare Support (168 | 2.8%), Security & Protection (54 | 0.9%), and Firefighting & Prevention (54 | 0.9%).
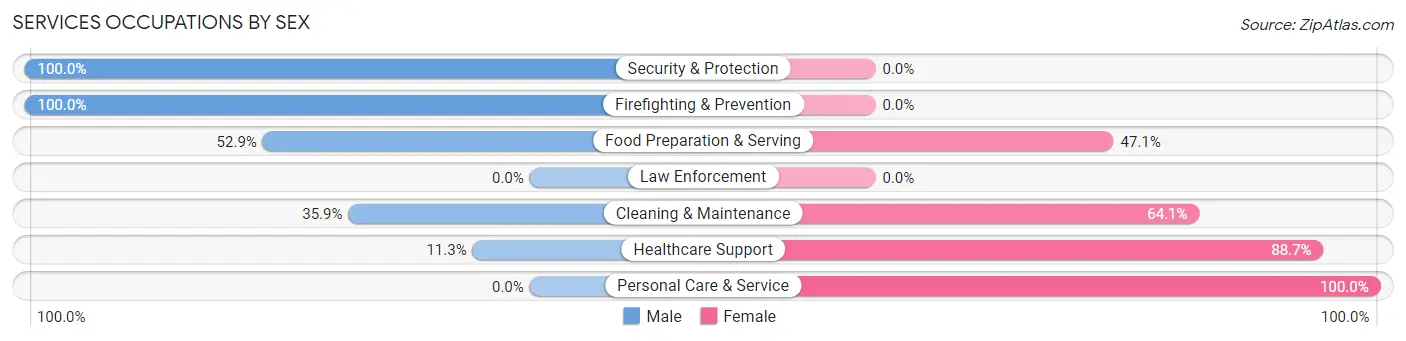
Services Occupations by Sex
Within the Services occupations in Newport East, the most male-oriented occupations are Security & Protection (100.0%), Firefighting & Prevention (100.0%), and Food Preparation & Serving (52.9%), while the most female-oriented occupations are Personal Care & Service (100.0%), Healthcare Support (88.7%), and Cleaning & Maintenance (64.1%).
| Occupation | Male | Female |
| Healthcare Support | 19 (11.3%) | 149 (88.7%) |
| Security & Protection | 54 (100.0%) | 0 (0.0%) |
| Firefighting & Prevention | 54 (100.0%) | 0 (0.0%) |
| Law Enforcement | 0 (0.0%) | 0 (0.0%) |
| Food Preparation & Serving | 268 (52.9%) | 239 (47.1%) |
| Cleaning & Maintenance | 98 (35.9%) | 175 (64.1%) |
| Personal Care & Service | 0 (0.0%) | 22 (100.0%) |
| Total (Category) | 439 (42.9%) | 585 (57.1%) |
| Total (Overall) | 2,920 (49.0%) | 3,040 (51.0%) |
Sales and Office Occupations
The most common Sales and Office occupations in Newport East are Office & Administration (600 | 10.1%), and Sales & Related (556 | 9.3%).
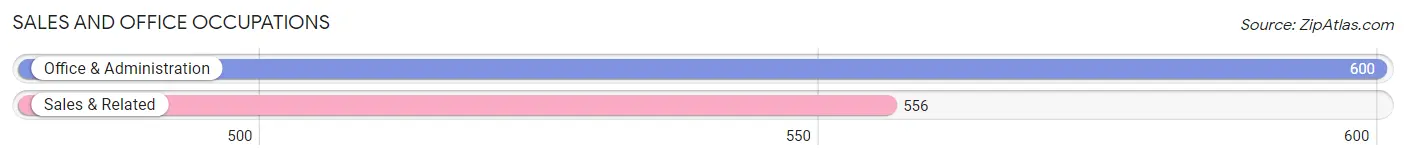
Sales and Office Occupations by Sex
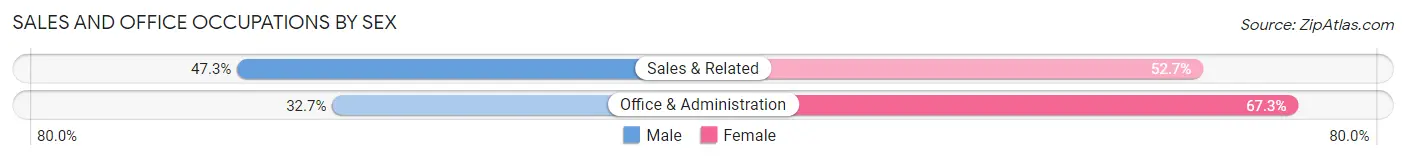
| Occupation | Male | Female |
| Sales & Related | 263 (47.3%) | 293 (52.7%) |
| Office & Administration | 196 (32.7%) | 404 (67.3%) |
| Total (Category) | 459 (39.7%) | 697 (60.3%) |
| Total (Overall) | 2,920 (49.0%) | 3,040 (51.0%) |
Natural Resources, Construction and Maintenance Occupations
The most common Natural Resources, Construction and Maintenance occupations in Newport East are Construction & Extraction (374 | 6.3%), and Installation, Maintenance & Repair (231 | 3.9%).
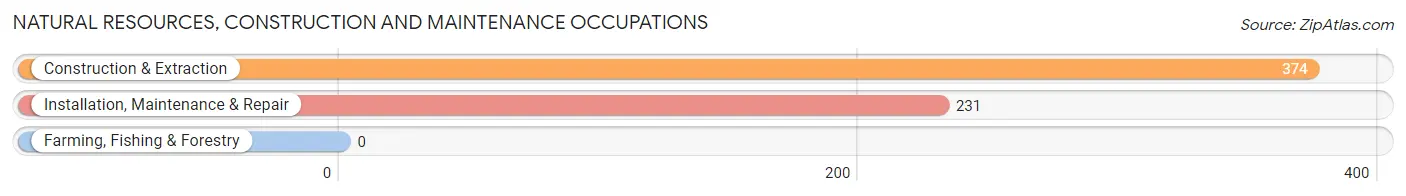
Natural Resources, Construction and Maintenance Occupations by Sex
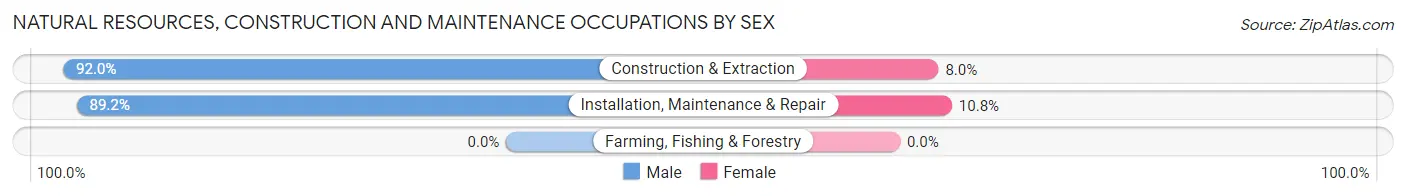
| Occupation | Male | Female |
| Farming, Fishing & Forestry | 0 (0.0%) | 0 (0.0%) |
| Construction & Extraction | 344 (92.0%) | 30 (8.0%) |
| Installation, Maintenance & Repair | 206 (89.2%) | 25 (10.8%) |
| Total (Category) | 550 (90.9%) | 55 (9.1%) |
| Total (Overall) | 2,920 (49.0%) | 3,040 (51.0%) |
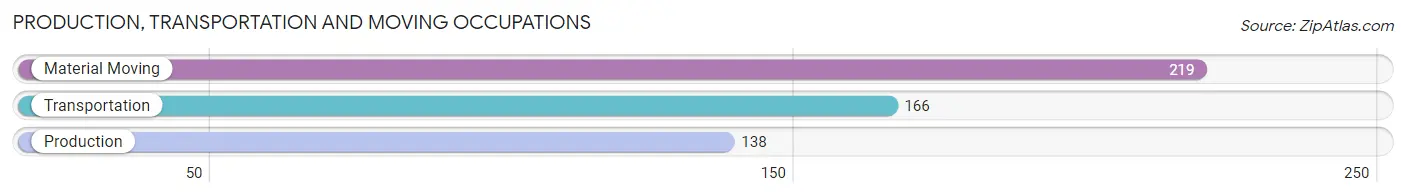
Production, Transportation and Moving Occupations
The most common Production, Transportation and Moving occupations in Newport East are Material Moving (219 | 3.7%), Transportation (166 | 2.8%), and Production (138 | 2.3%).
Production, Transportation and Moving Occupations by Sex
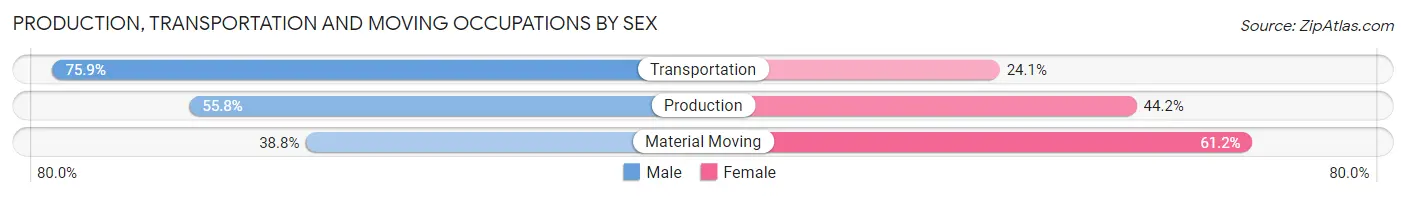
| Occupation | Male | Female |
| Production | 77 (55.8%) | 61 (44.2%) |
| Transportation | 126 (75.9%) | 40 (24.1%) |
| Material Moving | 85 (38.8%) | 134 (61.2%) |
| Total (Category) | 288 (55.1%) | 235 (44.9%) |
| Total (Overall) | 2,920 (49.0%) | 3,040 (51.0%) |
Employment Industries by Sex in Newport East
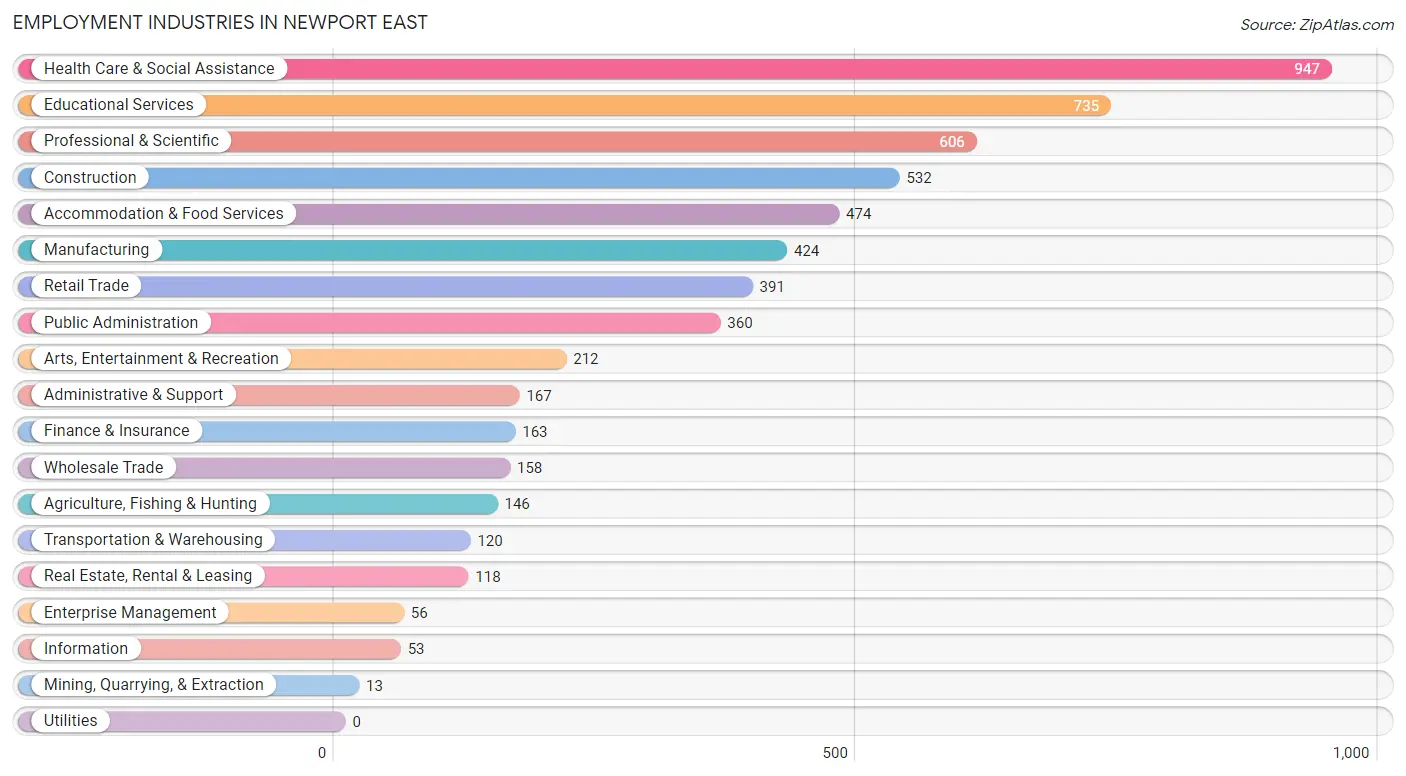
Employment Industries in Newport East
The major employment industries in Newport East include Health Care & Social Assistance (947 | 15.9%), Educational Services (735 | 12.3%), Professional & Scientific (606 | 10.2%), Construction (532 | 8.9%), and Accommodation & Food Services (474 | 8.0%).
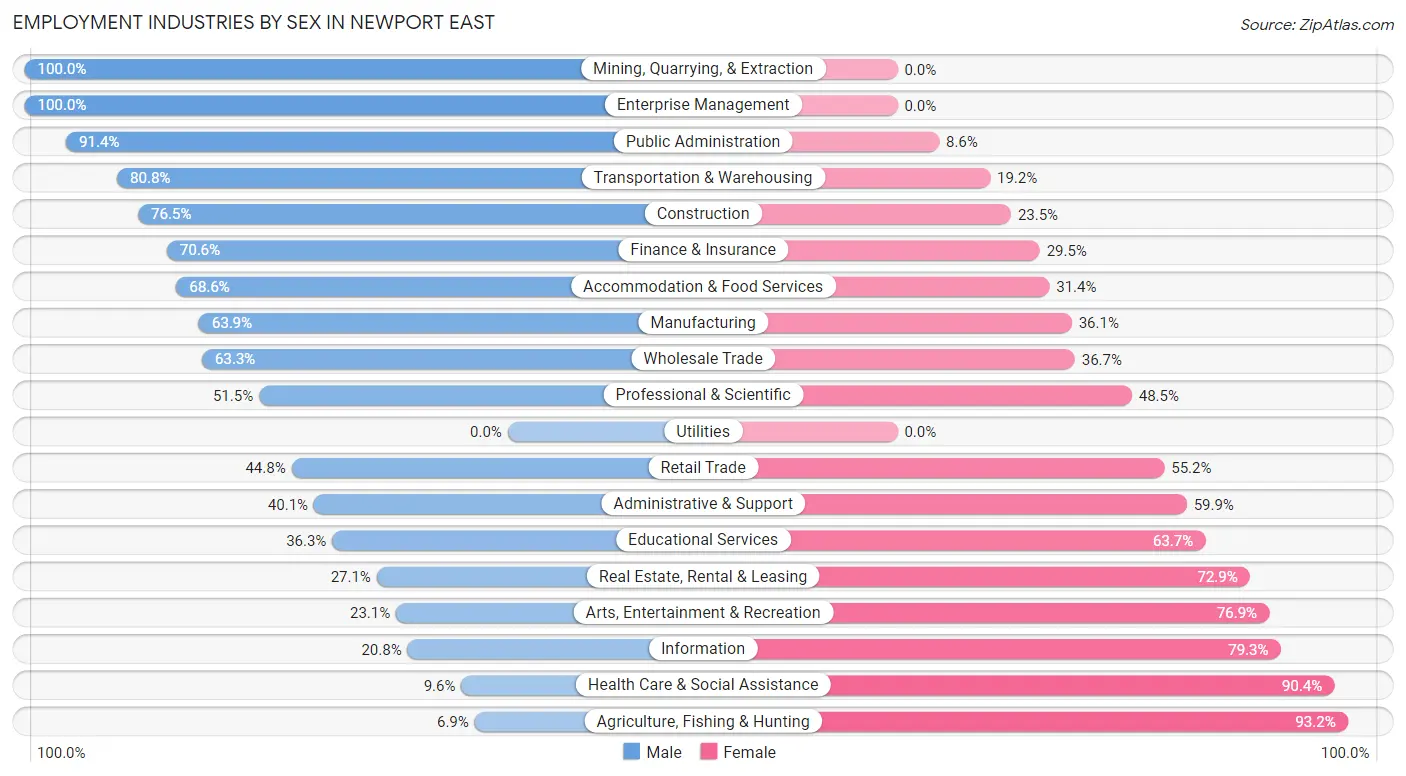
Employment Industries by Sex in Newport East
The Newport East industries that see more men than women are Mining, Quarrying, & Extraction (100.0%), Enterprise Management (100.0%), and Public Administration (91.4%), whereas the industries that tend to have a higher number of women are Agriculture, Fishing & Hunting (93.1%), Health Care & Social Assistance (90.4%), and Information (79.2%).
| Industry | Male | Female |
| Agriculture, Fishing & Hunting | 10 (6.9%) | 136 (93.1%) |
| Mining, Quarrying, & Extraction | 13 (100.0%) | 0 (0.0%) |
| Construction | 407 (76.5%) | 125 (23.5%) |
| Manufacturing | 271 (63.9%) | 153 (36.1%) |
| Wholesale Trade | 100 (63.3%) | 58 (36.7%) |
| Retail Trade | 175 (44.8%) | 216 (55.2%) |
| Transportation & Warehousing | 97 (80.8%) | 23 (19.2%) |
| Utilities | 0 (0.0%) | 0 (0.0%) |
| Information | 11 (20.7%) | 42 (79.2%) |
| Finance & Insurance | 115 (70.6%) | 48 (29.4%) |
| Real Estate, Rental & Leasing | 32 (27.1%) | 86 (72.9%) |
| Professional & Scientific | 312 (51.5%) | 294 (48.5%) |
| Enterprise Management | 56 (100.0%) | 0 (0.0%) |
| Administrative & Support | 67 (40.1%) | 100 (59.9%) |
| Educational Services | 267 (36.3%) | 468 (63.7%) |
| Health Care & Social Assistance | 91 (9.6%) | 856 (90.4%) |
| Arts, Entertainment & Recreation | 49 (23.1%) | 163 (76.9%) |
| Accommodation & Food Services | 325 (68.6%) | 149 (31.4%) |
| Public Administration | 329 (91.4%) | 31 (8.6%) |
| Total | 2,920 (49.0%) | 3,040 (51.0%) |
Education in Newport East
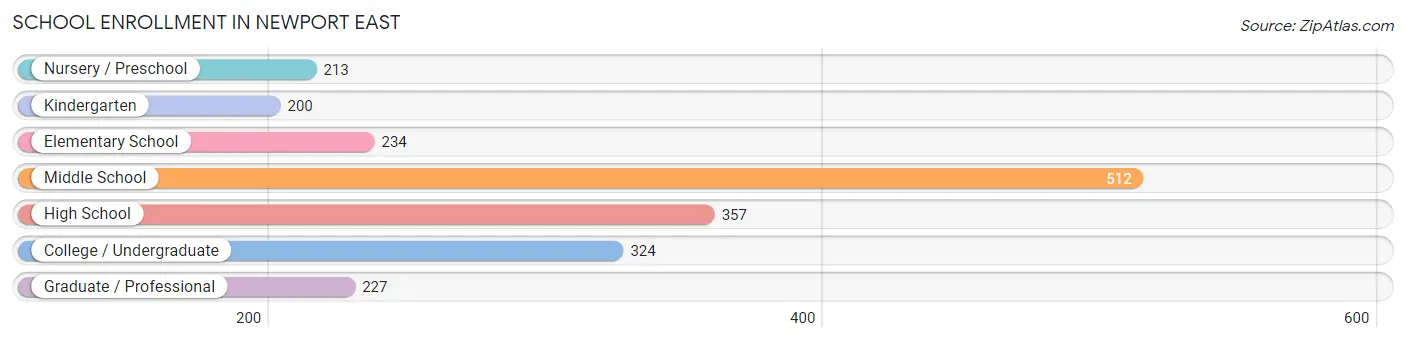
School Enrollment in Newport East
The most common levels of schooling among the 2,067 students in Newport East are middle school (512 | 24.8%), high school (357 | 17.3%), and college / undergraduate (324 | 15.7%).
| School Level | # Students | % Students |
| Nursery / Preschool | 213 | 10.3% |
| Kindergarten | 200 | 9.7% |
| Elementary School | 234 | 11.3% |
| Middle School | 512 | 24.8% |
| High School | 357 | 17.3% |
| College / Undergraduate | 324 | 15.7% |
| Graduate / Professional | 227 | 11.0% |
| Total | 2,067 | 100.0% |
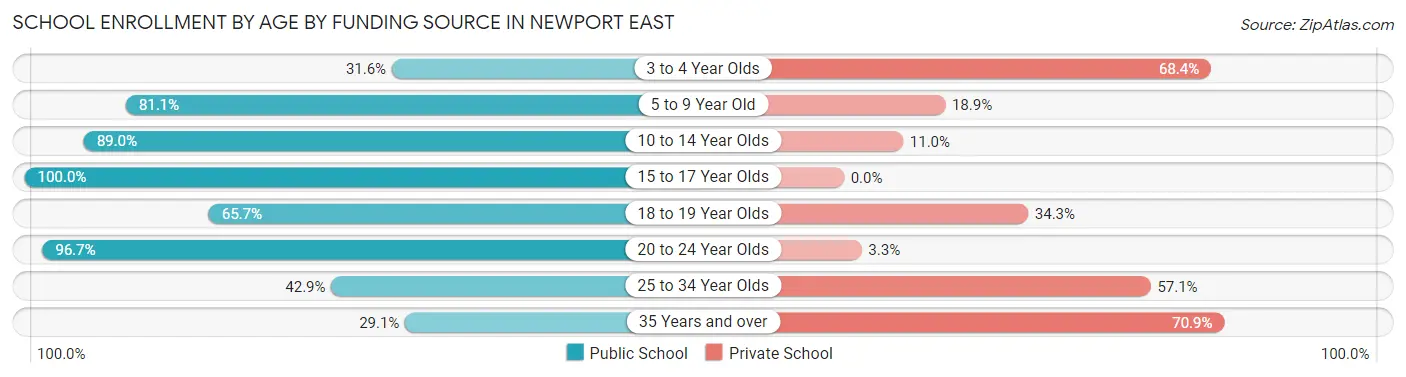
School Enrollment by Age by Funding Source in Newport East
Out of a total of 2,067 students who are enrolled in schools in Newport East, 486 (23.5%) attend a private institution, while the remaining 1,581 (76.5%) are enrolled in public schools. The age group of 35 years and over has the highest likelihood of being enrolled in private schools, with 56 (70.9% in the age bracket) enrolled. Conversely, the age group of 15 to 17 year olds has the lowest likelihood of being enrolled in a private school, with 249 (100.0% in the age bracket) attending a public institution.
| Age Bracket | Public School | Private School |
| 3 to 4 Year Olds | 48 (31.6%) | 104 (68.4%) |
| 5 to 9 Year Old | 374 (81.1%) | 87 (18.9%) |
| 10 to 14 Year Olds | 517 (89.0%) | 64 (11.0%) |
| 15 to 17 Year Olds | 249 (100.0%) | 0 (0.0%) |
| 18 to 19 Year Olds | 67 (65.7%) | 35 (34.3%) |
| 20 to 24 Year Olds | 205 (96.7%) | 7 (3.3%) |
| 25 to 34 Year Olds | 99 (42.9%) | 132 (57.1%) |
| 35 Years and over | 23 (29.1%) | 56 (70.9%) |
| Total | 1,581 (76.5%) | 486 (23.5%) |
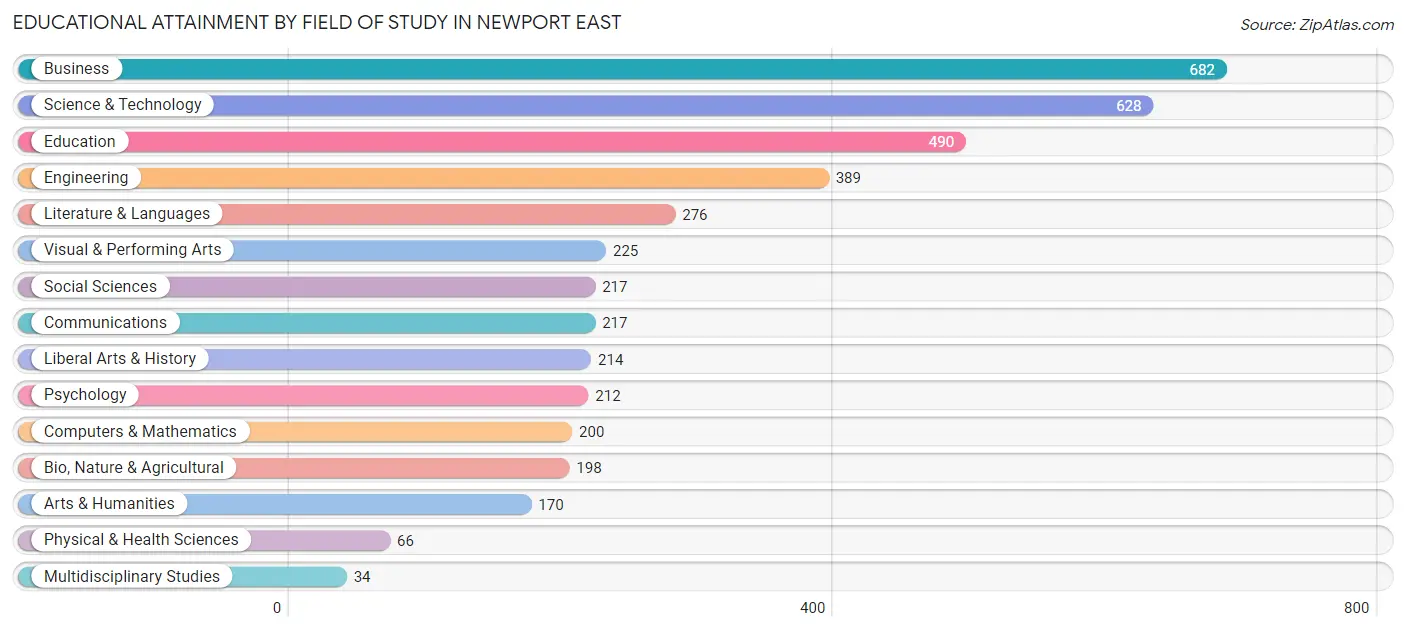
Educational Attainment by Field of Study in Newport East
Business (682 | 16.2%), science & technology (628 | 14.9%), education (490 | 11.6%), engineering (389 | 9.2%), and literature & languages (276 | 6.5%) are the most common fields of study among 4,218 individuals in Newport East who have obtained a bachelor's degree or higher.
| Field of Study | # Graduates | % Graduates |
| Computers & Mathematics | 200 | 4.7% |
| Bio, Nature & Agricultural | 198 | 4.7% |
| Physical & Health Sciences | 66 | 1.6% |
| Psychology | 212 | 5.0% |
| Social Sciences | 217 | 5.1% |
| Engineering | 389 | 9.2% |
| Multidisciplinary Studies | 34 | 0.8% |
| Science & Technology | 628 | 14.9% |
| Business | 682 | 16.2% |
| Education | 490 | 11.6% |
| Literature & Languages | 276 | 6.5% |
| Liberal Arts & History | 214 | 5.1% |
| Visual & Performing Arts | 225 | 5.3% |
| Communications | 217 | 5.1% |
| Arts & Humanities | 170 | 4.0% |
| Total | 4,218 | 100.0% |
Transportation & Commute in Newport East
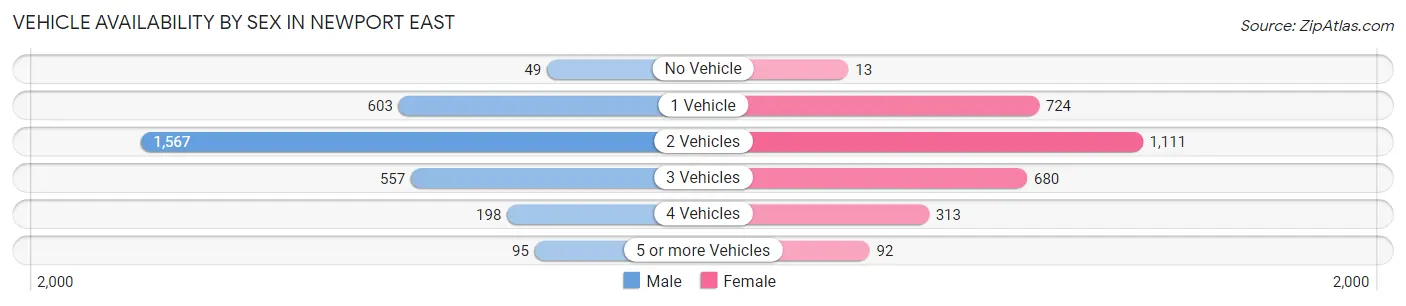
Vehicle Availability by Sex in Newport East
The most prevalent vehicle ownership categories in Newport East are males with 2 vehicles (1,567, accounting for 51.1%) and females with 2 vehicles (1,111, making up 53.4%).
| Vehicles Available | Male | Female |
| No Vehicle | 49 (1.6%) | 13 (0.4%) |
| 1 Vehicle | 603 (19.7%) | 724 (24.7%) |
| 2 Vehicles | 1,567 (51.1%) | 1,111 (37.9%) |
| 3 Vehicles | 557 (18.1%) | 680 (23.2%) |
| 4 Vehicles | 198 (6.5%) | 313 (10.7%) |
| 5 or more Vehicles | 95 (3.1%) | 92 (3.1%) |
| Total | 3,069 (100.0%) | 2,933 (100.0%) |
Commute Time in Newport East
The most frequently occuring commute durations in Newport East are 10 to 14 minutes (1,471 commuters, 26.3%), 15 to 19 minutes (995 commuters, 17.8%), and 5 to 9 minutes (896 commuters, 16.0%).
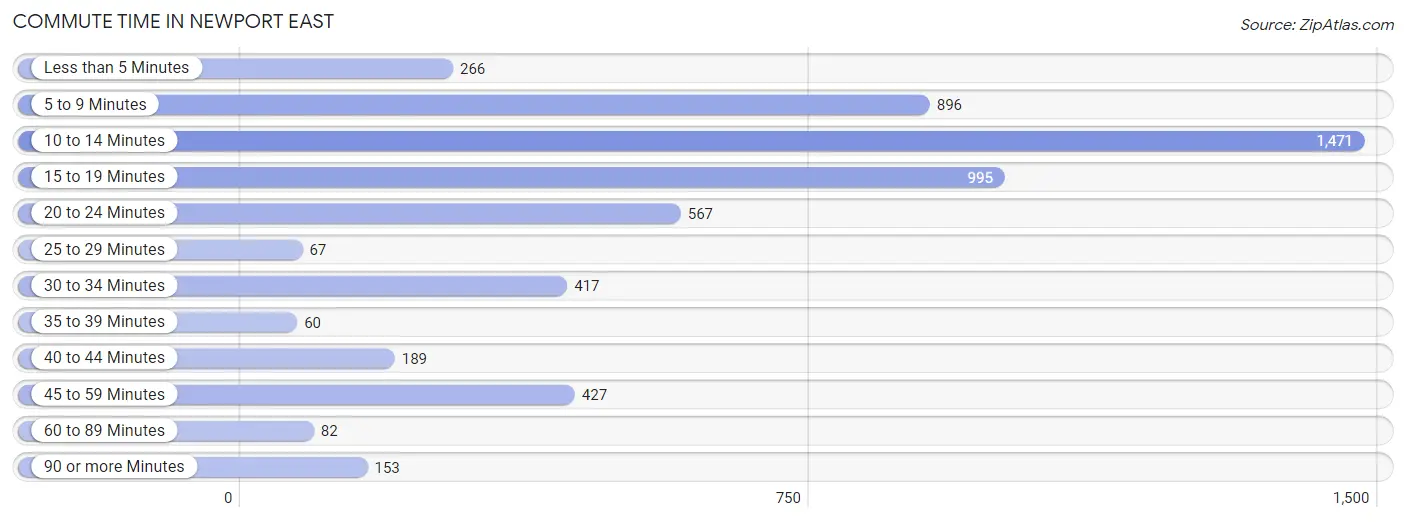
| Commute Time | # Commuters | % Commuters |
| Less than 5 Minutes | 266 | 4.8% |
| 5 to 9 Minutes | 896 | 16.0% |
| 10 to 14 Minutes | 1,471 | 26.3% |
| 15 to 19 Minutes | 995 | 17.8% |
| 20 to 24 Minutes | 567 | 10.1% |
| 25 to 29 Minutes | 67 | 1.2% |
| 30 to 34 Minutes | 417 | 7.5% |
| 35 to 39 Minutes | 60 | 1.1% |
| 40 to 44 Minutes | 189 | 3.4% |
| 45 to 59 Minutes | 427 | 7.6% |
| 60 to 89 Minutes | 82 | 1.5% |
| 90 or more Minutes | 153 | 2.7% |
Commute Time by Sex in Newport East
The most common commute times in Newport East are 10 to 14 minutes (757 commuters, 26.5%) for males and 10 to 14 minutes (714 commuters, 26.1%) for females.
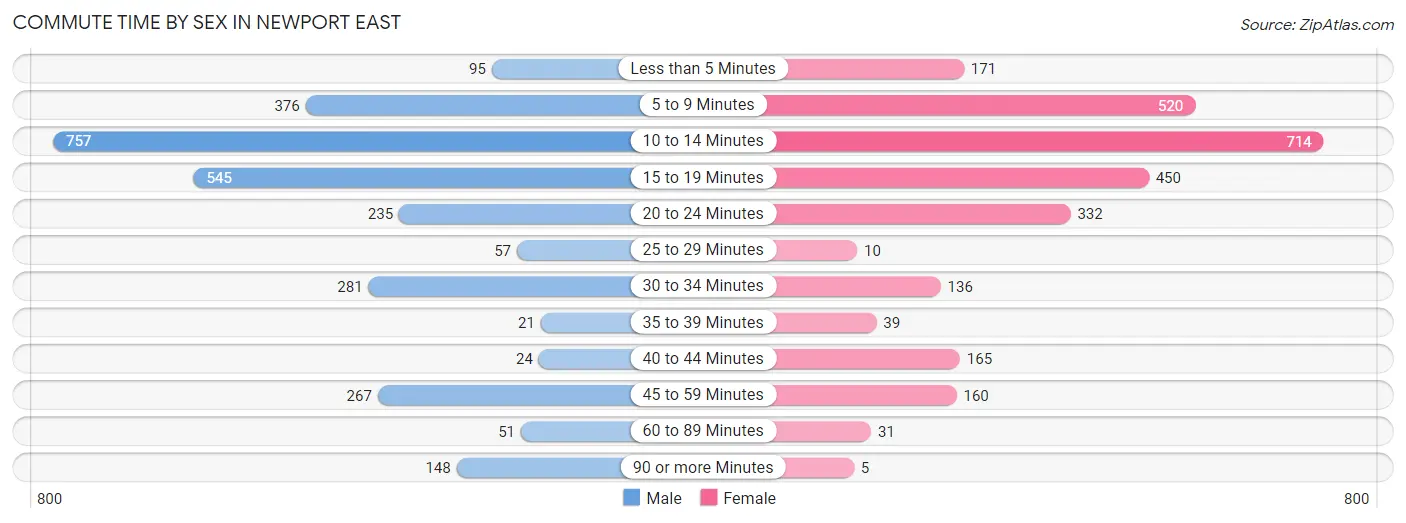
| Commute Time | Male | Female |
| Less than 5 Minutes | 95 (3.3%) | 171 (6.3%) |
| 5 to 9 Minutes | 376 (13.2%) | 520 (19.0%) |
| 10 to 14 Minutes | 757 (26.5%) | 714 (26.1%) |
| 15 to 19 Minutes | 545 (19.1%) | 450 (16.5%) |
| 20 to 24 Minutes | 235 (8.2%) | 332 (12.1%) |
| 25 to 29 Minutes | 57 (2.0%) | 10 (0.4%) |
| 30 to 34 Minutes | 281 (9.8%) | 136 (5.0%) |
| 35 to 39 Minutes | 21 (0.7%) | 39 (1.4%) |
| 40 to 44 Minutes | 24 (0.8%) | 165 (6.0%) |
| 45 to 59 Minutes | 267 (9.3%) | 160 (5.9%) |
| 60 to 89 Minutes | 51 (1.8%) | 31 (1.1%) |
| 90 or more Minutes | 148 (5.2%) | 5 (0.2%) |
Time of Departure to Work by Sex in Newport East
The most frequent times of departure to work in Newport East are 6:30 AM to 6:59 AM (487, 17.1%) for males and 8:30 AM to 8:59 AM (539, 19.7%) for females.
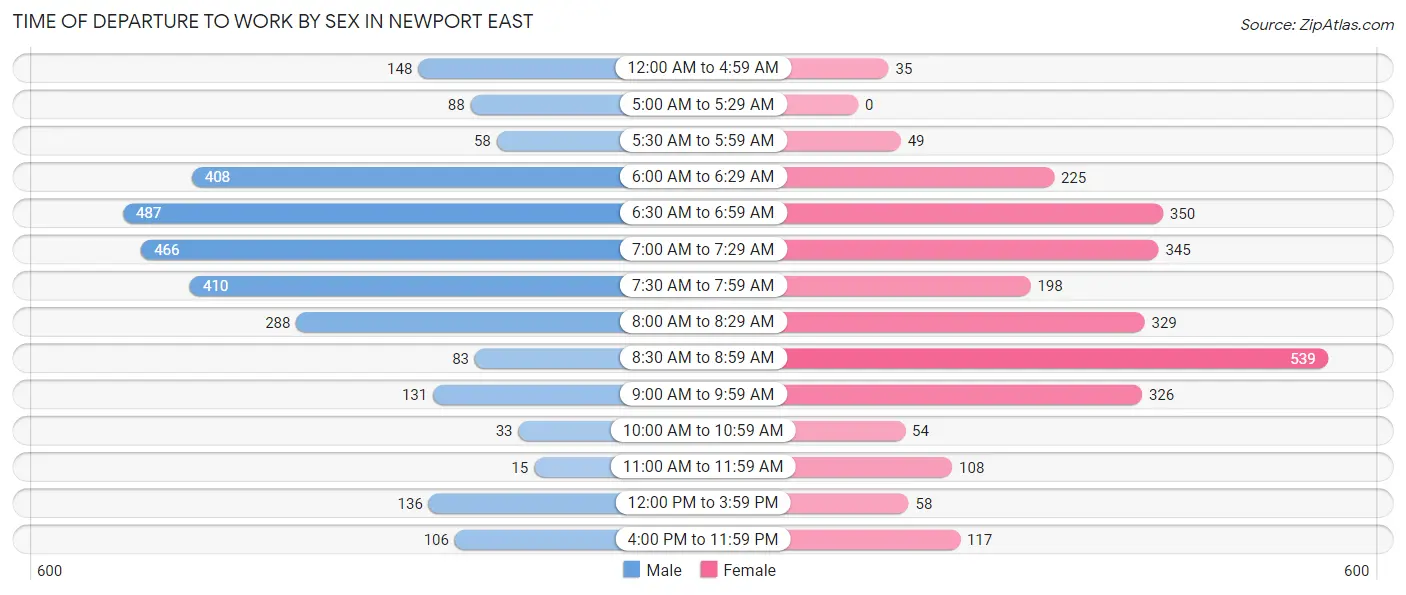
| Time of Departure | Male | Female |
| 12:00 AM to 4:59 AM | 148 (5.2%) | 35 (1.3%) |
| 5:00 AM to 5:29 AM | 88 (3.1%) | 0 (0.0%) |
| 5:30 AM to 5:59 AM | 58 (2.0%) | 49 (1.8%) |
| 6:00 AM to 6:29 AM | 408 (14.3%) | 225 (8.2%) |
| 6:30 AM to 6:59 AM | 487 (17.1%) | 350 (12.8%) |
| 7:00 AM to 7:29 AM | 466 (16.3%) | 345 (12.6%) |
| 7:30 AM to 7:59 AM | 410 (14.3%) | 198 (7.2%) |
| 8:00 AM to 8:29 AM | 288 (10.1%) | 329 (12.0%) |
| 8:30 AM to 8:59 AM | 83 (2.9%) | 539 (19.7%) |
| 9:00 AM to 9:59 AM | 131 (4.6%) | 326 (11.9%) |
| 10:00 AM to 10:59 AM | 33 (1.2%) | 54 (2.0%) |
| 11:00 AM to 11:59 AM | 15 (0.5%) | 108 (4.0%) |
| 12:00 PM to 3:59 PM | 136 (4.8%) | 58 (2.1%) |
| 4:00 PM to 11:59 PM | 106 (3.7%) | 117 (4.3%) |
| Total | 2,857 (100.0%) | 2,733 (100.0%) |
Housing Occupancy in Newport East
Occupancy by Ownership in Newport East
Of the total 5,131 dwellings in Newport East, owner-occupied units account for 2,901 (56.5%), while renter-occupied units make up 2,230 (43.5%).
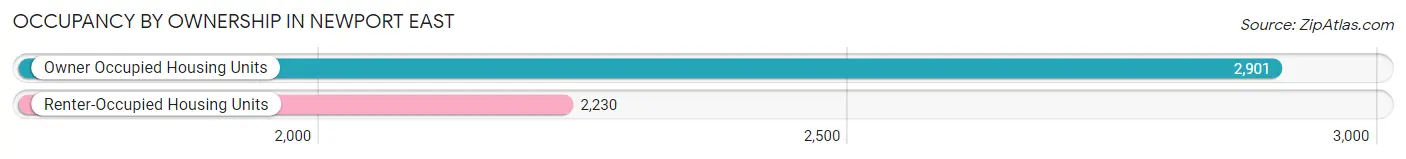
| Occupancy | # Housing Units | % Housing Units |
| Owner Occupied Housing Units | 2,901 | 56.5% |
| Renter-Occupied Housing Units | 2,230 | 43.5% |
| Total Occupied Housing Units | 5,131 | 100.0% |
Occupancy by Household Size in Newport East
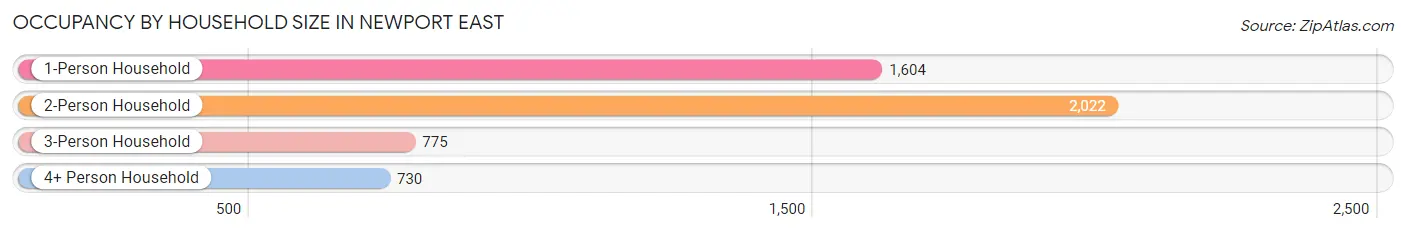
| Household Size | # Housing Units | % Housing Units |
| 1-Person Household | 1,604 | 31.3% |
| 2-Person Household | 2,022 | 39.4% |
| 3-Person Household | 775 | 15.1% |
| 4+ Person Household | 730 | 14.2% |
| Total Housing Units | 5,131 | 100.0% |
Occupancy by Ownership by Household Size in Newport East
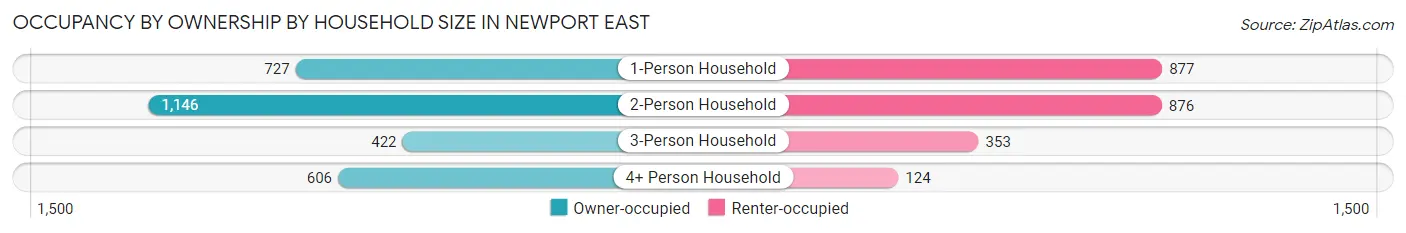
| Household Size | Owner-occupied | Renter-occupied |
| 1-Person Household | 727 (45.3%) | 877 (54.7%) |
| 2-Person Household | 1,146 (56.7%) | 876 (43.3%) |
| 3-Person Household | 422 (54.4%) | 353 (45.6%) |
| 4+ Person Household | 606 (83.0%) | 124 (17.0%) |
| Total Housing Units | 2,901 (56.5%) | 2,230 (43.5%) |
Occupancy by Educational Attainment in Newport East
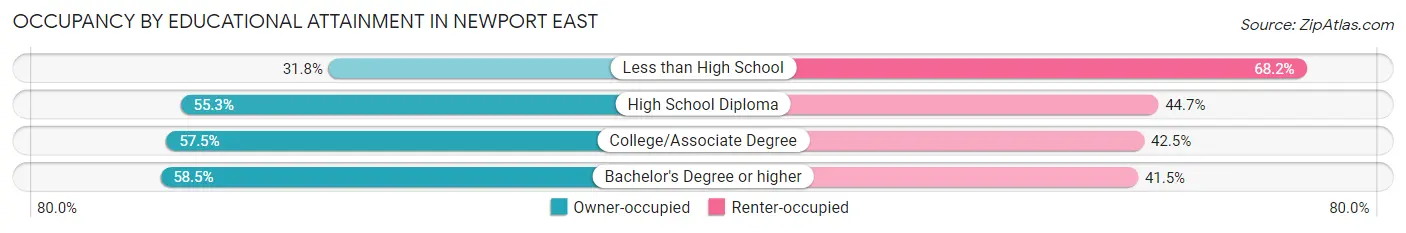
| Household Size | Owner-occupied | Renter-occupied |
| Less than High School | 54 (31.8%) | 116 (68.2%) |
| High School Diploma | 741 (55.3%) | 600 (44.7%) |
| College/Associate Degree | 651 (57.5%) | 481 (42.5%) |
| Bachelor's Degree or higher | 1,455 (58.5%) | 1,033 (41.5%) |
Occupancy by Age of Householder in Newport East
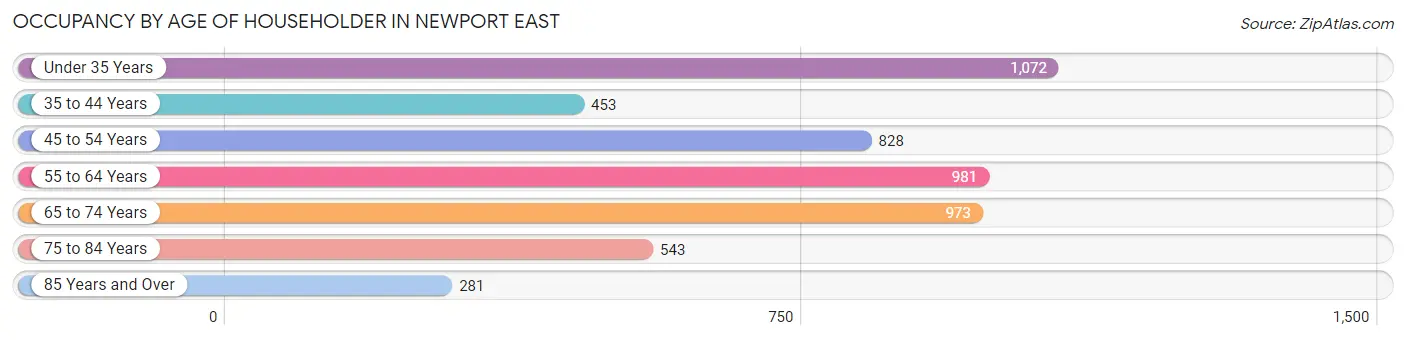
| Age Bracket | # Households | % Households |
| Under 35 Years | 1,072 | 20.9% |
| 35 to 44 Years | 453 | 8.8% |
| 45 to 54 Years | 828 | 16.1% |
| 55 to 64 Years | 981 | 19.1% |
| 65 to 74 Years | 973 | 19.0% |
| 75 to 84 Years | 543 | 10.6% |
| 85 Years and Over | 281 | 5.5% |
| Total | 5,131 | 100.0% |
Housing Finances in Newport East
Median Income by Occupancy in Newport East
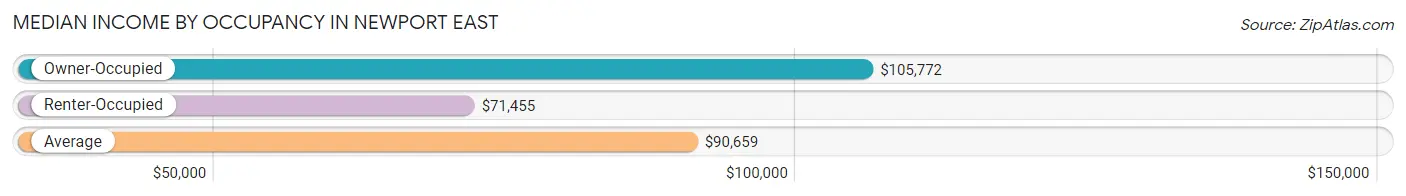
| Occupancy Type | # Households | Median Income |
| Owner-Occupied | 2,901 (56.5%) | $105,772 |
| Renter-Occupied | 2,230 (43.5%) | $71,455 |
| Average | 5,131 (100.0%) | $90,659 |
Occupancy by Householder Income Bracket in Newport East
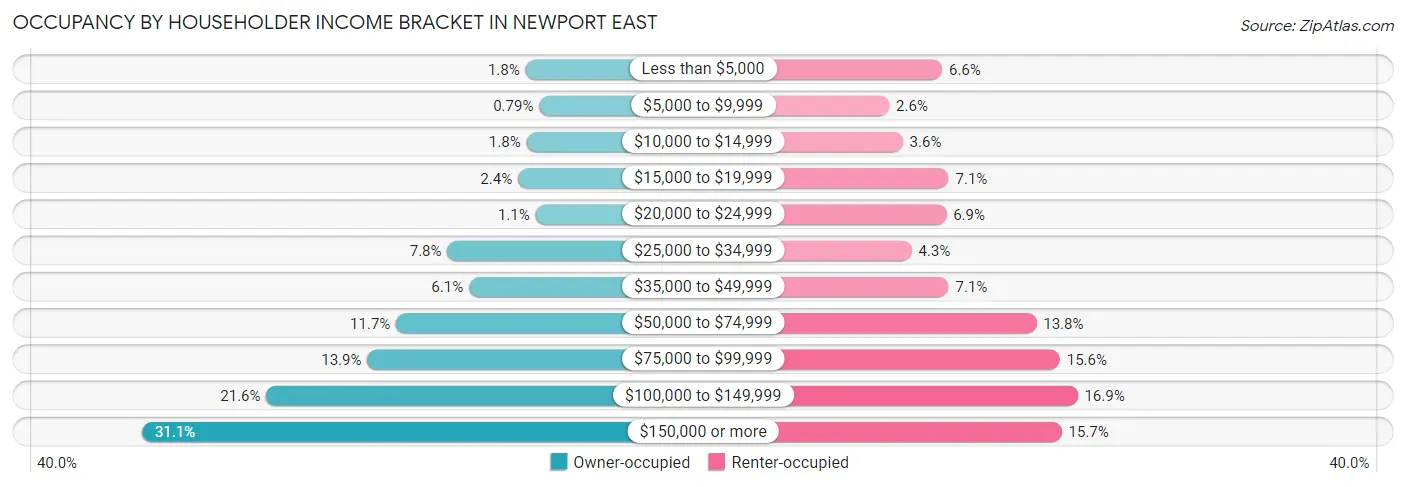
| Income Bracket | Owner-occupied | Renter-occupied |
| Less than $5,000 | 53 (1.8%) | 147 (6.6%) |
| $5,000 to $9,999 | 23 (0.8%) | 57 (2.6%) |
| $10,000 to $14,999 | 51 (1.8%) | 80 (3.6%) |
| $15,000 to $19,999 | 70 (2.4%) | 158 (7.1%) |
| $20,000 to $24,999 | 31 (1.1%) | 154 (6.9%) |
| $25,000 to $34,999 | 226 (7.8%) | 95 (4.3%) |
| $35,000 to $49,999 | 178 (6.1%) | 158 (7.1%) |
| $50,000 to $74,999 | 339 (11.7%) | 307 (13.8%) |
| $75,000 to $99,999 | 403 (13.9%) | 347 (15.6%) |
| $100,000 to $149,999 | 626 (21.6%) | 377 (16.9%) |
| $150,000 or more | 901 (31.1%) | 350 (15.7%) |
| Total | 2,901 (100.0%) | 2,230 (100.0%) |
Monthly Housing Cost Tiers in Newport East
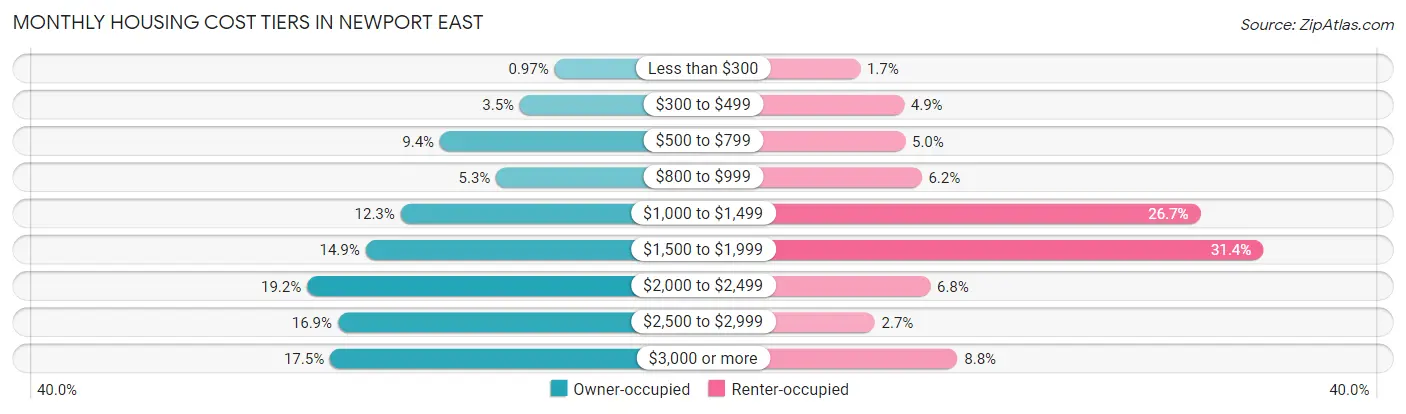
| Monthly Cost | Owner-occupied | Renter-occupied |
| Less than $300 | 28 (1.0%) | 37 (1.7%) |
| $300 to $499 | 102 (3.5%) | 109 (4.9%) |
| $500 to $799 | 273 (9.4%) | 111 (5.0%) |
| $800 to $999 | 153 (5.3%) | 138 (6.2%) |
| $1,000 to $1,499 | 357 (12.3%) | 596 (26.7%) |
| $1,500 to $1,999 | 432 (14.9%) | 699 (31.4%) |
| $2,000 to $2,499 | 557 (19.2%) | 152 (6.8%) |
| $2,500 to $2,999 | 491 (16.9%) | 61 (2.7%) |
| $3,000 or more | 508 (17.5%) | 197 (8.8%) |
| Total | 2,901 (100.0%) | 2,230 (100.0%) |
Physical Housing Characteristics in Newport East
Housing Structures in Newport East
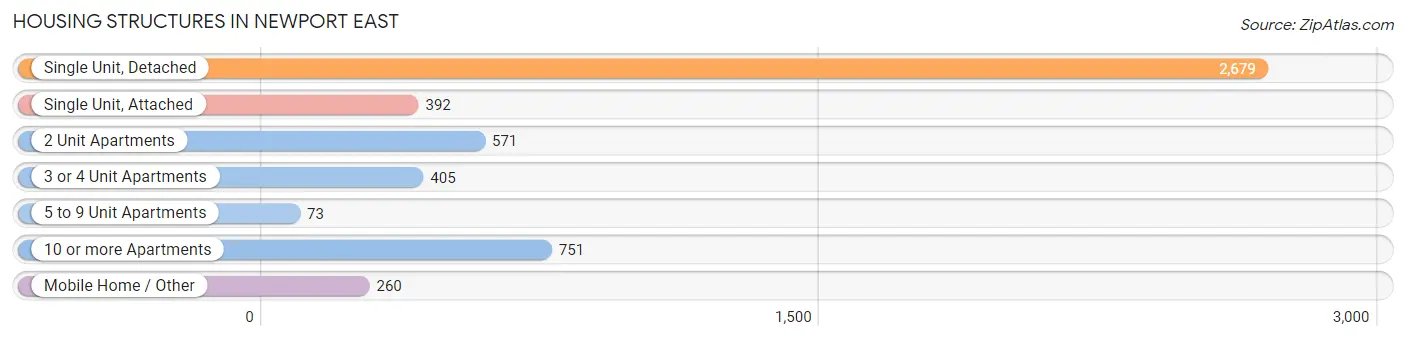
| Structure Type | # Housing Units | % Housing Units |
| Single Unit, Detached | 2,679 | 52.2% |
| Single Unit, Attached | 392 | 7.6% |
| 2 Unit Apartments | 571 | 11.1% |
| 3 or 4 Unit Apartments | 405 | 7.9% |
| 5 to 9 Unit Apartments | 73 | 1.4% |
| 10 or more Apartments | 751 | 14.6% |
| Mobile Home / Other | 260 | 5.1% |
| Total | 5,131 | 100.0% |
Housing Structures by Occupancy in Newport East
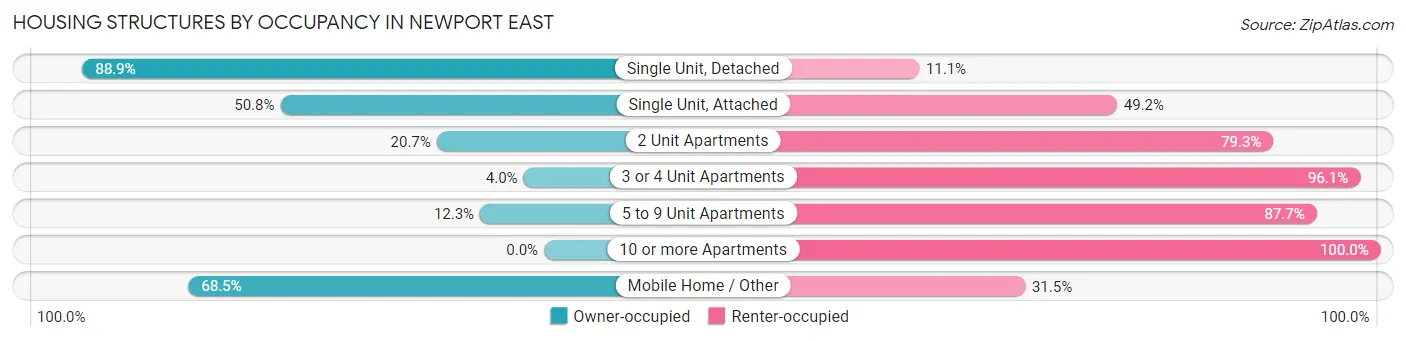
| Structure Type | Owner-occupied | Renter-occupied |
| Single Unit, Detached | 2,381 (88.9%) | 298 (11.1%) |
| Single Unit, Attached | 199 (50.8%) | 193 (49.2%) |
| 2 Unit Apartments | 118 (20.7%) | 453 (79.3%) |
| 3 or 4 Unit Apartments | 16 (4.0%) | 389 (96.1%) |
| 5 to 9 Unit Apartments | 9 (12.3%) | 64 (87.7%) |
| 10 or more Apartments | 0 (0.0%) | 751 (100.0%) |
| Mobile Home / Other | 178 (68.5%) | 82 (31.5%) |
| Total | 2,901 (56.5%) | 2,230 (43.5%) |
Housing Structures by Number of Rooms in Newport East
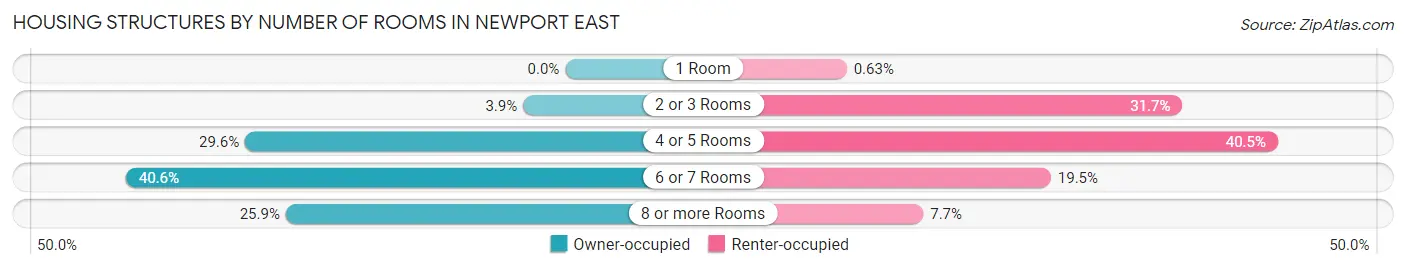
| Number of Rooms | Owner-occupied | Renter-occupied |
| 1 Room | 0 (0.0%) | 14 (0.6%) |
| 2 or 3 Rooms | 113 (3.9%) | 706 (31.7%) |
| 4 or 5 Rooms | 859 (29.6%) | 903 (40.5%) |
| 6 or 7 Rooms | 1,179 (40.6%) | 435 (19.5%) |
| 8 or more Rooms | 750 (25.9%) | 172 (7.7%) |
| Total | 2,901 (100.0%) | 2,230 (100.0%) |
Housing Structure by Heating Type in Newport East
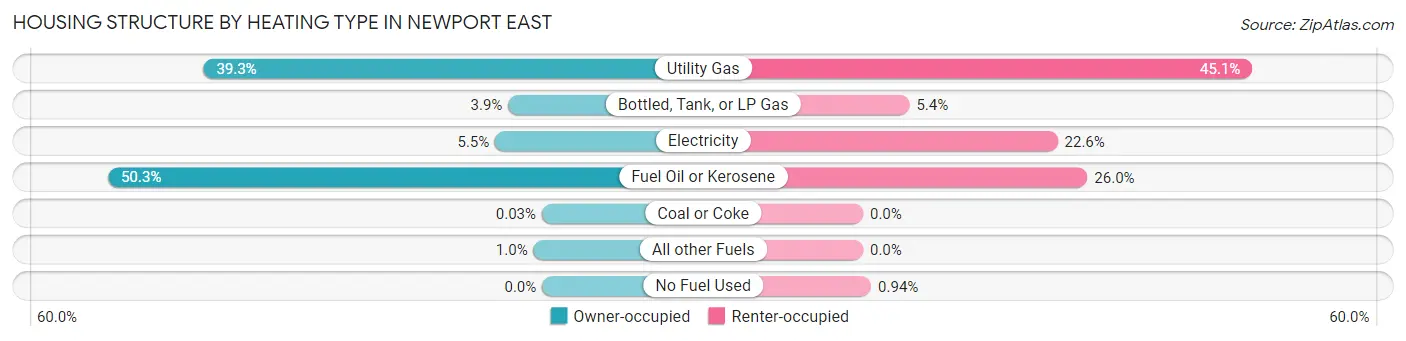
| Heating Type | Owner-occupied | Renter-occupied |
| Utility Gas | 1,139 (39.3%) | 1,006 (45.1%) |
| Bottled, Tank, or LP Gas | 114 (3.9%) | 120 (5.4%) |
| Electricity | 158 (5.4%) | 503 (22.6%) |
| Fuel Oil or Kerosene | 1,460 (50.3%) | 580 (26.0%) |
| Coal or Coke | 1 (0.0%) | 0 (0.0%) |
| All other Fuels | 29 (1.0%) | 0 (0.0%) |
| No Fuel Used | 0 (0.0%) | 21 (0.9%) |
| Total | 2,901 (100.0%) | 2,230 (100.0%) |
Household Vehicle Usage in Newport East
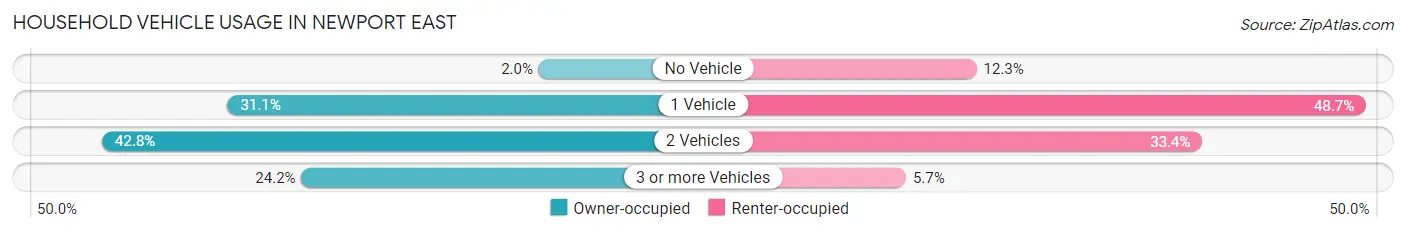
| Vehicles per Household | Owner-occupied | Renter-occupied |
| No Vehicle | 58 (2.0%) | 274 (12.3%) |
| 1 Vehicle | 901 (31.1%) | 1,085 (48.6%) |
| 2 Vehicles | 1,241 (42.8%) | 744 (33.4%) |
| 3 or more Vehicles | 701 (24.2%) | 127 (5.7%) |
| Total | 2,901 (100.0%) | 2,230 (100.0%) |
Real Estate & Mortgages in Newport East
Real Estate and Mortgage Overview in Newport East
| Characteristic | Without Mortgage | With Mortgage |
| Housing Units | 798 | 2,103 |
| Median Property Value | $427,200 | $449,500 |
| Median Household Income | $70,075 | $755 |
| Monthly Housing Costs | $869 | $508 |
| Real Estate Taxes | $4,946 | $14 |
Property Value by Mortgage Status in Newport East
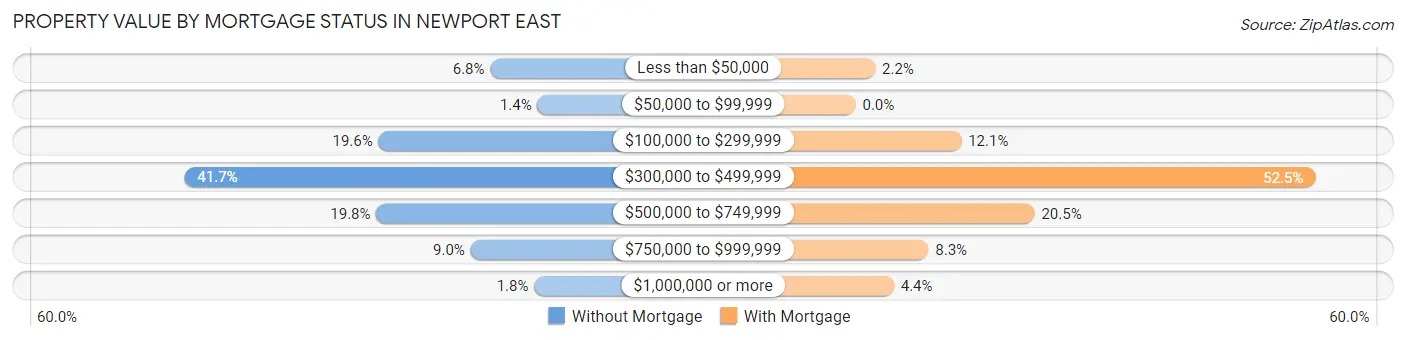
| Property Value | Without Mortgage | With Mortgage |
| Less than $50,000 | 54 (6.8%) | 47 (2.2%) |
| $50,000 to $99,999 | 11 (1.4%) | 0 (0.0%) |
| $100,000 to $299,999 | 156 (19.6%) | 254 (12.1%) |
| $300,000 to $499,999 | 333 (41.7%) | 1,105 (52.5%) |
| $500,000 to $749,999 | 158 (19.8%) | 430 (20.4%) |
| $750,000 to $999,999 | 72 (9.0%) | 175 (8.3%) |
| $1,000,000 or more | 14 (1.8%) | 92 (4.4%) |
| Total | 798 (100.0%) | 2,103 (100.0%) |
Household Income by Mortgage Status in Newport East
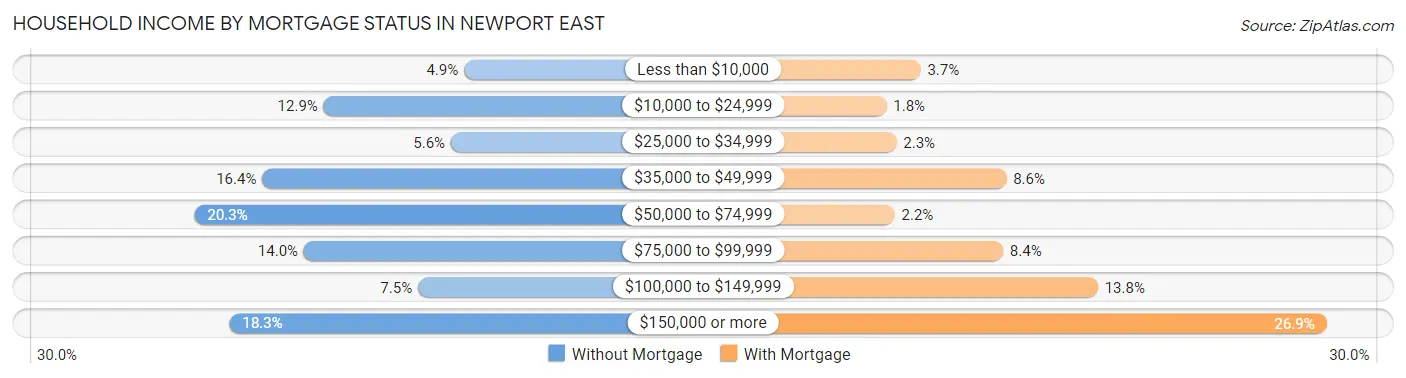
| Household Income | Without Mortgage | With Mortgage |
| Less than $10,000 | 39 (4.9%) | 78 (3.7%) |
| $10,000 to $24,999 | 103 (12.9%) | 37 (1.8%) |
| $25,000 to $34,999 | 45 (5.6%) | 49 (2.3%) |
| $35,000 to $49,999 | 131 (16.4%) | 181 (8.6%) |
| $50,000 to $74,999 | 162 (20.3%) | 47 (2.2%) |
| $75,000 to $99,999 | 112 (14.0%) | 177 (8.4%) |
| $100,000 to $149,999 | 60 (7.5%) | 291 (13.8%) |
| $150,000 or more | 146 (18.3%) | 566 (26.9%) |
| Total | 798 (100.0%) | 2,103 (100.0%) |
Property Value to Household Income Ratio in Newport East
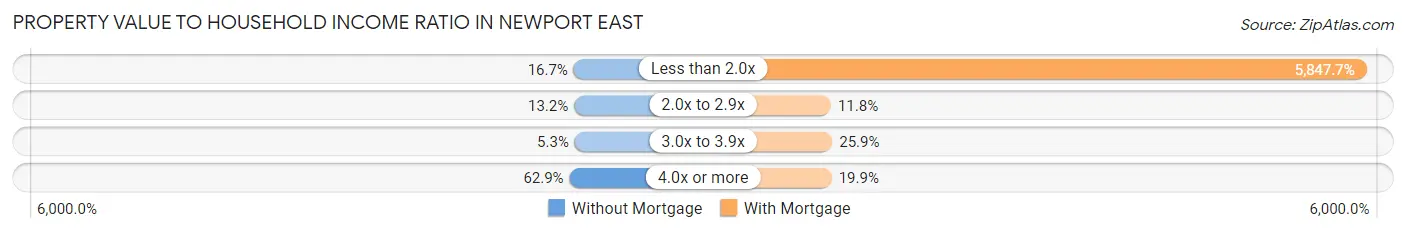
| Value-to-Income Ratio | Without Mortgage | With Mortgage |
| Less than 2.0x | 133 (16.7%) | 122,978 (5,847.7%) |
| 2.0x to 2.9x | 105 (13.2%) | 249 (11.8%) |
| 3.0x to 3.9x | 42 (5.3%) | 545 (25.9%) |
| 4.0x or more | 502 (62.9%) | 418 (19.9%) |
| Total | 798 (100.0%) | 2,103 (100.0%) |
Real Estate Taxes by Mortgage Status in Newport East
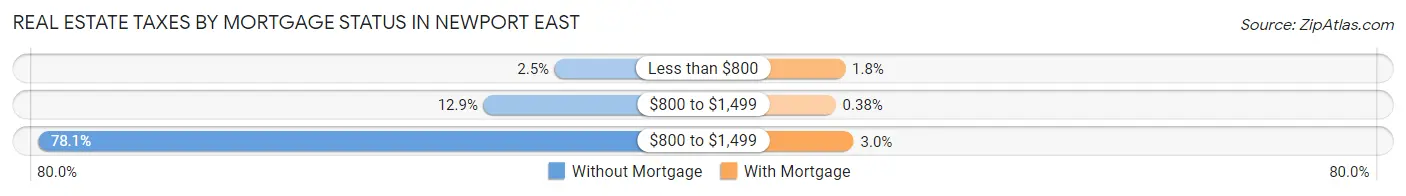
| Property Taxes | Without Mortgage | With Mortgage |
| Less than $800 | 20 (2.5%) | 37 (1.8%) |
| $800 to $1,499 | 103 (12.9%) | 8 (0.4%) |
| $800 to $1,499 | 623 (78.1%) | 63 (3.0%) |
| Total | 798 (100.0%) | 2,103 (100.0%) |
Health & Disability in Newport East
Health Insurance Coverage by Age in Newport East
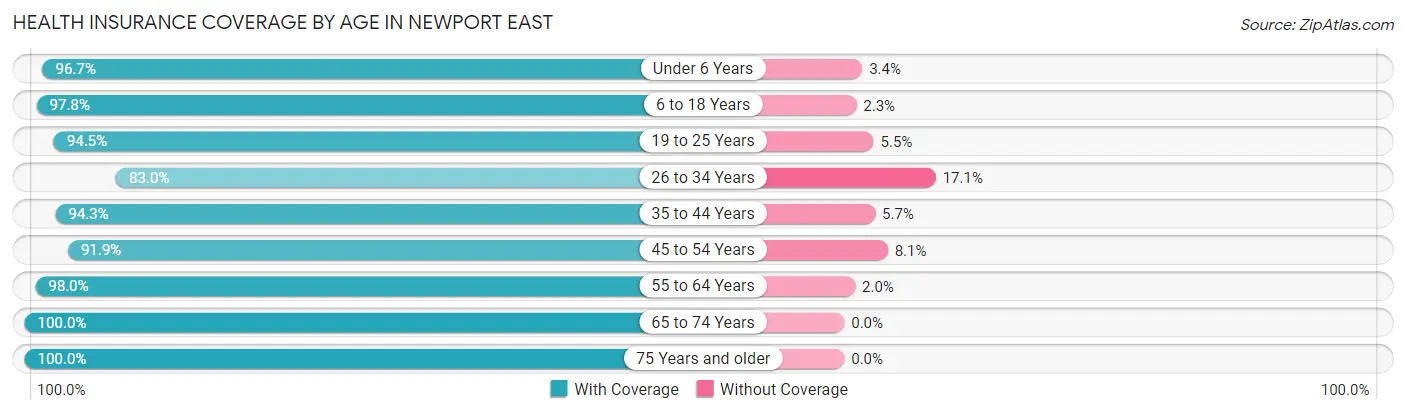
| Age Bracket | With Coverage | Without Coverage |
| Under 6 Years | 894 (96.7%) | 31 (3.4%) |
| 6 to 18 Years | 1,216 (97.8%) | 28 (2.2%) |
| 19 to 25 Years | 797 (94.5%) | 46 (5.5%) |
| 26 to 34 Years | 1,275 (83.0%) | 262 (17.1%) |
| 35 to 44 Years | 986 (94.3%) | 60 (5.7%) |
| 45 to 54 Years | 1,238 (91.9%) | 109 (8.1%) |
| 55 to 64 Years | 1,512 (98.0%) | 31 (2.0%) |
| 65 to 74 Years | 1,468 (100.0%) | 0 (0.0%) |
| 75 Years and older | 1,267 (100.0%) | 0 (0.0%) |
| Total | 10,653 (95.0%) | 567 (5.1%) |
Health Insurance Coverage by Citizenship Status in Newport East
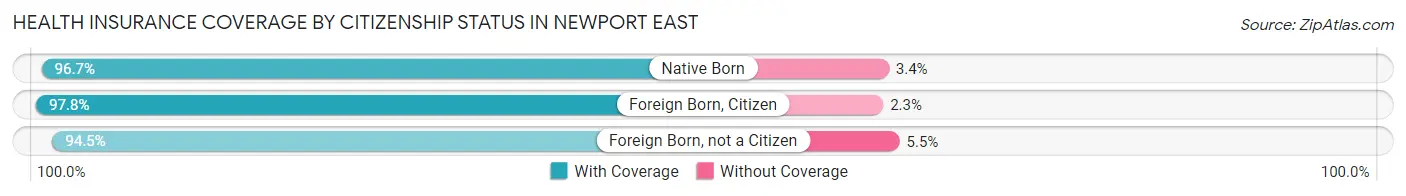
| Citizenship Status | With Coverage | Without Coverage |
| Native Born | 894 (96.7%) | 31 (3.4%) |
| Foreign Born, Citizen | 1,216 (97.8%) | 28 (2.2%) |
| Foreign Born, not a Citizen | 797 (94.5%) | 46 (5.5%) |
Health Insurance Coverage by Household Income in Newport East
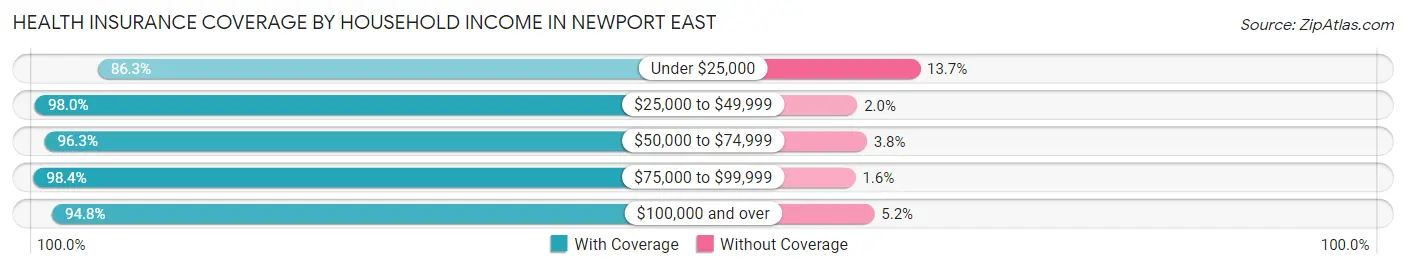
| Household Income | With Coverage | Without Coverage |
| Under $25,000 | 1,075 (86.3%) | 171 (13.7%) |
| $25,000 to $49,999 | 1,053 (98.0%) | 21 (2.0%) |
| $50,000 to $74,999 | 1,232 (96.3%) | 48 (3.7%) |
| $75,000 to $99,999 | 1,693 (98.4%) | 28 (1.6%) |
| $100,000 and over | 5,500 (94.8%) | 299 (5.2%) |
Public vs Private Health Insurance Coverage by Age in Newport East
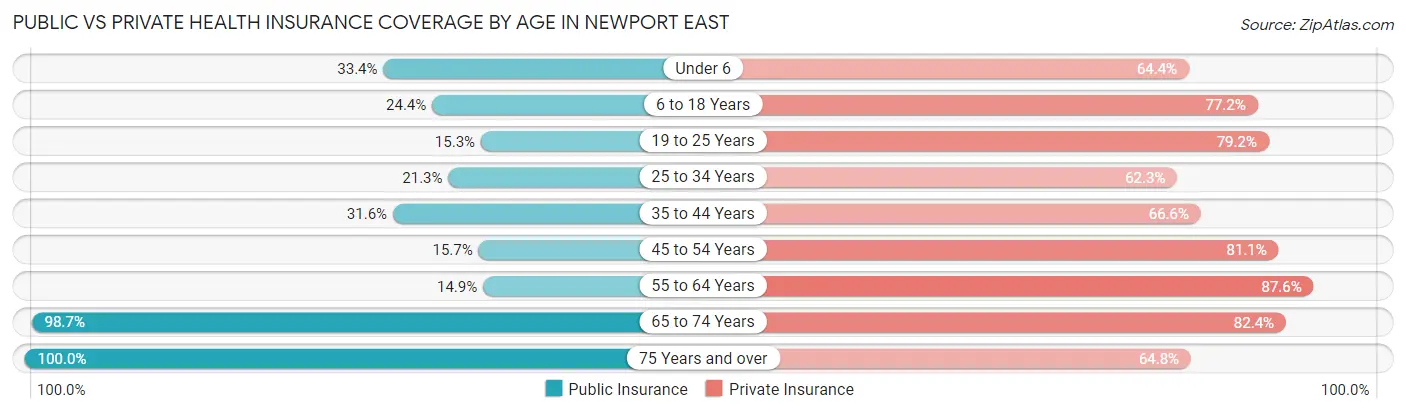
| Age Bracket | Public Insurance | Private Insurance |
| Under 6 | 309 (33.4%) | 596 (64.4%) |
| 6 to 18 Years | 303 (24.4%) | 960 (77.2%) |
| 19 to 25 Years | 129 (15.3%) | 668 (79.2%) |
| 25 to 34 Years | 328 (21.3%) | 957 (62.3%) |
| 35 to 44 Years | 331 (31.6%) | 697 (66.6%) |
| 45 to 54 Years | 212 (15.7%) | 1,092 (81.1%) |
| 55 to 64 Years | 230 (14.9%) | 1,351 (87.6%) |
| 65 to 74 Years | 1,449 (98.7%) | 1,210 (82.4%) |
| 75 Years and over | 1,267 (100.0%) | 821 (64.8%) |
| Total | 4,558 (40.6%) | 8,352 (74.4%) |
Disability Status by Sex by Age in Newport East
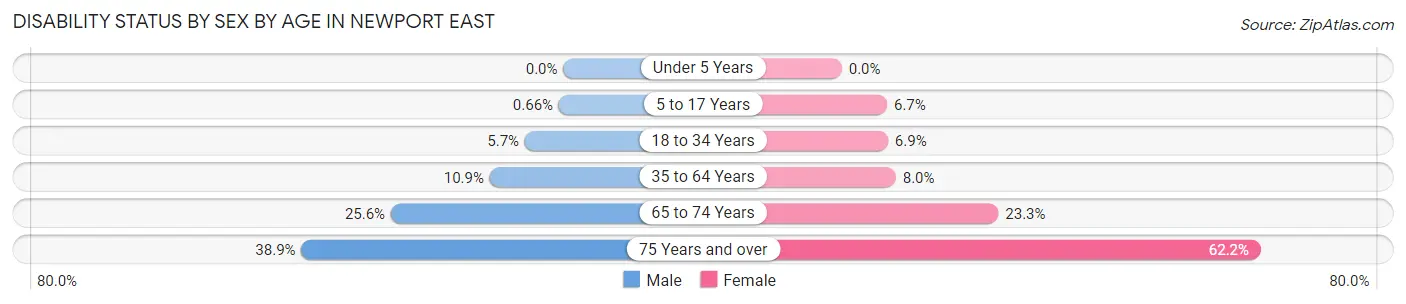
| Age Bracket | Male | Female |
| Under 5 Years | 0 (0.0%) | 0 (0.0%) |
| 5 to 17 Years | 4 (0.7%) | 49 (6.7%) |
| 18 to 34 Years | 69 (5.7%) | 92 (6.9%) |
| 35 to 64 Years | 212 (10.9%) | 160 (8.0%) |
| 65 to 74 Years | 171 (25.6%) | 186 (23.3%) |
| 75 Years and over | 184 (38.9%) | 494 (62.2%) |
Disability Class by Sex by Age in Newport East
Disability Class: Hearing Difficulty
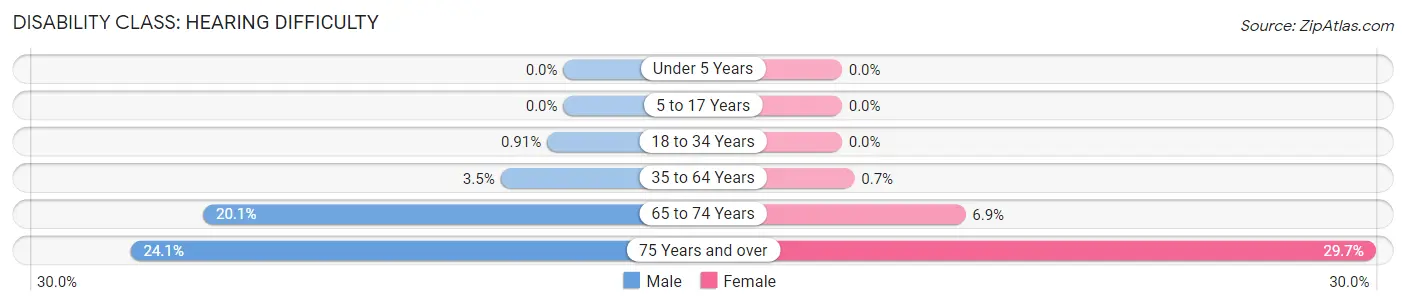
| Age Bracket | Male | Female |
| Under 5 Years | 0 (0.0%) | 0 (0.0%) |
| 5 to 17 Years | 0 (0.0%) | 0 (0.0%) |
| 18 to 34 Years | 11 (0.9%) | 0 (0.0%) |
| 35 to 64 Years | 68 (3.5%) | 14 (0.7%) |
| 65 to 74 Years | 134 (20.1%) | 55 (6.9%) |
| 75 Years and over | 114 (24.1%) | 236 (29.7%) |
Disability Class: Vision Difficulty
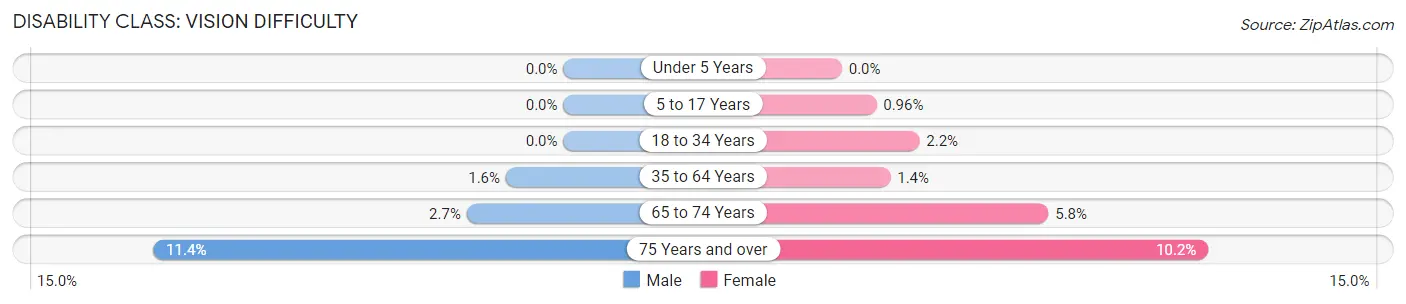
| Age Bracket | Male | Female |
| Under 5 Years | 0 (0.0%) | 0 (0.0%) |
| 5 to 17 Years | 0 (0.0%) | 7 (1.0%) |
| 18 to 34 Years | 0 (0.0%) | 29 (2.2%) |
| 35 to 64 Years | 31 (1.6%) | 27 (1.3%) |
| 65 to 74 Years | 18 (2.7%) | 46 (5.8%) |
| 75 Years and over | 54 (11.4%) | 81 (10.2%) |
Disability Class: Cognitive Difficulty
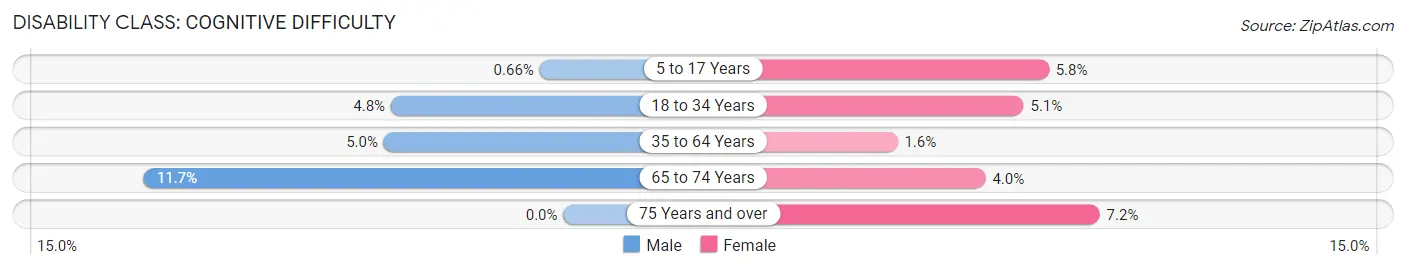
| Age Bracket | Male | Female |
| 5 to 17 Years | 4 (0.7%) | 42 (5.8%) |
| 18 to 34 Years | 58 (4.8%) | 68 (5.1%) |
| 35 to 64 Years | 97 (5.0%) | 31 (1.5%) |
| 65 to 74 Years | 78 (11.7%) | 32 (4.0%) |
| 75 Years and over | 0 (0.0%) | 57 (7.2%) |
Disability Class: Ambulatory Difficulty
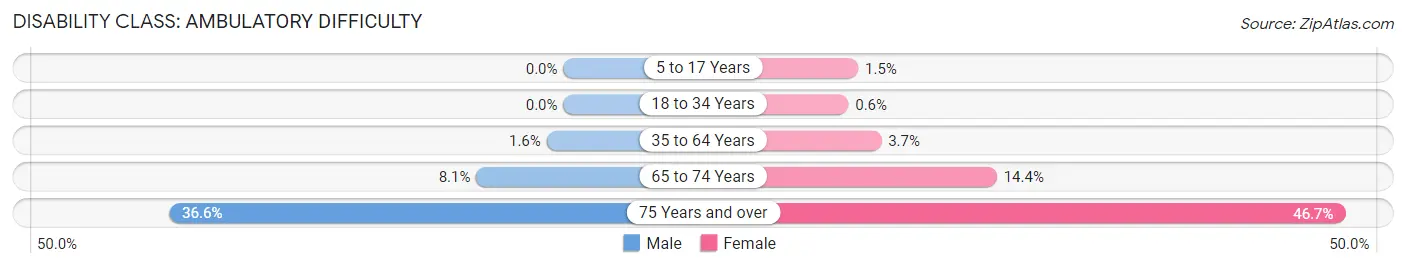
| Age Bracket | Male | Female |
| 5 to 17 Years | 0 (0.0%) | 11 (1.5%) |
| 18 to 34 Years | 0 (0.0%) | 8 (0.6%) |
| 35 to 64 Years | 30 (1.5%) | 73 (3.7%) |
| 65 to 74 Years | 54 (8.1%) | 115 (14.4%) |
| 75 Years and over | 173 (36.6%) | 371 (46.7%) |
Disability Class: Self-Care Difficulty
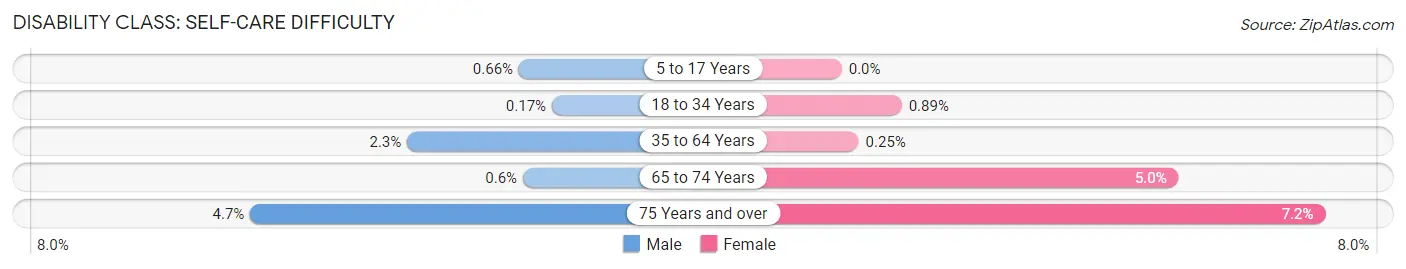
| Age Bracket | Male | Female |
| 5 to 17 Years | 4 (0.7%) | 0 (0.0%) |
| 18 to 34 Years | 2 (0.2%) | 12 (0.9%) |
| 35 to 64 Years | 45 (2.3%) | 5 (0.3%) |
| 65 to 74 Years | 4 (0.6%) | 40 (5.0%) |
| 75 Years and over | 22 (4.6%) | 57 (7.2%) |
Technology Access in Newport East
Computing Device Access in Newport East
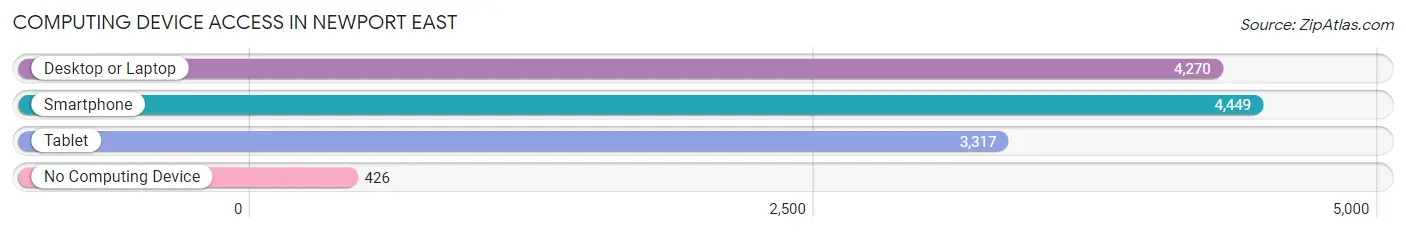
| Device Type | # Households | % Households |
| Desktop or Laptop | 4,270 | 83.2% |
| Smartphone | 4,449 | 86.7% |
| Tablet | 3,317 | 64.6% |
| No Computing Device | 426 | 8.3% |
| Total | 5,131 | 100.0% |
Internet Access in Newport East
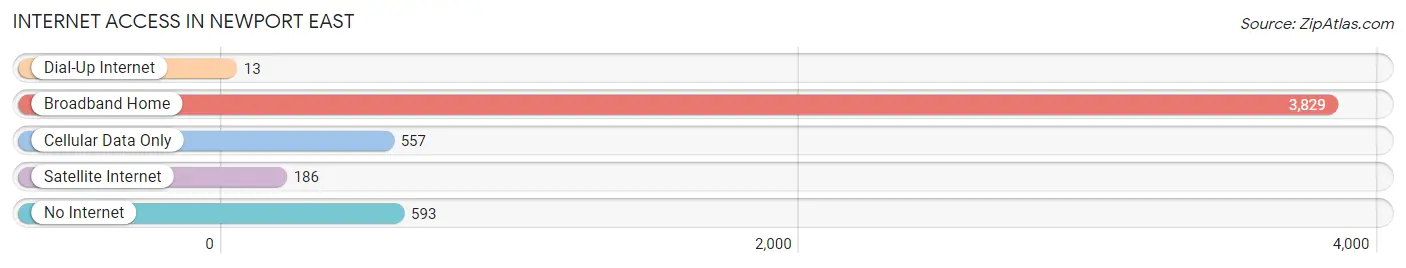
| Internet Type | # Households | % Households |
| Dial-Up Internet | 13 | 0.3% |
| Broadband Home | 3,829 | 74.6% |
| Cellular Data Only | 557 | 10.9% |
| Satellite Internet | 186 | 3.6% |
| No Internet | 593 | 11.6% |
| Total | 5,131 | 100.0% |
Newport East Summary
Newport East, Rhode Island is a small town located in the eastern part of the state. It is situated on the eastern shore of Narragansett Bay, and is part of the larger city of Newport. The town has a population of approximately 4,000 people, and is known for its picturesque views of the bay and its historic architecture.
History
The area that is now Newport East was originally inhabited by the Narragansett Native American tribe. The first European settlers arrived in the area in 1639, and the town was officially incorporated in 1784. During the Revolutionary War, Newport East was the site of several battles, including the Battle of Rhode Island in 1778.
In the 19th century, Newport East became a popular summer destination for wealthy families from the Northeast. The town was home to several grand estates, including the Astor family’s Beechwood estate. The town also became a center for the whaling industry, and several whaling ships were based in Newport East.
In the 20th century, Newport East became a popular tourist destination. The town is home to several historic sites, including the Touro Synagogue, the oldest synagogue in the United States. The town is also home to the International Tennis Hall of Fame, which is located in the historic Newport Casino.
Geography
Newport East is located in the eastern part of Rhode Island, on the eastern shore of Narragansett Bay. The town is bordered by the towns of Middletown and Portsmouth to the north, and Jamestown to the south. The town is approximately 10 miles from the state capital of Providence.
The town is situated on a peninsula, with the bay to the east and the Sakonnet River to the west. The town is home to several beaches, including Easton’s Beach and Bailey’s Beach. The town is also home to several parks, including Fort Adams State Park and Brenton Point State Park.
Economy
The economy of Newport East is largely based on tourism. The town is home to several historic sites, including the Touro Synagogue and the International Tennis Hall of Fame. The town is also home to several marinas, which attract boaters from around the world.
The town is also home to several businesses, including restaurants, retail stores, and art galleries. The town is also home to several boatyards, which provide services to the local fishing and boating industries.
Demographics
As of the 2010 census, the population of Newport East was 4,068. The town has a median household income of $50,945, and a median age of 44. The town is predominantly white, with approximately 87% of the population identifying as white. The town is also home to a small Hispanic population, with approximately 5% of the population identifying as Hispanic or Latino. The town is also home to a small African American population, with approximately 2% of the population identifying as African American.
Common Questions
What is Per Capita Income in Newport East?
Per Capita income in Newport East is $49,155.
What is the Median Family Income in Newport East?
Median Family Income in Newport East is $106,658.
What is the Median Household income in Newport East?
Median Household Income in Newport East is $90,659.
What is Income or Wage Gap in Newport East?
Income or Wage Gap in Newport East is 33.2%.
Women in Newport East earn 66.8 cents for every dollar earned by a man.
What is Inequality or Gini Index in Newport East?
Inequality or Gini Index in Newport East is 0.44.
What is the Total Population of Newport East?
Total Population of Newport East is 11,644.
What is the Total Male Population of Newport East?
Total Male Population of Newport East is 5,591.
What is the Total Female Population of Newport East?
Total Female Population of Newport East is 6,053.
What is the Ratio of Males per 100 Females in Newport East?
There are 92.37 Males per 100 Females in Newport East.
What is the Ratio of Females per 100 Males in Newport East?
There are 108.26 Females per 100 Males in Newport East.
What is the Median Population Age in Newport East?
Median Population Age in Newport East is 45.2 Years.
What is the Average Family Size in Newport East
Average Family Size in Newport East is 2.8 People.
What is the Average Household Size in Newport East
Average Household Size in Newport East is 2.2 People.
How Large is the Labor Force in Newport East?
There are 6,547 People in the Labor Forcein in Newport East.
What is the Percentage of People in the Labor Force in Newport East?
66.6% of People are in the Labor Force in Newport East.
What is the Unemployment Rate in Newport East?
Unemployment Rate in Newport East is 5.8%.