Cumberland Hill, RI Map & Demographics
Cumberland Hill Map
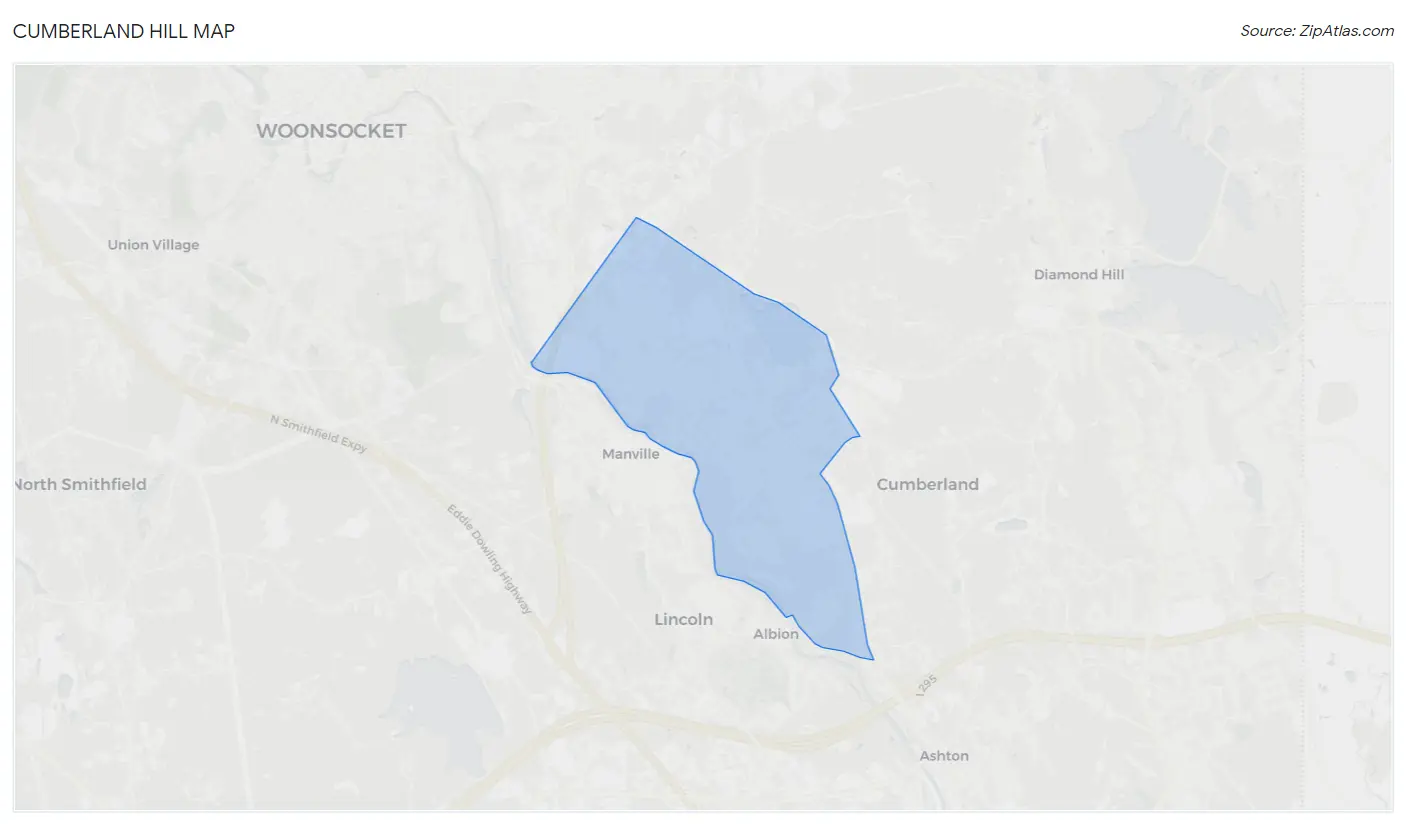
Cumberland Hill Overview
$47,269
PER CAPITA INCOME
$131,354
AVG FAMILY INCOME
$120,365
AVG HOUSEHOLD INCOME
24.6%
WAGE / INCOME GAP [ % ]
75.4¢/ $1
WAGE / INCOME GAP [ $ ]
0.36
INEQUALITY / GINI INDEX
8,866
TOTAL POPULATION
3,913
MALE POPULATION
4,953
FEMALE POPULATION
79.00
MALES / 100 FEMALES
126.58
FEMALES / 100 MALES
40.5
MEDIAN AGE
3.2
AVG FAMILY SIZE
2.6
AVG HOUSEHOLD SIZE
5,343
LABOR FORCE [ PEOPLE ]
72.7%
PERCENT IN LABOR FORCE
2.5%
UNEMPLOYMENT RATE
Income in Cumberland Hill
Income Overview in Cumberland Hill
Per Capita Income in Cumberland Hill is $47,269, while median incomes of families and households are $131,354 and $120,365 respectively.
| Characteristic | Number | Measure |
| Per Capita Income | 8,866 | $47,269 |
| Median Family Income | 2,312 | $131,354 |
| Mean Family Income | 2,312 | $143,203 |
| Median Household Income | 3,350 | $120,365 |
| Mean Household Income | 3,350 | $123,017 |
| Income Deficit | 2,312 | $0 |
| Wage / Income Gap (%) | 8,866 | 24.60% |
| Wage / Income Gap ($) | 8,866 | 75.40¢ per $1 |
| Gini / Inequality Index | 8,866 | 0.36 |
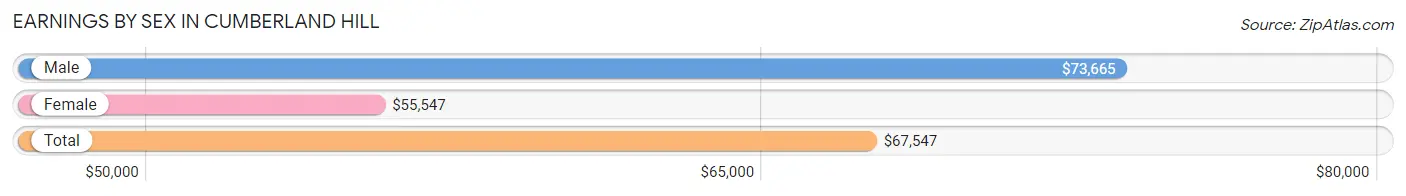
Earnings by Sex in Cumberland Hill
Average Earnings in Cumberland Hill are $67,547, $73,665 for men and $55,547 for women, a difference of 24.6%.
| Sex | Number | Average Earnings |
| Male | 2,484 (46.0%) | $73,665 |
| Female | 2,912 (54.0%) | $55,547 |
| Total | 5,396 (100.0%) | $67,547 |
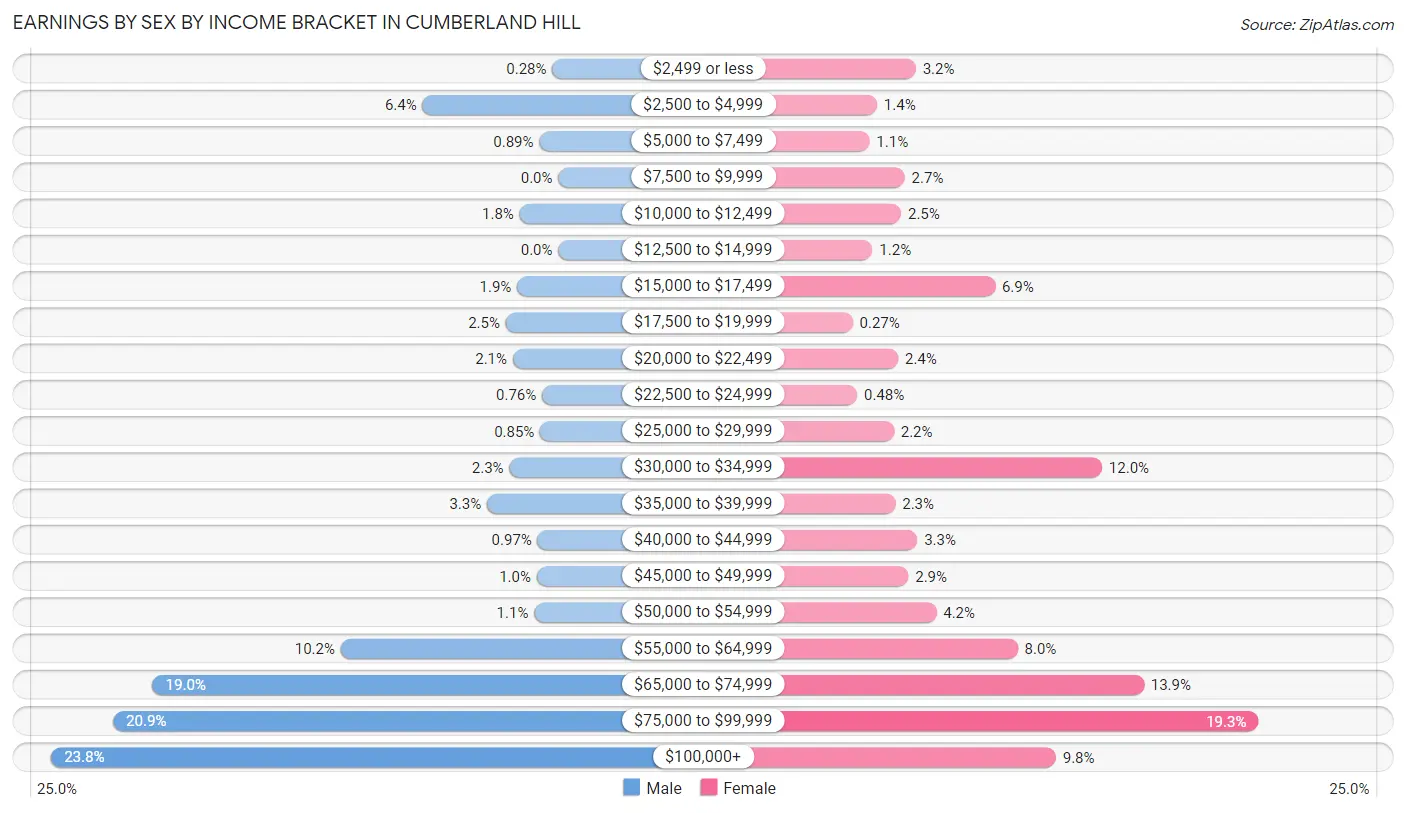
Earnings by Sex by Income Bracket in Cumberland Hill
The most common earnings brackets in Cumberland Hill are $100,000+ for men (590 | 23.7%) and $75,000 to $99,999 for women (561 | 19.3%).
| Income | Male | Female |
| $2,499 or less | 7 (0.3%) | 94 (3.2%) |
| $2,500 to $4,999 | 158 (6.4%) | 41 (1.4%) |
| $5,000 to $7,499 | 22 (0.9%) | 31 (1.1%) |
| $7,500 to $9,999 | 0 (0.0%) | 79 (2.7%) |
| $10,000 to $12,499 | 45 (1.8%) | 74 (2.5%) |
| $12,500 to $14,999 | 0 (0.0%) | 35 (1.2%) |
| $15,000 to $17,499 | 48 (1.9%) | 202 (6.9%) |
| $17,500 to $19,999 | 61 (2.5%) | 8 (0.3%) |
| $20,000 to $22,499 | 53 (2.1%) | 70 (2.4%) |
| $22,500 to $24,999 | 19 (0.8%) | 14 (0.5%) |
| $25,000 to $29,999 | 21 (0.9%) | 64 (2.2%) |
| $30,000 to $34,999 | 57 (2.3%) | 348 (11.9%) |
| $35,000 to $39,999 | 83 (3.3%) | 66 (2.3%) |
| $40,000 to $44,999 | 24 (1.0%) | 96 (3.3%) |
| $45,000 to $49,999 | 25 (1.0%) | 84 (2.9%) |
| $50,000 to $54,999 | 28 (1.1%) | 122 (4.2%) |
| $55,000 to $64,999 | 253 (10.2%) | 233 (8.0%) |
| $65,000 to $74,999 | 472 (19.0%) | 405 (13.9%) |
| $75,000 to $99,999 | 518 (20.8%) | 561 (19.3%) |
| $100,000+ | 590 (23.7%) | 285 (9.8%) |
| Total | 2,484 (100.0%) | 2,912 (100.0%) |
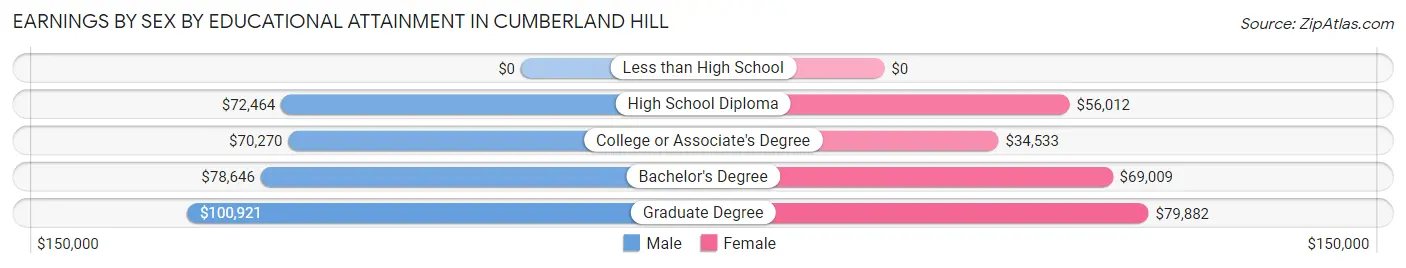
Earnings by Sex by Educational Attainment in Cumberland Hill
Average earnings in Cumberland Hill are $74,397 for men and $63,988 for women, a difference of 14.0%. Men with an educational attainment of graduate degree enjoy the highest average annual earnings of $100,921, while those with college or associate's degree education earn the least with $70,270. Women with an educational attainment of graduate degree earn the most with the average annual earnings of $79,882, while those with college or associate's degree education have the smallest earnings of $34,533.
| Educational Attainment | Male Income | Female Income |
| Less than High School | - | - |
| High School Diploma | $72,464 | $56,012 |
| College or Associate's Degree | $70,270 | $34,533 |
| Bachelor's Degree | $78,646 | $69,009 |
| Graduate Degree | $100,921 | $79,882 |
| Total | $74,397 | $63,988 |
Family Income in Cumberland Hill
Family Income Brackets in Cumberland Hill
According to the Cumberland Hill family income data, there are 606 families falling into the $150,000 to $199,999 income range, which is the most common income bracket and makes up 26.2% of all families. Conversely, the $25,000 to $34,999 income bracket is the least frequent group with only 5 families (0.2%) belonging to this category.
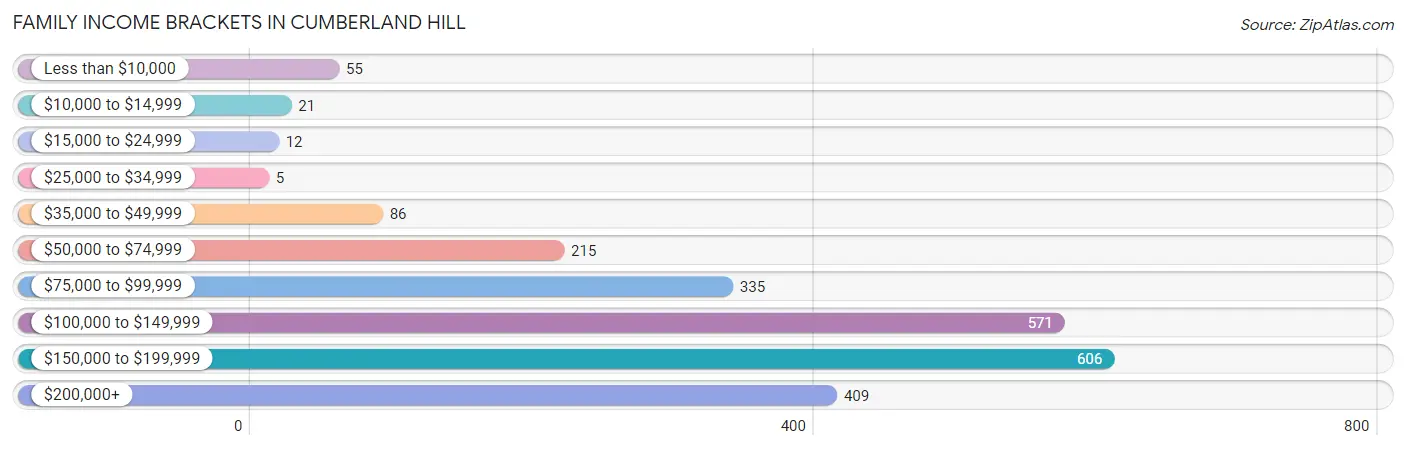
| Income Bracket | # Families | % Families |
| Less than $10,000 | 55 | 2.4% |
| $10,000 to $14,999 | 21 | 0.9% |
| $15,000 to $24,999 | 12 | 0.5% |
| $25,000 to $34,999 | 5 | 0.2% |
| $35,000 to $49,999 | 86 | 3.7% |
| $50,000 to $74,999 | 215 | 9.3% |
| $75,000 to $99,999 | 335 | 14.5% |
| $100,000 to $149,999 | 571 | 24.7% |
| $150,000 to $199,999 | 606 | 26.2% |
| $200,000+ | 409 | 17.7% |
Family Income by Famaliy Size in Cumberland Hill
4-person families (651 | 28.2%) account for the highest median family income in Cumberland Hill with $182,825 per family, while 2-person families (891 | 38.5%) have the highest median income of $50,896 per family member.
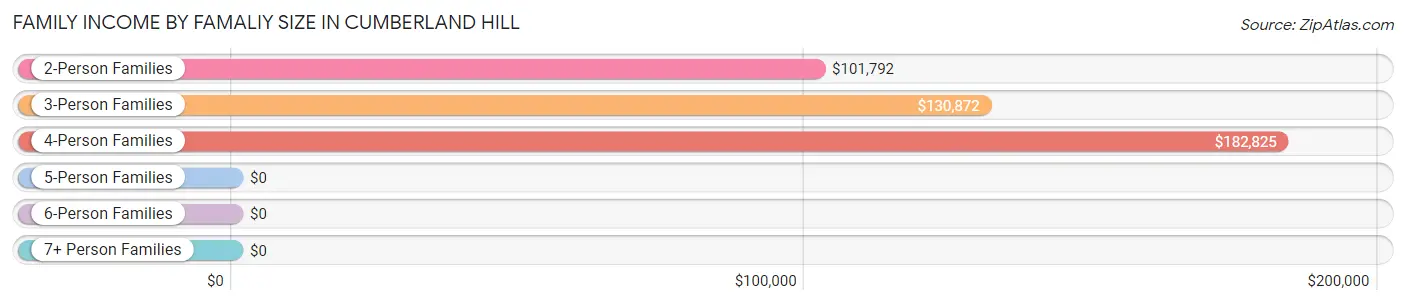
| Income Bracket | # Families | Median Income |
| 2-Person Families | 891 (38.5%) | $101,792 |
| 3-Person Families | 652 (28.2%) | $130,872 |
| 4-Person Families | 651 (28.2%) | $182,825 |
| 5-Person Families | 118 (5.1%) | $0 |
| 6-Person Families | 0 (0.0%) | $0 |
| 7+ Person Families | 0 (0.0%) | $0 |
| Total | 2,312 (100.0%) | $131,354 |
Family Income by Number of Earners in Cumberland Hill
The median family income in Cumberland Hill is $131,354, with families comprising 3+ earners (572) having the highest median family income of $183,848, while families with no earners (181) have the lowest median family income of $59,013, accounting for 24.7% and 7.8% of families, respectively.
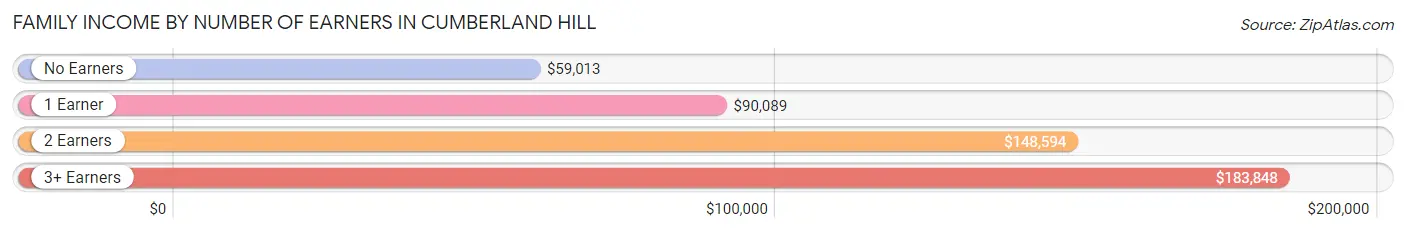
| Number of Earners | # Families | Median Income |
| No Earners | 181 (7.8%) | $59,013 |
| 1 Earner | 579 (25.0%) | $90,089 |
| 2 Earners | 980 (42.4%) | $148,594 |
| 3+ Earners | 572 (24.7%) | $183,848 |
| Total | 2,312 (100.0%) | $131,354 |
Household Income in Cumberland Hill
Household Income Brackets in Cumberland Hill
With 730 households falling in the category, the $150,000 to $199,999 income range is the most frequent in Cumberland Hill, accounting for 21.8% of all households. In contrast, only 47 households (1.4%) fall into the $25,000 to $34,999 income bracket, making it the least populous group.
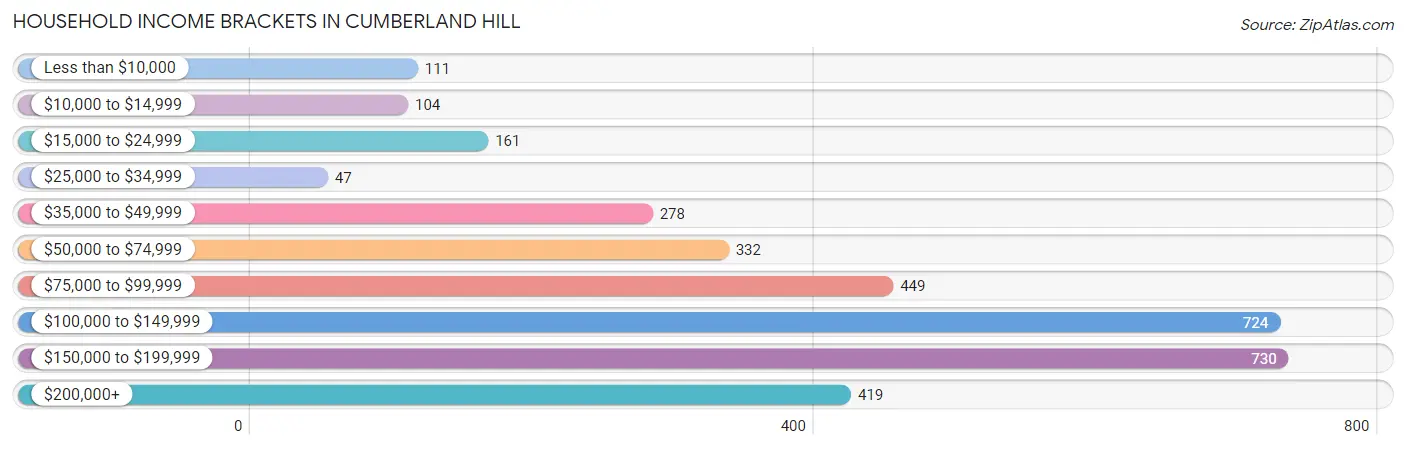
| Income Bracket | # Households | % Households |
| Less than $10,000 | 111 | 3.3% |
| $10,000 to $14,999 | 104 | 3.1% |
| $15,000 to $24,999 | 161 | 4.8% |
| $25,000 to $34,999 | 47 | 1.4% |
| $35,000 to $49,999 | 278 | 8.3% |
| $50,000 to $74,999 | 332 | 9.9% |
| $75,000 to $99,999 | 449 | 13.4% |
| $100,000 to $149,999 | 724 | 21.6% |
| $150,000 to $199,999 | 730 | 21.8% |
| $200,000+ | 419 | 12.5% |
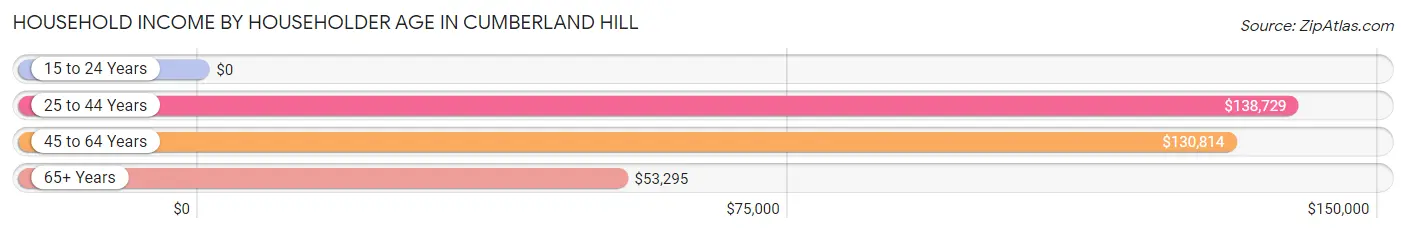
Household Income by Householder Age in Cumberland Hill
The median household income in Cumberland Hill is $120,365, with the highest median household income of $138,729 found in the 25 to 44 years age bracket for the primary householder. A total of 1,005 households (30.0%) fall into this category.
| Income Bracket | # Households | Median Income |
| 15 to 24 Years | 0 (0.0%) | $0 |
| 25 to 44 Years | 1,005 (30.0%) | $138,729 |
| 45 to 64 Years | 1,554 (46.4%) | $130,814 |
| 65+ Years | 791 (23.6%) | $53,295 |
| Total | 3,350 (100.0%) | $120,365 |
Poverty in Cumberland Hill
Income Below Poverty by Sex and Age in Cumberland Hill
With 4.1% poverty level for males and 10.3% for females among the residents of Cumberland Hill, 16 and 17 year old males and 15 year old females are the most vulnerable to poverty, with 59 males (15.7%) and 42 females (60.0%) in their respective age groups living below the poverty level.
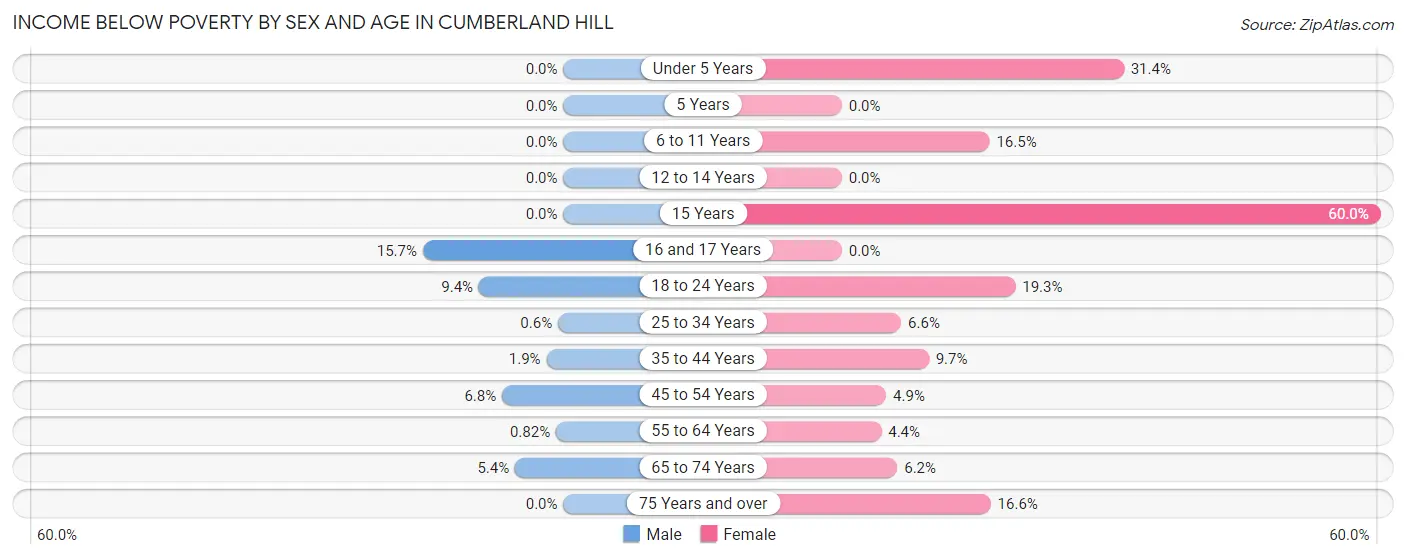
| Age Bracket | Male | Female |
| Under 5 Years | 0 (0.0%) | 81 (31.4%) |
| 5 Years | 0 (0.0%) | 0 (0.0%) |
| 6 to 11 Years | 0 (0.0%) | 50 (16.5%) |
| 12 to 14 Years | 0 (0.0%) | 0 (0.0%) |
| 15 Years | 0 (0.0%) | 42 (60.0%) |
| 16 and 17 Years | 59 (15.7%) | 0 (0.0%) |
| 18 to 24 Years | 22 (9.4%) | 68 (19.3%) |
| 25 to 34 Years | 2 (0.6%) | 51 (6.6%) |
| 35 to 44 Years | 12 (1.9%) | 55 (9.7%) |
| 45 to 54 Years | 38 (6.8%) | 29 (4.9%) |
| 55 to 64 Years | 6 (0.8%) | 40 (4.4%) |
| 65 to 74 Years | 20 (5.4%) | 22 (6.2%) |
| 75 Years and over | 0 (0.0%) | 64 (16.6%) |
| Total | 159 (4.1%) | 502 (10.3%) |
Income Above Poverty by Sex and Age in Cumberland Hill
According to the poverty statistics in Cumberland Hill, males aged under 5 years and females aged 5 years are the age groups that are most secure financially, with 100.0% of males and 100.0% of females in these age groups living above the poverty line.
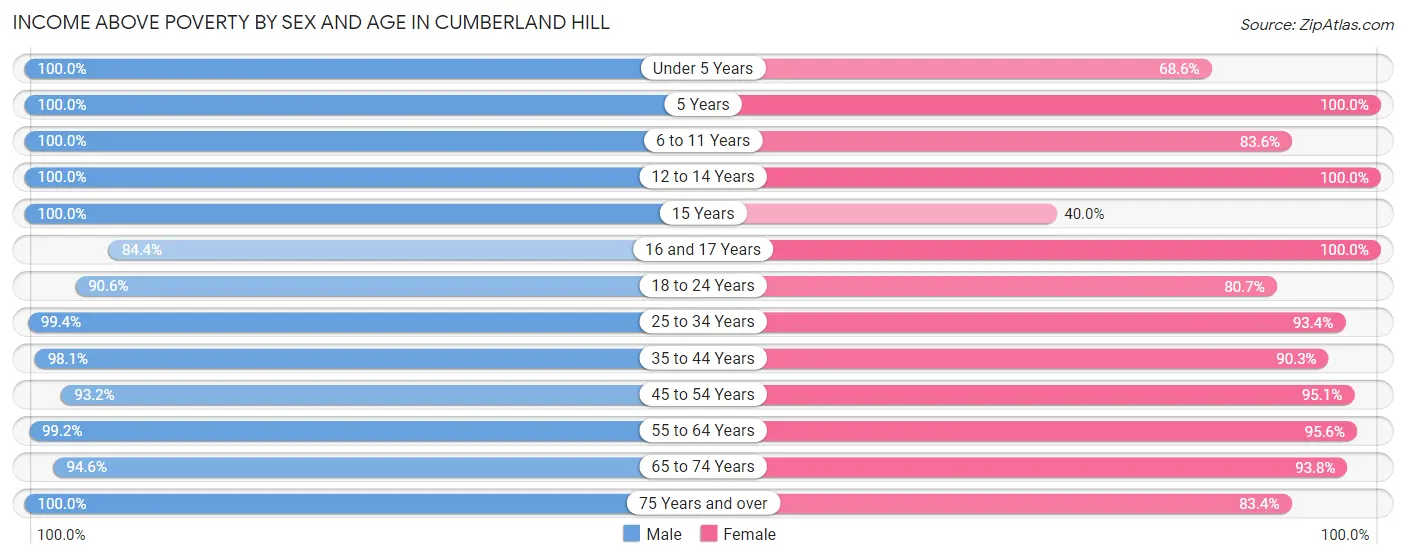
| Age Bracket | Male | Female |
| Under 5 Years | 257 (100.0%) | 177 (68.6%) |
| 5 Years | 44 (100.0%) | 93 (100.0%) |
| 6 to 11 Years | 113 (100.0%) | 254 (83.6%) |
| 12 to 14 Years | 90 (100.0%) | 188 (100.0%) |
| 15 Years | 21 (100.0%) | 28 (40.0%) |
| 16 and 17 Years | 318 (84.4%) | 31 (100.0%) |
| 18 to 24 Years | 212 (90.6%) | 284 (80.7%) |
| 25 to 34 Years | 334 (99.4%) | 720 (93.4%) |
| 35 to 44 Years | 625 (98.1%) | 513 (90.3%) |
| 45 to 54 Years | 518 (93.2%) | 558 (95.1%) |
| 55 to 64 Years | 729 (99.2%) | 870 (95.6%) |
| 65 to 74 Years | 352 (94.6%) | 334 (93.8%) |
| 75 Years and over | 141 (100.0%) | 322 (83.4%) |
| Total | 3,754 (95.9%) | 4,372 (89.7%) |
Income Below Poverty Among Married-Couple Families in Cumberland Hill
The poverty statistics for married-couple families in Cumberland Hill show that 1.0% or 20 of the total 1,942 families live below the poverty line. Families with no children have the highest poverty rate of 1.8%, comprising of 20 families. On the other hand, families with 1 or 2 children have the lowest poverty rate of 0.0%, which includes 0 families.
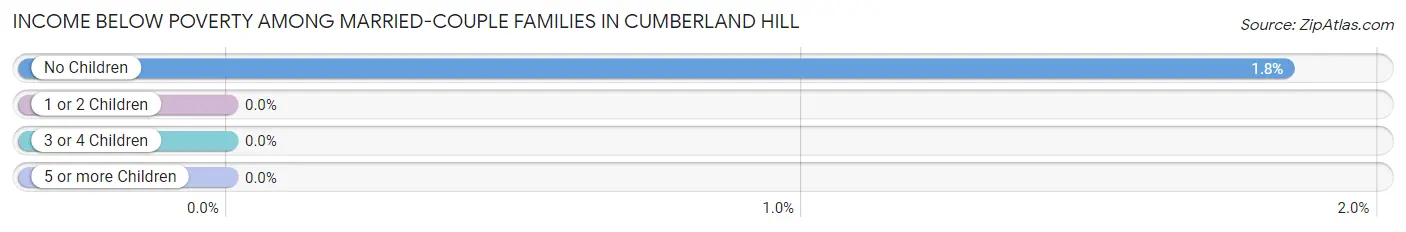
| Children | Above Poverty | Below Poverty |
| No Children | 1,067 (98.2%) | 20 (1.8%) |
| 1 or 2 Children | 820 (100.0%) | 0 (0.0%) |
| 3 or 4 Children | 35 (100.0%) | 0 (0.0%) |
| 5 or more Children | 0 (0.0%) | 0 (0.0%) |
| Total | 1,922 (99.0%) | 20 (1.0%) |
Income Below Poverty Among Single-Parent Households in Cumberland Hill
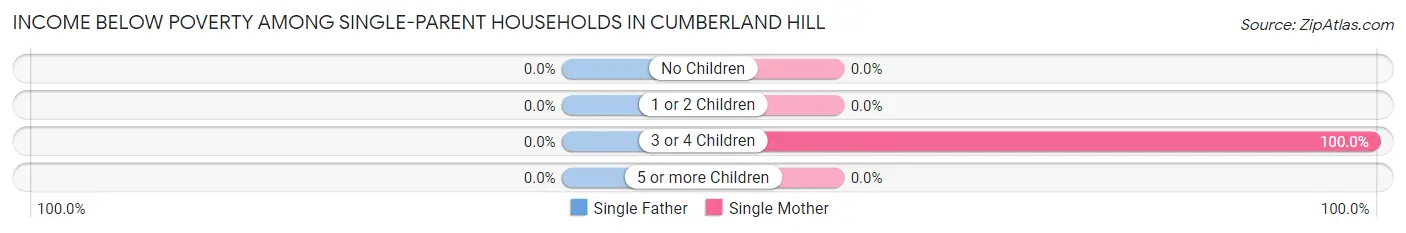
| Children | Single Father | Single Mother |
| No Children | 0 (0.0%) | 0 (0.0%) |
| 1 or 2 Children | 0 (0.0%) | 0 (0.0%) |
| 3 or 4 Children | 0 (0.0%) | 55 (100.0%) |
| 5 or more Children | 0 (0.0%) | 0 (0.0%) |
| Total | 0 (0.0%) | 55 (18.8%) |
Income Below Poverty Among Married-Couple vs Single-Parent Households in Cumberland Hill
The poverty data for Cumberland Hill shows that 20 of the married-couple family households (1.0%) and 55 of the single-parent households (14.9%) are living below the poverty level. Within the married-couple family households, those with no children have the highest poverty rate, with 20 households (1.8%) falling below the poverty line. Among the single-parent households, those with 3 or 4 children have the highest poverty rate, with 55 household (100.0%) living below poverty.
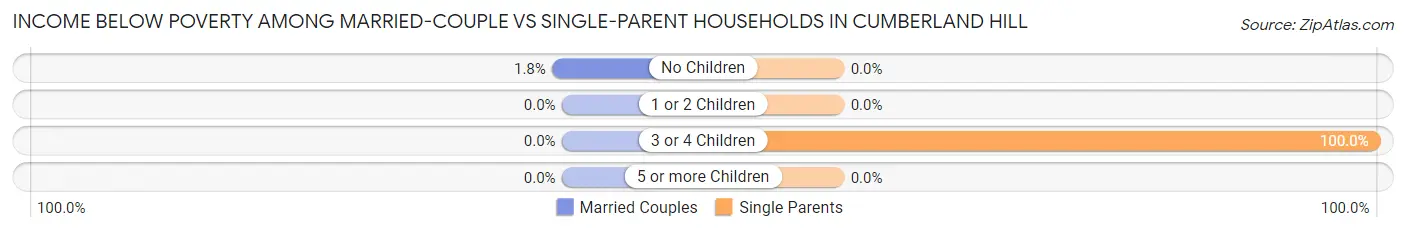
| Children | Married-Couple Families | Single-Parent Households |
| No Children | 20 (1.8%) | 0 (0.0%) |
| 1 or 2 Children | 0 (0.0%) | 0 (0.0%) |
| 3 or 4 Children | 0 (0.0%) | 55 (100.0%) |
| 5 or more Children | 0 (0.0%) | 0 (0.0%) |
| Total | 20 (1.0%) | 55 (14.9%) |
Race in Cumberland Hill
The most populous races in Cumberland Hill are White / Caucasian (7,197 | 81.2%), Hispanic or Latino (824 | 9.3%), and Asian (627 | 7.1%).
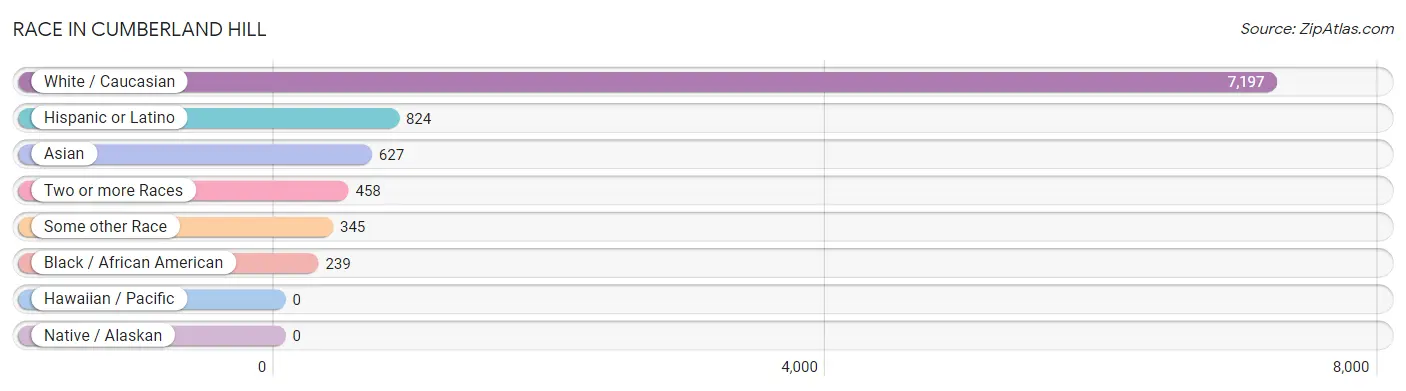
| Race | # Population | % Population |
| Asian | 627 | 7.1% |
| Black / African American | 239 | 2.7% |
| Hawaiian / Pacific | 0 | 0.0% |
| Hispanic or Latino | 824 | 9.3% |
| Native / Alaskan | 0 | 0.0% |
| White / Caucasian | 7,197 | 81.2% |
| Two or more Races | 458 | 5.2% |
| Some other Race | 345 | 3.9% |
| Total | 8,866 | 100.0% |
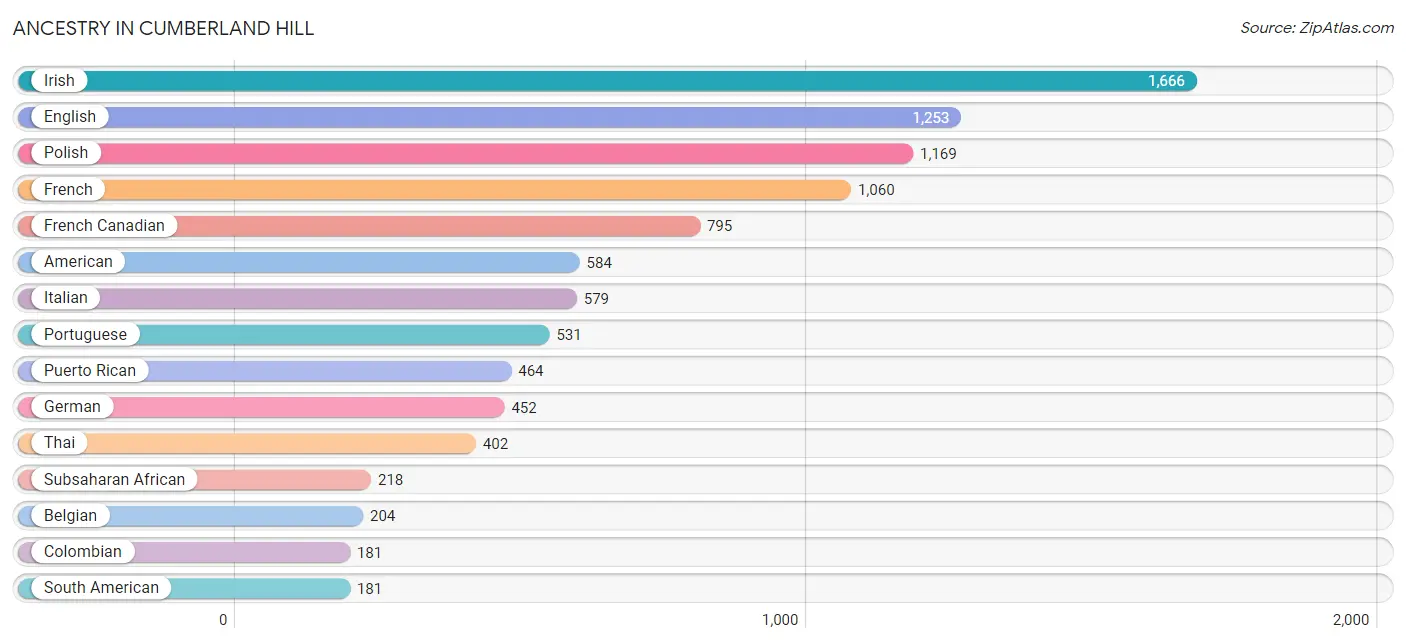
Ancestry in Cumberland Hill
The most populous ancestries reported in Cumberland Hill are Irish (1,666 | 18.8%), English (1,253 | 14.1%), Polish (1,169 | 13.2%), French (1,060 | 12.0%), and French Canadian (795 | 9.0%), together accounting for 67.0% of all Cumberland Hill residents.
| Ancestry | # Population | % Population |
| African | 124 | 1.4% |
| American | 584 | 6.6% |
| Arab | 99 | 1.1% |
| Armenian | 24 | 0.3% |
| Belgian | 204 | 2.3% |
| Bhutanese | 17 | 0.2% |
| British | 16 | 0.2% |
| Burmese | 16 | 0.2% |
| Canadian | 78 | 0.9% |
| Cape Verdean | 54 | 0.6% |
| Central American | 22 | 0.3% |
| Chippewa | 26 | 0.3% |
| Colombian | 181 | 2.0% |
| Czech | 15 | 0.2% |
| Danish | 19 | 0.2% |
| Dominican | 73 | 0.8% |
| English | 1,253 | 14.1% |
| Estonian | 23 | 0.3% |
| European | 40 | 0.4% |
| French | 1,060 | 12.0% |
| French Canadian | 795 | 9.0% |
| German | 452 | 5.1% |
| Greek | 22 | 0.3% |
| Indian (Asian) | 163 | 1.8% |
| Irish | 1,666 | 18.8% |
| Italian | 579 | 6.5% |
| Korean | 80 | 0.9% |
| Latvian | 16 | 0.2% |
| Lebanese | 33 | 0.4% |
| Mexican | 7 | 0.1% |
| Nigerian | 40 | 0.4% |
| Norwegian | 6 | 0.1% |
| Polish | 1,169 | 13.2% |
| Portuguese | 531 | 6.0% |
| Puerto Rican | 464 | 5.2% |
| Russian | 24 | 0.3% |
| Salvadoran | 22 | 0.3% |
| Scotch-Irish | 25 | 0.3% |
| Scottish | 114 | 1.3% |
| South American | 181 | 2.0% |
| Subsaharan African | 218 | 2.5% |
| Swedish | 102 | 1.1% |
| Syrian | 66 | 0.7% |
| Thai | 402 | 4.5% | View All 44 Rows |
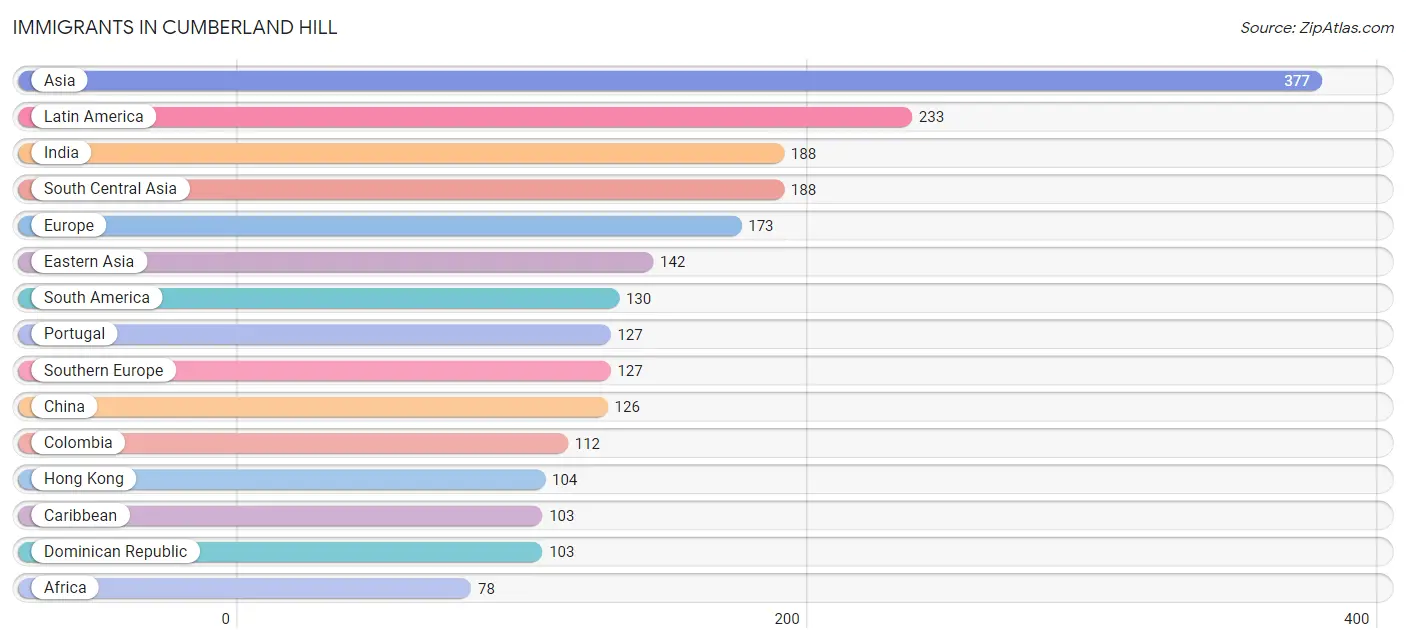
Immigrants in Cumberland Hill
The most numerous immigrant groups reported in Cumberland Hill came from Asia (377 | 4.3%), Latin America (233 | 2.6%), India (188 | 2.1%), South Central Asia (188 | 2.1%), and Europe (173 | 1.9%), together accounting for 13.1% of all Cumberland Hill residents.
| Immigration Origin | # Population | % Population |
| Africa | 78 | 0.9% |
| Asia | 377 | 4.3% |
| Brazil | 18 | 0.2% |
| Cabo Verde | 16 | 0.2% |
| Canada | 54 | 0.6% |
| Caribbean | 103 | 1.2% |
| China | 126 | 1.4% |
| Colombia | 112 | 1.3% |
| Dominican Republic | 103 | 1.2% |
| Eastern Asia | 142 | 1.6% |
| England | 21 | 0.2% |
| Europe | 173 | 1.9% |
| Hong Kong | 104 | 1.2% |
| India | 188 | 2.1% |
| Korea | 16 | 0.2% |
| Latin America | 233 | 2.6% |
| Lebanon | 18 | 0.2% |
| Northern Europe | 46 | 0.5% |
| Philippines | 29 | 0.3% |
| Portugal | 127 | 1.4% |
| South America | 130 | 1.5% |
| South Central Asia | 188 | 2.1% |
| South Eastern Asia | 29 | 0.3% |
| Southern Europe | 127 | 1.4% |
| Western Africa | 16 | 0.2% |
| Western Asia | 18 | 0.2% | View All 26 Rows |
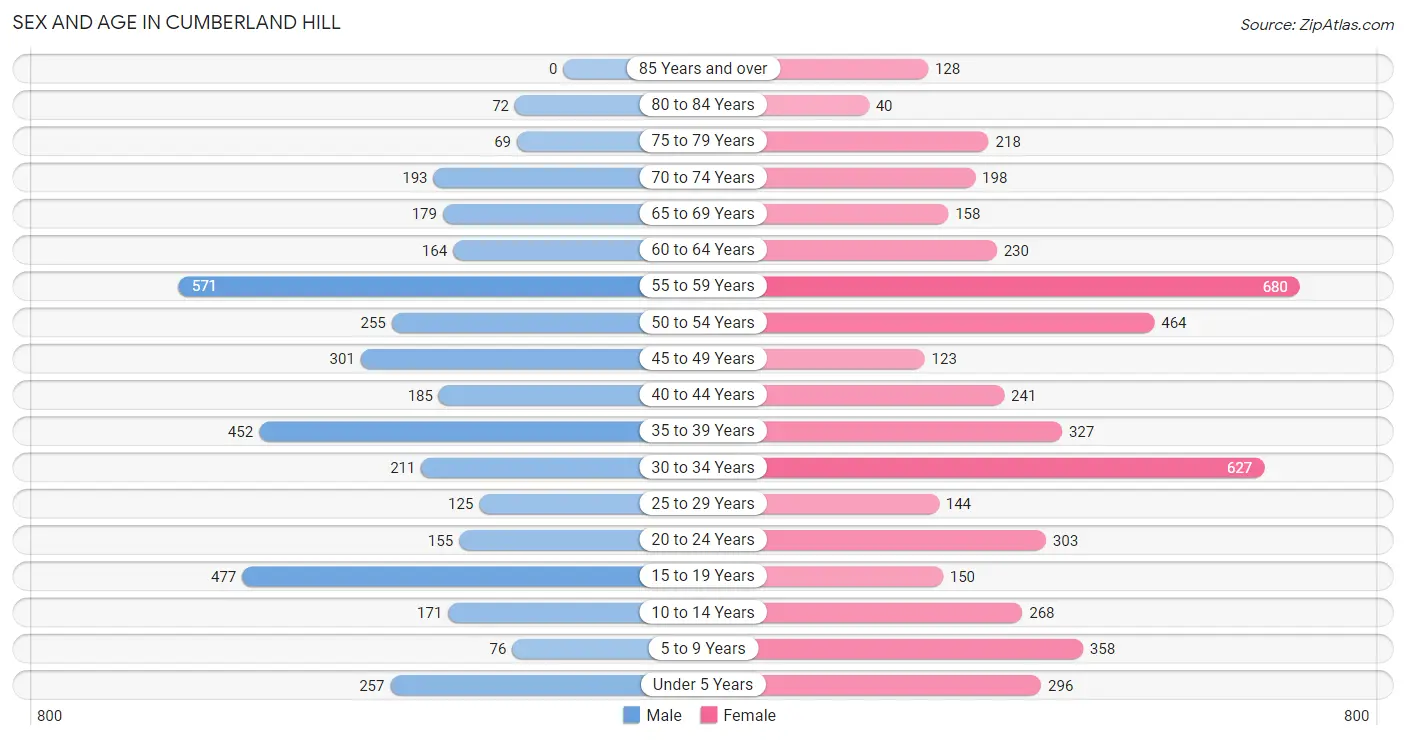
Sex and Age in Cumberland Hill
Sex and Age in Cumberland Hill
The most populous age groups in Cumberland Hill are 55 to 59 Years (571 | 14.6%) for men and 55 to 59 Years (680 | 13.7%) for women.
| Age Bracket | Male | Female |
| Under 5 Years | 257 (6.6%) | 296 (6.0%) |
| 5 to 9 Years | 76 (1.9%) | 358 (7.2%) |
| 10 to 14 Years | 171 (4.4%) | 268 (5.4%) |
| 15 to 19 Years | 477 (12.2%) | 150 (3.0%) |
| 20 to 24 Years | 155 (4.0%) | 303 (6.1%) |
| 25 to 29 Years | 125 (3.2%) | 144 (2.9%) |
| 30 to 34 Years | 211 (5.4%) | 627 (12.7%) |
| 35 to 39 Years | 452 (11.6%) | 327 (6.6%) |
| 40 to 44 Years | 185 (4.7%) | 241 (4.9%) |
| 45 to 49 Years | 301 (7.7%) | 123 (2.5%) |
| 50 to 54 Years | 255 (6.5%) | 464 (9.4%) |
| 55 to 59 Years | 571 (14.6%) | 680 (13.7%) |
| 60 to 64 Years | 164 (4.2%) | 230 (4.6%) |
| 65 to 69 Years | 179 (4.6%) | 158 (3.2%) |
| 70 to 74 Years | 193 (4.9%) | 198 (4.0%) |
| 75 to 79 Years | 69 (1.8%) | 218 (4.4%) |
| 80 to 84 Years | 72 (1.8%) | 40 (0.8%) |
| 85 Years and over | 0 (0.0%) | 128 (2.6%) |
| Total | 3,913 (100.0%) | 4,953 (100.0%) |
Families and Households in Cumberland Hill
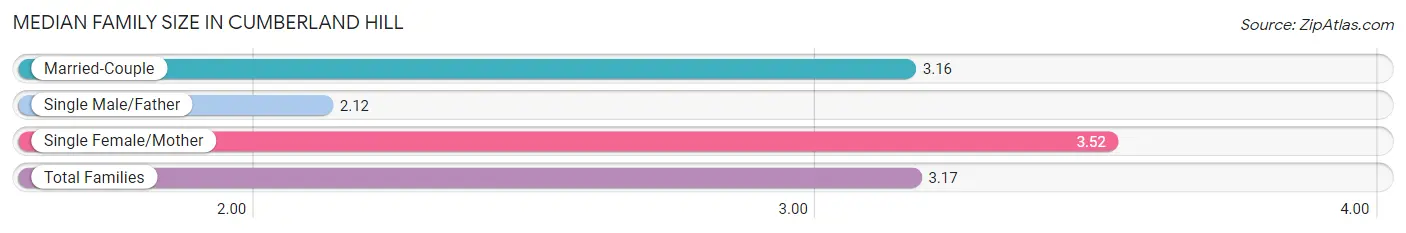
Median Family Size in Cumberland Hill
The median family size in Cumberland Hill is 3.17 persons per family, with single female/mother families (293 | 12.7%) accounting for the largest median family size of 3.52 persons per family. On the other hand, single male/father families (77 | 3.3%) represent the smallest median family size with 2.12 persons per family.
| Family Type | # Families | Family Size |
| Married-Couple | 1,942 (84.0%) | 3.16 |
| Single Male/Father | 77 (3.3%) | 2.12 |
| Single Female/Mother | 293 (12.7%) | 3.52 |
| Total Families | 2,312 (100.0%) | 3.17 |
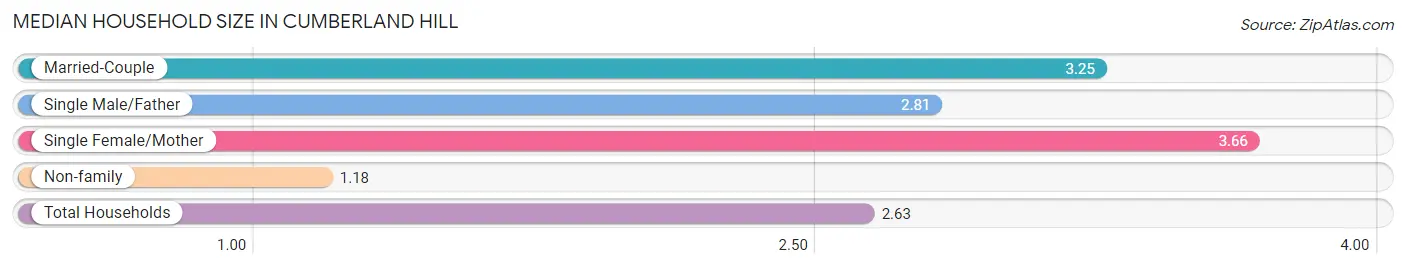
Median Household Size in Cumberland Hill
The median household size in Cumberland Hill is 2.63 persons per household, with single female/mother households (293 | 8.7%) accounting for the largest median household size of 3.66 persons per household. non-family households (1,038 | 31.0%) represent the smallest median household size with 1.18 persons per household.
| Household Type | # Households | Household Size |
| Married-Couple | 1,942 (58.0%) | 3.25 |
| Single Male/Father | 77 (2.3%) | 2.81 |
| Single Female/Mother | 293 (8.7%) | 3.66 |
| Non-family | 1,038 (31.0%) | 1.18 |
| Total Households | 3,350 (100.0%) | 2.63 |
Household Size by Marriage Status in Cumberland Hill
Out of a total of 3,350 households in Cumberland Hill, 2,312 (69.0%) are family households, while 1,038 (31.0%) are nonfamily households. The most numerous type of family households are 2-person households, comprising 807, and the most common type of nonfamily households are 1-person households, comprising 851.
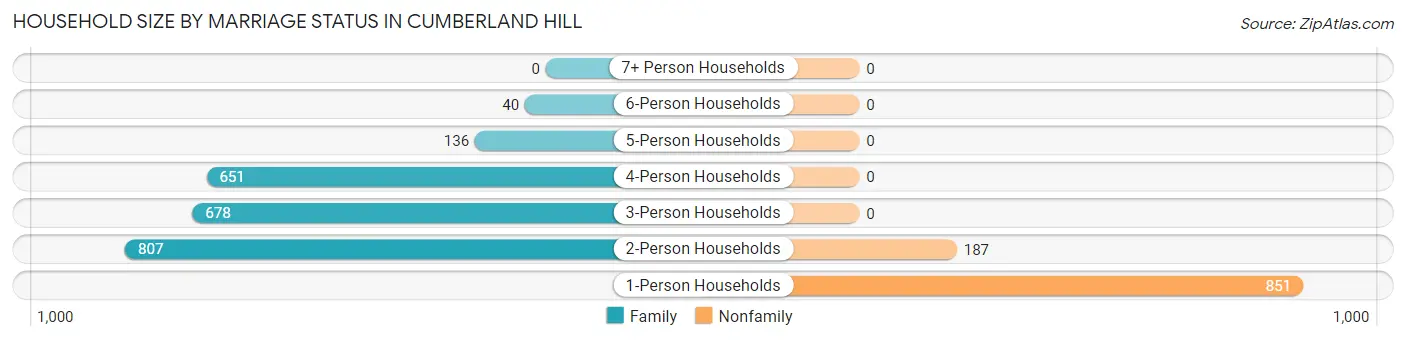
| Household Size | Family Households | Nonfamily Households |
| 1-Person Households | - | 851 (25.4%) |
| 2-Person Households | 807 (24.1%) | 187 (5.6%) |
| 3-Person Households | 678 (20.2%) | 0 (0.0%) |
| 4-Person Households | 651 (19.4%) | 0 (0.0%) |
| 5-Person Households | 136 (4.1%) | 0 (0.0%) |
| 6-Person Households | 40 (1.2%) | 0 (0.0%) |
| 7+ Person Households | 0 (0.0%) | 0 (0.0%) |
| Total | 2,312 (69.0%) | 1,038 (31.0%) |
Female Fertility in Cumberland Hill
Fertility by Age in Cumberland Hill
Average fertility rate in Cumberland Hill is 85.0 births per 1,000 women. Women in the age bracket of 20 to 34 years have the highest fertility rate with 108.0 births per 1,000 women. Women in the age bracket of 20 to 34 years acount for 65.2% of all women with births.
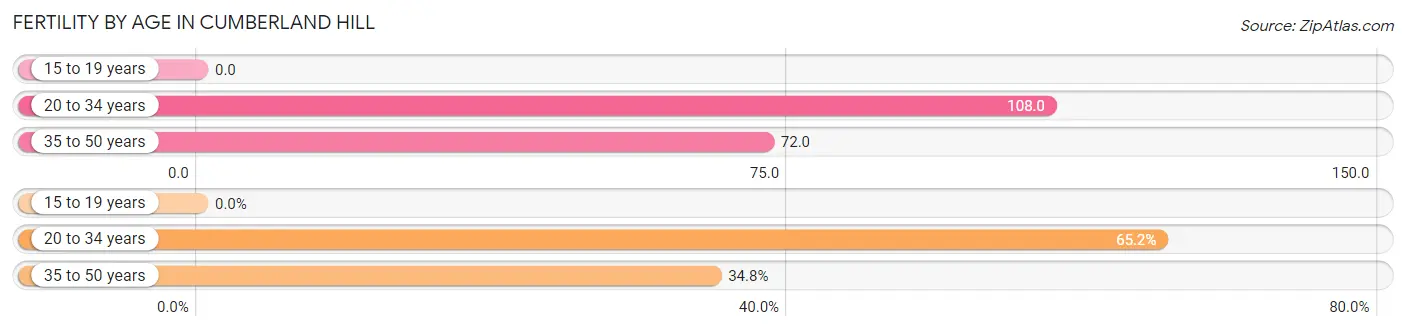
| Age Bracket | Women with Births | Births / 1,000 Women |
| 15 to 19 years | 0 (0.0%) | 0.0 |
| 20 to 34 years | 116 (65.2%) | 108.0 |
| 35 to 50 years | 62 (34.8%) | 72.0 |
| Total | 178 (100.0%) | 85.0 |
Fertility by Age by Marriage Status in Cumberland Hill
55.1% of women with births (178) in Cumberland Hill are married. The highest percentage of unmarried women with births falls into 35 to 50 years age bracket with 83.9% of them unmarried at the time of birth, while the lowest percentage of unmarried women with births belong to 20 to 34 years age bracket with 24.1% of them unmarried.
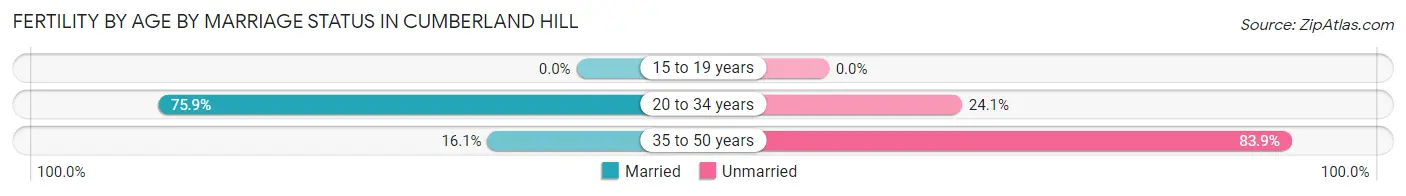
| Age Bracket | Married | Unmarried |
| 15 to 19 years | 0 (0.0%) | 0 (0.0%) |
| 20 to 34 years | 88 (75.9%) | 28 (24.1%) |
| 35 to 50 years | 10 (16.1%) | 52 (83.9%) |
| Total | 98 (55.1%) | 80 (44.9%) |
Fertility by Education in Cumberland Hill
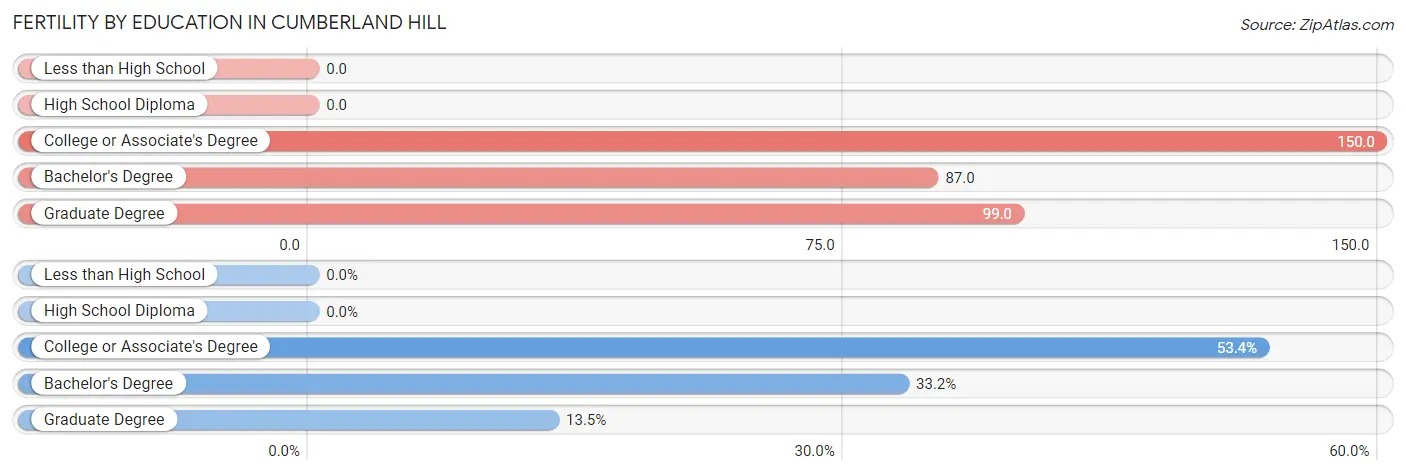
| Educational Attainment | Women with Births | Births / 1,000 Women |
| Less than High School | 0 (0.0%) | 0.0 |
| High School Diploma | 0 (0.0%) | 0.0 |
| College or Associate's Degree | 95 (53.4%) | 150.0 |
| Bachelor's Degree | 59 (33.2%) | 87.0 |
| Graduate Degree | 24 (13.5%) | 99.0 |
| Total | 178 (100.0%) | 85.0 |
Fertility by Education by Marriage Status in Cumberland Hill
44.9% of women with births in Cumberland Hill are unmarried. Women with the educational attainment of bachelor's degree are most likely to be married with 100.0% of them married at childbirth, while women with the educational attainment of college or associate's degree are least likely to be married with 69.5% of them unmarried at childbirth.
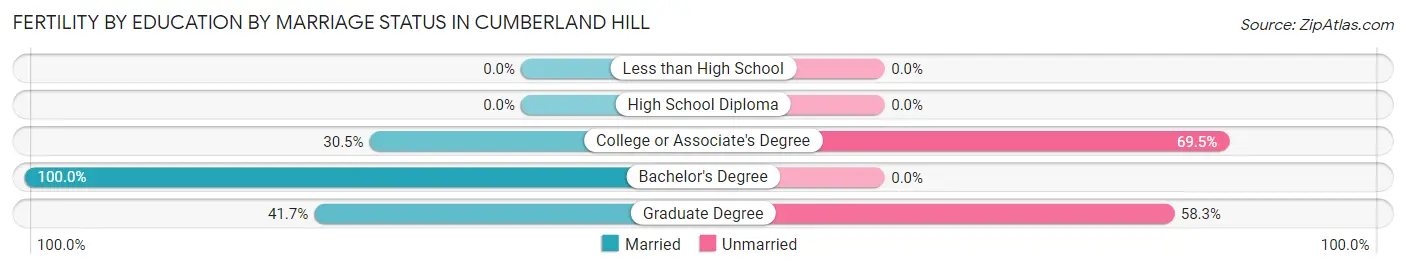
| Educational Attainment | Married | Unmarried |
| Less than High School | 0 (0.0%) | 0 (0.0%) |
| High School Diploma | 0 (0.0%) | 0 (0.0%) |
| College or Associate's Degree | 29 (30.5%) | 66 (69.5%) |
| Bachelor's Degree | 59 (100.0%) | 0 (0.0%) |
| Graduate Degree | 10 (41.7%) | 14 (58.3%) |
| Total | 98 (55.1%) | 80 (44.9%) |
Employment Characteristics in Cumberland Hill
Employment by Class of Employer in Cumberland Hill
Among the 5,185 employed individuals in Cumberland Hill, private company employees (3,750 | 72.3%), local government employees (604 | 11.7%), and not-for-profit organizations (477 | 9.2%) make up the most common classes of employment.
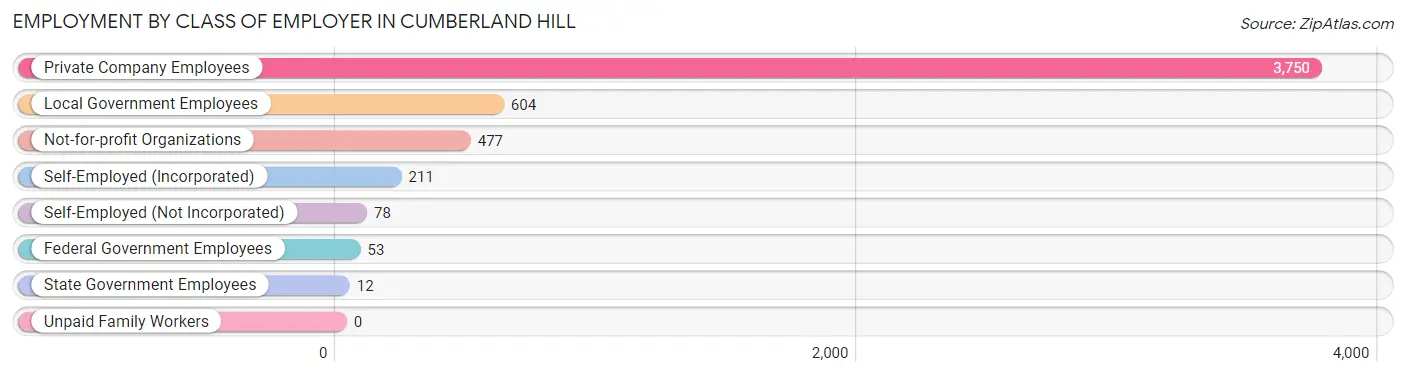
| Employer Class | # Employees | % Employees |
| Private Company Employees | 3,750 | 72.3% |
| Self-Employed (Incorporated) | 211 | 4.1% |
| Self-Employed (Not Incorporated) | 78 | 1.5% |
| Not-for-profit Organizations | 477 | 9.2% |
| Local Government Employees | 604 | 11.7% |
| State Government Employees | 12 | 0.2% |
| Federal Government Employees | 53 | 1.0% |
| Unpaid Family Workers | 0 | 0.0% |
| Total | 5,185 | 100.0% |
Employment Status by Age in Cumberland Hill
According to the labor force statistics for Cumberland Hill, out of the total population over 16 years of age (7,349), 72.7% or 5,343 individuals are in the labor force, with 2.5% or 134 of them unemployed. The age group with the highest labor force participation rate is 20 to 24 years, with 97.8% or 448 individuals in the labor force. Within the labor force, the 65 to 74 years age range has the highest percentage of unemployed individuals, with 10.6% or 31 of them being unemployed.
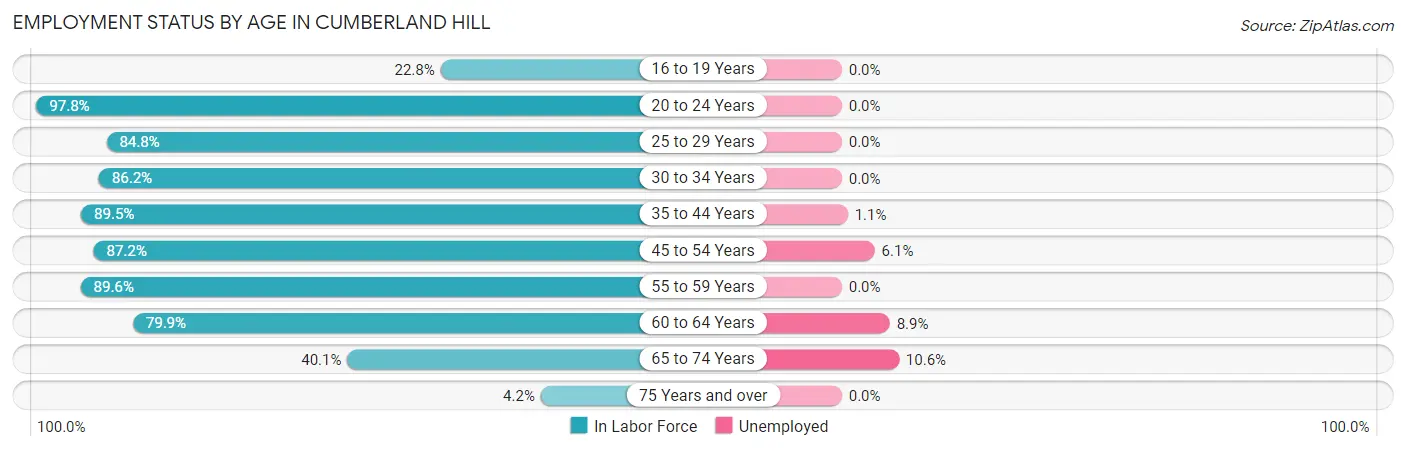
| Age Bracket | In Labor Force | Unemployed |
| 16 to 19 Years | 122 (22.8%) | 0 (0.0%) |
| 20 to 24 Years | 448 (97.8%) | 0 (0.0%) |
| 25 to 29 Years | 228 (84.8%) | 0 (0.0%) |
| 30 to 34 Years | 722 (86.2%) | 0 (0.0%) |
| 35 to 44 Years | 1,078 (89.5%) | 12 (1.1%) |
| 45 to 54 Years | 997 (87.2%) | 61 (6.1%) |
| 55 to 59 Years | 1,121 (89.6%) | 0 (0.0%) |
| 60 to 64 Years | 315 (79.9%) | 28 (8.9%) |
| 65 to 74 Years | 292 (40.1%) | 31 (10.6%) |
| 75 Years and over | 22 (4.2%) | 0 (0.0%) |
| Total | 5,343 (72.7%) | 134 (2.5%) |
Employment Status by Educational Attainment in Cumberland Hill
According to labor force statistics for Cumberland Hill, 87.5% of individuals (4,462) out of the total population between 25 and 64 years of age (5,100) are in the labor force, with 2.3% or 103 of them being unemployed. The group with the highest labor force participation rate are those with the educational attainment of bachelor's degree or higher, with 94.1% or 2,246 individuals in the labor force. Within the labor force, individuals with less than high school education have the highest percentage of unemployment, with 37.7% or 52 of them being unemployed.
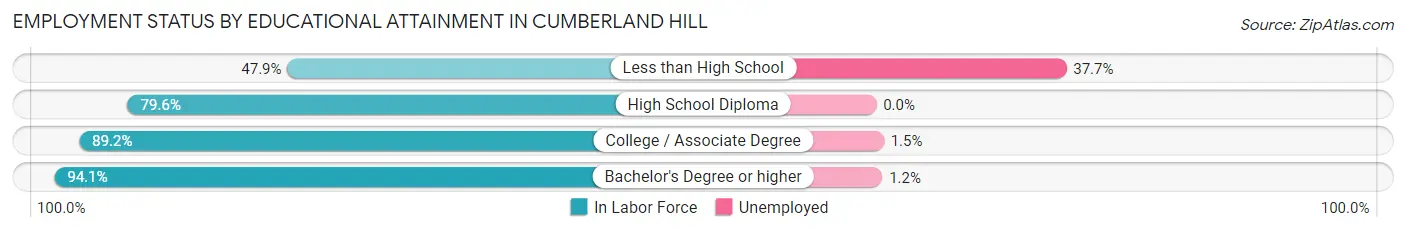
| Educational Attainment | In Labor Force | Unemployed |
| Less than High School | 138 (47.9%) | 109 (37.7%) |
| High School Diploma | 716 (79.6%) | 0 (0.0%) |
| College / Associate Degree | 1,361 (89.2%) | 23 (1.5%) |
| Bachelor's Degree or higher | 2,246 (94.1%) | 29 (1.2%) |
| Total | 4,462 (87.5%) | 117 (2.3%) |
Employment Occupations by Sex in Cumberland Hill
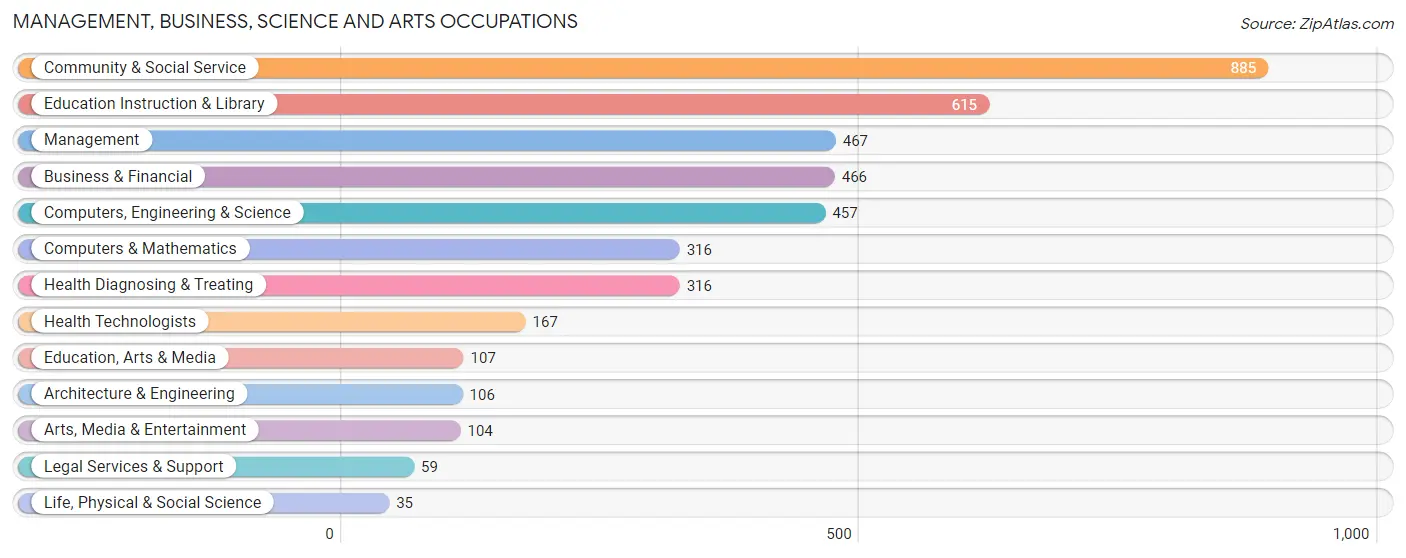
Management, Business, Science and Arts Occupations
The most common Management, Business, Science and Arts occupations in Cumberland Hill are Community & Social Service (885 | 17.0%), Education Instruction & Library (615 | 11.8%), Management (467 | 9.0%), Business & Financial (466 | 8.9%), and Computers, Engineering & Science (457 | 8.8%).
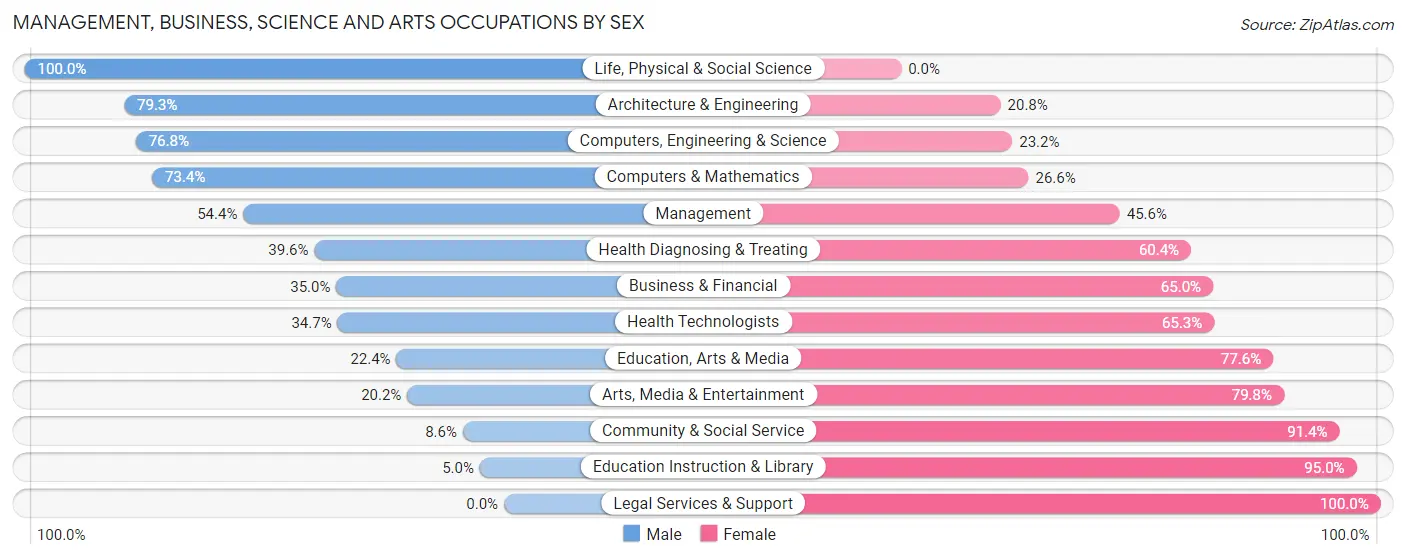
Management, Business, Science and Arts Occupations by Sex
Within the Management, Business, Science and Arts occupations in Cumberland Hill, the most male-oriented occupations are Life, Physical & Social Science (100.0%), Architecture & Engineering (79.2%), and Computers, Engineering & Science (76.8%), while the most female-oriented occupations are Legal Services & Support (100.0%), Education Instruction & Library (95.0%), and Community & Social Service (91.4%).
| Occupation | Male | Female |
| Management | 254 (54.4%) | 213 (45.6%) |
| Business & Financial | 163 (35.0%) | 303 (65.0%) |
| Computers, Engineering & Science | 351 (76.8%) | 106 (23.2%) |
| Computers & Mathematics | 232 (73.4%) | 84 (26.6%) |
| Architecture & Engineering | 84 (79.2%) | 22 (20.7%) |
| Life, Physical & Social Science | 35 (100.0%) | 0 (0.0%) |
| Community & Social Service | 76 (8.6%) | 809 (91.4%) |
| Education, Arts & Media | 24 (22.4%) | 83 (77.6%) |
| Legal Services & Support | 0 (0.0%) | 59 (100.0%) |
| Education Instruction & Library | 31 (5.0%) | 584 (95.0%) |
| Arts, Media & Entertainment | 21 (20.2%) | 83 (79.8%) |
| Health Diagnosing & Treating | 125 (39.6%) | 191 (60.4%) |
| Health Technologists | 58 (34.7%) | 109 (65.3%) |
| Total (Category) | 969 (37.4%) | 1,622 (62.6%) |
| Total (Overall) | 2,377 (45.6%) | 2,837 (54.4%) |
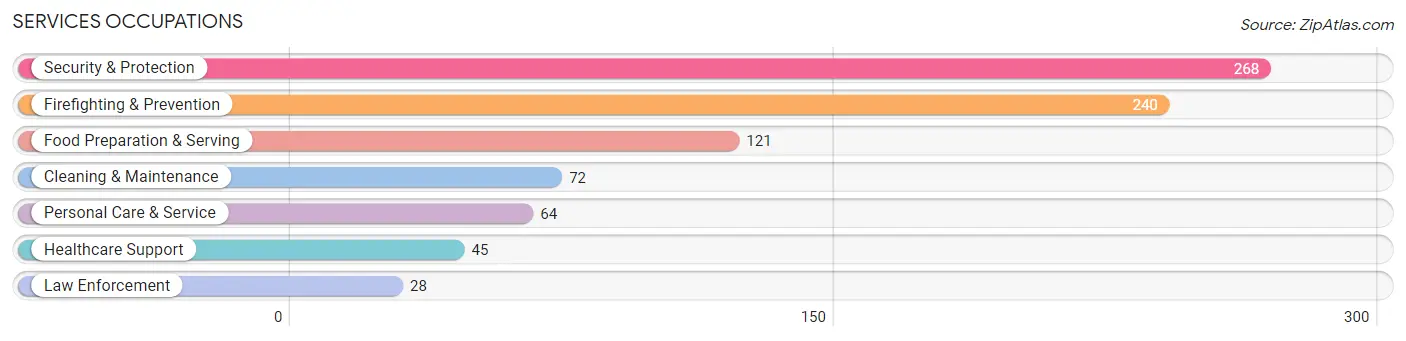
Services Occupations
The most common Services occupations in Cumberland Hill are Security & Protection (268 | 5.1%), Firefighting & Prevention (240 | 4.6%), Food Preparation & Serving (121 | 2.3%), Cleaning & Maintenance (72 | 1.4%), and Personal Care & Service (64 | 1.2%).
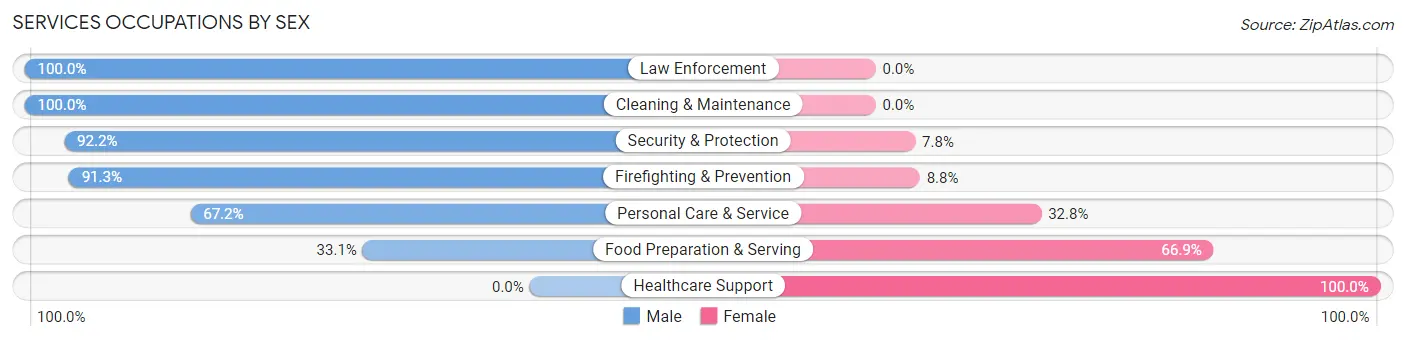
Services Occupations by Sex
Within the Services occupations in Cumberland Hill, the most male-oriented occupations are Law Enforcement (100.0%), Cleaning & Maintenance (100.0%), and Security & Protection (92.2%), while the most female-oriented occupations are Healthcare Support (100.0%), Food Preparation & Serving (66.9%), and Personal Care & Service (32.8%).
| Occupation | Male | Female |
| Healthcare Support | 0 (0.0%) | 45 (100.0%) |
| Security & Protection | 247 (92.2%) | 21 (7.8%) |
| Firefighting & Prevention | 219 (91.2%) | 21 (8.7%) |
| Law Enforcement | 28 (100.0%) | 0 (0.0%) |
| Food Preparation & Serving | 40 (33.1%) | 81 (66.9%) |
| Cleaning & Maintenance | 72 (100.0%) | 0 (0.0%) |
| Personal Care & Service | 43 (67.2%) | 21 (32.8%) |
| Total (Category) | 402 (70.5%) | 168 (29.5%) |
| Total (Overall) | 2,377 (45.6%) | 2,837 (54.4%) |
Sales and Office Occupations
The most common Sales and Office occupations in Cumberland Hill are Office & Administration (819 | 15.7%), and Sales & Related (533 | 10.2%).
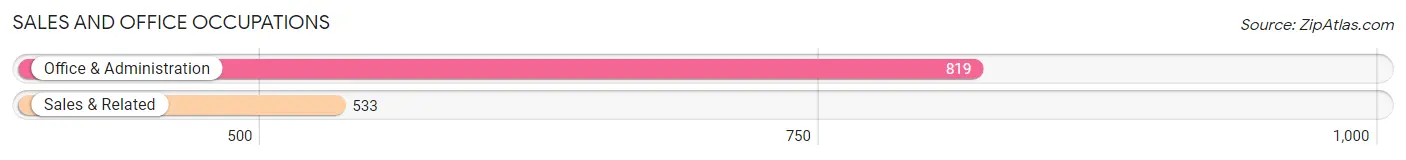
Sales and Office Occupations by Sex

| Occupation | Male | Female |
| Sales & Related | 271 (50.8%) | 262 (49.2%) |
| Office & Administration | 51 (6.2%) | 768 (93.8%) |
| Total (Category) | 322 (23.8%) | 1,030 (76.2%) |
| Total (Overall) | 2,377 (45.6%) | 2,837 (54.4%) |
Natural Resources, Construction and Maintenance Occupations
The most common Natural Resources, Construction and Maintenance occupations in Cumberland Hill are Construction & Extraction (168 | 3.2%), and Installation, Maintenance & Repair (56 | 1.1%).
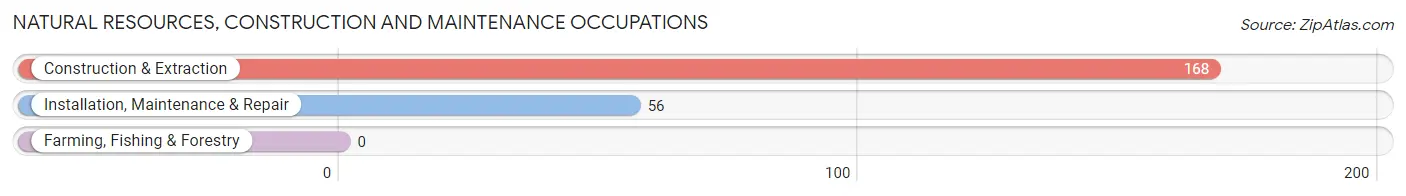
Natural Resources, Construction and Maintenance Occupations by Sex
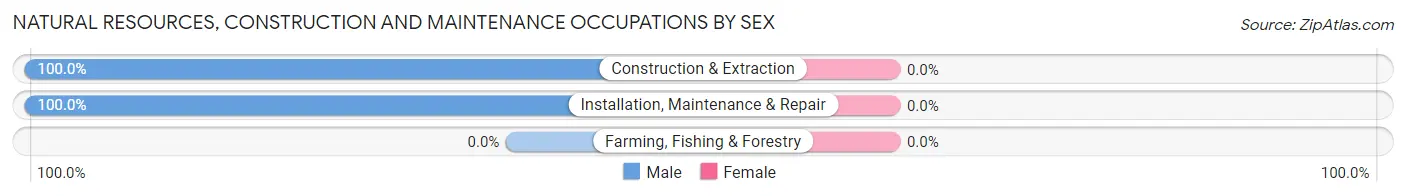
| Occupation | Male | Female |
| Farming, Fishing & Forestry | 0 (0.0%) | 0 (0.0%) |
| Construction & Extraction | 168 (100.0%) | 0 (0.0%) |
| Installation, Maintenance & Repair | 56 (100.0%) | 0 (0.0%) |
| Total (Category) | 224 (100.0%) | 0 (0.0%) |
| Total (Overall) | 2,377 (45.6%) | 2,837 (54.4%) |
Production, Transportation and Moving Occupations
The most common Production, Transportation and Moving occupations in Cumberland Hill are Production (245 | 4.7%), Transportation (150 | 2.9%), and Material Moving (82 | 1.6%).
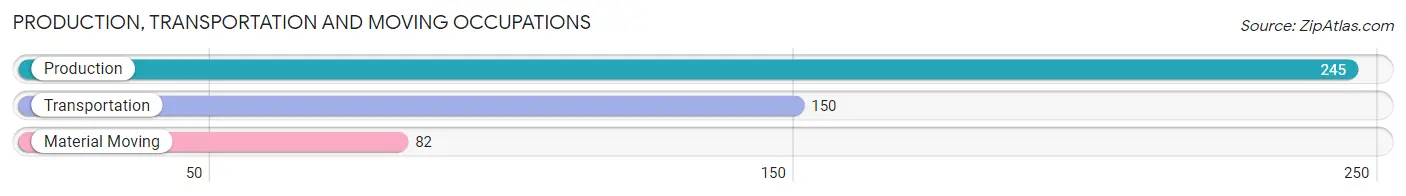
Production, Transportation and Moving Occupations by Sex
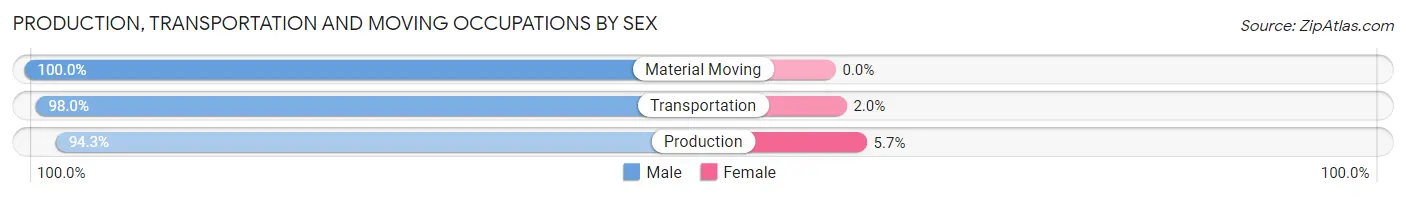
| Occupation | Male | Female |
| Production | 231 (94.3%) | 14 (5.7%) |
| Transportation | 147 (98.0%) | 3 (2.0%) |
| Material Moving | 82 (100.0%) | 0 (0.0%) |
| Total (Category) | 460 (96.4%) | 17 (3.6%) |
| Total (Overall) | 2,377 (45.6%) | 2,837 (54.4%) |
Employment Industries by Sex in Cumberland Hill
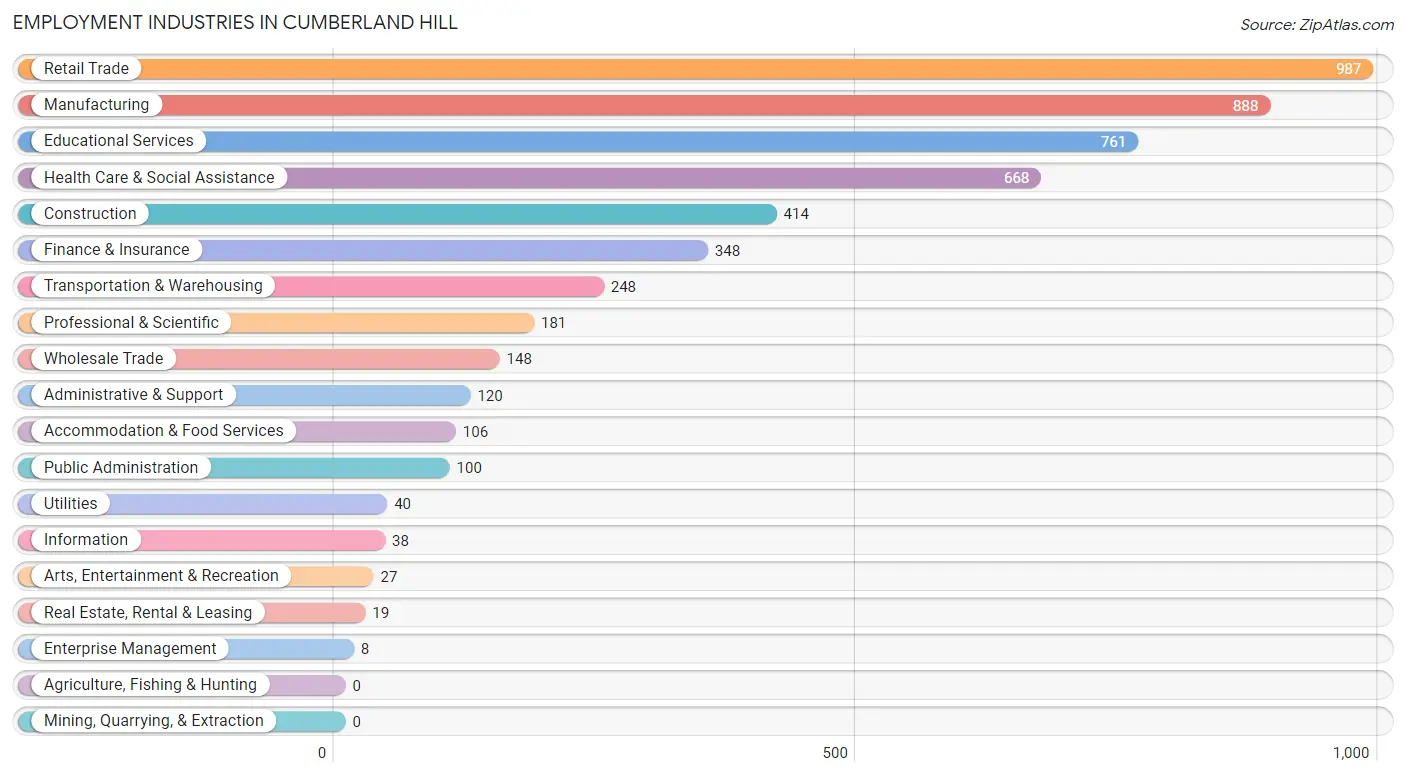
Employment Industries in Cumberland Hill
The major employment industries in Cumberland Hill include Retail Trade (987 | 18.9%), Manufacturing (888 | 17.0%), Educational Services (761 | 14.6%), Health Care & Social Assistance (668 | 12.8%), and Construction (414 | 7.9%).
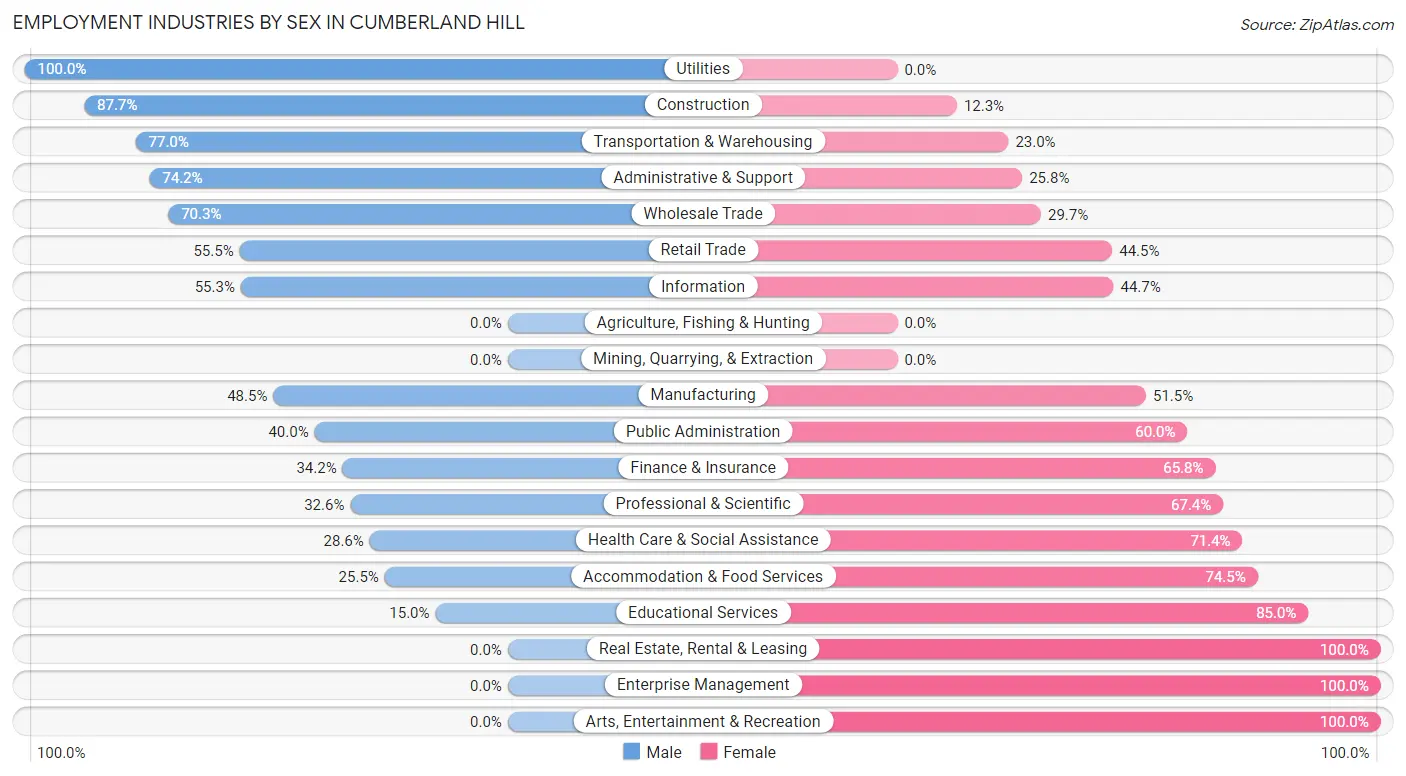
Employment Industries by Sex in Cumberland Hill
The Cumberland Hill industries that see more men than women are Utilities (100.0%), Construction (87.7%), and Transportation & Warehousing (77.0%), whereas the industries that tend to have a higher number of women are Real Estate, Rental & Leasing (100.0%), Enterprise Management (100.0%), and Arts, Entertainment & Recreation (100.0%).
| Industry | Male | Female |
| Agriculture, Fishing & Hunting | 0 (0.0%) | 0 (0.0%) |
| Mining, Quarrying, & Extraction | 0 (0.0%) | 0 (0.0%) |
| Construction | 363 (87.7%) | 51 (12.3%) |
| Manufacturing | 431 (48.5%) | 457 (51.5%) |
| Wholesale Trade | 104 (70.3%) | 44 (29.7%) |
| Retail Trade | 548 (55.5%) | 439 (44.5%) |
| Transportation & Warehousing | 191 (77.0%) | 57 (23.0%) |
| Utilities | 40 (100.0%) | 0 (0.0%) |
| Information | 21 (55.3%) | 17 (44.7%) |
| Finance & Insurance | 119 (34.2%) | 229 (65.8%) |
| Real Estate, Rental & Leasing | 0 (0.0%) | 19 (100.0%) |
| Professional & Scientific | 59 (32.6%) | 122 (67.4%) |
| Enterprise Management | 0 (0.0%) | 8 (100.0%) |
| Administrative & Support | 89 (74.2%) | 31 (25.8%) |
| Educational Services | 114 (15.0%) | 647 (85.0%) |
| Health Care & Social Assistance | 191 (28.6%) | 477 (71.4%) |
| Arts, Entertainment & Recreation | 0 (0.0%) | 27 (100.0%) |
| Accommodation & Food Services | 27 (25.5%) | 79 (74.5%) |
| Public Administration | 40 (40.0%) | 60 (60.0%) |
| Total | 2,377 (45.6%) | 2,837 (54.4%) |
Education in Cumberland Hill
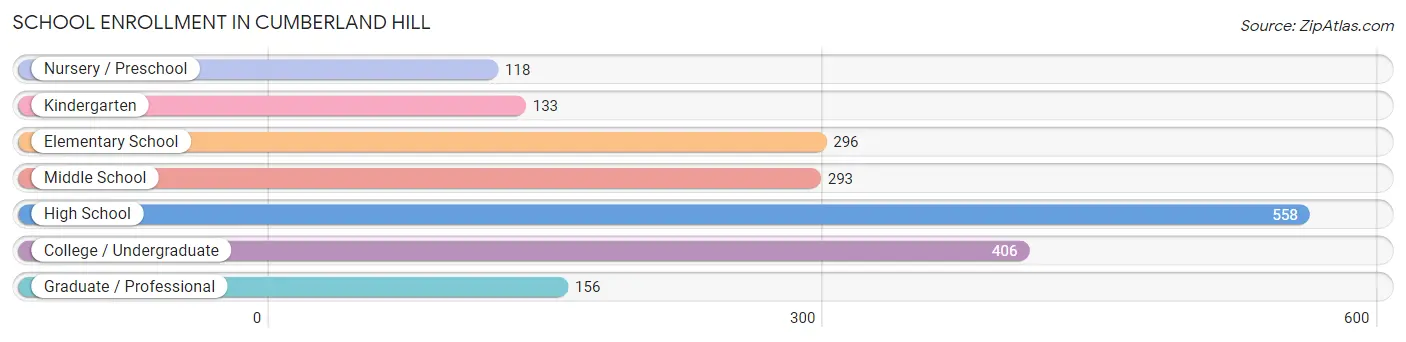
School Enrollment in Cumberland Hill
The most common levels of schooling among the 1,960 students in Cumberland Hill are high school (558 | 28.5%), college / undergraduate (406 | 20.7%), and elementary school (296 | 15.1%).
| School Level | # Students | % Students |
| Nursery / Preschool | 118 | 6.0% |
| Kindergarten | 133 | 6.8% |
| Elementary School | 296 | 15.1% |
| Middle School | 293 | 14.9% |
| High School | 558 | 28.5% |
| College / Undergraduate | 406 | 20.7% |
| Graduate / Professional | 156 | 8.0% |
| Total | 1,960 | 100.0% |
School Enrollment by Age by Funding Source in Cumberland Hill
Out of a total of 1,960 students who are enrolled in schools in Cumberland Hill, 368 (18.8%) attend a private institution, while the remaining 1,592 (81.2%) are enrolled in public schools. The age group of 3 to 4 year olds has the highest likelihood of being enrolled in private schools, with 63 (71.6% in the age bracket) enrolled. Conversely, the age group of 10 to 14 year olds has the lowest likelihood of being enrolled in a private school, with 387 (97.2% in the age bracket) attending a public institution.
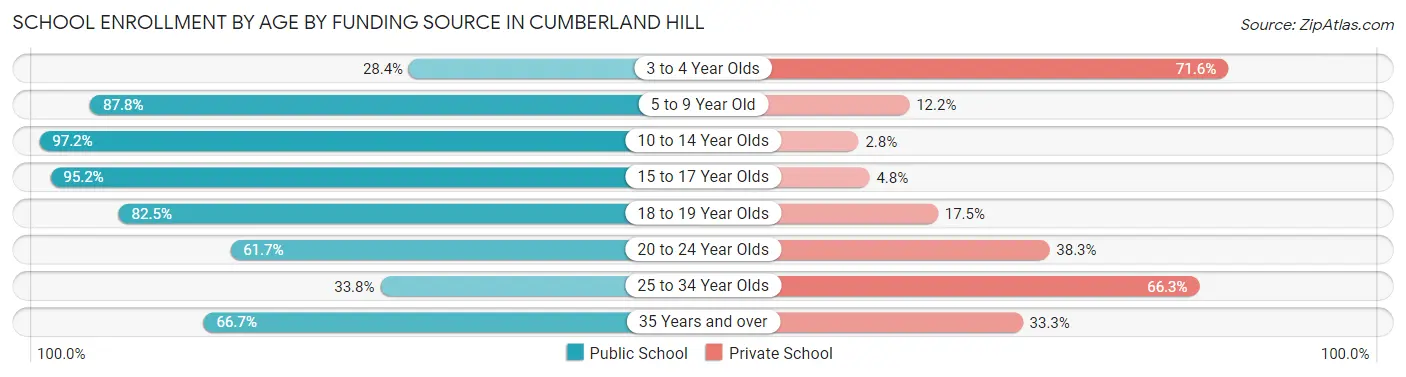
| Age Bracket | Public School | Private School |
| 3 to 4 Year Olds | 25 (28.4%) | 63 (71.6%) |
| 5 to 9 Year Old | 381 (87.8%) | 53 (12.2%) |
| 10 to 14 Year Olds | 387 (97.2%) | 11 (2.8%) |
| 15 to 17 Year Olds | 435 (95.2%) | 22 (4.8%) |
| 18 to 19 Year Olds | 80 (82.5%) | 17 (17.5%) |
| 20 to 24 Year Olds | 182 (61.7%) | 113 (38.3%) |
| 25 to 34 Year Olds | 27 (33.8%) | 53 (66.2%) |
| 35 Years and over | 74 (66.7%) | 37 (33.3%) |
| Total | 1,592 (81.2%) | 368 (18.8%) |
Educational Attainment by Field of Study in Cumberland Hill
Business (684 | 22.4%), engineering (547 | 17.9%), psychology (414 | 13.6%), arts & humanities (254 | 8.3%), and science & technology (218 | 7.1%) are the most common fields of study among 3,051 individuals in Cumberland Hill who have obtained a bachelor's degree or higher.
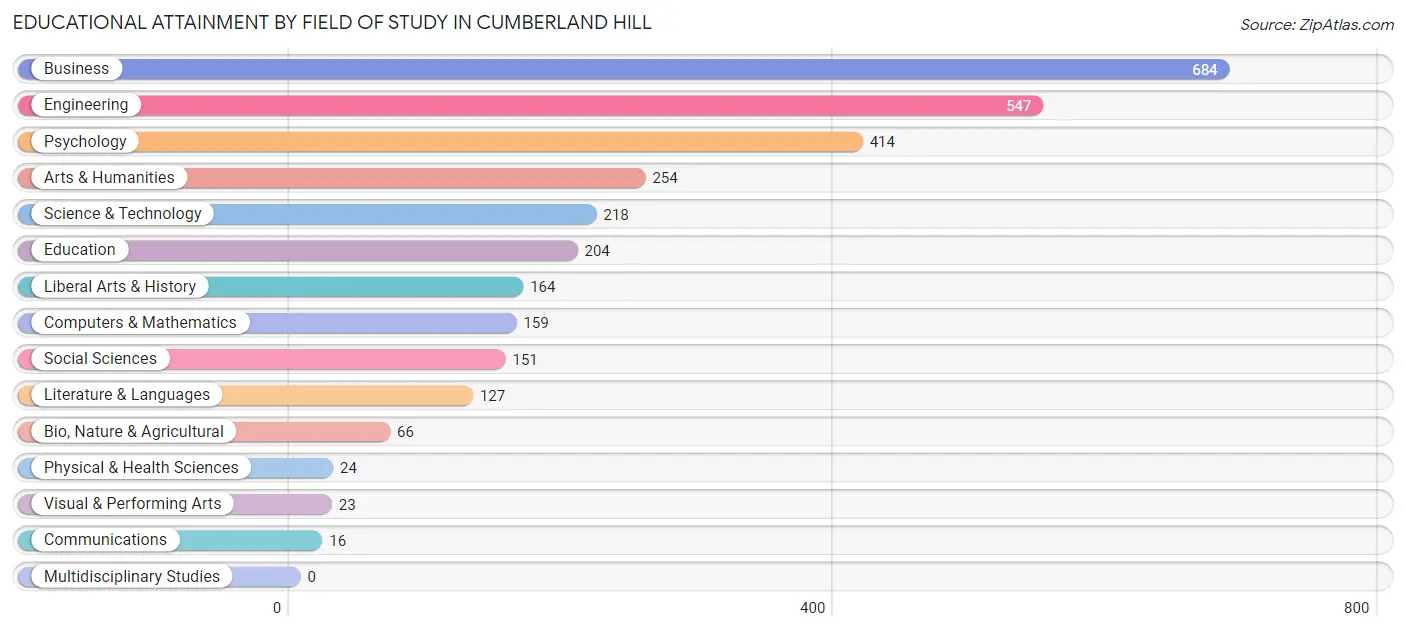
| Field of Study | # Graduates | % Graduates |
| Computers & Mathematics | 159 | 5.2% |
| Bio, Nature & Agricultural | 66 | 2.2% |
| Physical & Health Sciences | 24 | 0.8% |
| Psychology | 414 | 13.6% |
| Social Sciences | 151 | 5.0% |
| Engineering | 547 | 17.9% |
| Multidisciplinary Studies | 0 | 0.0% |
| Science & Technology | 218 | 7.1% |
| Business | 684 | 22.4% |
| Education | 204 | 6.7% |
| Literature & Languages | 127 | 4.2% |
| Liberal Arts & History | 164 | 5.4% |
| Visual & Performing Arts | 23 | 0.7% |
| Communications | 16 | 0.5% |
| Arts & Humanities | 254 | 8.3% |
| Total | 3,051 | 100.0% |
Transportation & Commute in Cumberland Hill
Vehicle Availability by Sex in Cumberland Hill
The most prevalent vehicle ownership categories in Cumberland Hill are males with 2 vehicles (1,058, accounting for 44.8%) and females with 2 vehicles (928, making up 37.5%).
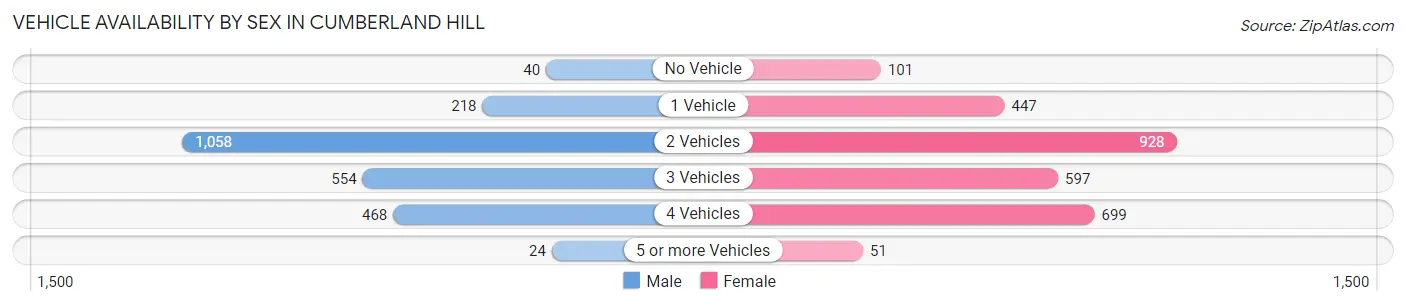
| Vehicles Available | Male | Female |
| No Vehicle | 40 (1.7%) | 101 (3.6%) |
| 1 Vehicle | 218 (9.2%) | 447 (15.8%) |
| 2 Vehicles | 1,058 (44.8%) | 928 (32.9%) |
| 3 Vehicles | 554 (23.4%) | 597 (21.1%) |
| 4 Vehicles | 468 (19.8%) | 699 (24.8%) |
| 5 or more Vehicles | 24 (1.0%) | 51 (1.8%) |
| Total | 2,362 (100.0%) | 2,823 (100.0%) |
Commute Time in Cumberland Hill
The most frequently occuring commute durations in Cumberland Hill are 20 to 24 minutes (1,173 commuters, 24.1%), 10 to 14 minutes (1,106 commuters, 22.8%), and 30 to 34 minutes (638 commuters, 13.1%).
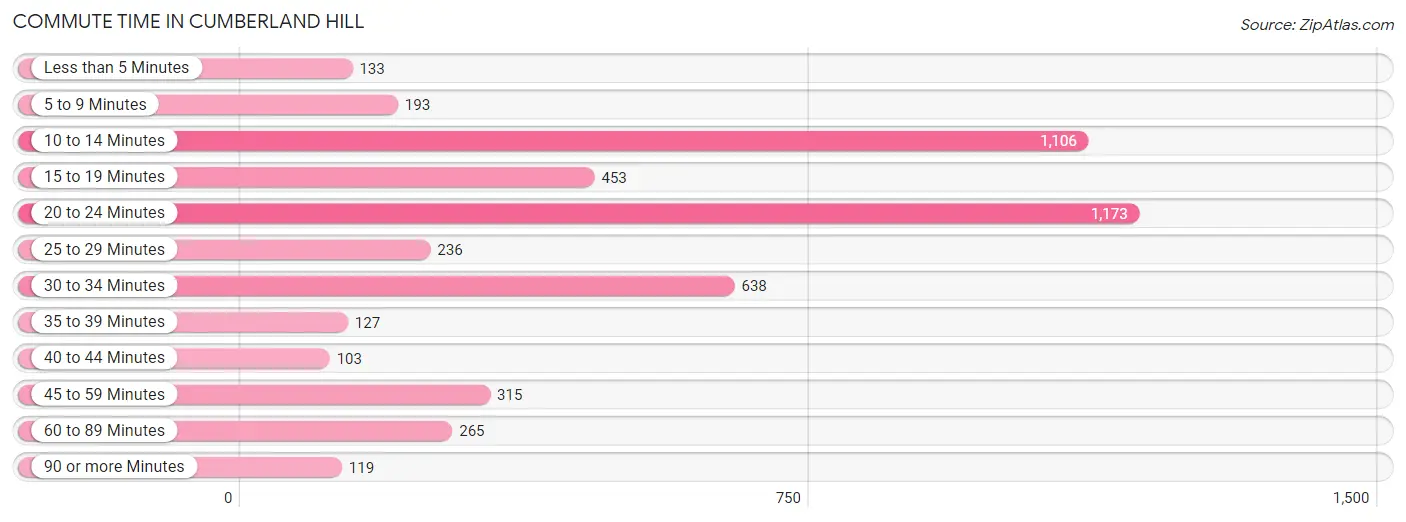
| Commute Time | # Commuters | % Commuters |
| Less than 5 Minutes | 133 | 2.7% |
| 5 to 9 Minutes | 193 | 4.0% |
| 10 to 14 Minutes | 1,106 | 22.8% |
| 15 to 19 Minutes | 453 | 9.3% |
| 20 to 24 Minutes | 1,173 | 24.1% |
| 25 to 29 Minutes | 236 | 4.9% |
| 30 to 34 Minutes | 638 | 13.1% |
| 35 to 39 Minutes | 127 | 2.6% |
| 40 to 44 Minutes | 103 | 2.1% |
| 45 to 59 Minutes | 315 | 6.5% |
| 60 to 89 Minutes | 265 | 5.4% |
| 90 or more Minutes | 119 | 2.5% |
Commute Time by Sex in Cumberland Hill
The most common commute times in Cumberland Hill are 20 to 24 minutes (395 commuters, 17.9%) for males and 20 to 24 minutes (778 commuters, 29.3%) for females.
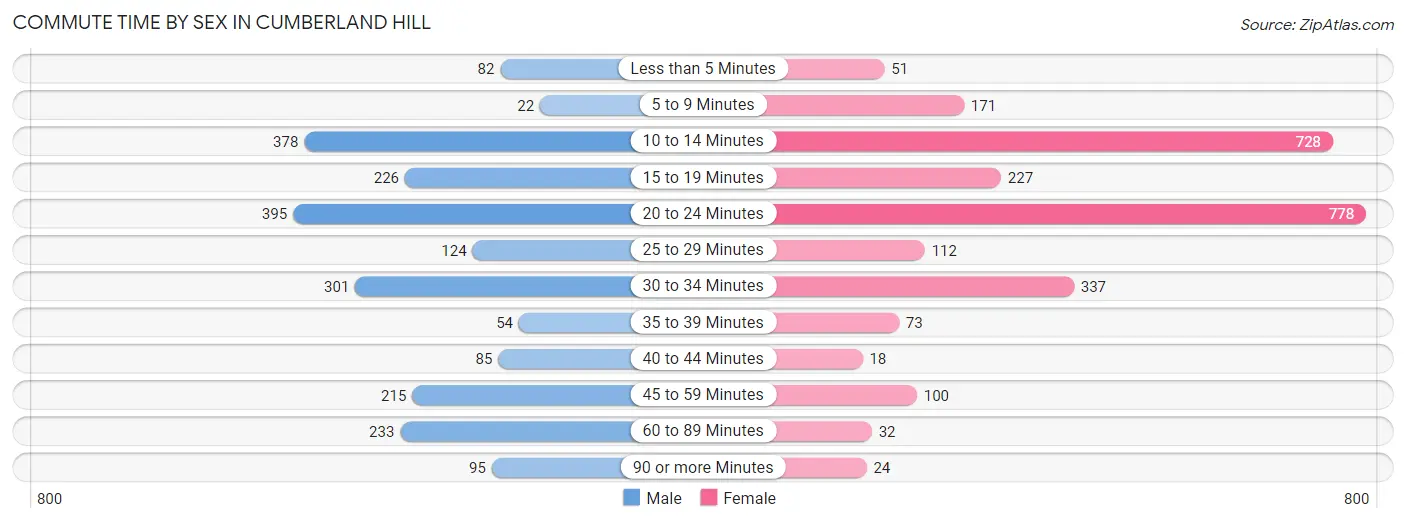
| Commute Time | Male | Female |
| Less than 5 Minutes | 82 (3.7%) | 51 (1.9%) |
| 5 to 9 Minutes | 22 (1.0%) | 171 (6.5%) |
| 10 to 14 Minutes | 378 (17.1%) | 728 (27.5%) |
| 15 to 19 Minutes | 226 (10.2%) | 227 (8.6%) |
| 20 to 24 Minutes | 395 (17.9%) | 778 (29.3%) |
| 25 to 29 Minutes | 124 (5.6%) | 112 (4.2%) |
| 30 to 34 Minutes | 301 (13.6%) | 337 (12.7%) |
| 35 to 39 Minutes | 54 (2.4%) | 73 (2.8%) |
| 40 to 44 Minutes | 85 (3.8%) | 18 (0.7%) |
| 45 to 59 Minutes | 215 (9.7%) | 100 (3.8%) |
| 60 to 89 Minutes | 233 (10.5%) | 32 (1.2%) |
| 90 or more Minutes | 95 (4.3%) | 24 (0.9%) |
Time of Departure to Work by Sex in Cumberland Hill
The most frequent times of departure to work in Cumberland Hill are 8:30 AM to 8:59 AM (298, 13.5%) for males and 8:00 AM to 8:29 AM (691, 26.1%) for females.
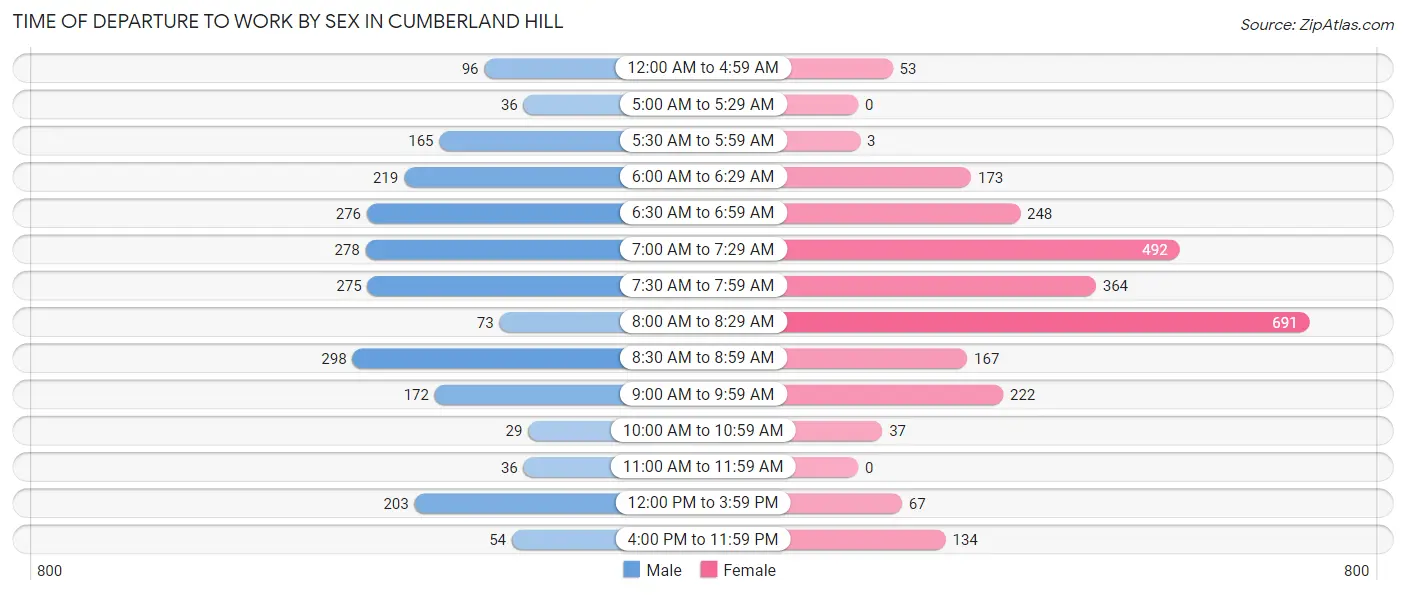
| Time of Departure | Male | Female |
| 12:00 AM to 4:59 AM | 96 (4.3%) | 53 (2.0%) |
| 5:00 AM to 5:29 AM | 36 (1.6%) | 0 (0.0%) |
| 5:30 AM to 5:59 AM | 165 (7.5%) | 3 (0.1%) |
| 6:00 AM to 6:29 AM | 219 (9.9%) | 173 (6.5%) |
| 6:30 AM to 6:59 AM | 276 (12.5%) | 248 (9.3%) |
| 7:00 AM to 7:29 AM | 278 (12.6%) | 492 (18.6%) |
| 7:30 AM to 7:59 AM | 275 (12.4%) | 364 (13.7%) |
| 8:00 AM to 8:29 AM | 73 (3.3%) | 691 (26.1%) |
| 8:30 AM to 8:59 AM | 298 (13.5%) | 167 (6.3%) |
| 9:00 AM to 9:59 AM | 172 (7.8%) | 222 (8.4%) |
| 10:00 AM to 10:59 AM | 29 (1.3%) | 37 (1.4%) |
| 11:00 AM to 11:59 AM | 36 (1.6%) | 0 (0.0%) |
| 12:00 PM to 3:59 PM | 203 (9.2%) | 67 (2.5%) |
| 4:00 PM to 11:59 PM | 54 (2.4%) | 134 (5.1%) |
| Total | 2,210 (100.0%) | 2,651 (100.0%) |
Housing Occupancy in Cumberland Hill
Occupancy by Ownership in Cumberland Hill
Of the total 3,350 dwellings in Cumberland Hill, owner-occupied units account for 2,873 (85.8%), while renter-occupied units make up 477 (14.2%).
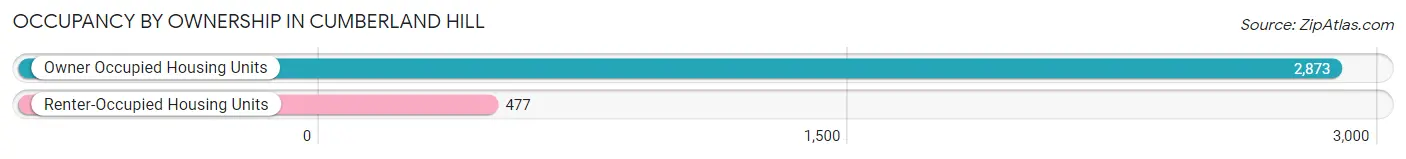
| Occupancy | # Housing Units | % Housing Units |
| Owner Occupied Housing Units | 2,873 | 85.8% |
| Renter-Occupied Housing Units | 477 | 14.2% |
| Total Occupied Housing Units | 3,350 | 100.0% |
Occupancy by Household Size in Cumberland Hill
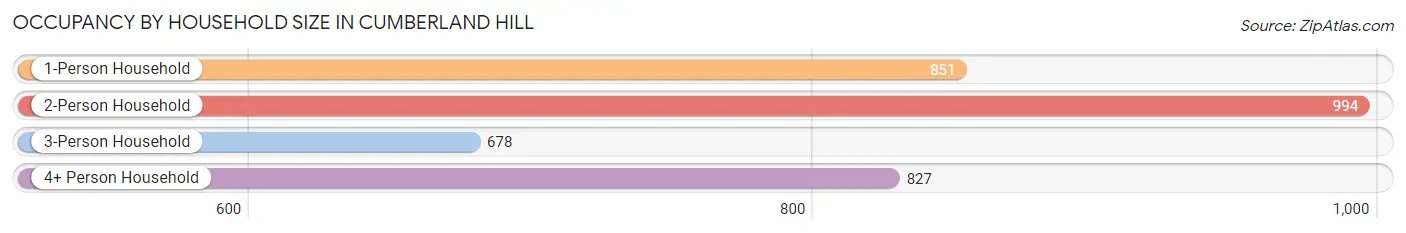
| Household Size | # Housing Units | % Housing Units |
| 1-Person Household | 851 | 25.4% |
| 2-Person Household | 994 | 29.7% |
| 3-Person Household | 678 | 20.2% |
| 4+ Person Household | 827 | 24.7% |
| Total Housing Units | 3,350 | 100.0% |
Occupancy by Ownership by Household Size in Cumberland Hill
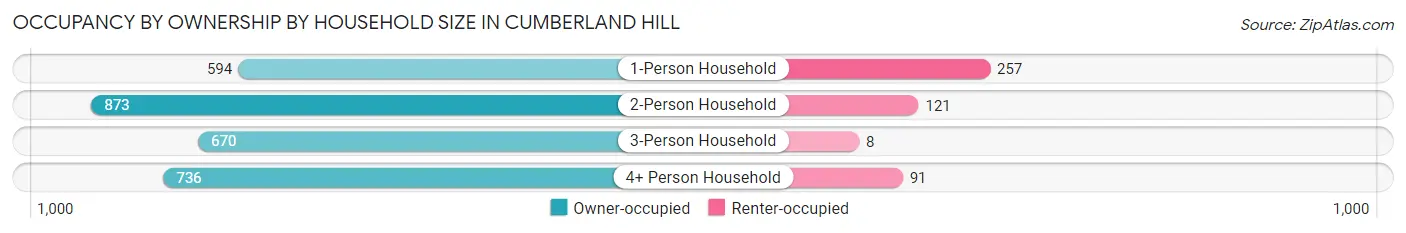
| Household Size | Owner-occupied | Renter-occupied |
| 1-Person Household | 594 (69.8%) | 257 (30.2%) |
| 2-Person Household | 873 (87.8%) | 121 (12.2%) |
| 3-Person Household | 670 (98.8%) | 8 (1.2%) |
| 4+ Person Household | 736 (89.0%) | 91 (11.0%) |
| Total Housing Units | 2,873 (85.8%) | 477 (14.2%) |
Occupancy by Educational Attainment in Cumberland Hill
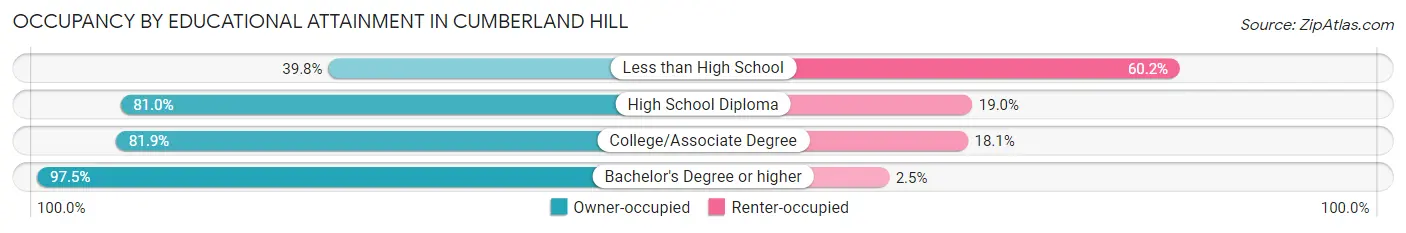
| Household Size | Owner-occupied | Renter-occupied |
| Less than High School | 109 (39.8%) | 165 (60.2%) |
| High School Diploma | 517 (81.0%) | 121 (19.0%) |
| College/Associate Degree | 683 (81.9%) | 151 (18.1%) |
| Bachelor's Degree or higher | 1,564 (97.5%) | 40 (2.5%) |
Occupancy by Age of Householder in Cumberland Hill
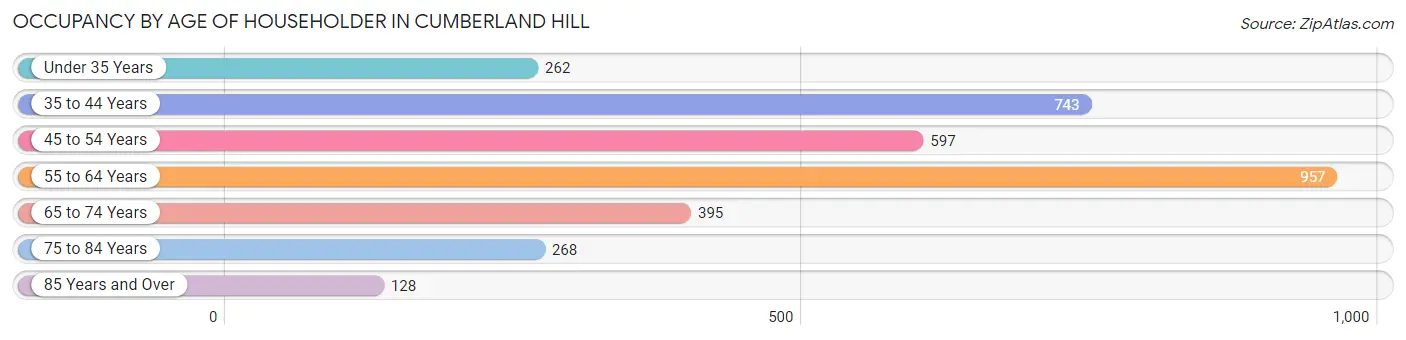
| Age Bracket | # Households | % Households |
| Under 35 Years | 262 | 7.8% |
| 35 to 44 Years | 743 | 22.2% |
| 45 to 54 Years | 597 | 17.8% |
| 55 to 64 Years | 957 | 28.6% |
| 65 to 74 Years | 395 | 11.8% |
| 75 to 84 Years | 268 | 8.0% |
| 85 Years and Over | 128 | 3.8% |
| Total | 3,350 | 100.0% |
Housing Finances in Cumberland Hill
Median Income by Occupancy in Cumberland Hill
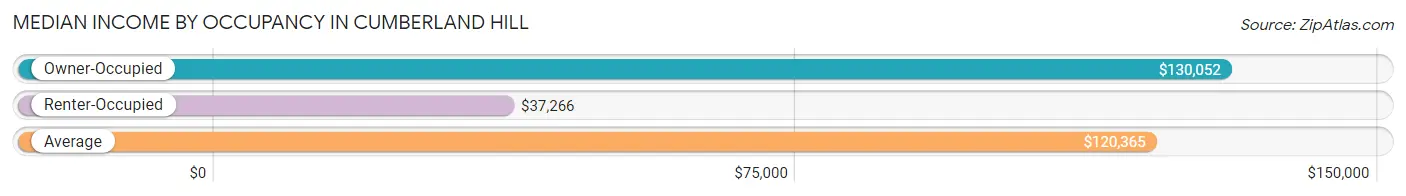
| Occupancy Type | # Households | Median Income |
| Owner-Occupied | 2,873 (85.8%) | $130,052 |
| Renter-Occupied | 477 (14.2%) | $37,266 |
| Average | 3,350 (100.0%) | $120,365 |
Occupancy by Householder Income Bracket in Cumberland Hill
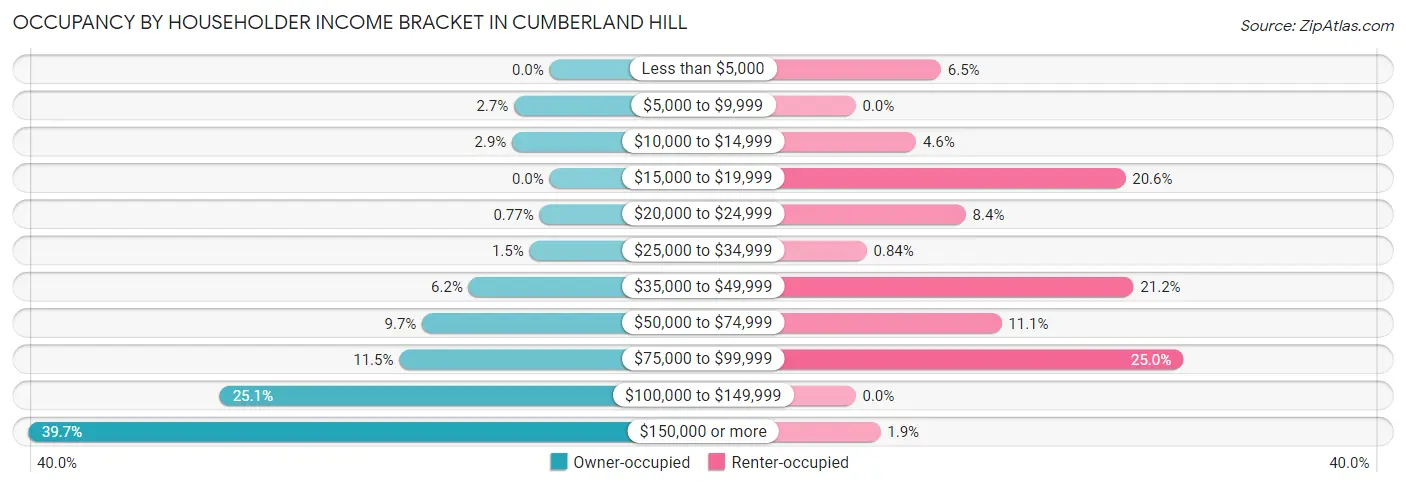
| Income Bracket | Owner-occupied | Renter-occupied |
| Less than $5,000 | 0 (0.0%) | 31 (6.5%) |
| $5,000 to $9,999 | 78 (2.7%) | 0 (0.0%) |
| $10,000 to $14,999 | 82 (2.9%) | 22 (4.6%) |
| $15,000 to $19,999 | 0 (0.0%) | 98 (20.5%) |
| $20,000 to $24,999 | 22 (0.8%) | 40 (8.4%) |
| $25,000 to $34,999 | 44 (1.5%) | 4 (0.8%) |
| $35,000 to $49,999 | 177 (6.2%) | 101 (21.2%) |
| $50,000 to $74,999 | 279 (9.7%) | 53 (11.1%) |
| $75,000 to $99,999 | 329 (11.5%) | 119 (24.9%) |
| $100,000 to $149,999 | 722 (25.1%) | 0 (0.0%) |
| $150,000 or more | 1,140 (39.7%) | 9 (1.9%) |
| Total | 2,873 (100.0%) | 477 (100.0%) |
Monthly Housing Cost Tiers in Cumberland Hill
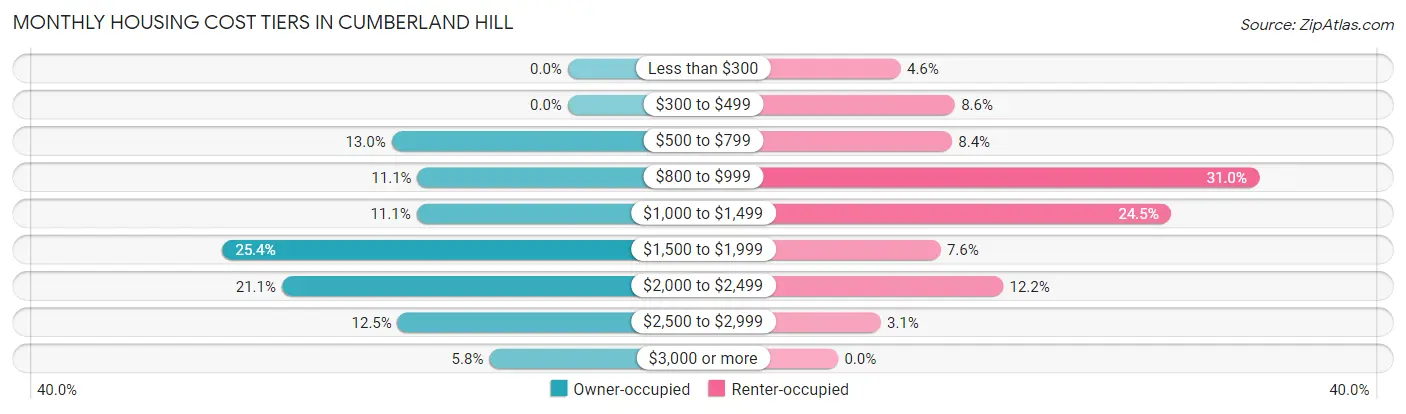
| Monthly Cost | Owner-occupied | Renter-occupied |
| Less than $300 | 0 (0.0%) | 22 (4.6%) |
| $300 to $499 | 0 (0.0%) | 41 (8.6%) |
| $500 to $799 | 373 (13.0%) | 40 (8.4%) |
| $800 to $999 | 318 (11.1%) | 148 (31.0%) |
| $1,000 to $1,499 | 320 (11.1%) | 117 (24.5%) |
| $1,500 to $1,999 | 731 (25.4%) | 36 (7.5%) |
| $2,000 to $2,499 | 605 (21.1%) | 58 (12.2%) |
| $2,500 to $2,999 | 360 (12.5%) | 15 (3.1%) |
| $3,000 or more | 166 (5.8%) | 0 (0.0%) |
| Total | 2,873 (100.0%) | 477 (100.0%) |
Physical Housing Characteristics in Cumberland Hill
Housing Structures in Cumberland Hill
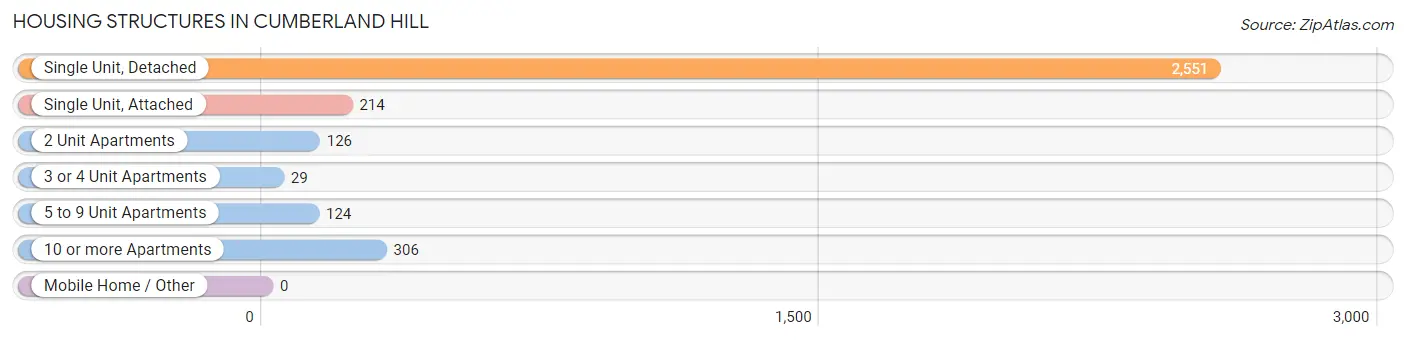
| Structure Type | # Housing Units | % Housing Units |
| Single Unit, Detached | 2,551 | 76.1% |
| Single Unit, Attached | 214 | 6.4% |
| 2 Unit Apartments | 126 | 3.8% |
| 3 or 4 Unit Apartments | 29 | 0.9% |
| 5 to 9 Unit Apartments | 124 | 3.7% |
| 10 or more Apartments | 306 | 9.1% |
| Mobile Home / Other | 0 | 0.0% |
| Total | 3,350 | 100.0% |
Housing Structures by Occupancy in Cumberland Hill
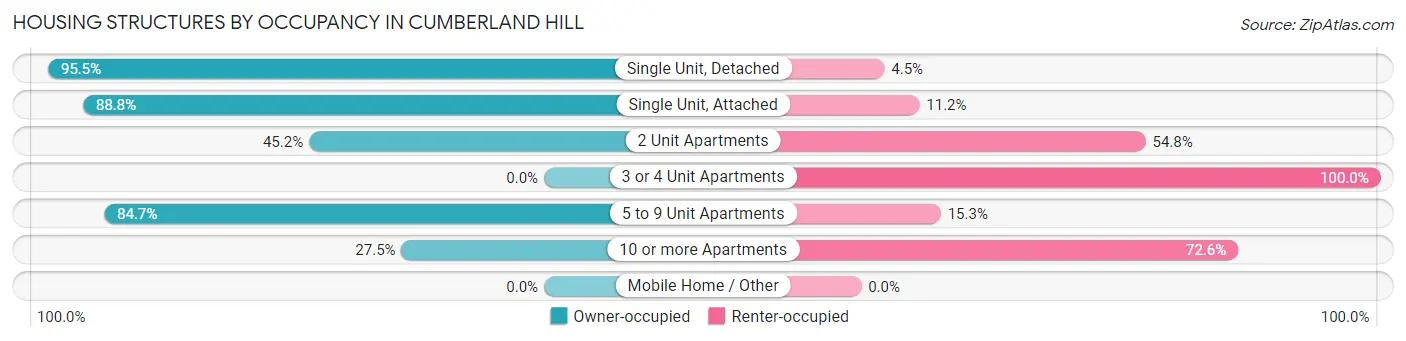
| Structure Type | Owner-occupied | Renter-occupied |
| Single Unit, Detached | 2,437 (95.5%) | 114 (4.5%) |
| Single Unit, Attached | 190 (88.8%) | 24 (11.2%) |
| 2 Unit Apartments | 57 (45.2%) | 69 (54.8%) |
| 3 or 4 Unit Apartments | 0 (0.0%) | 29 (100.0%) |
| 5 to 9 Unit Apartments | 105 (84.7%) | 19 (15.3%) |
| 10 or more Apartments | 84 (27.5%) | 222 (72.6%) |
| Mobile Home / Other | 0 (0.0%) | 0 (0.0%) |
| Total | 2,873 (85.8%) | 477 (14.2%) |
Housing Structures by Number of Rooms in Cumberland Hill
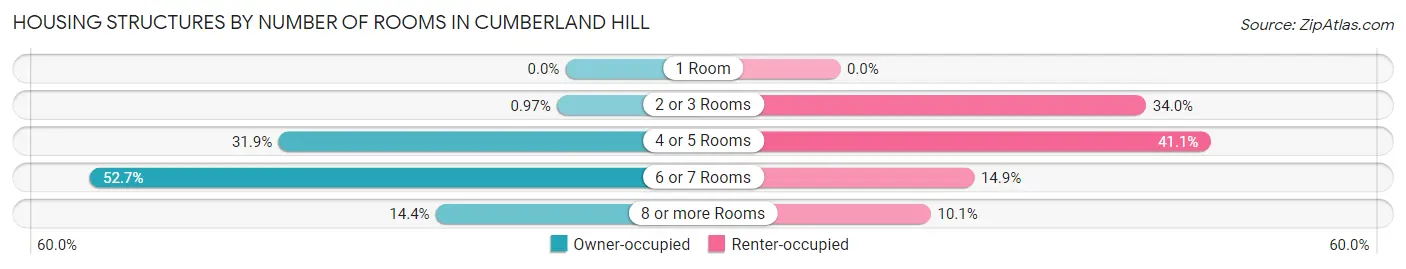
| Number of Rooms | Owner-occupied | Renter-occupied |
| 1 Room | 0 (0.0%) | 0 (0.0%) |
| 2 or 3 Rooms | 28 (1.0%) | 162 (34.0%) |
| 4 or 5 Rooms | 916 (31.9%) | 196 (41.1%) |
| 6 or 7 Rooms | 1,515 (52.7%) | 71 (14.9%) |
| 8 or more Rooms | 414 (14.4%) | 48 (10.1%) |
| Total | 2,873 (100.0%) | 477 (100.0%) |
Housing Structure by Heating Type in Cumberland Hill
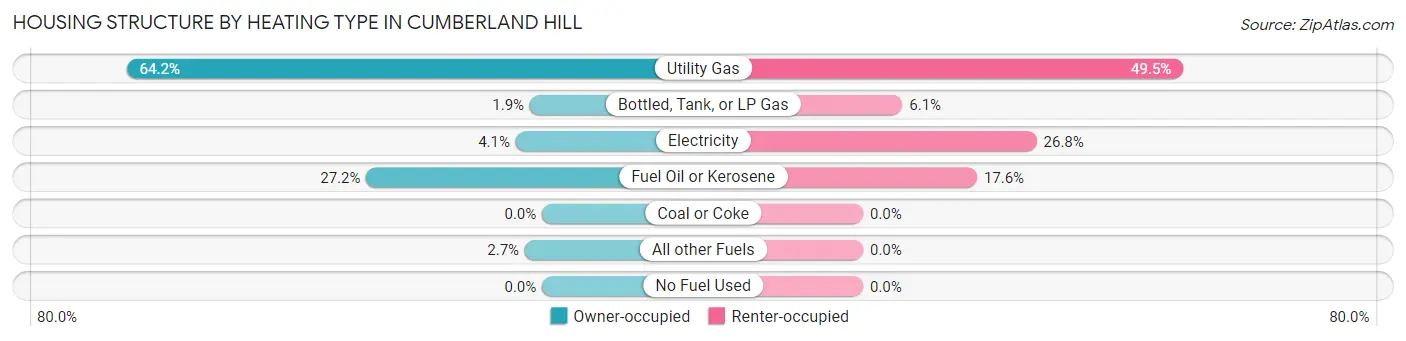
| Heating Type | Owner-occupied | Renter-occupied |
| Utility Gas | 1,845 (64.2%) | 236 (49.5%) |
| Bottled, Tank, or LP Gas | 54 (1.9%) | 29 (6.1%) |
| Electricity | 117 (4.1%) | 128 (26.8%) |
| Fuel Oil or Kerosene | 781 (27.2%) | 84 (17.6%) |
| Coal or Coke | 0 (0.0%) | 0 (0.0%) |
| All other Fuels | 76 (2.6%) | 0 (0.0%) |
| No Fuel Used | 0 (0.0%) | 0 (0.0%) |
| Total | 2,873 (100.0%) | 477 (100.0%) |
Household Vehicle Usage in Cumberland Hill
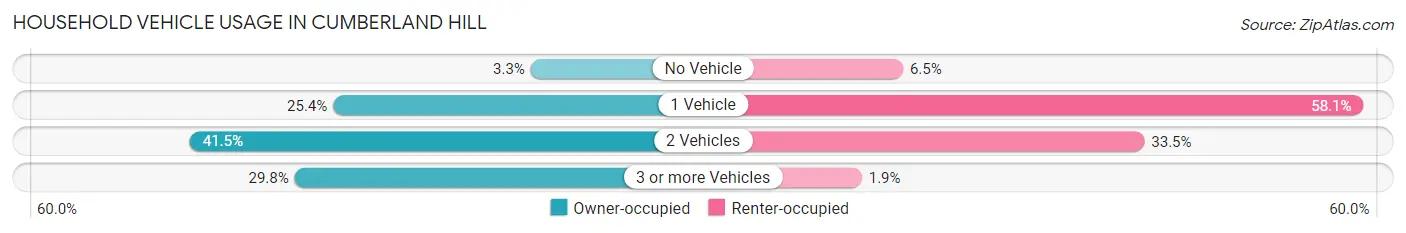
| Vehicles per Household | Owner-occupied | Renter-occupied |
| No Vehicle | 95 (3.3%) | 31 (6.5%) |
| 1 Vehicle | 731 (25.4%) | 277 (58.1%) |
| 2 Vehicles | 1,192 (41.5%) | 160 (33.5%) |
| 3 or more Vehicles | 855 (29.8%) | 9 (1.9%) |
| Total | 2,873 (100.0%) | 477 (100.0%) |
Real Estate & Mortgages in Cumberland Hill
Real Estate and Mortgage Overview in Cumberland Hill
| Characteristic | Without Mortgage | With Mortgage |
| Housing Units | 736 | 2,137 |
| Median Property Value | $368,500 | $332,800 |
| Median Household Income | $122,105 | $927 |
| Monthly Housing Costs | $889 | $166 |
| Real Estate Taxes | $4,510 | $0 |
Property Value by Mortgage Status in Cumberland Hill
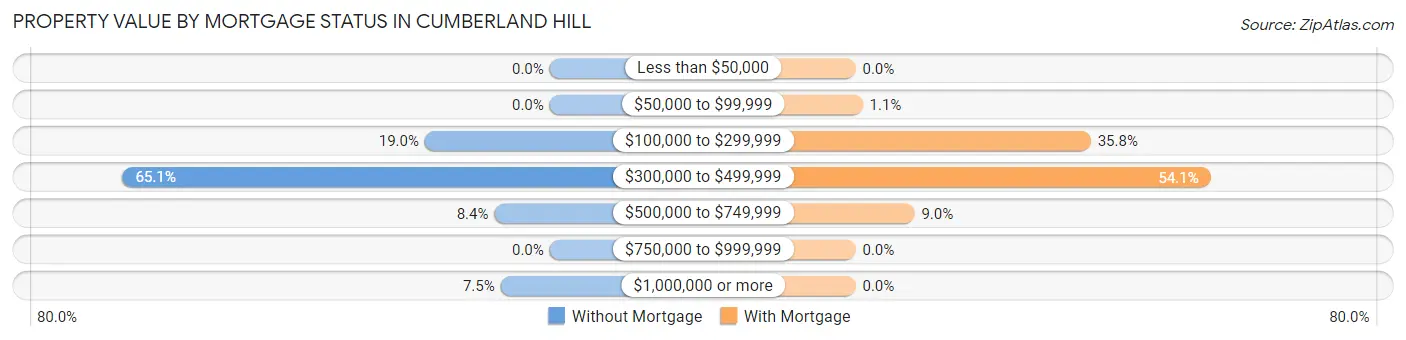
| Property Value | Without Mortgage | With Mortgage |
| Less than $50,000 | 0 (0.0%) | 0 (0.0%) |
| $50,000 to $99,999 | 0 (0.0%) | 23 (1.1%) |
| $100,000 to $299,999 | 140 (19.0%) | 766 (35.8%) |
| $300,000 to $499,999 | 479 (65.1%) | 1,156 (54.1%) |
| $500,000 to $749,999 | 62 (8.4%) | 192 (9.0%) |
| $750,000 to $999,999 | 0 (0.0%) | 0 (0.0%) |
| $1,000,000 or more | 55 (7.5%) | 0 (0.0%) |
| Total | 736 (100.0%) | 2,137 (100.0%) |
Household Income by Mortgage Status in Cumberland Hill
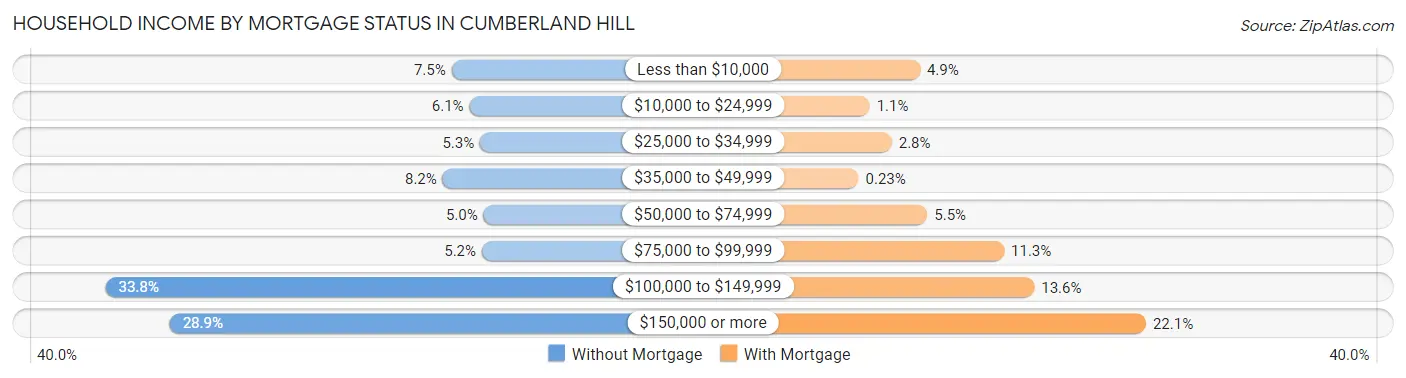
| Household Income | Without Mortgage | With Mortgage |
| Less than $10,000 | 55 (7.5%) | 105 (4.9%) |
| $10,000 to $24,999 | 45 (6.1%) | 23 (1.1%) |
| $25,000 to $34,999 | 39 (5.3%) | 59 (2.8%) |
| $35,000 to $49,999 | 60 (8.2%) | 5 (0.2%) |
| $50,000 to $74,999 | 37 (5.0%) | 117 (5.5%) |
| $75,000 to $99,999 | 38 (5.2%) | 242 (11.3%) |
| $100,000 to $149,999 | 249 (33.8%) | 291 (13.6%) |
| $150,000 or more | 213 (28.9%) | 473 (22.1%) |
| Total | 736 (100.0%) | 2,137 (100.0%) |
Property Value to Household Income Ratio in Cumberland Hill
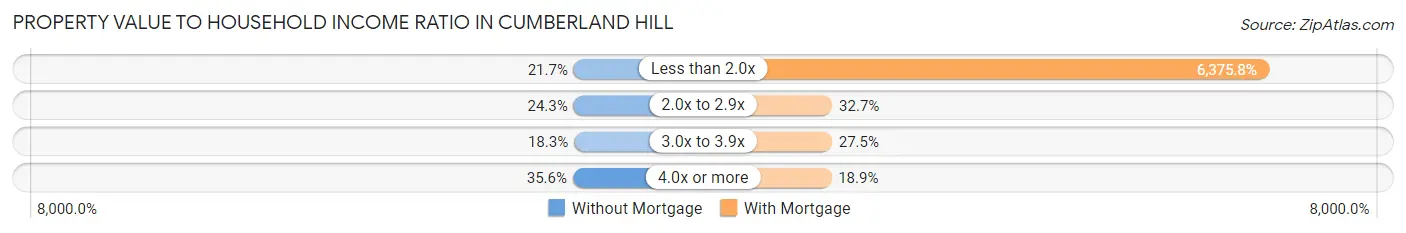
| Value-to-Income Ratio | Without Mortgage | With Mortgage |
| Less than 2.0x | 160 (21.7%) | 136,250 (6,375.8%) |
| 2.0x to 2.9x | 179 (24.3%) | 699 (32.7%) |
| 3.0x to 3.9x | 135 (18.3%) | 588 (27.5%) |
| 4.0x or more | 262 (35.6%) | 404 (18.9%) |
| Total | 736 (100.0%) | 2,137 (100.0%) |
Real Estate Taxes by Mortgage Status in Cumberland Hill
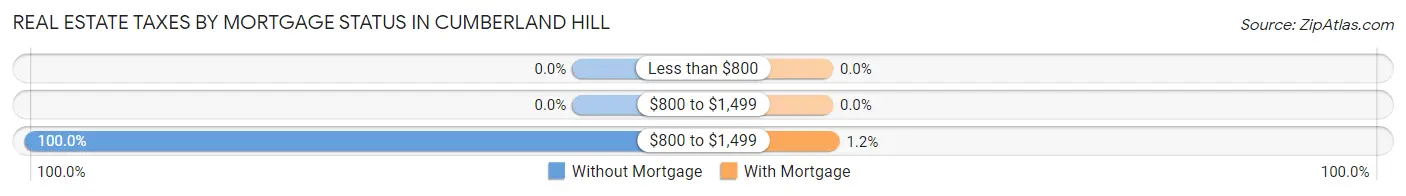
| Property Taxes | Without Mortgage | With Mortgage |
| Less than $800 | 0 (0.0%) | 0 (0.0%) |
| $800 to $1,499 | 0 (0.0%) | 0 (0.0%) |
| $800 to $1,499 | 736 (100.0%) | 25 (1.2%) |
| Total | 736 (100.0%) | 2,137 (100.0%) |
Health & Disability in Cumberland Hill
Health Insurance Coverage by Age in Cumberland Hill
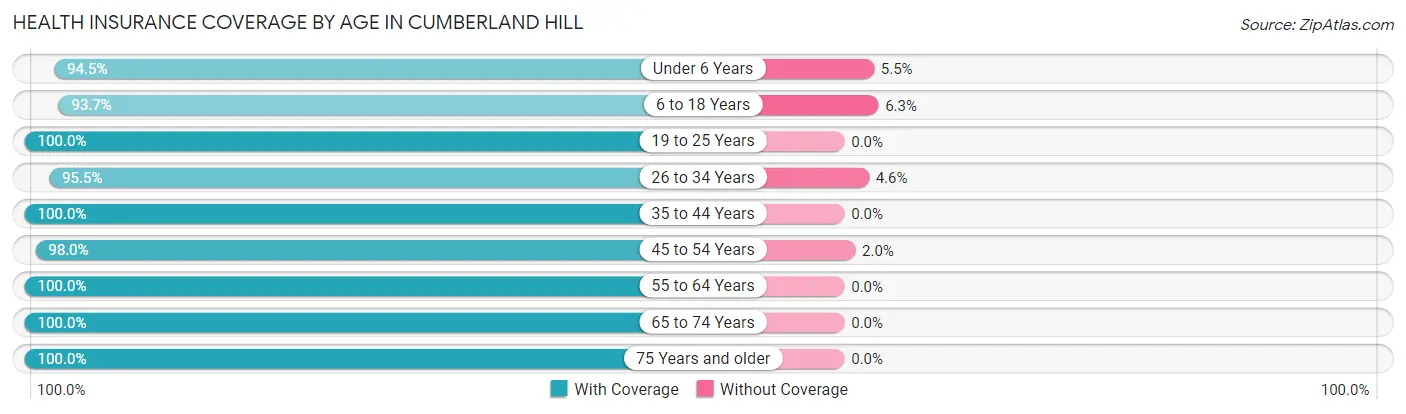
| Age Bracket | With Coverage | Without Coverage |
| Under 6 Years | 652 (94.5%) | 38 (5.5%) |
| 6 to 18 Years | 1,230 (93.7%) | 83 (6.3%) |
| 19 to 25 Years | 537 (100.0%) | 0 (0.0%) |
| 26 to 34 Years | 1,029 (95.5%) | 49 (4.5%) |
| 35 to 44 Years | 1,205 (100.0%) | 0 (0.0%) |
| 45 to 54 Years | 1,120 (98.0%) | 23 (2.0%) |
| 55 to 64 Years | 1,645 (100.0%) | 0 (0.0%) |
| 65 to 74 Years | 728 (100.0%) | 0 (0.0%) |
| 75 Years and older | 527 (100.0%) | 0 (0.0%) |
| Total | 8,673 (97.8%) | 193 (2.2%) |
Health Insurance Coverage by Citizenship Status in Cumberland Hill
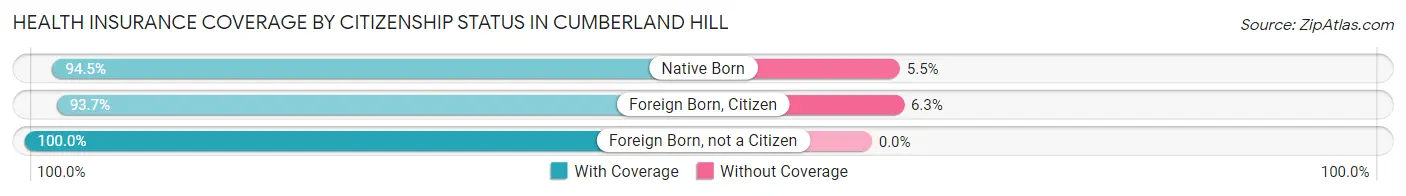
| Citizenship Status | With Coverage | Without Coverage |
| Native Born | 652 (94.5%) | 38 (5.5%) |
| Foreign Born, Citizen | 1,230 (93.7%) | 83 (6.3%) |
| Foreign Born, not a Citizen | 537 (100.0%) | 0 (0.0%) |
Health Insurance Coverage by Household Income in Cumberland Hill
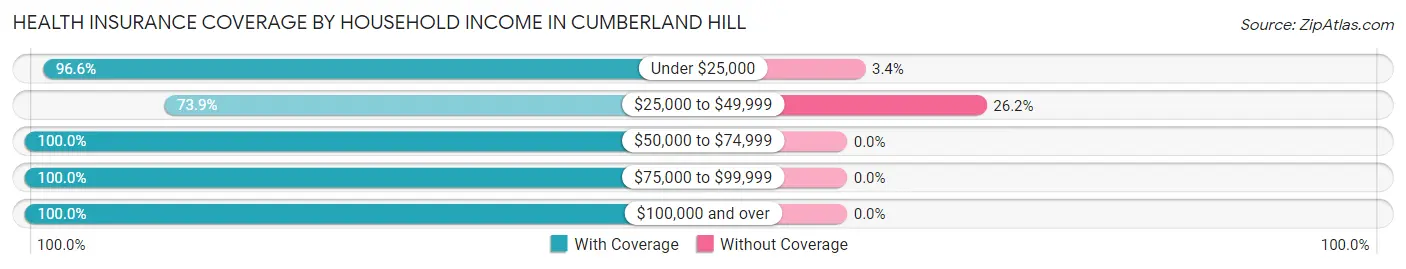
| Household Income | With Coverage | Without Coverage |
| Under $25,000 | 650 (96.6%) | 23 (3.4%) |
| $25,000 to $49,999 | 480 (73.9%) | 170 (26.2%) |
| $50,000 to $74,999 | 685 (100.0%) | 0 (0.0%) |
| $75,000 to $99,999 | 1,012 (100.0%) | 0 (0.0%) |
| $100,000 and over | 5,805 (100.0%) | 0 (0.0%) |
Public vs Private Health Insurance Coverage by Age in Cumberland Hill
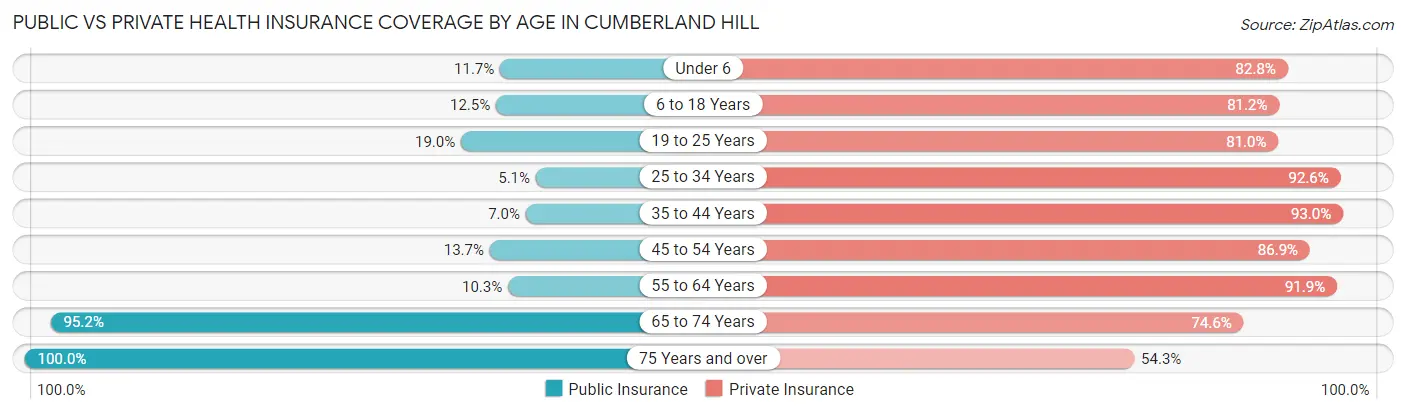
| Age Bracket | Public Insurance | Private Insurance |
| Under 6 | 81 (11.7%) | 571 (82.8%) |
| 6 to 18 Years | 164 (12.5%) | 1,066 (81.2%) |
| 19 to 25 Years | 102 (19.0%) | 435 (81.0%) |
| 25 to 34 Years | 55 (5.1%) | 998 (92.6%) |
| 35 to 44 Years | 84 (7.0%) | 1,121 (93.0%) |
| 45 to 54 Years | 156 (13.7%) | 993 (86.9%) |
| 55 to 64 Years | 169 (10.3%) | 1,512 (91.9%) |
| 65 to 74 Years | 693 (95.2%) | 543 (74.6%) |
| 75 Years and over | 527 (100.0%) | 286 (54.3%) |
| Total | 2,031 (22.9%) | 7,525 (84.9%) |
Disability Status by Sex by Age in Cumberland Hill
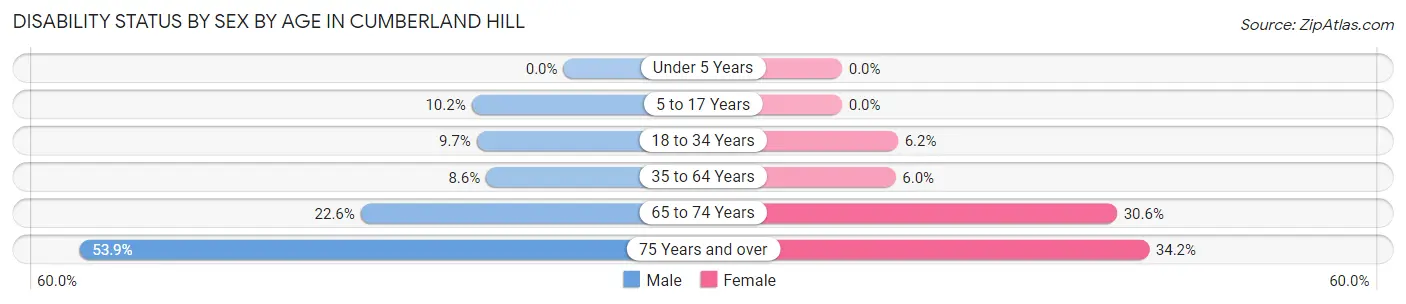
| Age Bracket | Male | Female |
| Under 5 Years | 0 (0.0%) | 0 (0.0%) |
| 5 to 17 Years | 66 (10.2%) | 0 (0.0%) |
| 18 to 34 Years | 55 (9.7%) | 70 (6.2%) |
| 35 to 64 Years | 166 (8.6%) | 123 (6.0%) |
| 65 to 74 Years | 84 (22.6%) | 109 (30.6%) |
| 75 Years and over | 76 (53.9%) | 132 (34.2%) |
Disability Class by Sex by Age in Cumberland Hill
Disability Class: Hearing Difficulty
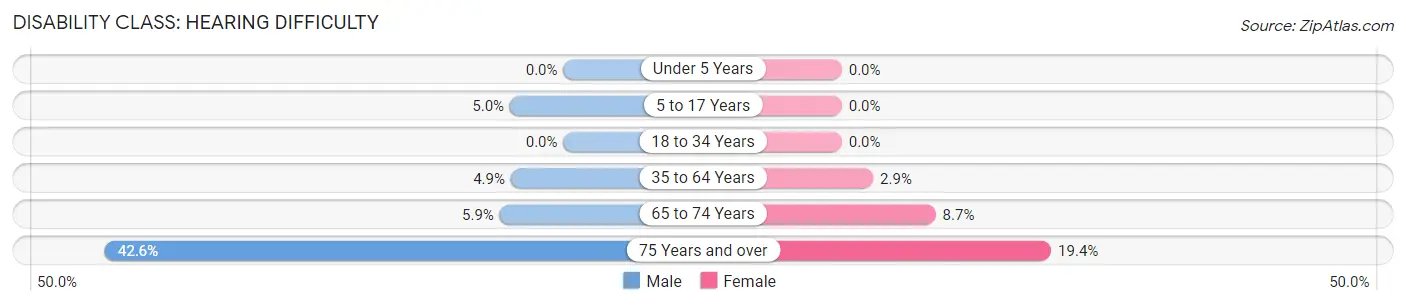
| Age Bracket | Male | Female |
| Under 5 Years | 0 (0.0%) | 0 (0.0%) |
| 5 to 17 Years | 32 (5.0%) | 0 (0.0%) |
| 18 to 34 Years | 0 (0.0%) | 0 (0.0%) |
| 35 to 64 Years | 94 (4.9%) | 60 (2.9%) |
| 65 to 74 Years | 22 (5.9%) | 31 (8.7%) |
| 75 Years and over | 60 (42.5%) | 75 (19.4%) |
Disability Class: Vision Difficulty
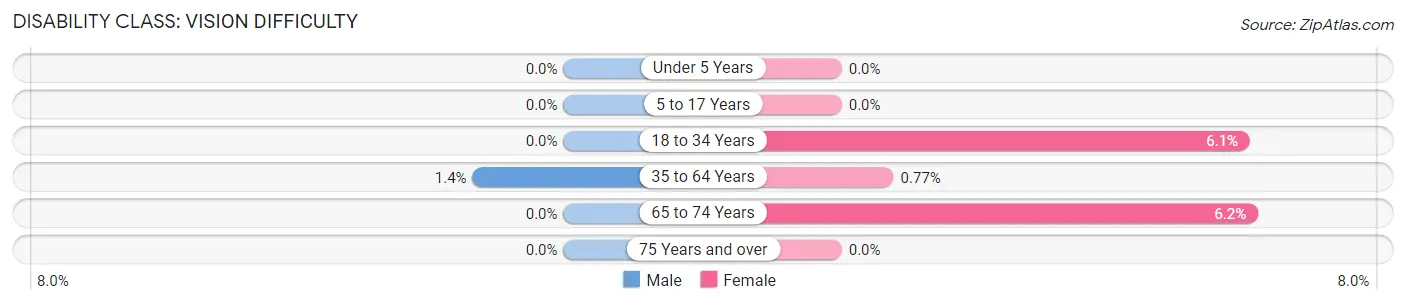
| Age Bracket | Male | Female |
| Under 5 Years | 0 (0.0%) | 0 (0.0%) |
| 5 to 17 Years | 0 (0.0%) | 0 (0.0%) |
| 18 to 34 Years | 0 (0.0%) | 68 (6.1%) |
| 35 to 64 Years | 26 (1.3%) | 16 (0.8%) |
| 65 to 74 Years | 0 (0.0%) | 22 (6.2%) |
| 75 Years and over | 0 (0.0%) | 0 (0.0%) |
Disability Class: Cognitive Difficulty
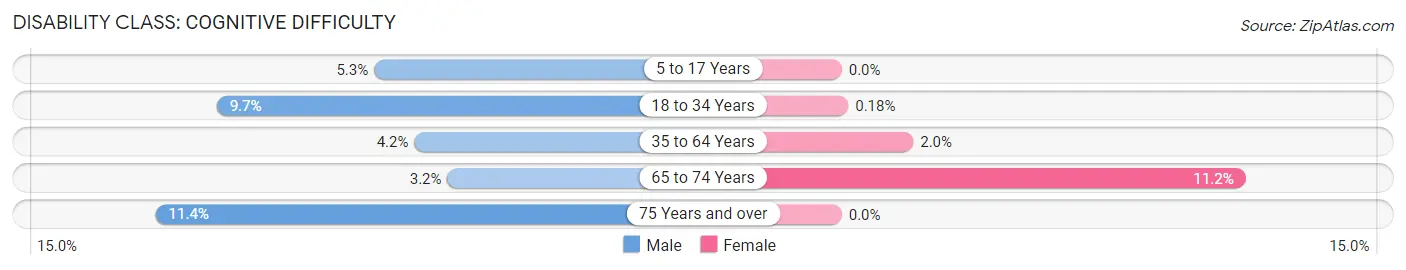
| Age Bracket | Male | Female |
| 5 to 17 Years | 34 (5.3%) | 0 (0.0%) |
| 18 to 34 Years | 55 (9.7%) | 2 (0.2%) |
| 35 to 64 Years | 80 (4.2%) | 41 (2.0%) |
| 65 to 74 Years | 12 (3.2%) | 40 (11.2%) |
| 75 Years and over | 16 (11.4%) | 0 (0.0%) |
Disability Class: Ambulatory Difficulty
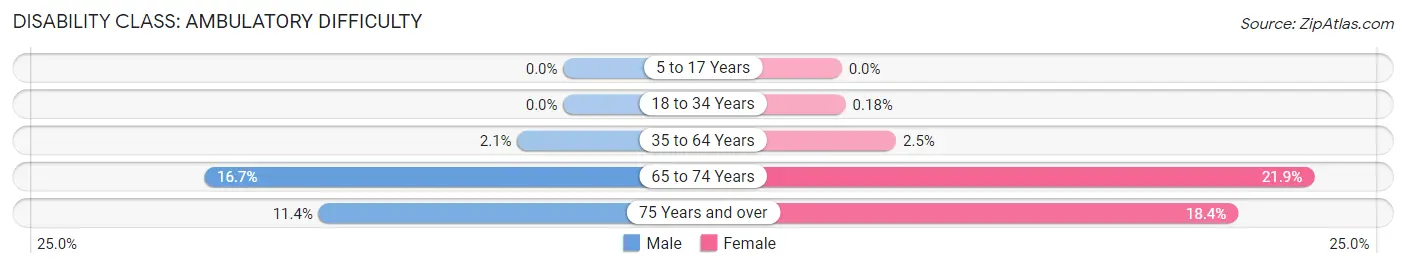
| Age Bracket | Male | Female |
| 5 to 17 Years | 0 (0.0%) | 0 (0.0%) |
| 18 to 34 Years | 0 (0.0%) | 2 (0.2%) |
| 35 to 64 Years | 41 (2.1%) | 52 (2.5%) |
| 65 to 74 Years | 62 (16.7%) | 78 (21.9%) |
| 75 Years and over | 16 (11.4%) | 71 (18.4%) |
Disability Class: Self-Care Difficulty
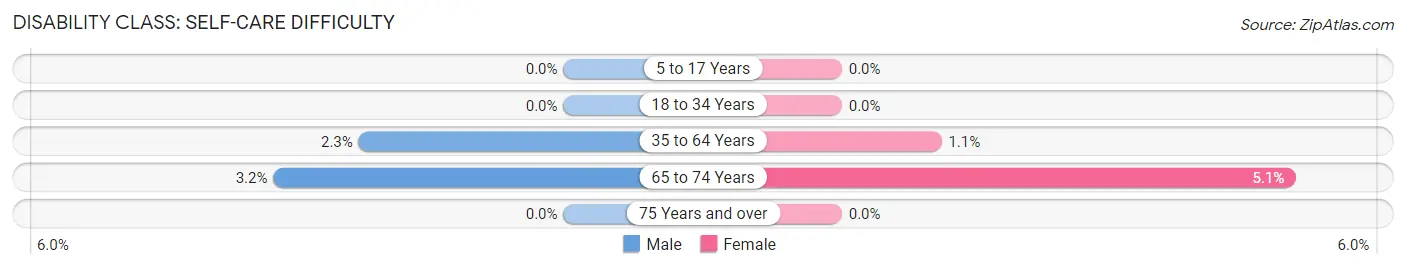
| Age Bracket | Male | Female |
| 5 to 17 Years | 0 (0.0%) | 0 (0.0%) |
| 18 to 34 Years | 0 (0.0%) | 0 (0.0%) |
| 35 to 64 Years | 44 (2.3%) | 23 (1.1%) |
| 65 to 74 Years | 12 (3.2%) | 18 (5.1%) |
| 75 Years and over | 0 (0.0%) | 0 (0.0%) |
Technology Access in Cumberland Hill
Computing Device Access in Cumberland Hill
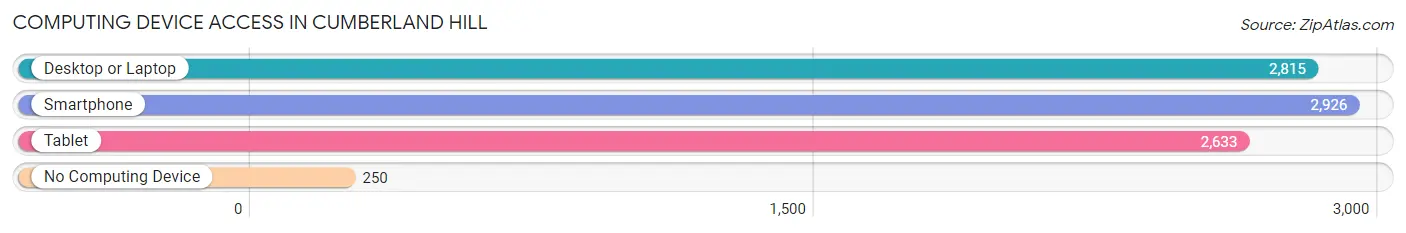
| Device Type | # Households | % Households |
| Desktop or Laptop | 2,815 | 84.0% |
| Smartphone | 2,926 | 87.3% |
| Tablet | 2,633 | 78.6% |
| No Computing Device | 250 | 7.5% |
| Total | 3,350 | 100.0% |
Internet Access in Cumberland Hill
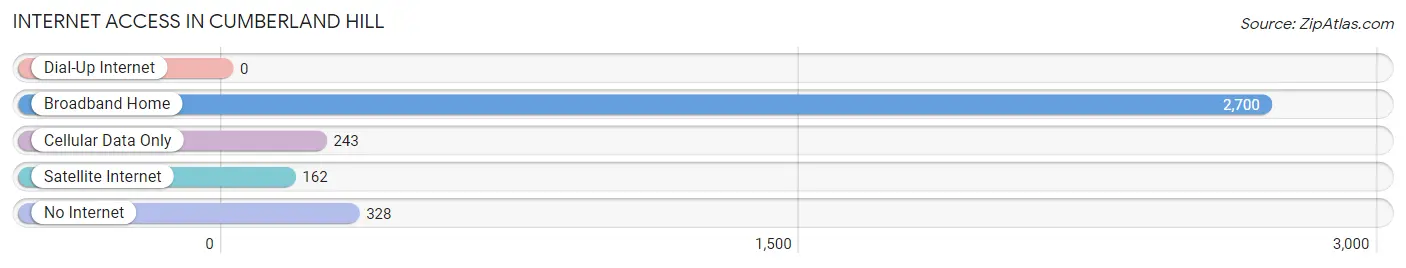
| Internet Type | # Households | % Households |
| Dial-Up Internet | 0 | 0.0% |
| Broadband Home | 2,700 | 80.6% |
| Cellular Data Only | 243 | 7.2% |
| Satellite Internet | 162 | 4.8% |
| No Internet | 328 | 9.8% |
| Total | 3,350 | 100.0% |
Cumberland Hill Summary
Cumberland Hill is a small town located in the state of Rhode Island. It is situated in the northern part of the state, in the Blackstone Valley region. The town is bordered by the towns of Lincoln, Smithfield, and Woonsocket. The population of Cumberland Hill was 8,818 at the 2010 census.
Geography
Cumberland Hill is located in the northern part of Rhode Island, in the Blackstone Valley region. The town is bordered by the towns of Lincoln, Smithfield, and Woonsocket. The town is situated on the banks of the Blackstone River, which runs through the center of the town. The town is also home to the Diamond Hill State Park, which is a popular destination for outdoor recreation.
The town has a total area of 8.3 square miles, of which 8.2 square miles is land and 0.1 square miles is water. The town is located at an elevation of approximately 200 feet above sea level.
History
Cumberland Hill was first settled in the early 1700s by settlers from Massachusetts. The town was originally part of the town of Smithfield, but was incorporated as its own town in 1746. The town was named after the Duke of Cumberland, who was a British military leader during the French and Indian War.
The town was an important center of industry during the Industrial Revolution. The town was home to several mills, including the Cumberland Manufacturing Company, which was one of the largest cotton mills in the state. The town was also home to several other industries, including a paper mill, a shoe factory, and a tannery.
Economy
Cumberland Hill is a primarily residential community, with a small commercial district located in the center of town. The town is home to several small businesses, including restaurants, retail stores, and professional services. The town is also home to several industrial parks, which are home to a variety of businesses, including manufacturing, warehousing, and distribution.
The town is also home to the Diamond Hill State Park, which is a popular destination for outdoor recreation. The park offers a variety of activities, including hiking, biking, fishing, and camping.
Demographics
As of the 2010 census, the population of Cumberland Hill was 8,818. The racial makeup of the town was 94.3% White, 1.7% African American, 0.3% Native American, 1.2% Asian, 0.1% Pacific Islander, 1.2% from other races, and 1.4% from two or more races. Hispanic or Latino of any race were 3.2% of the population.
The median household income in Cumberland Hill was $60,945, and the median family income was $71,917. The per capita income for the town was $27,945. About 4.3% of families and 5.7% of the population were below the poverty line, including 6.7% of those under age 18 and 4.2% of those age 65 or over.
Common Questions
What is Per Capita Income in Cumberland Hill?
Per Capita income in Cumberland Hill is $47,269.
What is the Median Family Income in Cumberland Hill?
Median Family Income in Cumberland Hill is $131,354.
What is the Median Household income in Cumberland Hill?
Median Household Income in Cumberland Hill is $120,365.
What is Income or Wage Gap in Cumberland Hill?
Income or Wage Gap in Cumberland Hill is 24.6%.
Women in Cumberland Hill earn 75.4 cents for every dollar earned by a man.
What is Inequality or Gini Index in Cumberland Hill?
Inequality or Gini Index in Cumberland Hill is 0.36.
What is the Total Population of Cumberland Hill?
Total Population of Cumberland Hill is 8,866.
What is the Total Male Population of Cumberland Hill?
Total Male Population of Cumberland Hill is 3,913.
What is the Total Female Population of Cumberland Hill?
Total Female Population of Cumberland Hill is 4,953.
What is the Ratio of Males per 100 Females in Cumberland Hill?
There are 79.00 Males per 100 Females in Cumberland Hill.
What is the Ratio of Females per 100 Males in Cumberland Hill?
There are 126.58 Females per 100 Males in Cumberland Hill.
What is the Median Population Age in Cumberland Hill?
Median Population Age in Cumberland Hill is 40.5 Years.
What is the Average Family Size in Cumberland Hill
Average Family Size in Cumberland Hill is 3.2 People.
What is the Average Household Size in Cumberland Hill
Average Household Size in Cumberland Hill is 2.6 People.
How Large is the Labor Force in Cumberland Hill?
There are 5,343 People in the Labor Forcein in Cumberland Hill.
What is the Percentage of People in the Labor Force in Cumberland Hill?
72.7% of People are in the Labor Force in Cumberland Hill.
What is the Unemployment Rate in Cumberland Hill?
Unemployment Rate in Cumberland Hill is 2.5%.