Quonochontaug, RI Map & Demographics
Quonochontaug Map
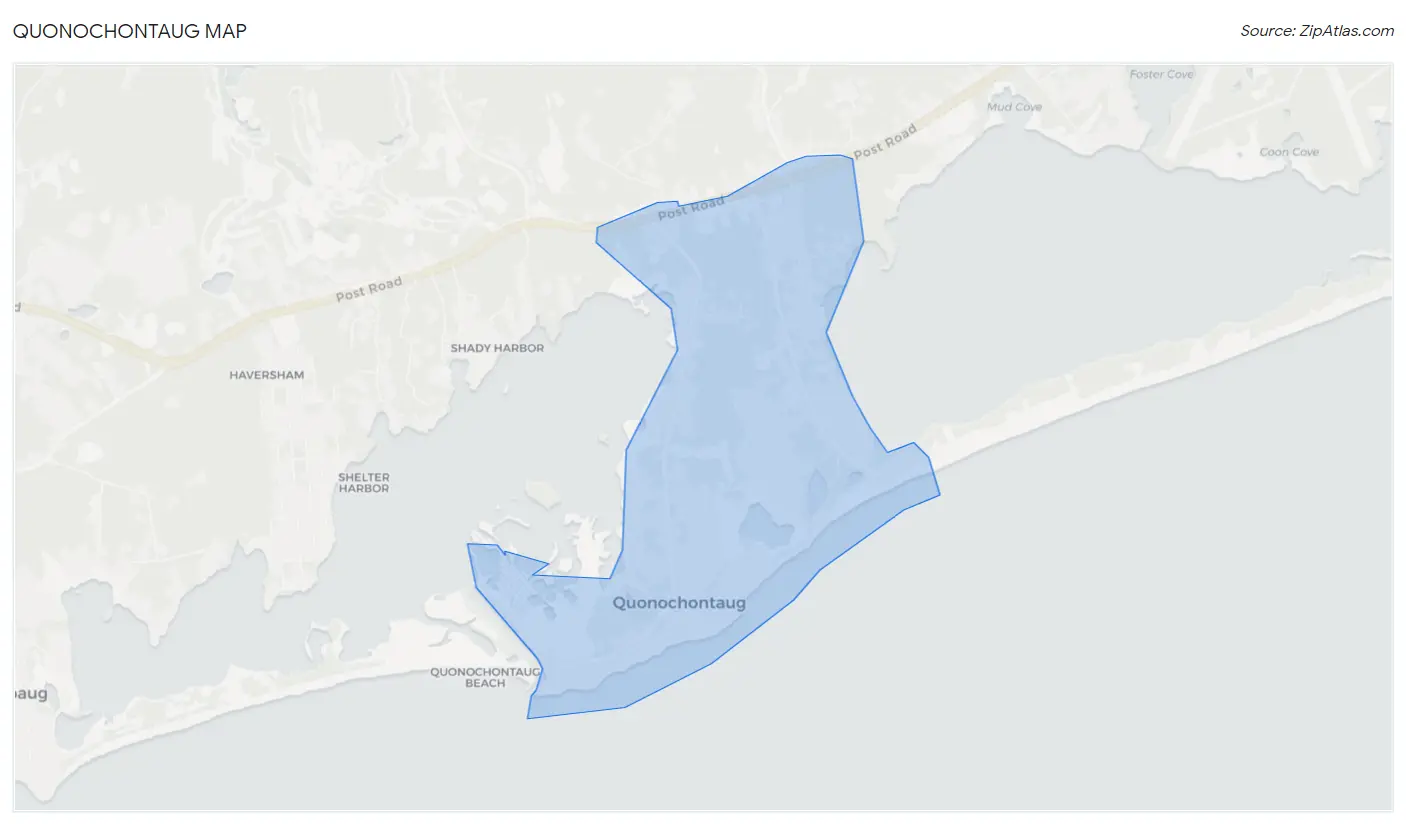
Quonochontaug Overview
$109,370
PER CAPITA INCOME
$181,500
AVG FAMILY INCOME
$114,010
AVG HOUSEHOLD INCOME
0.49
INEQUALITY / GINI INDEX
452
TOTAL POPULATION
212
MALE POPULATION
240
FEMALE POPULATION
88.33
MALES / 100 FEMALES
113.21
FEMALES / 100 MALES
61.6
MEDIAN AGE
2.3
AVG FAMILY SIZE
1.9
AVG HOUSEHOLD SIZE
220
LABOR FORCE [ PEOPLE ]
49.3%
PERCENT IN LABOR FORCE
12.7%
UNEMPLOYMENT RATE
Income in Quonochontaug
Income Overview in Quonochontaug
Per Capita Income in Quonochontaug is $109,370, while median incomes of families and households are $181,500 and $114,010 respectively.
| Characteristic | Number | Measure |
| Per Capita Income | 452 | $109,370 |
| Median Family Income | 162 | $181,500 |
| Mean Family Income | 162 | $257,109 |
| Median Household Income | 237 | $114,010 |
| Mean Household Income | 237 | $195,239 |
| Income Deficit | 162 | $0 |
| Wage / Income Gap (%) | 452 | 0.00% |
| Wage / Income Gap ($) | 452 | 100.00¢ per $1 |
| Gini / Inequality Index | 452 | 0.49 |
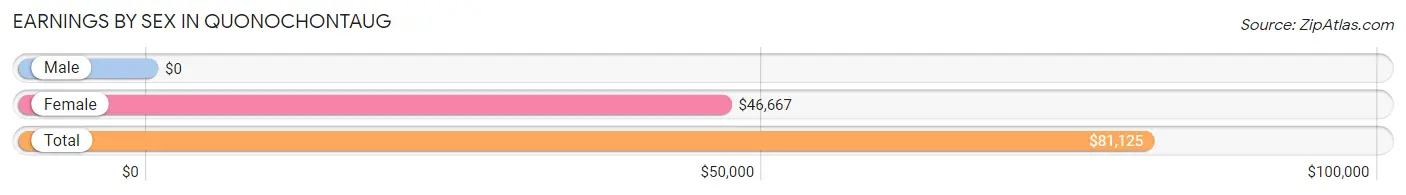
Earnings by Sex in Quonochontaug
| Sex | Number | Average Earnings |
| Male | 97 (44.7%) | $0 |
| Female | 120 (55.3%) | $46,667 |
| Total | 217 (100.0%) | $81,125 |
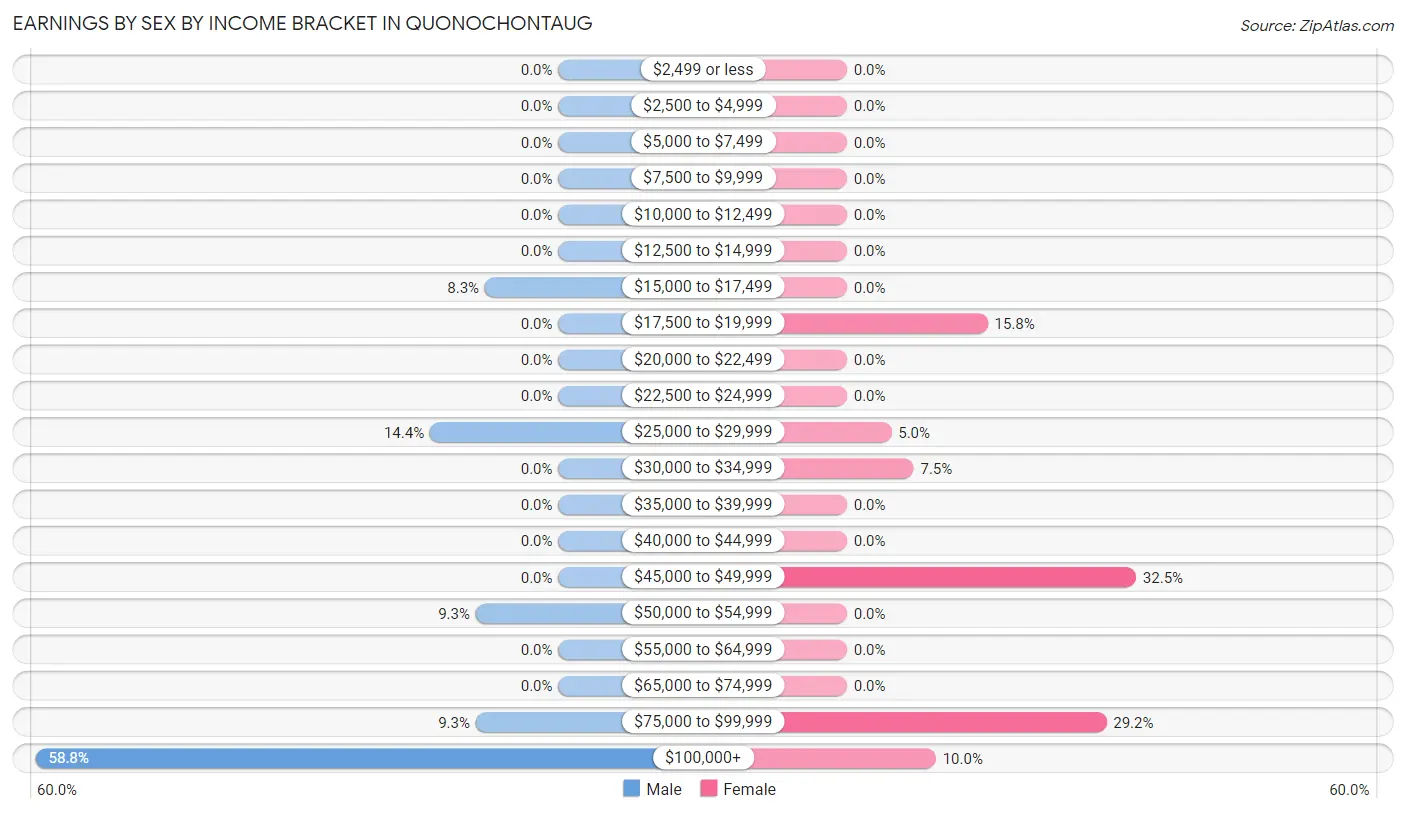
Earnings by Sex by Income Bracket in Quonochontaug
The most common earnings brackets in Quonochontaug are $100,000+ for men (57 | 58.8%) and $45,000 to $49,999 for women (39 | 32.5%).
| Income | Male | Female |
| $2,499 or less | 0 (0.0%) | 0 (0.0%) |
| $2,500 to $4,999 | 0 (0.0%) | 0 (0.0%) |
| $5,000 to $7,499 | 0 (0.0%) | 0 (0.0%) |
| $7,500 to $9,999 | 0 (0.0%) | 0 (0.0%) |
| $10,000 to $12,499 | 0 (0.0%) | 0 (0.0%) |
| $12,500 to $14,999 | 0 (0.0%) | 0 (0.0%) |
| $15,000 to $17,499 | 8 (8.3%) | 0 (0.0%) |
| $17,500 to $19,999 | 0 (0.0%) | 19 (15.8%) |
| $20,000 to $22,499 | 0 (0.0%) | 0 (0.0%) |
| $22,500 to $24,999 | 0 (0.0%) | 0 (0.0%) |
| $25,000 to $29,999 | 14 (14.4%) | 6 (5.0%) |
| $30,000 to $34,999 | 0 (0.0%) | 9 (7.5%) |
| $35,000 to $39,999 | 0 (0.0%) | 0 (0.0%) |
| $40,000 to $44,999 | 0 (0.0%) | 0 (0.0%) |
| $45,000 to $49,999 | 0 (0.0%) | 39 (32.5%) |
| $50,000 to $54,999 | 9 (9.3%) | 0 (0.0%) |
| $55,000 to $64,999 | 0 (0.0%) | 0 (0.0%) |
| $65,000 to $74,999 | 0 (0.0%) | 0 (0.0%) |
| $75,000 to $99,999 | 9 (9.3%) | 35 (29.2%) |
| $100,000+ | 57 (58.8%) | 12 (10.0%) |
| Total | 97 (100.0%) | 120 (100.0%) |
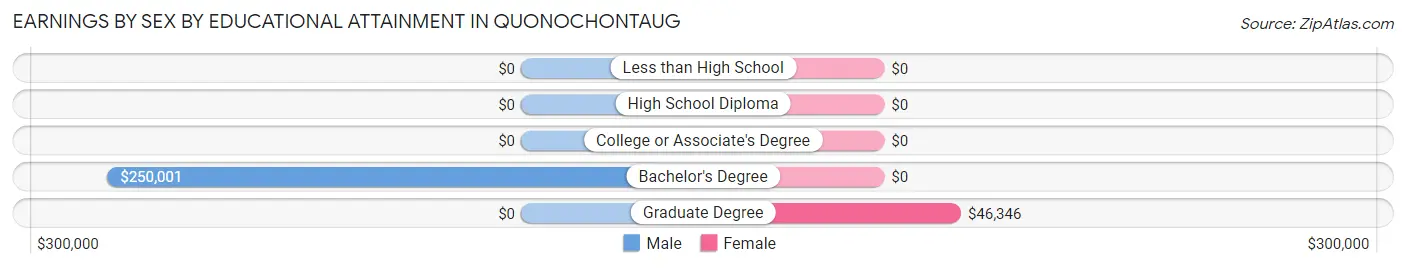
Earnings by Sex by Educational Attainment in Quonochontaug
Average earnings in Quonochontaug are $250,001 for men and $46,667 for women, a difference of 81.3%. Men with an educational attainment of bachelor's degree enjoy the highest average annual earnings of $250,001, while those with bachelor's degree education earn the least with $250,001. Women with an educational attainment of graduate degree earn the most with the average annual earnings of $46,346, while those with graduate degree education have the smallest earnings of $46,346.
| Educational Attainment | Male Income | Female Income |
| Less than High School | - | - |
| High School Diploma | - | - |
| College or Associate's Degree | - | - |
| Bachelor's Degree | $250,001 | $0 |
| Graduate Degree | - | - |
| Total | $250,001 | $46,667 |
Family Income in Quonochontaug
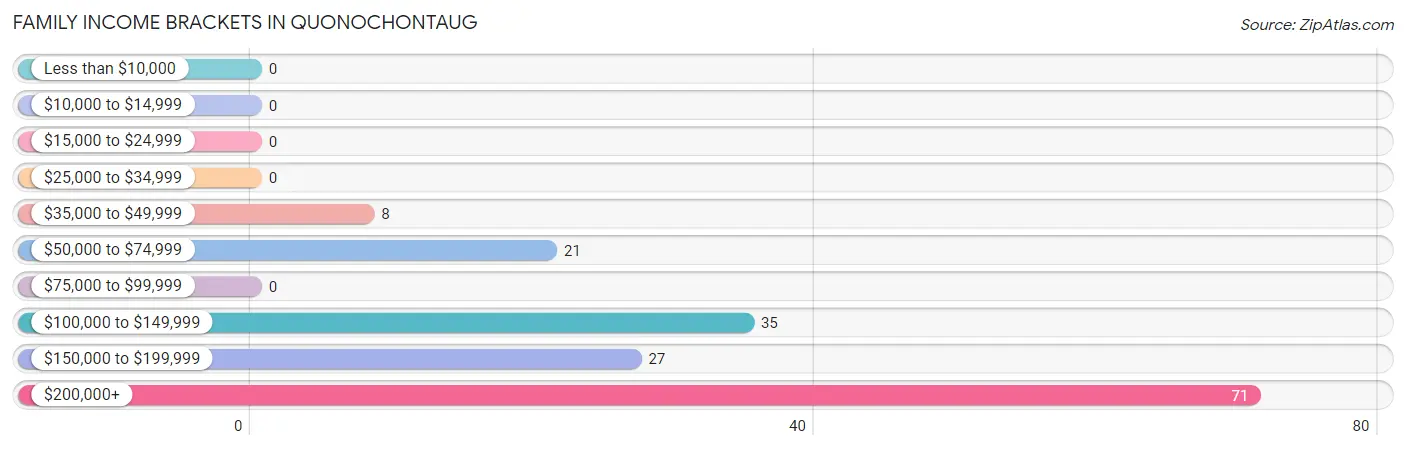
Family Income Brackets in Quonochontaug
According to the Quonochontaug family income data, there are 71 families falling into the $200,000+ income range, which is the most common income bracket and makes up 43.8% of all families.
| Income Bracket | # Families | % Families |
| Less than $10,000 | 0 | 0.0% |
| $10,000 to $14,999 | 0 | 0.0% |
| $15,000 to $24,999 | 0 | 0.0% |
| $25,000 to $34,999 | 0 | 0.0% |
| $35,000 to $49,999 | 8 | 4.9% |
| $50,000 to $74,999 | 21 | 13.0% |
| $75,000 to $99,999 | 0 | 0.0% |
| $100,000 to $149,999 | 35 | 21.6% |
| $150,000 to $199,999 | 27 | 16.7% |
| $200,000+ | 71 | 43.8% |
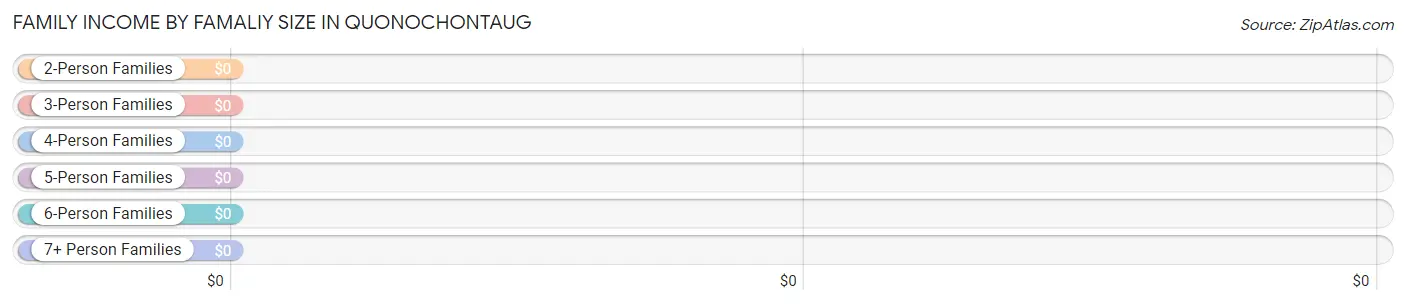
Family Income by Famaliy Size in Quonochontaug
| Income Bracket | # Families | Median Income |
| 2-Person Families | 138 (85.2%) | $0 |
| 3-Person Families | 16 (9.9%) | $0 |
| 4-Person Families | 8 (4.9%) | $0 |
| 5-Person Families | 0 (0.0%) | $0 |
| 6-Person Families | 0 (0.0%) | $0 |
| 7+ Person Families | 0 (0.0%) | $0 |
| Total | 162 (100.0%) | $181,500 |
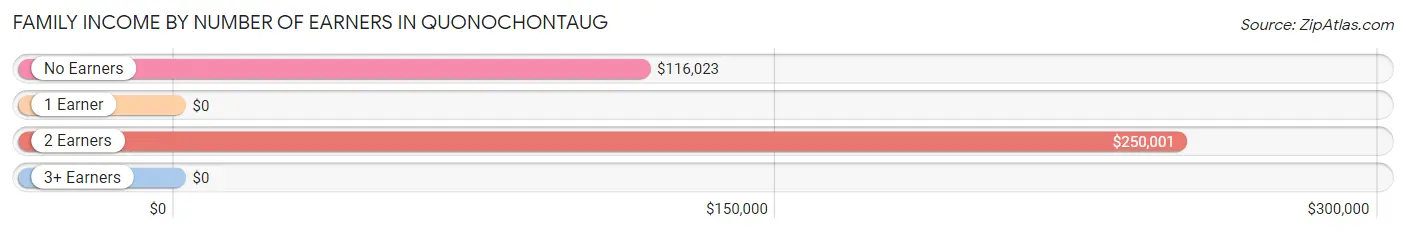
Family Income by Number of Earners in Quonochontaug
| Number of Earners | # Families | Median Income |
| No Earners | 51 (31.5%) | $116,023 |
| 1 Earner | 56 (34.6%) | $0 |
| 2 Earners | 55 (34.0%) | $250,001 |
| 3+ Earners | 0 (0.0%) | $0 |
| Total | 162 (100.0%) | $181,500 |
Household Income in Quonochontaug
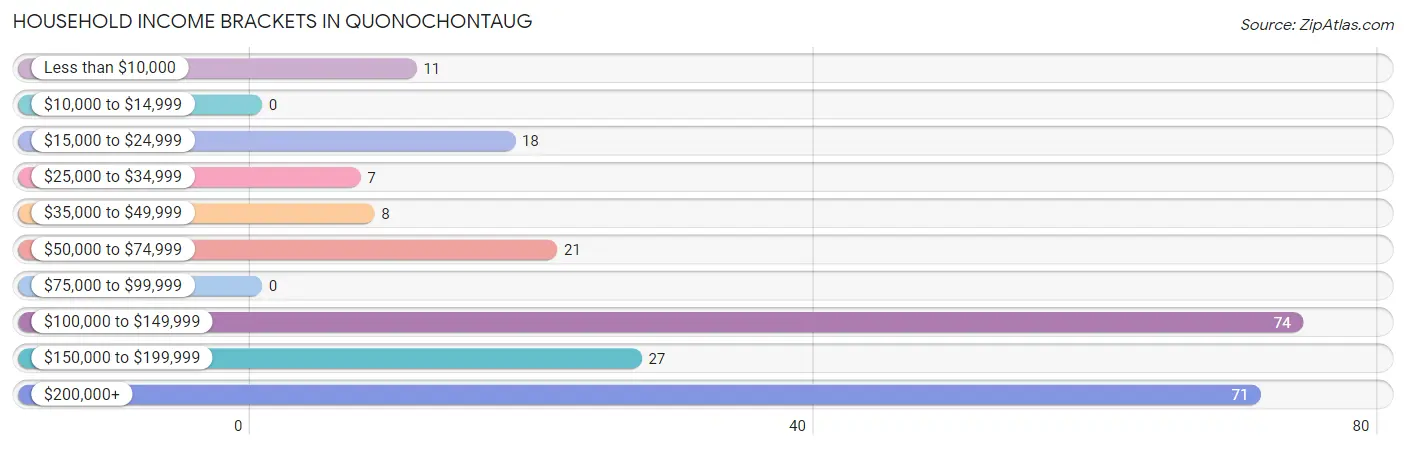
Household Income Brackets in Quonochontaug
With 74 households falling in the category, the $100,000 to $149,999 income range is the most frequent in Quonochontaug, accounting for 31.2% of all households.
| Income Bracket | # Households | % Households |
| Less than $10,000 | 11 | 4.6% |
| $10,000 to $14,999 | 0 | 0.0% |
| $15,000 to $24,999 | 18 | 7.6% |
| $25,000 to $34,999 | 7 | 3.0% |
| $35,000 to $49,999 | 8 | 3.4% |
| $50,000 to $74,999 | 21 | 8.9% |
| $75,000 to $99,999 | 0 | 0.0% |
| $100,000 to $149,999 | 74 | 31.2% |
| $150,000 to $199,999 | 27 | 11.4% |
| $200,000+ | 71 | 30.0% |
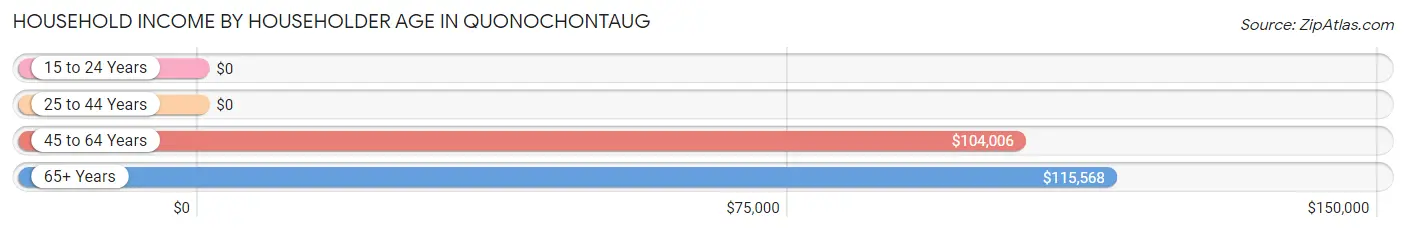
Household Income by Householder Age in Quonochontaug
The median household income in Quonochontaug is $114,010, with the highest median household income of $115,568 found in the 65+ years age bracket for the primary householder. A total of 119 households (50.2%) fall into this category.
| Income Bracket | # Households | Median Income |
| 15 to 24 Years | 0 (0.0%) | $0 |
| 25 to 44 Years | 29 (12.2%) | $0 |
| 45 to 64 Years | 89 (37.6%) | $104,006 |
| 65+ Years | 119 (50.2%) | $115,568 |
| Total | 237 (100.0%) | $114,010 |
Poverty in Quonochontaug
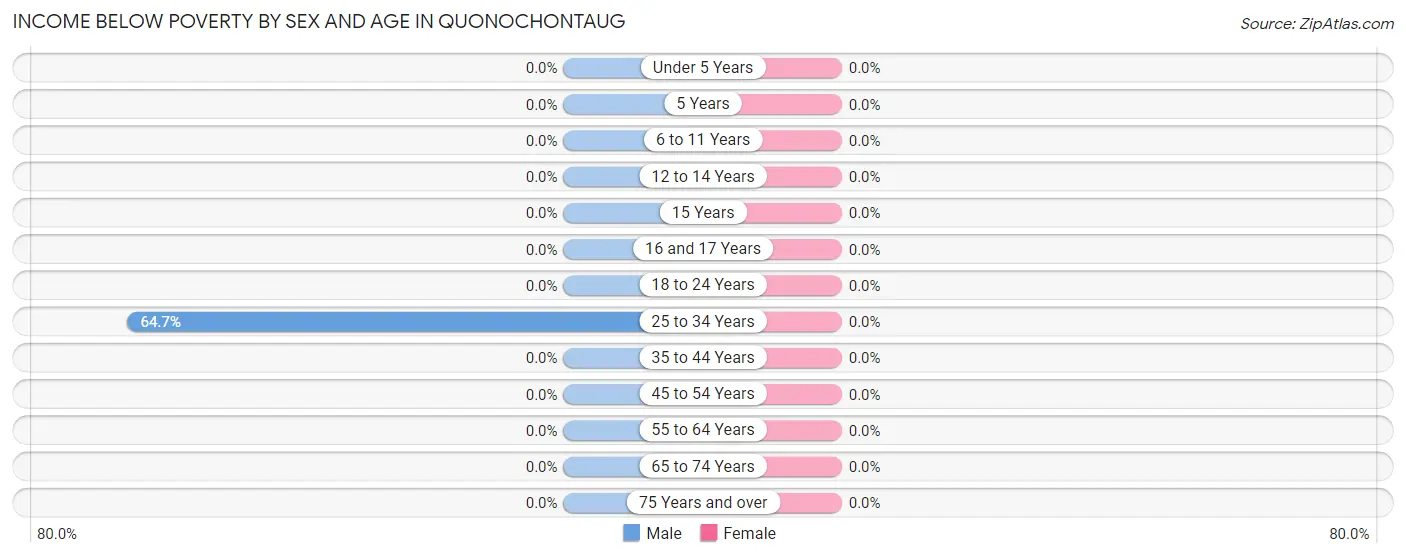
Income Below Poverty by Sex and Age in Quonochontaug
| Age Bracket | Male | Female |
| Under 5 Years | 0 (0.0%) | 0 (0.0%) |
| 5 Years | 0 (0.0%) | 0 (0.0%) |
| 6 to 11 Years | 0 (0.0%) | 0 (0.0%) |
| 12 to 14 Years | 0 (0.0%) | 0 (0.0%) |
| 15 Years | 0 (0.0%) | 0 (0.0%) |
| 16 and 17 Years | 0 (0.0%) | 0 (0.0%) |
| 18 to 24 Years | 0 (0.0%) | 0 (0.0%) |
| 25 to 34 Years | 11 (64.7%) | 0 (0.0%) |
| 35 to 44 Years | 0 (0.0%) | 0 (0.0%) |
| 45 to 54 Years | 0 (0.0%) | 0 (0.0%) |
| 55 to 64 Years | 0 (0.0%) | 0 (0.0%) |
| 65 to 74 Years | 0 (0.0%) | 0 (0.0%) |
| 75 Years and over | 0 (0.0%) | 0 (0.0%) |
| Total | 11 (5.2%) | 0 (0.0%) |
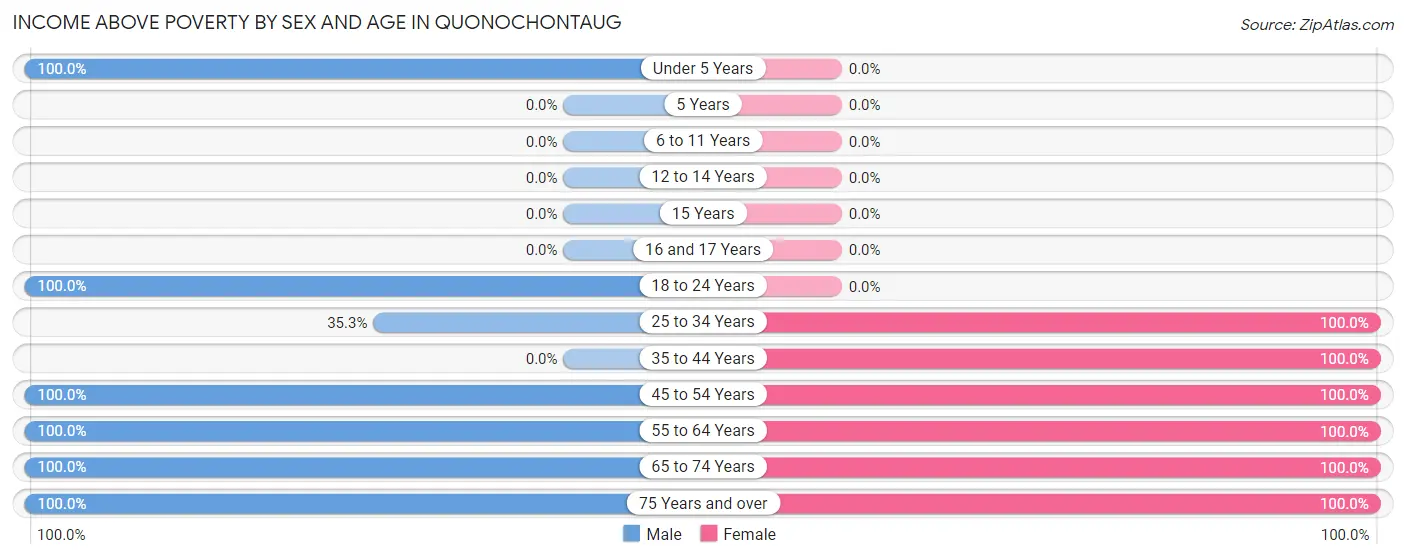
Income Above Poverty by Sex and Age in Quonochontaug
According to the poverty statistics in Quonochontaug, males aged under 5 years and females aged 25 to 34 years are the age groups that are most secure financially, with 100.0% of males and 100.0% of females in these age groups living above the poverty line.
| Age Bracket | Male | Female |
| Under 5 Years | 6 (100.0%) | 0 (0.0%) |
| 5 Years | 0 (0.0%) | 0 (0.0%) |
| 6 to 11 Years | 0 (0.0%) | 0 (0.0%) |
| 12 to 14 Years | 0 (0.0%) | 0 (0.0%) |
| 15 Years | 0 (0.0%) | 0 (0.0%) |
| 16 and 17 Years | 0 (0.0%) | 0 (0.0%) |
| 18 to 24 Years | 14 (100.0%) | 0 (0.0%) |
| 25 to 34 Years | 6 (35.3%) | 6 (100.0%) |
| 35 to 44 Years | 0 (0.0%) | 12 (100.0%) |
| 45 to 54 Years | 13 (100.0%) | 19 (100.0%) |
| 55 to 64 Years | 60 (100.0%) | 104 (100.0%) |
| 65 to 74 Years | 33 (100.0%) | 38 (100.0%) |
| 75 Years and over | 69 (100.0%) | 61 (100.0%) |
| Total | 201 (94.8%) | 240 (100.0%) |
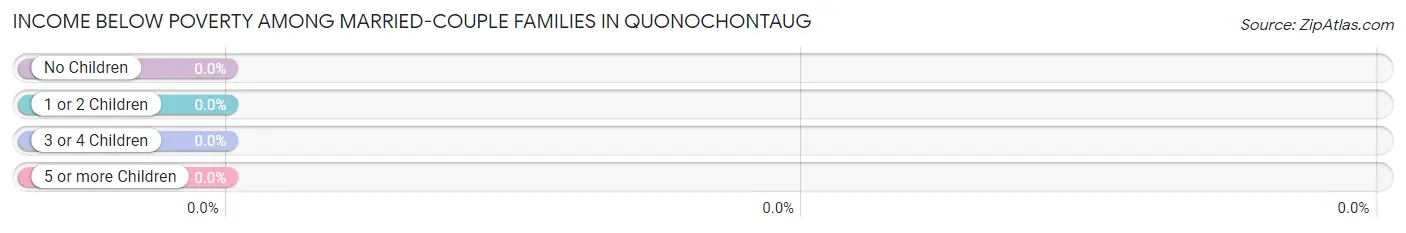
Income Below Poverty Among Married-Couple Families in Quonochontaug
| Children | Above Poverty | Below Poverty |
| No Children | 156 (100.0%) | 0 (0.0%) |
| 1 or 2 Children | 6 (100.0%) | 0 (0.0%) |
| 3 or 4 Children | 0 (0.0%) | 0 (0.0%) |
| 5 or more Children | 0 (0.0%) | 0 (0.0%) |
| Total | 162 (100.0%) | 0 (0.0%) |
Income Below Poverty Among Single-Parent Households in Quonochontaug
| Children | Single Father | Single Mother |
| No Children | 0 (0.0%) | 0 (0.0%) |
| 1 or 2 Children | 0 (0.0%) | 0 (0.0%) |
| 3 or 4 Children | 0 (0.0%) | 0 (0.0%) |
| 5 or more Children | 0 (0.0%) | 0 (0.0%) |
| Total | 0 (0.0%) | 0 (0.0%) |
Income Below Poverty Among Married-Couple vs Single-Parent Households in Quonochontaug
| Children | Married-Couple Families | Single-Parent Households |
| No Children | 0 (0.0%) | 0 (0.0%) |
| 1 or 2 Children | 0 (0.0%) | 0 (0.0%) |
| 3 or 4 Children | 0 (0.0%) | 0 (0.0%) |
| 5 or more Children | 0 (0.0%) | 0 (0.0%) |
| Total | 0 (0.0%) | 0 (0.0%) |
Race in Quonochontaug
The most populous races in Quonochontaug are White / Caucasian (434 | 96.0%), Hispanic or Latino (18 | 4.0%), and Two or more Races (18 | 4.0%).
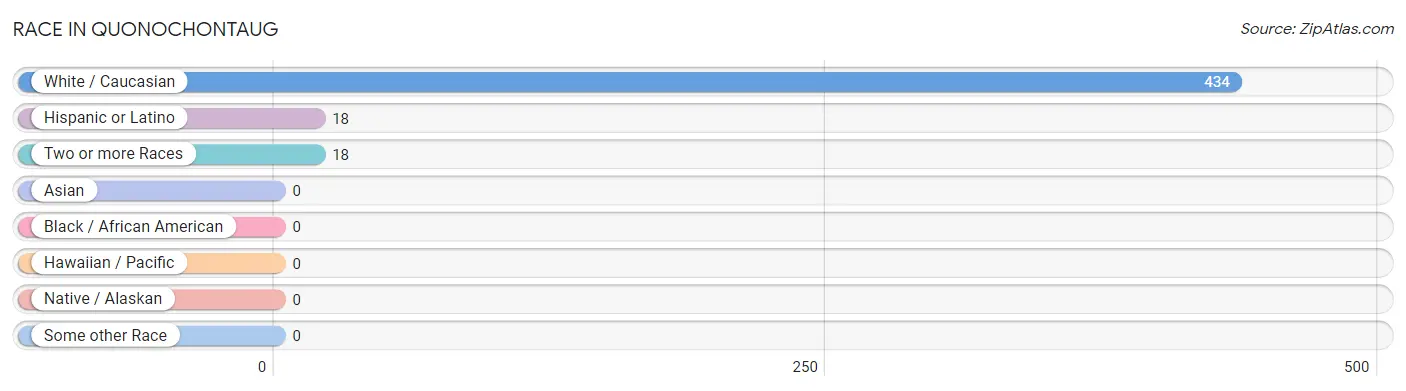
| Race | # Population | % Population |
| Asian | 0 | 0.0% |
| Black / African American | 0 | 0.0% |
| Hawaiian / Pacific | 0 | 0.0% |
| Hispanic or Latino | 18 | 4.0% |
| Native / Alaskan | 0 | 0.0% |
| White / Caucasian | 434 | 96.0% |
| Two or more Races | 18 | 4.0% |
| Some other Race | 0 | 0.0% |
| Total | 452 | 100.0% |
Ancestry in Quonochontaug
The most populous ancestries reported in Quonochontaug are English (153 | 33.9%), Irish (106 | 23.4%), German (55 | 12.2%), Swedish (28 | 6.2%), and European (25 | 5.5%), together accounting for 81.2% of all Quonochontaug residents.
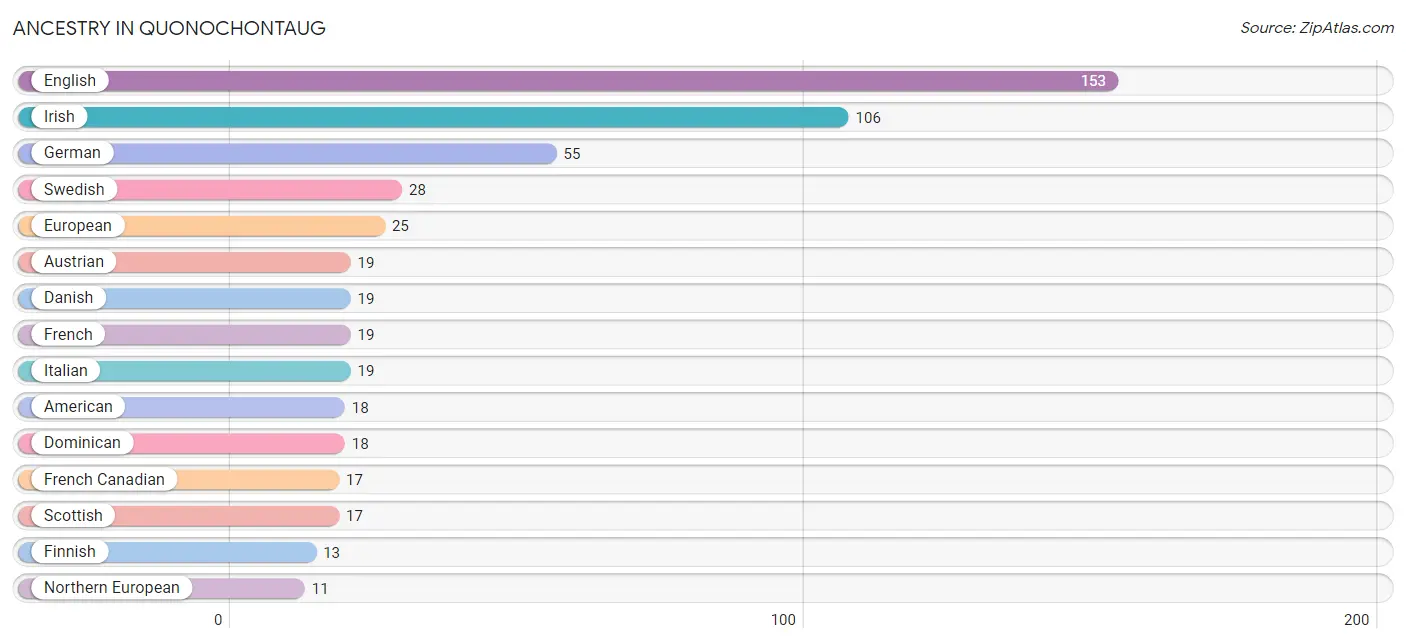
| Ancestry | # Population | % Population |
| American | 18 | 4.0% |
| Austrian | 19 | 4.2% |
| Danish | 19 | 4.2% |
| Dominican | 18 | 4.0% |
| English | 153 | 33.9% |
| European | 25 | 5.5% |
| Finnish | 13 | 2.9% |
| French | 19 | 4.2% |
| French Canadian | 17 | 3.8% |
| German | 55 | 12.2% |
| Irish | 106 | 23.4% |
| Italian | 19 | 4.2% |
| Northern European | 11 | 2.4% |
| Pennsylvania German | 8 | 1.8% |
| Polish | 10 | 2.2% |
| Scottish | 17 | 3.8% |
| Swedish | 28 | 6.2% | View All 17 Rows |
Immigrants in Quonochontaug
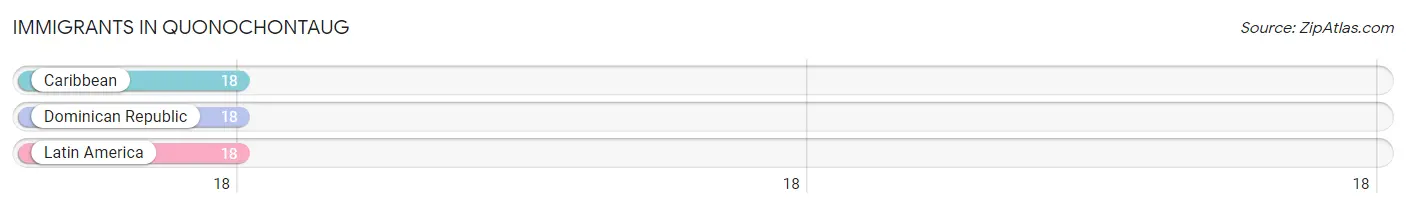
The most numerous immigrant groups reported in Quonochontaug came from Caribbean (18 | 4.0%), Dominican Republic (18 | 4.0%), and Latin America (18 | 4.0%), together accounting for 11.9% of all Quonochontaug residents.
| Immigration Origin | # Population | % Population |
| Caribbean | 18 | 4.0% |
| Dominican Republic | 18 | 4.0% |
| Latin America | 18 | 4.0% | View All 3 Rows |
Sex and Age in Quonochontaug
Sex and Age in Quonochontaug
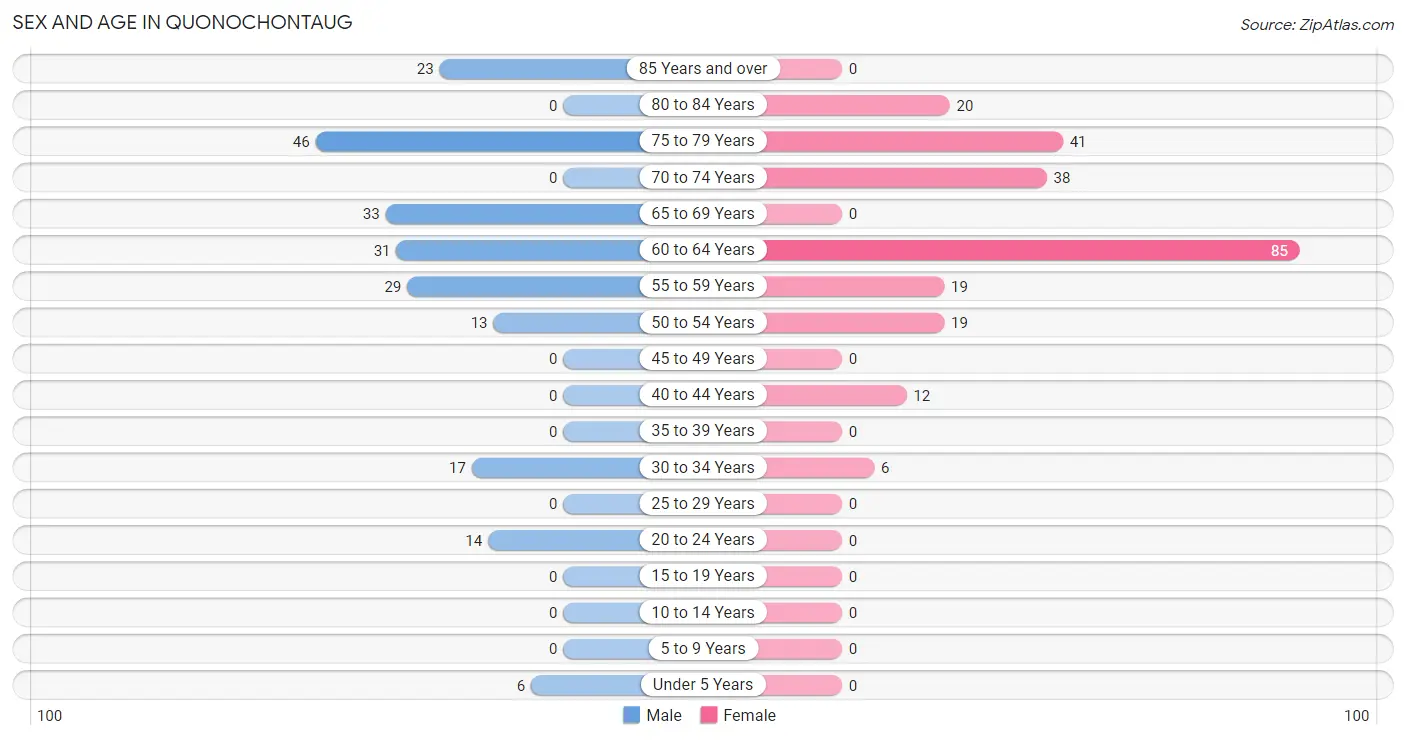
The most populous age groups in Quonochontaug are 75 to 79 Years (46 | 21.7%) for men and 60 to 64 Years (85 | 35.4%) for women.
| Age Bracket | Male | Female |
| Under 5 Years | 6 (2.8%) | 0 (0.0%) |
| 5 to 9 Years | 0 (0.0%) | 0 (0.0%) |
| 10 to 14 Years | 0 (0.0%) | 0 (0.0%) |
| 15 to 19 Years | 0 (0.0%) | 0 (0.0%) |
| 20 to 24 Years | 14 (6.6%) | 0 (0.0%) |
| 25 to 29 Years | 0 (0.0%) | 0 (0.0%) |
| 30 to 34 Years | 17 (8.0%) | 6 (2.5%) |
| 35 to 39 Years | 0 (0.0%) | 0 (0.0%) |
| 40 to 44 Years | 0 (0.0%) | 12 (5.0%) |
| 45 to 49 Years | 0 (0.0%) | 0 (0.0%) |
| 50 to 54 Years | 13 (6.1%) | 19 (7.9%) |
| 55 to 59 Years | 29 (13.7%) | 19 (7.9%) |
| 60 to 64 Years | 31 (14.6%) | 85 (35.4%) |
| 65 to 69 Years | 33 (15.6%) | 0 (0.0%) |
| 70 to 74 Years | 0 (0.0%) | 38 (15.8%) |
| 75 to 79 Years | 46 (21.7%) | 41 (17.1%) |
| 80 to 84 Years | 0 (0.0%) | 20 (8.3%) |
| 85 Years and over | 23 (10.8%) | 0 (0.0%) |
| Total | 212 (100.0%) | 240 (100.0%) |
Families and Households in Quonochontaug
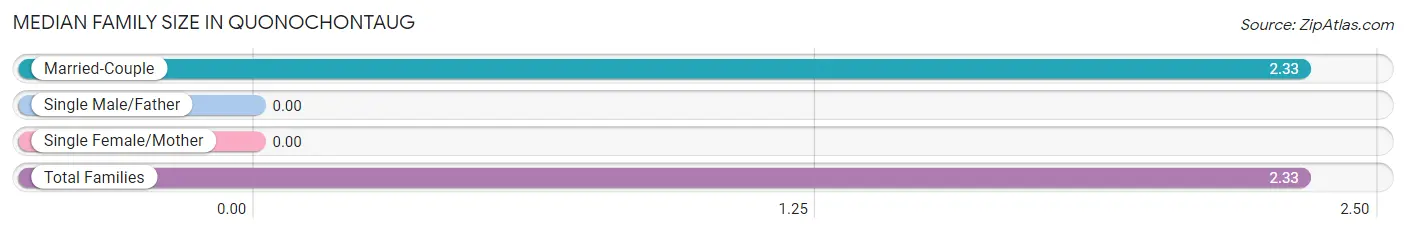
Median Family Size in Quonochontaug
| Family Type | # Families | Family Size |
| Married-Couple | 162 (100.0%) | 2.33 |
| Single Male/Father | 0 (0.0%) | - |
| Single Female/Mother | 0 (0.0%) | - |
| Total Families | 162 (100.0%) | 2.33 |
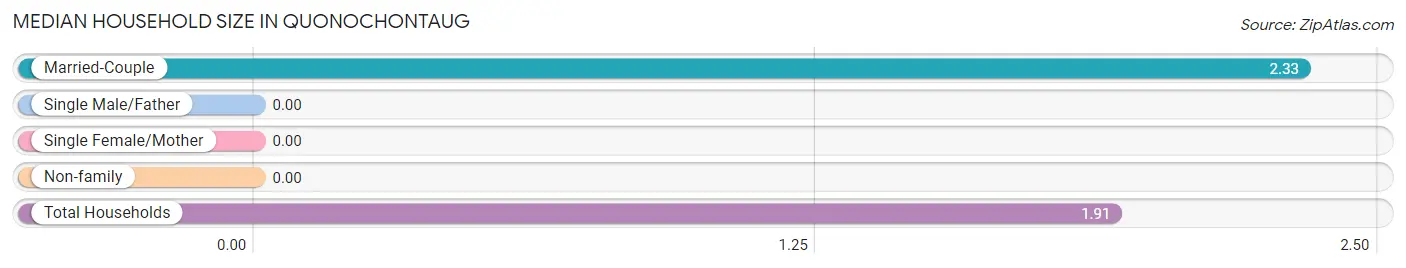
Median Household Size in Quonochontaug
| Household Type | # Households | Household Size |
| Married-Couple | 162 (68.3%) | 2.33 |
| Single Male/Father | 0 (0.0%) | - |
| Single Female/Mother | 0 (0.0%) | - |
| Non-family | 75 (31.7%) | - |
| Total Households | 237 (100.0%) | 1.91 |
Household Size by Marriage Status in Quonochontaug
Out of a total of 237 households in Quonochontaug, 162 (68.3%) are family households, while 75 (31.7%) are nonfamily households. The most numerous type of family households are 2-person households, comprising 138, and the most common type of nonfamily households are 1-person households, comprising 75.
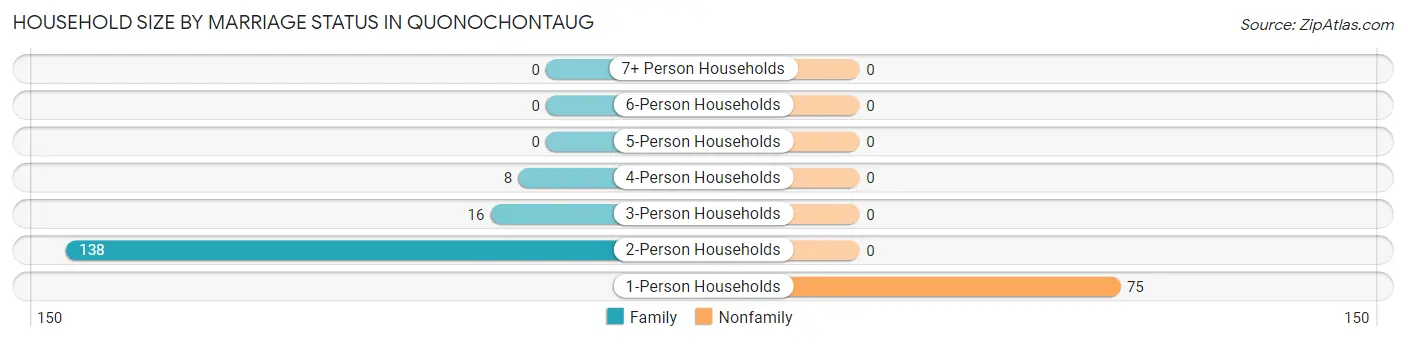
| Household Size | Family Households | Nonfamily Households |
| 1-Person Households | - | 75 (31.7%) |
| 2-Person Households | 138 (58.2%) | 0 (0.0%) |
| 3-Person Households | 16 (6.8%) | 0 (0.0%) |
| 4-Person Households | 8 (3.4%) | 0 (0.0%) |
| 5-Person Households | 0 (0.0%) | 0 (0.0%) |
| 6-Person Households | 0 (0.0%) | 0 (0.0%) |
| 7+ Person Households | 0 (0.0%) | 0 (0.0%) |
| Total | 162 (68.3%) | 75 (31.7%) |
Female Fertility in Quonochontaug
Fertility by Age in Quonochontaug
| Age Bracket | Women with Births | Births / 1,000 Women |
| 15 to 19 years | 0 (0.0%) | 0.0 |
| 20 to 34 years | 0 (0.0%) | 0.0 |
| 35 to 50 years | 0 (0.0%) | 0.0 |
| Total | 0 (0.0%) | 0.0 |
Fertility by Age by Marriage Status in Quonochontaug
| Age Bracket | Married | Unmarried |
| 15 to 19 years | 0 (0.0%) | 0 (0.0%) |
| 20 to 34 years | 0 (0.0%) | 0 (0.0%) |
| 35 to 50 years | 0 (0.0%) | 0 (0.0%) |
| Total | 0 (0.0%) | 0 (0.0%) |
Fertility by Education in Quonochontaug
| Educational Attainment | Women with Births | Births / 1,000 Women |
| Less than High School | 0 (0.0%) | 0.0 |
| High School Diploma | 0 (0.0%) | 0.0 |
| College or Associate's Degree | 0 (0.0%) | 0.0 |
| Bachelor's Degree | 0 (0.0%) | 0.0 |
| Graduate Degree | 0 (0.0%) | 0.0 |
| Total | 0 (0.0%) | 0.0 |
Fertility by Education by Marriage Status in Quonochontaug
| Educational Attainment | Married | Unmarried |
| Less than High School | 0 (0.0%) | 0 (0.0%) |
| High School Diploma | 0 (0.0%) | 0 (0.0%) |
| College or Associate's Degree | 0 (0.0%) | 0 (0.0%) |
| Bachelor's Degree | 0 (0.0%) | 0 (0.0%) |
| Graduate Degree | 0 (0.0%) | 0 (0.0%) |
| Total | 0 (0.0%) | 0 (0.0%) |
Employment Characteristics in Quonochontaug
Employment by Class of Employer in Quonochontaug
Among the 192 employed individuals in Quonochontaug, private company employees (65 | 33.9%), not-for-profit organizations (64 | 33.3%), and self-employed (not incorporated) (45 | 23.4%) make up the most common classes of employment.
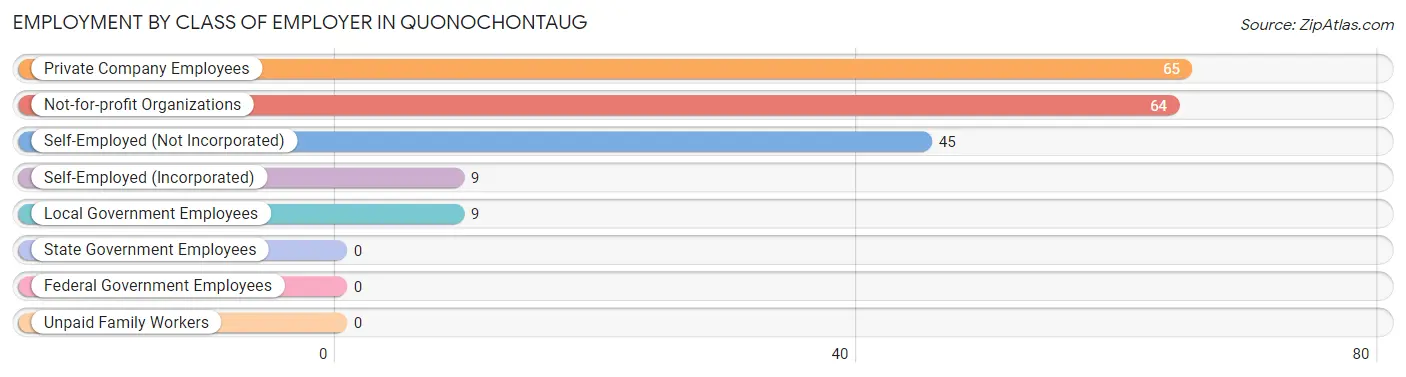
| Employer Class | # Employees | % Employees |
| Private Company Employees | 65 | 33.9% |
| Self-Employed (Incorporated) | 9 | 4.7% |
| Self-Employed (Not Incorporated) | 45 | 23.4% |
| Not-for-profit Organizations | 64 | 33.3% |
| Local Government Employees | 9 | 4.7% |
| State Government Employees | 0 | 0.0% |
| Federal Government Employees | 0 | 0.0% |
| Unpaid Family Workers | 0 | 0.0% |
| Total | 192 | 100.0% |
Employment Status by Age in Quonochontaug
According to the labor force statistics for Quonochontaug, out of the total population over 16 years of age (446), 49.3% or 220 individuals are in the labor force, with 12.7% or 28 of them unemployed. The age group with the highest labor force participation rate is 20 to 24 years, with 100.0% or 14 individuals in the labor force. Within the labor force, the 30 to 34 years age range has the highest percentage of unemployed individuals, with 50.0% or 6 of them being unemployed.
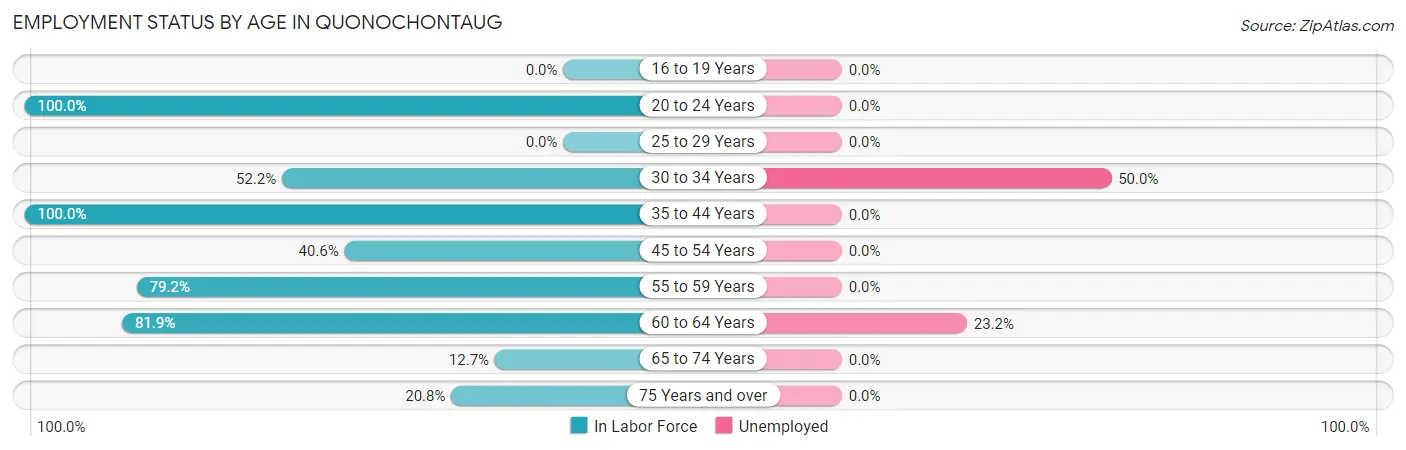
| Age Bracket | In Labor Force | Unemployed |
| 16 to 19 Years | 0 (0.0%) | 0 (0.0%) |
| 20 to 24 Years | 14 (100.0%) | 0 (0.0%) |
| 25 to 29 Years | 0 (0.0%) | 0 (0.0%) |
| 30 to 34 Years | 12 (52.2%) | 6 (50.0%) |
| 35 to 44 Years | 12 (100.0%) | 0 (0.0%) |
| 45 to 54 Years | 13 (40.6%) | 0 (0.0%) |
| 55 to 59 Years | 38 (79.2%) | 0 (0.0%) |
| 60 to 64 Years | 95 (81.9%) | 22 (23.2%) |
| 65 to 74 Years | 9 (12.7%) | 0 (0.0%) |
| 75 Years and over | 27 (20.8%) | 0 (0.0%) |
| Total | 220 (49.3%) | 28 (12.7%) |
Employment Status by Educational Attainment in Quonochontaug
According to labor force statistics for Quonochontaug, 73.6% of individuals (170) out of the total population between 25 and 64 years of age (231) are in the labor force, with 16.5% or 28 of them being unemployed. The group with the highest labor force participation rate are those with the educational attainment of college / associate degree, with 100.0% or 31 individuals in the labor force. Within the labor force, individuals with high school diploma education have the highest percentage of unemployment, with 100.0% or 6 of them being unemployed.
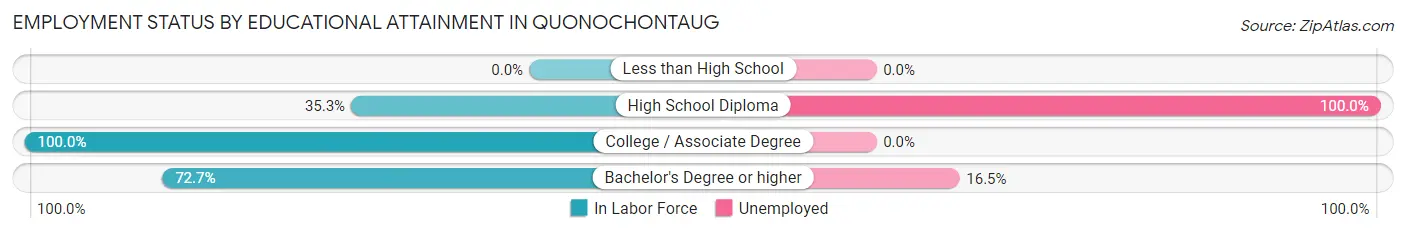
| Educational Attainment | In Labor Force | Unemployed |
| Less than High School | 0 (0.0%) | 0 (0.0%) |
| High School Diploma | 6 (35.3%) | 17 (100.0%) |
| College / Associate Degree | 31 (100.0%) | 0 (0.0%) |
| Bachelor's Degree or higher | 133 (72.7%) | 30 (16.5%) |
| Total | 170 (73.6%) | 38 (16.5%) |
Employment Occupations by Sex in Quonochontaug
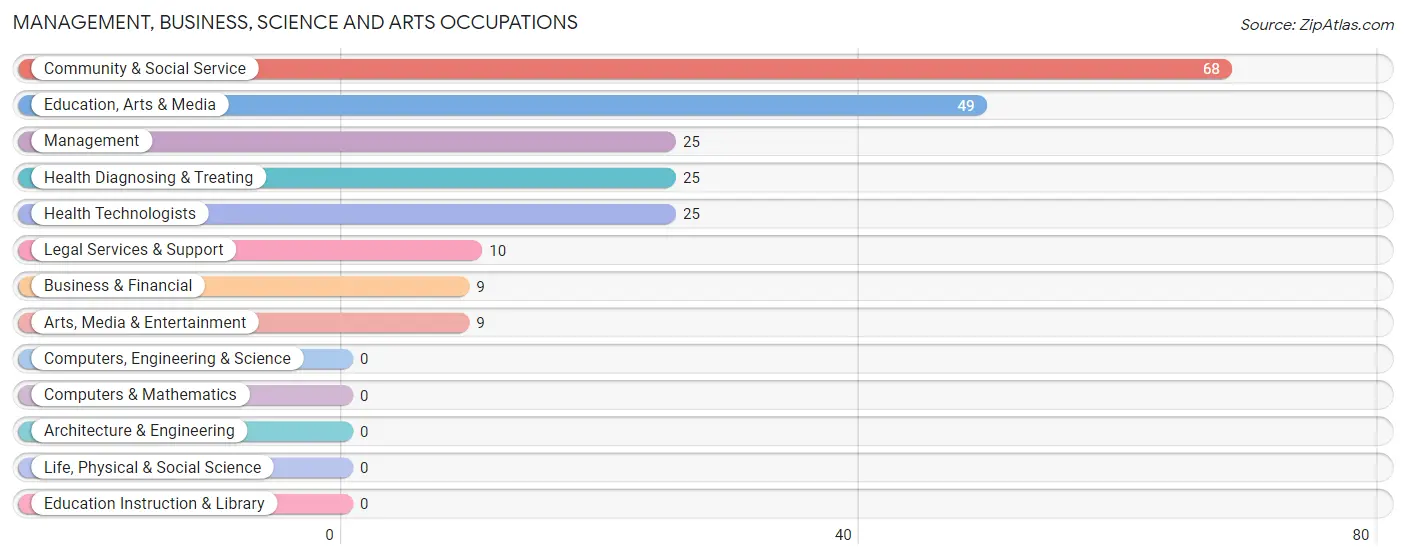
Management, Business, Science and Arts Occupations
The most common Management, Business, Science and Arts occupations in Quonochontaug are Community & Social Service (68 | 35.4%), Education, Arts & Media (49 | 25.5%), Management (25 | 13.0%), Health Diagnosing & Treating (25 | 13.0%), and Health Technologists (25 | 13.0%).
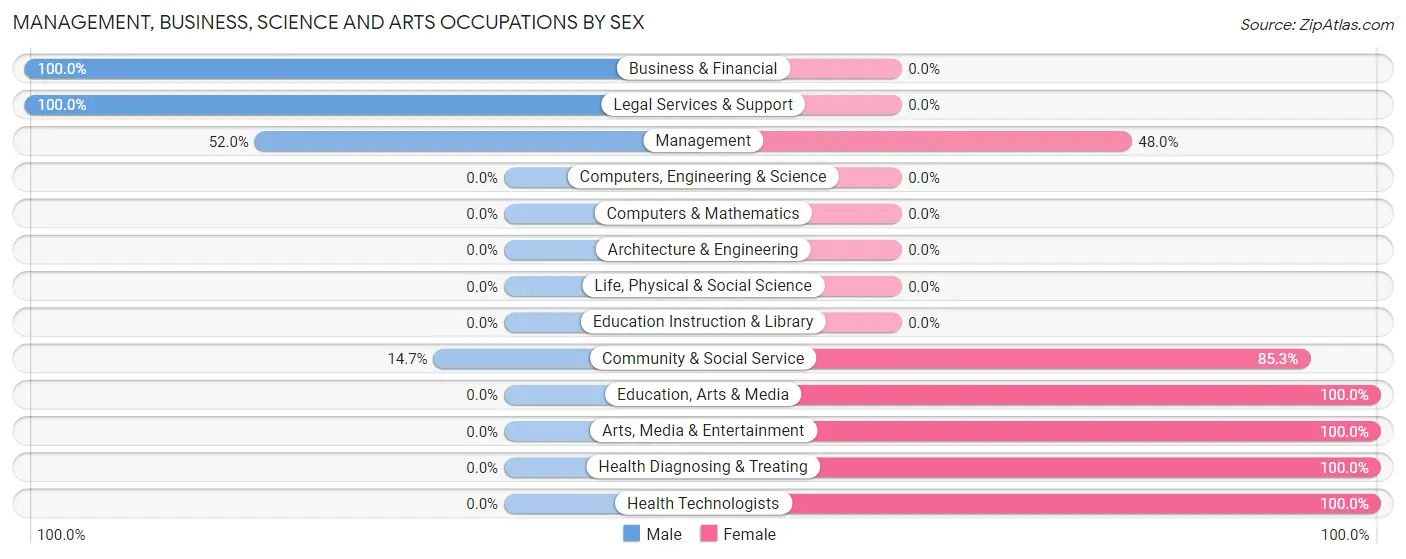
Management, Business, Science and Arts Occupations by Sex
Within the Management, Business, Science and Arts occupations in Quonochontaug, the most male-oriented occupations are Business & Financial (100.0%), Legal Services & Support (100.0%), and Management (52.0%), while the most female-oriented occupations are Education, Arts & Media (100.0%), Arts, Media & Entertainment (100.0%), and Health Diagnosing & Treating (100.0%).
| Occupation | Male | Female |
| Management | 13 (52.0%) | 12 (48.0%) |
| Business & Financial | 9 (100.0%) | 0 (0.0%) |
| Computers, Engineering & Science | 0 (0.0%) | 0 (0.0%) |
| Computers & Mathematics | 0 (0.0%) | 0 (0.0%) |
| Architecture & Engineering | 0 (0.0%) | 0 (0.0%) |
| Life, Physical & Social Science | 0 (0.0%) | 0 (0.0%) |
| Community & Social Service | 10 (14.7%) | 58 (85.3%) |
| Education, Arts & Media | 0 (0.0%) | 49 (100.0%) |
| Legal Services & Support | 10 (100.0%) | 0 (0.0%) |
| Education Instruction & Library | 0 (0.0%) | 0 (0.0%) |
| Arts, Media & Entertainment | 0 (0.0%) | 9 (100.0%) |
| Health Diagnosing & Treating | 0 (0.0%) | 25 (100.0%) |
| Health Technologists | 0 (0.0%) | 25 (100.0%) |
| Total (Category) | 32 (25.2%) | 95 (74.8%) |
| Total (Overall) | 91 (47.4%) | 101 (52.6%) |
Services Occupations
Services Occupations by Sex
| Occupation | Male | Female |
| Healthcare Support | 0 (0.0%) | 0 (0.0%) |
| Security & Protection | 0 (0.0%) | 0 (0.0%) |
| Firefighting & Prevention | 0 (0.0%) | 0 (0.0%) |
| Law Enforcement | 0 (0.0%) | 0 (0.0%) |
| Food Preparation & Serving | 0 (0.0%) | 0 (0.0%) |
| Cleaning & Maintenance | 0 (0.0%) | 0 (0.0%) |
| Personal Care & Service | 0 (0.0%) | 0 (0.0%) |
| Total (Category) | 0 (0.0%) | 0 (0.0%) |
| Total (Overall) | 91 (47.4%) | 101 (52.6%) |
Sales and Office Occupations
The most common Sales and Office occupations in Quonochontaug are Sales & Related (50 | 26.0%), and Office & Administration (6 | 3.1%).
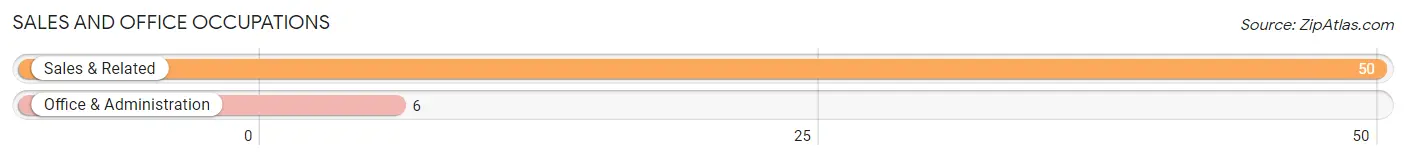
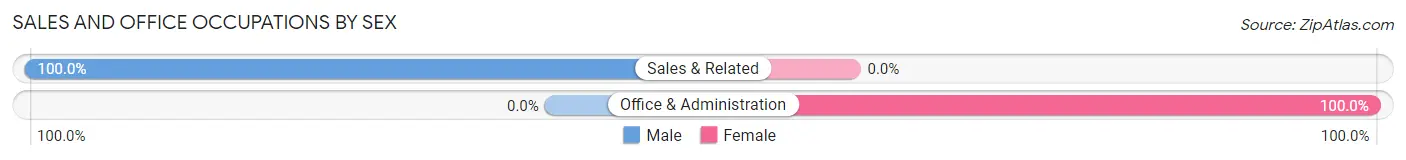
Sales and Office Occupations by Sex
| Occupation | Male | Female |
| Sales & Related | 50 (100.0%) | 0 (0.0%) |
| Office & Administration | 0 (0.0%) | 6 (100.0%) |
| Total (Category) | 50 (89.3%) | 6 (10.7%) |
| Total (Overall) | 91 (47.4%) | 101 (52.6%) |
Natural Resources, Construction and Maintenance Occupations
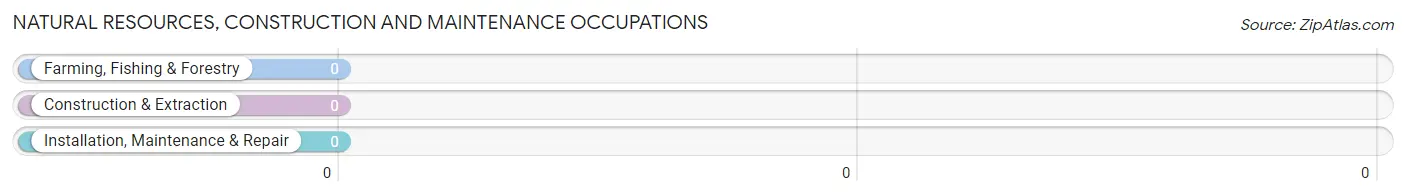
Natural Resources, Construction and Maintenance Occupations by Sex
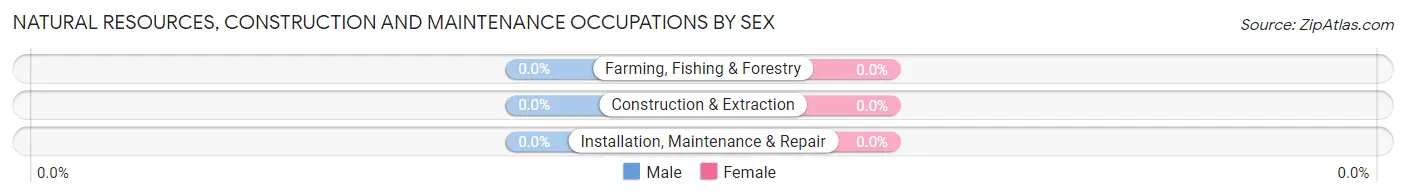
| Occupation | Male | Female |
| Farming, Fishing & Forestry | 0 (0.0%) | 0 (0.0%) |
| Construction & Extraction | 0 (0.0%) | 0 (0.0%) |
| Installation, Maintenance & Repair | 0 (0.0%) | 0 (0.0%) |
| Total (Category) | 0 (0.0%) | 0 (0.0%) |
| Total (Overall) | 91 (47.4%) | 101 (52.6%) |
Production, Transportation and Moving Occupations
The most common Production, Transportation and Moving occupations in Quonochontaug are , and Transportation (9 | 4.7%).
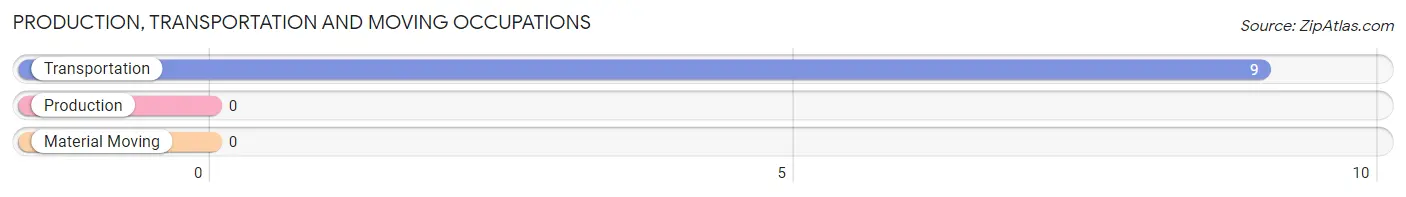
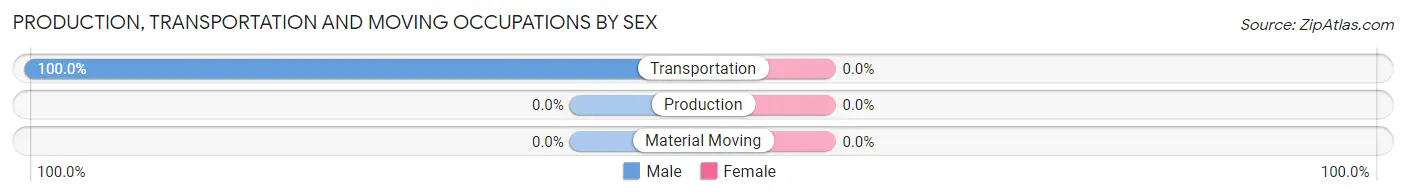
Production, Transportation and Moving Occupations by Sex
| Occupation | Male | Female |
| Production | 0 (0.0%) | 0 (0.0%) |
| Transportation | 9 (100.0%) | 0 (0.0%) |
| Material Moving | 0 (0.0%) | 0 (0.0%) |
| Total (Category) | 9 (100.0%) | 0 (0.0%) |
| Total (Overall) | 91 (47.4%) | 101 (52.6%) |
Employment Industries by Sex in Quonochontaug
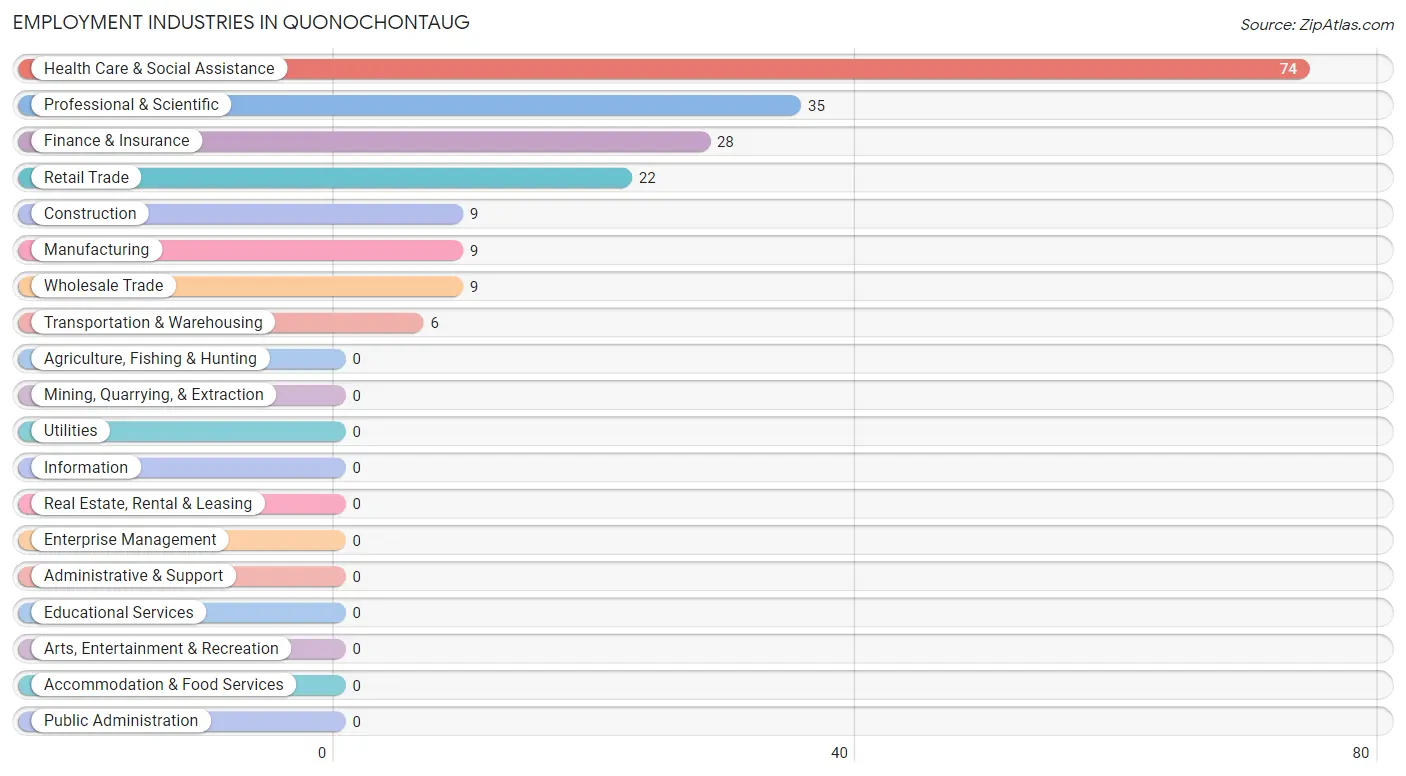
Employment Industries in Quonochontaug
The major employment industries in Quonochontaug include Health Care & Social Assistance (74 | 38.5%), Professional & Scientific (35 | 18.2%), Finance & Insurance (28 | 14.6%), Retail Trade (22 | 11.5%), and Construction (9 | 4.7%).
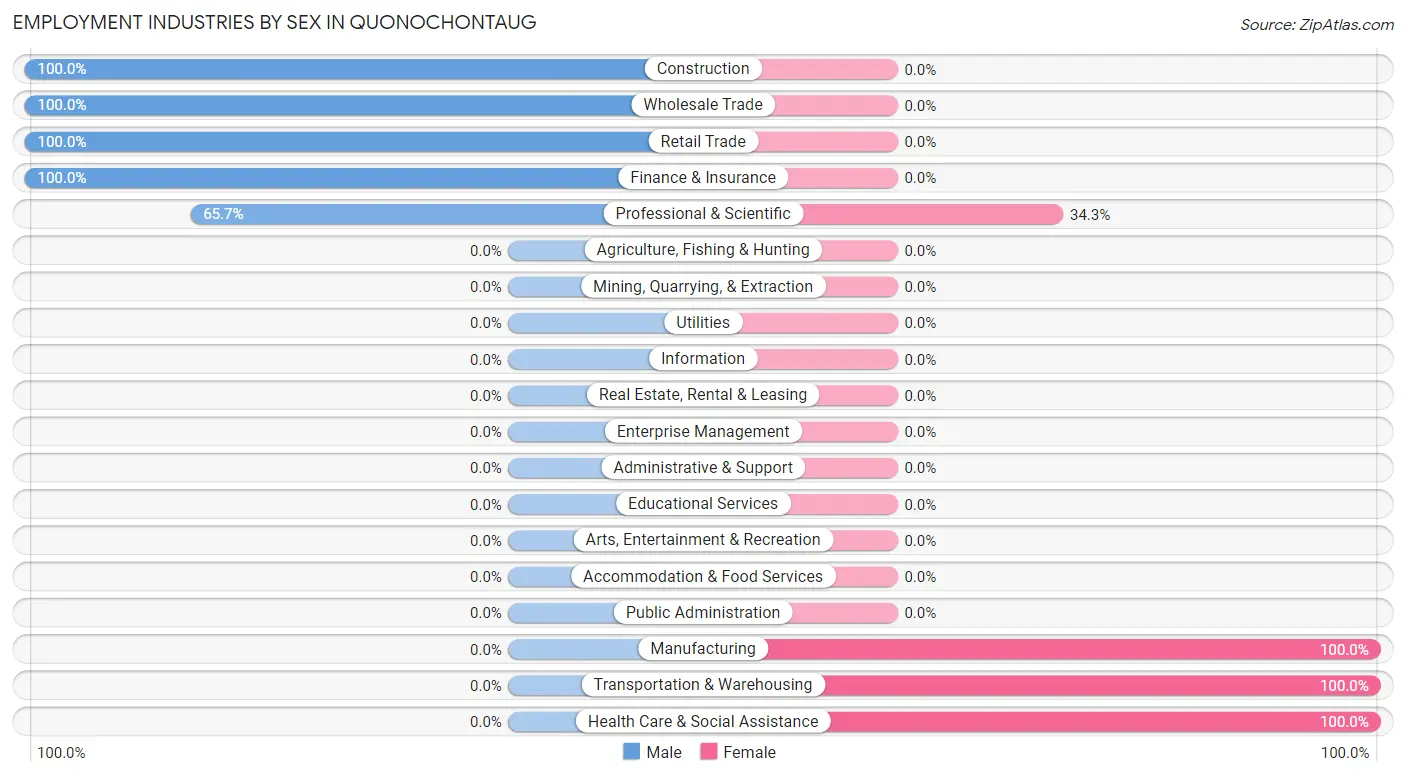
Employment Industries by Sex in Quonochontaug
The Quonochontaug industries that see more men than women are Construction (100.0%), Wholesale Trade (100.0%), and Retail Trade (100.0%), whereas the industries that tend to have a higher number of women are Manufacturing (100.0%), Transportation & Warehousing (100.0%), and Health Care & Social Assistance (100.0%).
| Industry | Male | Female |
| Agriculture, Fishing & Hunting | 0 (0.0%) | 0 (0.0%) |
| Mining, Quarrying, & Extraction | 0 (0.0%) | 0 (0.0%) |
| Construction | 9 (100.0%) | 0 (0.0%) |
| Manufacturing | 0 (0.0%) | 9 (100.0%) |
| Wholesale Trade | 9 (100.0%) | 0 (0.0%) |
| Retail Trade | 22 (100.0%) | 0 (0.0%) |
| Transportation & Warehousing | 0 (0.0%) | 6 (100.0%) |
| Utilities | 0 (0.0%) | 0 (0.0%) |
| Information | 0 (0.0%) | 0 (0.0%) |
| Finance & Insurance | 28 (100.0%) | 0 (0.0%) |
| Real Estate, Rental & Leasing | 0 (0.0%) | 0 (0.0%) |
| Professional & Scientific | 23 (65.7%) | 12 (34.3%) |
| Enterprise Management | 0 (0.0%) | 0 (0.0%) |
| Administrative & Support | 0 (0.0%) | 0 (0.0%) |
| Educational Services | 0 (0.0%) | 0 (0.0%) |
| Health Care & Social Assistance | 0 (0.0%) | 74 (100.0%) |
| Arts, Entertainment & Recreation | 0 (0.0%) | 0 (0.0%) |
| Accommodation & Food Services | 0 (0.0%) | 0 (0.0%) |
| Public Administration | 0 (0.0%) | 0 (0.0%) |
| Total | 91 (47.4%) | 101 (52.6%) |
Education in Quonochontaug
School Enrollment in Quonochontaug
| School Level | # Students | % Students |
| Nursery / Preschool | 0 | 0.0% |
| Kindergarten | 0 | 0.0% |
| Elementary School | 0 | 0.0% |
| Middle School | 0 | 0.0% |
| High School | 0 | 0.0% |
| College / Undergraduate | 0 | 0.0% |
| Graduate / Professional | 0 | 0.0% |
| Total | 0 | 0.0% |
School Enrollment by Age by Funding Source in Quonochontaug
| Age Bracket | Public School | Private School |
| 3 to 4 Year Olds | 0 (0.0%) | 0 (0.0%) |
| 5 to 9 Year Old | 0 (0.0%) | 0 (0.0%) |
| 10 to 14 Year Olds | 0 (0.0%) | 0 (0.0%) |
| 15 to 17 Year Olds | 0 (0.0%) | 0 (0.0%) |
| 18 to 19 Year Olds | 0 (0.0%) | 0 (0.0%) |
| 20 to 24 Year Olds | 0 (0.0%) | 0 (0.0%) |
| 25 to 34 Year Olds | 0 (0.0%) | 0 (0.0%) |
| 35 Years and over | 0 (0.0%) | 0 (0.0%) |
| Total | 0 (0.0%) | 0 (0.0%) |
Educational Attainment by Field of Study in Quonochontaug
Social sciences (60 | 18.1%), liberal arts & history (40 | 12.1%), visual & performing arts (39 | 11.8%), education (38 | 11.5%), and physical & health sciences (32 | 9.7%) are the most common fields of study among 331 individuals in Quonochontaug who have obtained a bachelor's degree or higher.
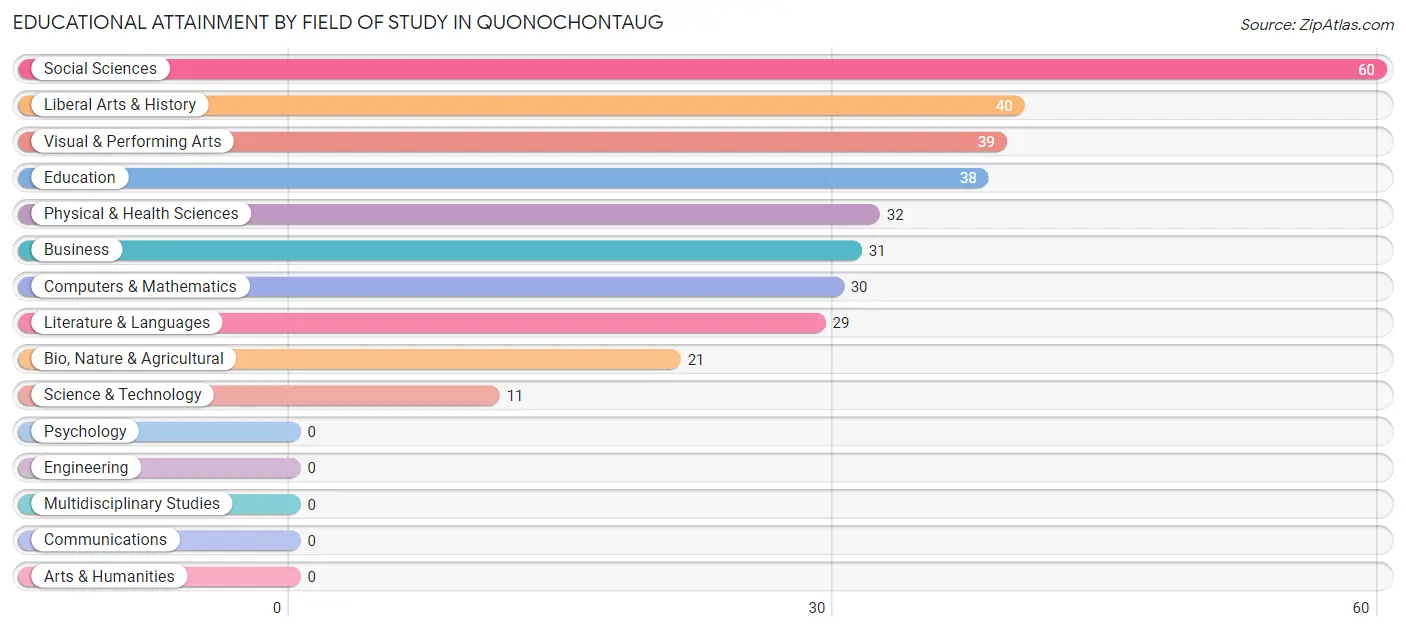
| Field of Study | # Graduates | % Graduates |
| Computers & Mathematics | 30 | 9.1% |
| Bio, Nature & Agricultural | 21 | 6.3% |
| Physical & Health Sciences | 32 | 9.7% |
| Psychology | 0 | 0.0% |
| Social Sciences | 60 | 18.1% |
| Engineering | 0 | 0.0% |
| Multidisciplinary Studies | 0 | 0.0% |
| Science & Technology | 11 | 3.3% |
| Business | 31 | 9.4% |
| Education | 38 | 11.5% |
| Literature & Languages | 29 | 8.8% |
| Liberal Arts & History | 40 | 12.1% |
| Visual & Performing Arts | 39 | 11.8% |
| Communications | 0 | 0.0% |
| Arts & Humanities | 0 | 0.0% |
| Total | 331 | 100.0% |
Transportation & Commute in Quonochontaug
Vehicle Availability by Sex in Quonochontaug
The most prevalent vehicle ownership categories in Quonochontaug are males with 2 vehicles (73, accounting for 80.2%) and females with 2 vehicles (28, making up 72.3%).
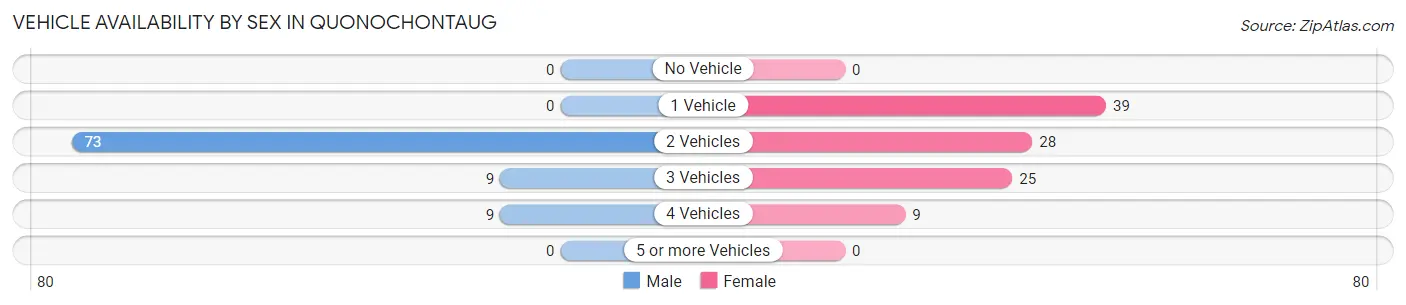
| Vehicles Available | Male | Female |
| No Vehicle | 0 (0.0%) | 0 (0.0%) |
| 1 Vehicle | 0 (0.0%) | 39 (38.6%) |
| 2 Vehicles | 73 (80.2%) | 28 (27.7%) |
| 3 Vehicles | 9 (9.9%) | 25 (24.7%) |
| 4 Vehicles | 9 (9.9%) | 9 (8.9%) |
| 5 or more Vehicles | 0 (0.0%) | 0 (0.0%) |
| Total | 91 (100.0%) | 101 (100.0%) |
Commute Time in Quonochontaug
The most frequently occuring commute durations in Quonochontaug are 40 to 44 minutes (34 commuters, 33.0%), 15 to 19 minutes (26 commuters, 25.2%), and 90 or more minutes (14 commuters, 13.6%).
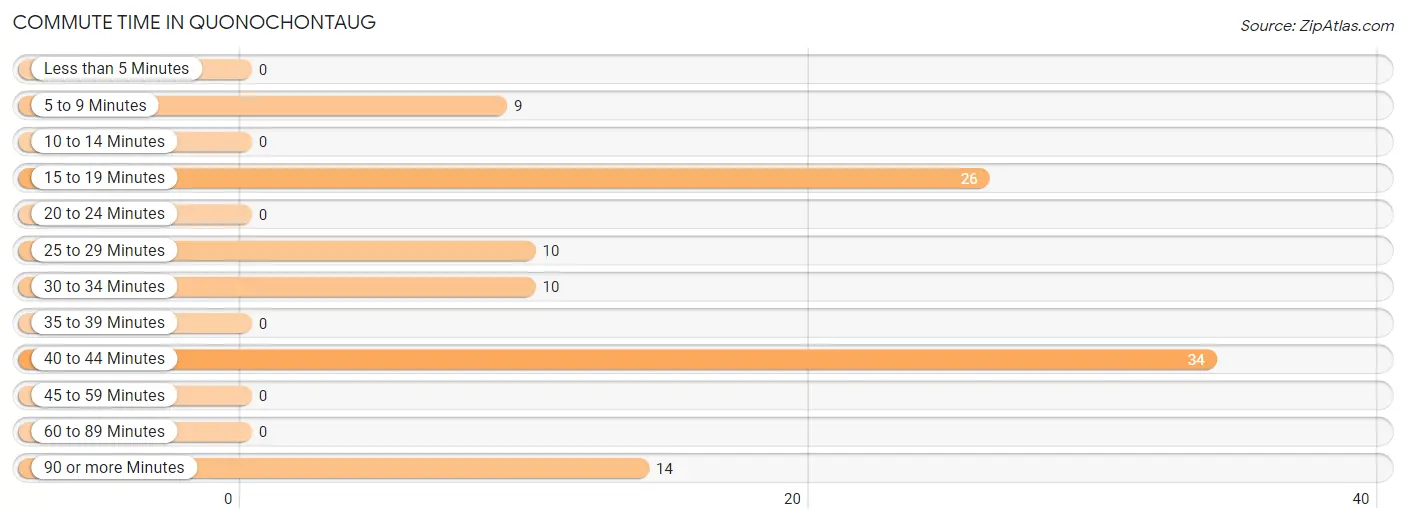
| Commute Time | # Commuters | % Commuters |
| Less than 5 Minutes | 0 | 0.0% |
| 5 to 9 Minutes | 9 | 8.7% |
| 10 to 14 Minutes | 0 | 0.0% |
| 15 to 19 Minutes | 26 | 25.2% |
| 20 to 24 Minutes | 0 | 0.0% |
| 25 to 29 Minutes | 10 | 9.7% |
| 30 to 34 Minutes | 10 | 9.7% |
| 35 to 39 Minutes | 0 | 0.0% |
| 40 to 44 Minutes | 34 | 33.0% |
| 45 to 59 Minutes | 0 | 0.0% |
| 60 to 89 Minutes | 0 | 0.0% |
| 90 or more Minutes | 14 | 13.6% |
Commute Time by Sex in Quonochontaug
The most common commute times in Quonochontaug are 15 to 19 minutes (17 commuters, 28.8%) for males and 40 to 44 minutes (25 commuters, 56.8%) for females.
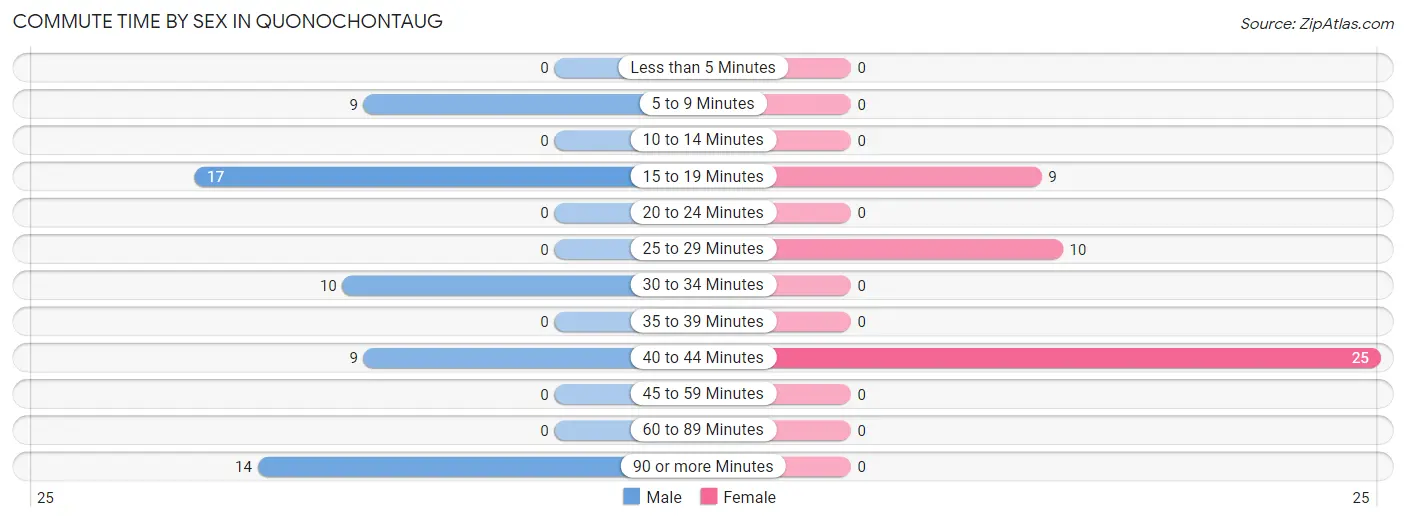
| Commute Time | Male | Female |
| Less than 5 Minutes | 0 (0.0%) | 0 (0.0%) |
| 5 to 9 Minutes | 9 (15.2%) | 0 (0.0%) |
| 10 to 14 Minutes | 0 (0.0%) | 0 (0.0%) |
| 15 to 19 Minutes | 17 (28.8%) | 9 (20.4%) |
| 20 to 24 Minutes | 0 (0.0%) | 0 (0.0%) |
| 25 to 29 Minutes | 0 (0.0%) | 10 (22.7%) |
| 30 to 34 Minutes | 10 (17.0%) | 0 (0.0%) |
| 35 to 39 Minutes | 0 (0.0%) | 0 (0.0%) |
| 40 to 44 Minutes | 9 (15.2%) | 25 (56.8%) |
| 45 to 59 Minutes | 0 (0.0%) | 0 (0.0%) |
| 60 to 89 Minutes | 0 (0.0%) | 0 (0.0%) |
| 90 or more Minutes | 14 (23.7%) | 0 (0.0%) |
Time of Departure to Work by Sex in Quonochontaug
The most frequent times of departure to work in Quonochontaug are 6:30 AM to 6:59 AM (23, 39.0%) for males and 7:00 AM to 7:29 AM (25, 56.8%) for females.
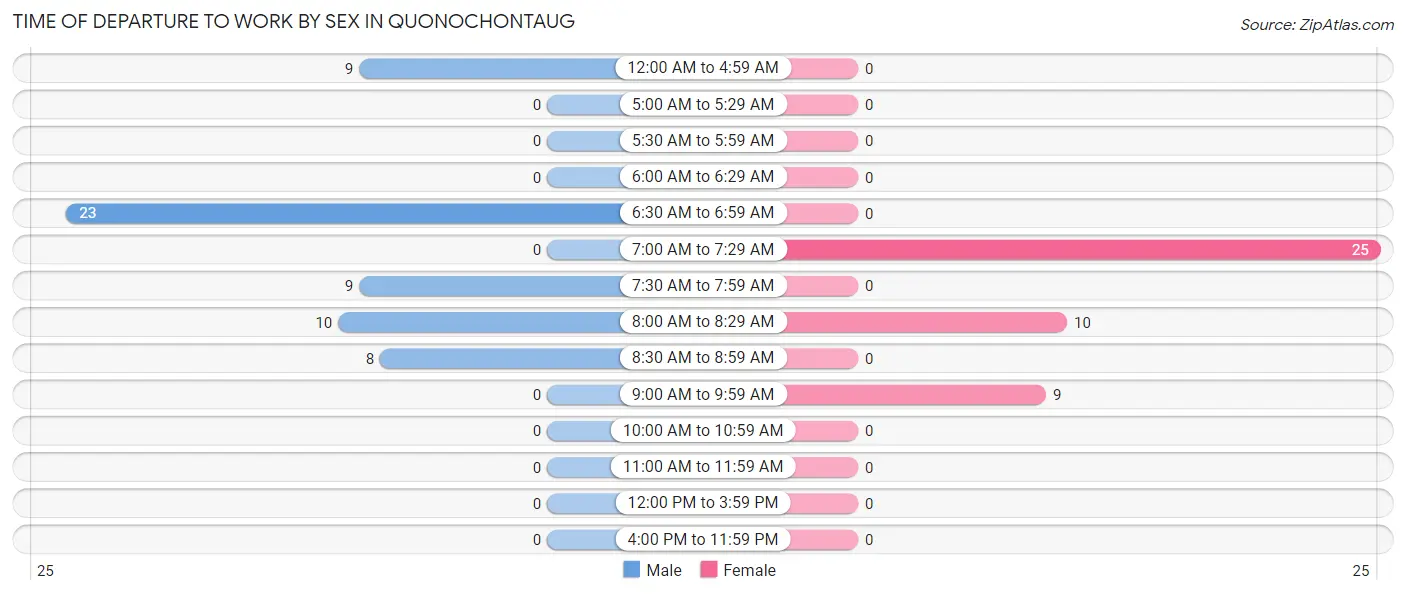
| Time of Departure | Male | Female |
| 12:00 AM to 4:59 AM | 9 (15.2%) | 0 (0.0%) |
| 5:00 AM to 5:29 AM | 0 (0.0%) | 0 (0.0%) |
| 5:30 AM to 5:59 AM | 0 (0.0%) | 0 (0.0%) |
| 6:00 AM to 6:29 AM | 0 (0.0%) | 0 (0.0%) |
| 6:30 AM to 6:59 AM | 23 (39.0%) | 0 (0.0%) |
| 7:00 AM to 7:29 AM | 0 (0.0%) | 25 (56.8%) |
| 7:30 AM to 7:59 AM | 9 (15.2%) | 0 (0.0%) |
| 8:00 AM to 8:29 AM | 10 (17.0%) | 10 (22.7%) |
| 8:30 AM to 8:59 AM | 8 (13.6%) | 0 (0.0%) |
| 9:00 AM to 9:59 AM | 0 (0.0%) | 9 (20.4%) |
| 10:00 AM to 10:59 AM | 0 (0.0%) | 0 (0.0%) |
| 11:00 AM to 11:59 AM | 0 (0.0%) | 0 (0.0%) |
| 12:00 PM to 3:59 PM | 0 (0.0%) | 0 (0.0%) |
| 4:00 PM to 11:59 PM | 0 (0.0%) | 0 (0.0%) |
| Total | 59 (100.0%) | 44 (100.0%) |
Housing Occupancy in Quonochontaug
Occupancy by Ownership in Quonochontaug
Of the total 237 dwellings in Quonochontaug, owner-occupied units account for 237 (100.0%), while renter-occupied units make up 0 (0.0%).
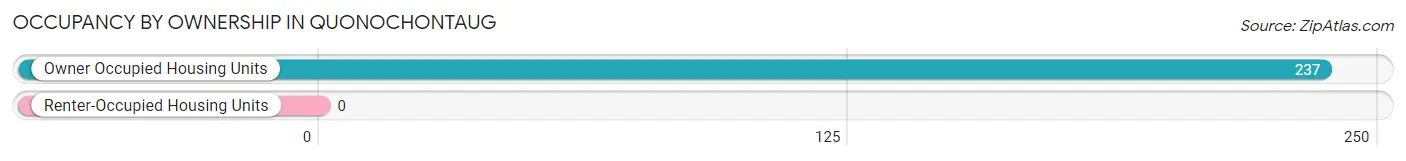
| Occupancy | # Housing Units | % Housing Units |
| Owner Occupied Housing Units | 237 | 100.0% |
| Renter-Occupied Housing Units | 0 | 0.0% |
| Total Occupied Housing Units | 237 | 100.0% |
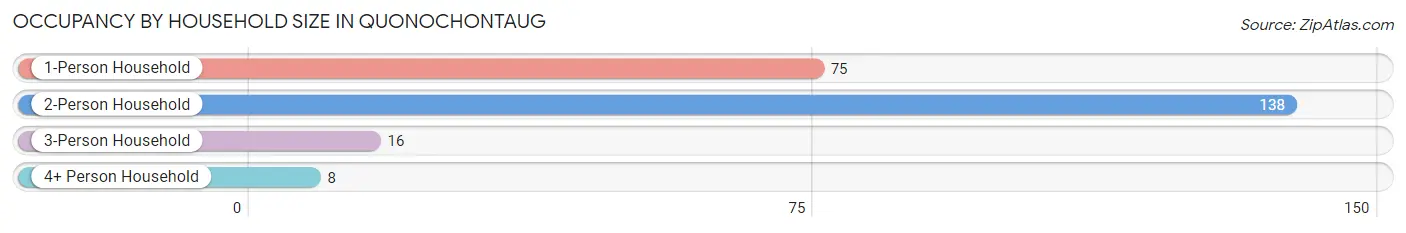
Occupancy by Household Size in Quonochontaug
| Household Size | # Housing Units | % Housing Units |
| 1-Person Household | 75 | 31.7% |
| 2-Person Household | 138 | 58.2% |
| 3-Person Household | 16 | 6.8% |
| 4+ Person Household | 8 | 3.4% |
| Total Housing Units | 237 | 100.0% |
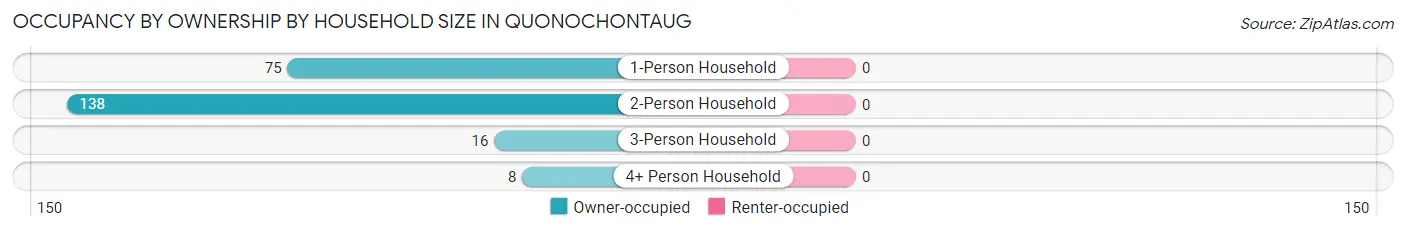
Occupancy by Ownership by Household Size in Quonochontaug
| Household Size | Owner-occupied | Renter-occupied |
| 1-Person Household | 75 (100.0%) | 0 (0.0%) |
| 2-Person Household | 138 (100.0%) | 0 (0.0%) |
| 3-Person Household | 16 (100.0%) | 0 (0.0%) |
| 4+ Person Household | 8 (100.0%) | 0 (0.0%) |
| Total Housing Units | 237 (100.0%) | 0 (0.0%) |
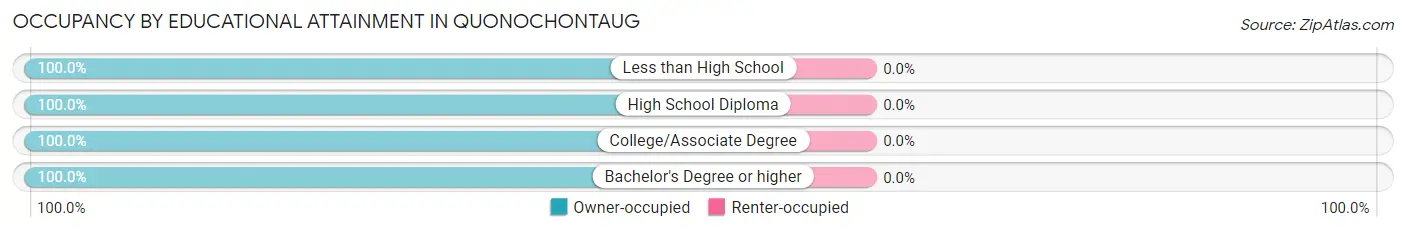
Occupancy by Educational Attainment in Quonochontaug
| Household Size | Owner-occupied | Renter-occupied |
| Less than High School | 7 (100.0%) | 0 (0.0%) |
| High School Diploma | 29 (100.0%) | 0 (0.0%) |
| College/Associate Degree | 31 (100.0%) | 0 (0.0%) |
| Bachelor's Degree or higher | 170 (100.0%) | 0 (0.0%) |
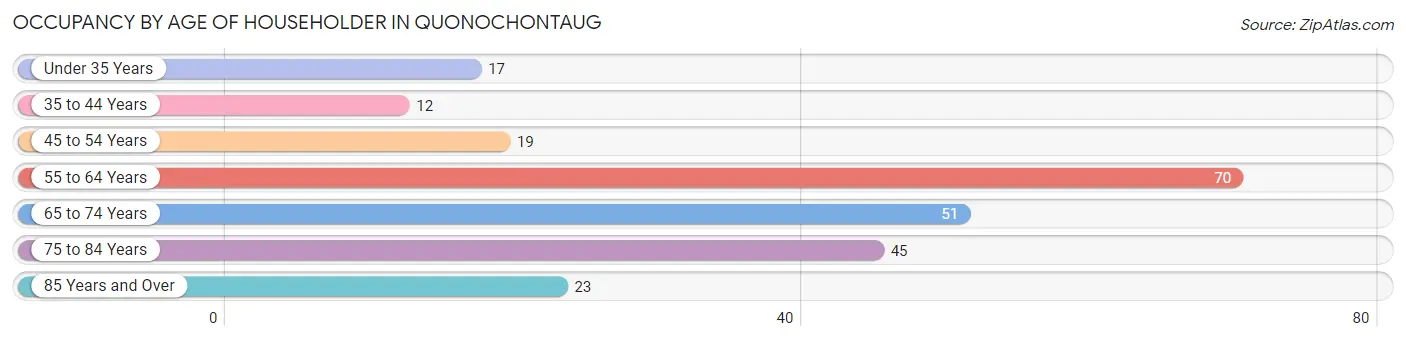
Occupancy by Age of Householder in Quonochontaug
| Age Bracket | # Households | % Households |
| Under 35 Years | 17 | 7.2% |
| 35 to 44 Years | 12 | 5.1% |
| 45 to 54 Years | 19 | 8.0% |
| 55 to 64 Years | 70 | 29.5% |
| 65 to 74 Years | 51 | 21.5% |
| 75 to 84 Years | 45 | 19.0% |
| 85 Years and Over | 23 | 9.7% |
| Total | 237 | 100.0% |
Housing Finances in Quonochontaug
Median Income by Occupancy in Quonochontaug
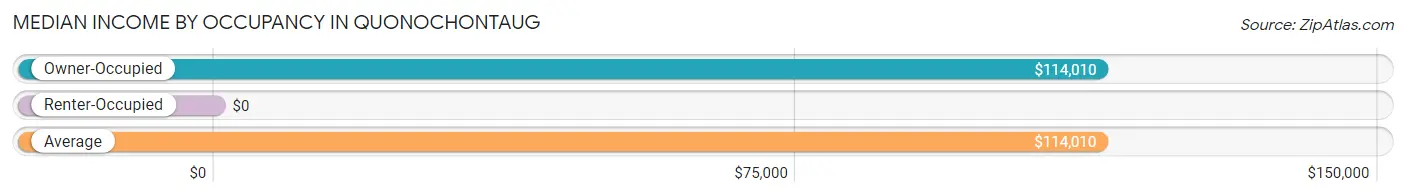
| Occupancy Type | # Households | Median Income |
| Owner-Occupied | 237 (100.0%) | $114,010 |
| Renter-Occupied | 0 (0.0%) | $0 |
| Average | 237 (100.0%) | $114,010 |
Occupancy by Householder Income Bracket in Quonochontaug
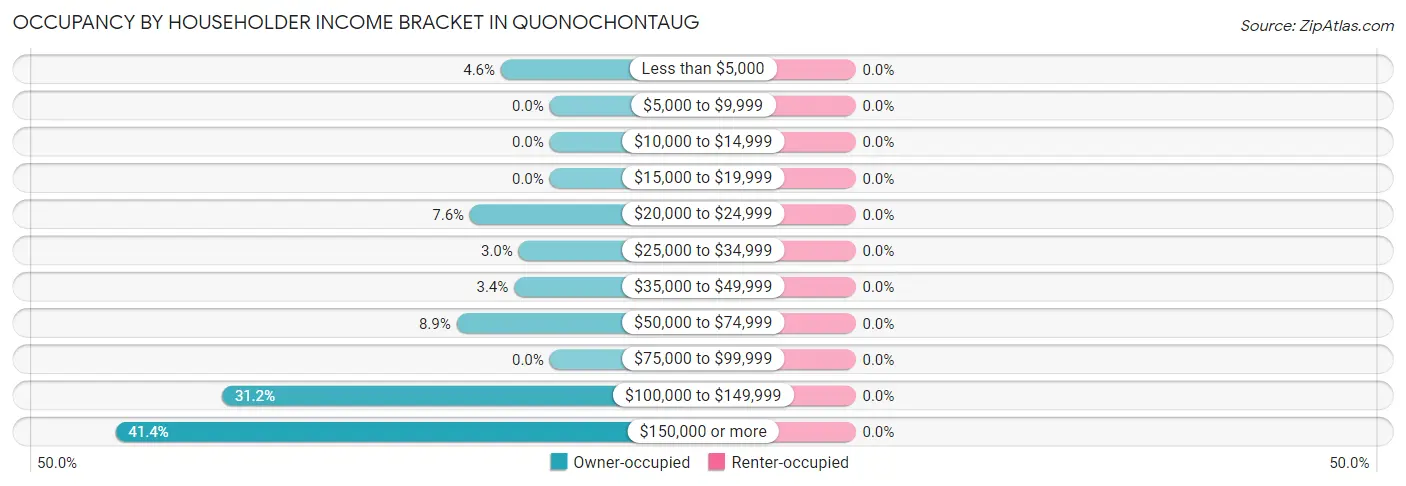
| Income Bracket | Owner-occupied | Renter-occupied |
| Less than $5,000 | 11 (4.6%) | 0 (0.0%) |
| $5,000 to $9,999 | 0 (0.0%) | 0 (0.0%) |
| $10,000 to $14,999 | 0 (0.0%) | 0 (0.0%) |
| $15,000 to $19,999 | 0 (0.0%) | 0 (0.0%) |
| $20,000 to $24,999 | 18 (7.6%) | 0 (0.0%) |
| $25,000 to $34,999 | 7 (2.9%) | 0 (0.0%) |
| $35,000 to $49,999 | 8 (3.4%) | 0 (0.0%) |
| $50,000 to $74,999 | 21 (8.9%) | 0 (0.0%) |
| $75,000 to $99,999 | 0 (0.0%) | 0 (0.0%) |
| $100,000 to $149,999 | 74 (31.2%) | 0 (0.0%) |
| $150,000 or more | 98 (41.3%) | 0 (0.0%) |
| Total | 237 (100.0%) | 0 (0.0%) |
Monthly Housing Cost Tiers in Quonochontaug
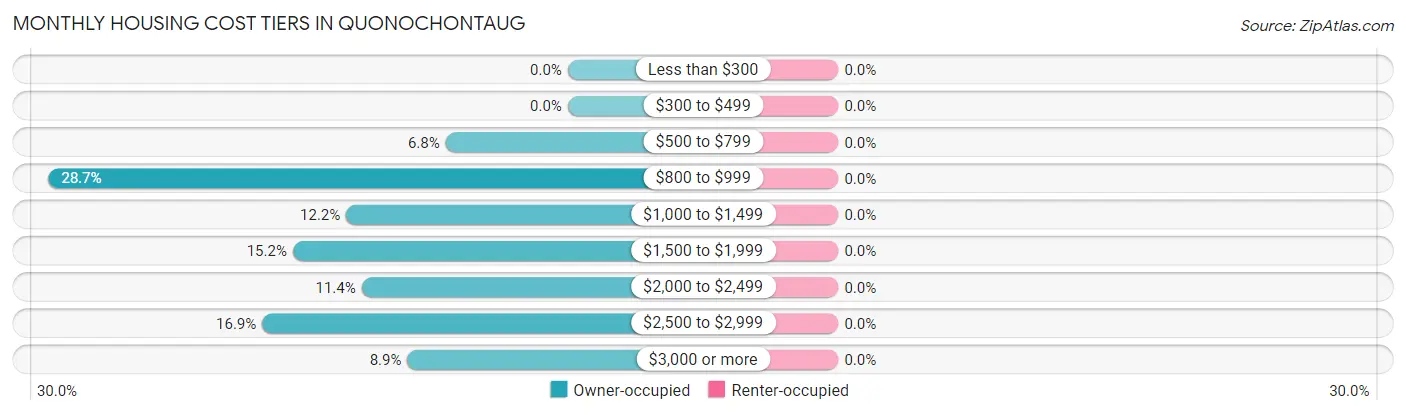
| Monthly Cost | Owner-occupied | Renter-occupied |
| Less than $300 | 0 (0.0%) | 0 (0.0%) |
| $300 to $499 | 0 (0.0%) | 0 (0.0%) |
| $500 to $799 | 16 (6.8%) | 0 (0.0%) |
| $800 to $999 | 68 (28.7%) | 0 (0.0%) |
| $1,000 to $1,499 | 29 (12.2%) | 0 (0.0%) |
| $1,500 to $1,999 | 36 (15.2%) | 0 (0.0%) |
| $2,000 to $2,499 | 27 (11.4%) | 0 (0.0%) |
| $2,500 to $2,999 | 40 (16.9%) | 0 (0.0%) |
| $3,000 or more | 21 (8.9%) | 0 (0.0%) |
| Total | 237 (100.0%) | 0 (0.0%) |
Physical Housing Characteristics in Quonochontaug
Housing Structures in Quonochontaug
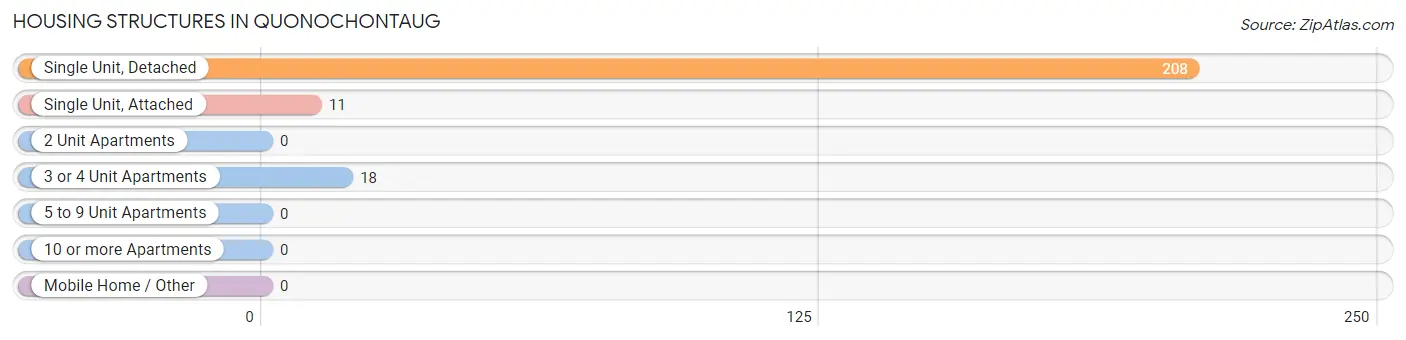
| Structure Type | # Housing Units | % Housing Units |
| Single Unit, Detached | 208 | 87.8% |
| Single Unit, Attached | 11 | 4.6% |
| 2 Unit Apartments | 0 | 0.0% |
| 3 or 4 Unit Apartments | 18 | 7.6% |
| 5 to 9 Unit Apartments | 0 | 0.0% |
| 10 or more Apartments | 0 | 0.0% |
| Mobile Home / Other | 0 | 0.0% |
| Total | 237 | 100.0% |
Housing Structures by Occupancy in Quonochontaug
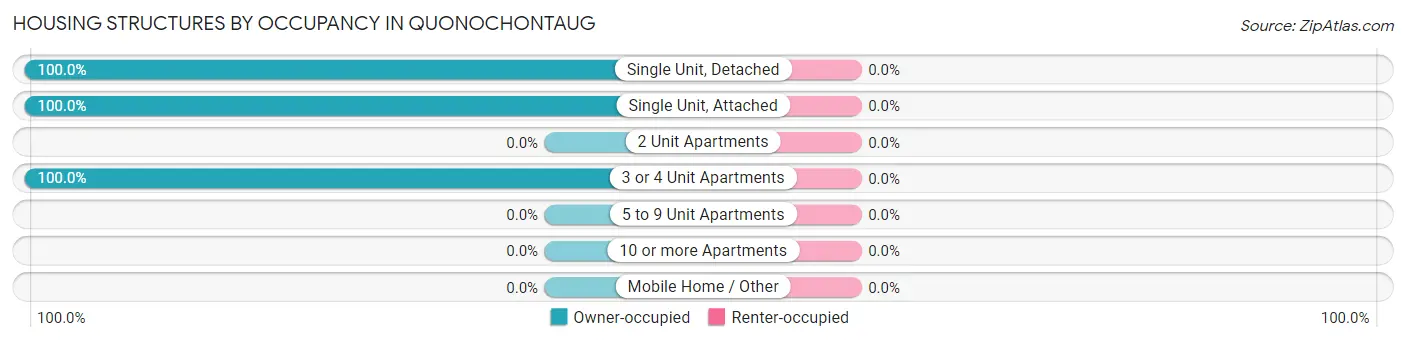
| Structure Type | Owner-occupied | Renter-occupied |
| Single Unit, Detached | 208 (100.0%) | 0 (0.0%) |
| Single Unit, Attached | 11 (100.0%) | 0 (0.0%) |
| 2 Unit Apartments | 0 (0.0%) | 0 (0.0%) |
| 3 or 4 Unit Apartments | 18 (100.0%) | 0 (0.0%) |
| 5 to 9 Unit Apartments | 0 (0.0%) | 0 (0.0%) |
| 10 or more Apartments | 0 (0.0%) | 0 (0.0%) |
| Mobile Home / Other | 0 (0.0%) | 0 (0.0%) |
| Total | 237 (100.0%) | 0 (0.0%) |
Housing Structures by Number of Rooms in Quonochontaug
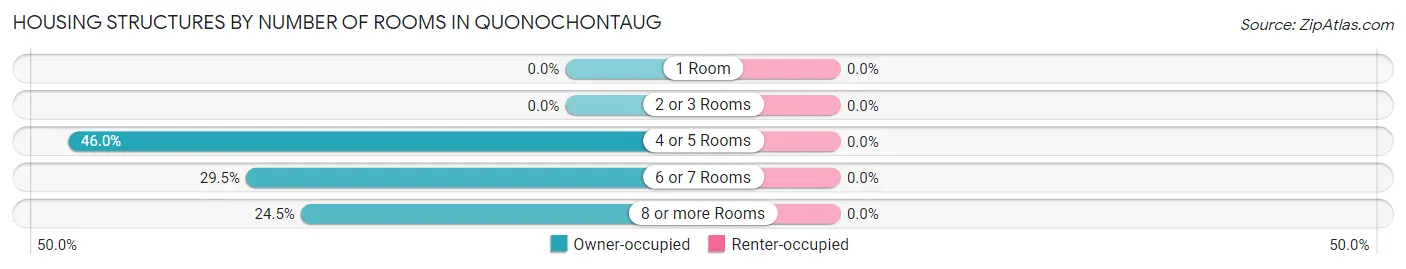
| Number of Rooms | Owner-occupied | Renter-occupied |
| 1 Room | 0 (0.0%) | 0 (0.0%) |
| 2 or 3 Rooms | 0 (0.0%) | 0 (0.0%) |
| 4 or 5 Rooms | 109 (46.0%) | 0 (0.0%) |
| 6 or 7 Rooms | 70 (29.5%) | 0 (0.0%) |
| 8 or more Rooms | 58 (24.5%) | 0 (0.0%) |
| Total | 237 (100.0%) | 0 (0.0%) |
Housing Structure by Heating Type in Quonochontaug
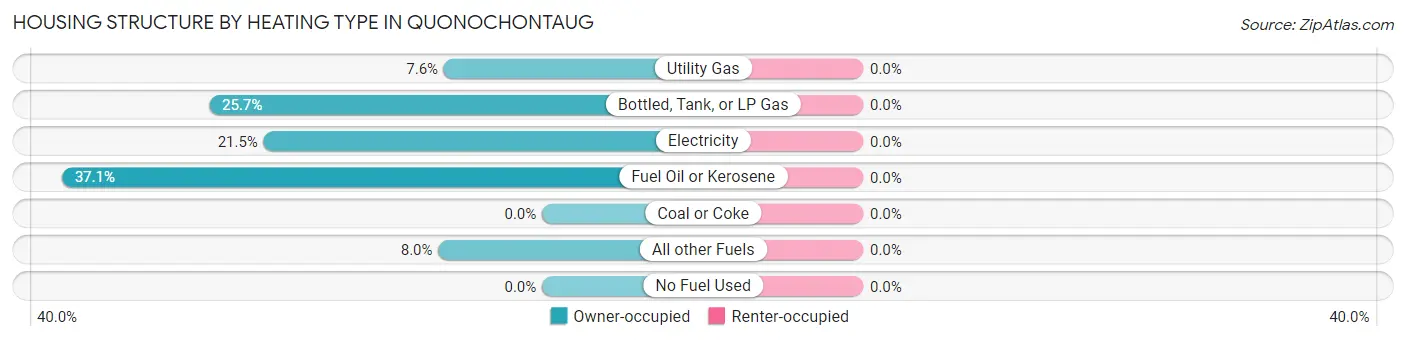
| Heating Type | Owner-occupied | Renter-occupied |
| Utility Gas | 18 (7.6%) | 0 (0.0%) |
| Bottled, Tank, or LP Gas | 61 (25.7%) | 0 (0.0%) |
| Electricity | 51 (21.5%) | 0 (0.0%) |
| Fuel Oil or Kerosene | 88 (37.1%) | 0 (0.0%) |
| Coal or Coke | 0 (0.0%) | 0 (0.0%) |
| All other Fuels | 19 (8.0%) | 0 (0.0%) |
| No Fuel Used | 0 (0.0%) | 0 (0.0%) |
| Total | 237 (100.0%) | 0 (0.0%) |
Household Vehicle Usage in Quonochontaug
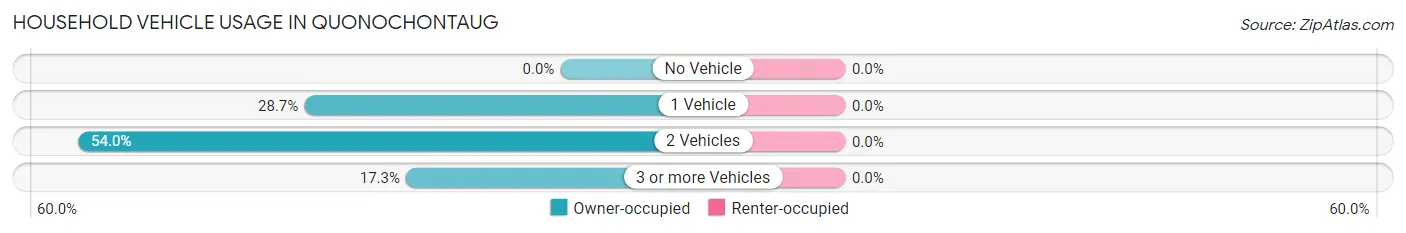
| Vehicles per Household | Owner-occupied | Renter-occupied |
| No Vehicle | 0 (0.0%) | 0 (0.0%) |
| 1 Vehicle | 68 (28.7%) | 0 (0.0%) |
| 2 Vehicles | 128 (54.0%) | 0 (0.0%) |
| 3 or more Vehicles | 41 (17.3%) | 0 (0.0%) |
| Total | 237 (100.0%) | 0 (0.0%) |
Real Estate & Mortgages in Quonochontaug
Real Estate and Mortgage Overview in Quonochontaug
| Characteristic | Without Mortgage | With Mortgage |
| Housing Units | 162 | 75 |
| Median Property Value | - | - |
| Median Household Income | $104,038 | $67 |
| Monthly Housing Costs | $990 | $21 |
| Real Estate Taxes | $6,570 | $0 |
Property Value by Mortgage Status in Quonochontaug
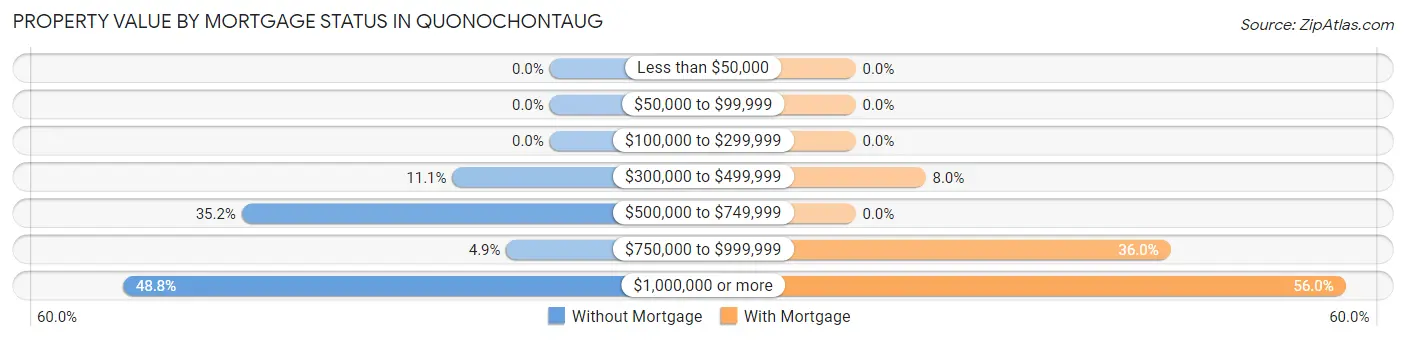
| Property Value | Without Mortgage | With Mortgage |
| Less than $50,000 | 0 (0.0%) | 0 (0.0%) |
| $50,000 to $99,999 | 0 (0.0%) | 0 (0.0%) |
| $100,000 to $299,999 | 0 (0.0%) | 0 (0.0%) |
| $300,000 to $499,999 | 18 (11.1%) | 6 (8.0%) |
| $500,000 to $749,999 | 57 (35.2%) | 0 (0.0%) |
| $750,000 to $999,999 | 8 (4.9%) | 27 (36.0%) |
| $1,000,000 or more | 79 (48.8%) | 42 (56.0%) |
| Total | 162 (100.0%) | 75 (100.0%) |
Household Income by Mortgage Status in Quonochontaug
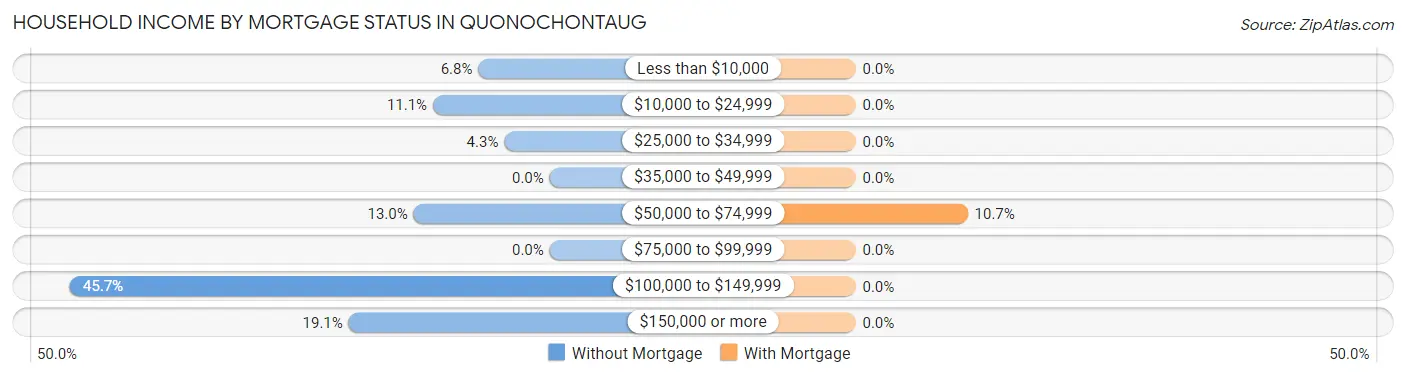
| Household Income | Without Mortgage | With Mortgage |
| Less than $10,000 | 11 (6.8%) | 0 (0.0%) |
| $10,000 to $24,999 | 18 (11.1%) | 0 (0.0%) |
| $25,000 to $34,999 | 7 (4.3%) | 0 (0.0%) |
| $35,000 to $49,999 | 0 (0.0%) | 0 (0.0%) |
| $50,000 to $74,999 | 21 (13.0%) | 8 (10.7%) |
| $75,000 to $99,999 | 0 (0.0%) | 0 (0.0%) |
| $100,000 to $149,999 | 74 (45.7%) | 0 (0.0%) |
| $150,000 or more | 31 (19.1%) | 0 (0.0%) |
| Total | 162 (100.0%) | 75 (100.0%) |
Property Value to Household Income Ratio in Quonochontaug
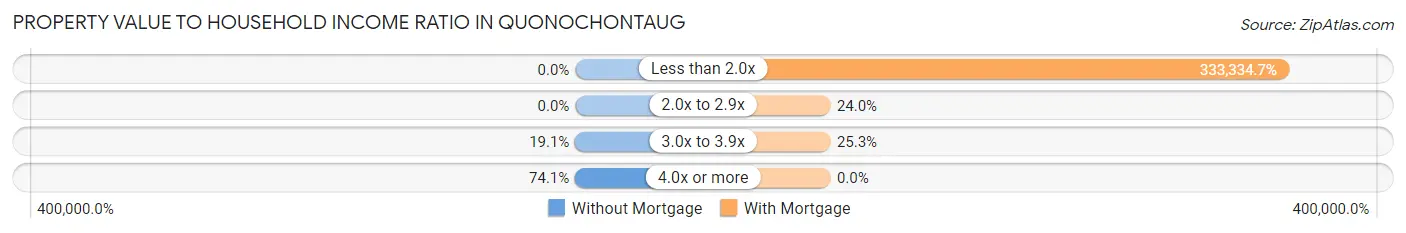
| Value-to-Income Ratio | Without Mortgage | With Mortgage |
| Less than 2.0x | 0 (0.0%) | 250,001 (333,334.7%) |
| 2.0x to 2.9x | 0 (0.0%) | 18 (24.0%) |
| 3.0x to 3.9x | 31 (19.1%) | 19 (25.3%) |
| 4.0x or more | 120 (74.1%) | 0 (0.0%) |
| Total | 162 (100.0%) | 75 (100.0%) |
Real Estate Taxes by Mortgage Status in Quonochontaug
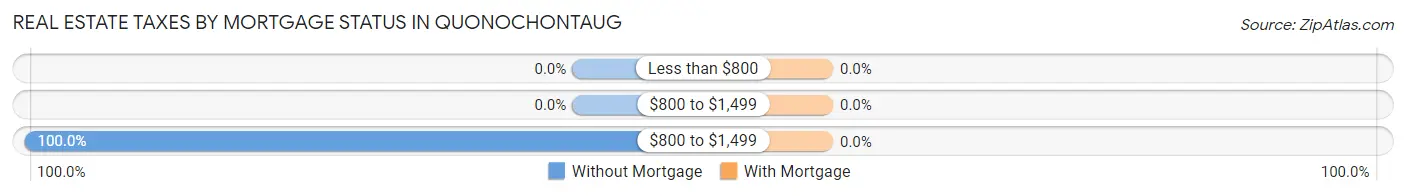
| Property Taxes | Without Mortgage | With Mortgage |
| Less than $800 | 0 (0.0%) | 0 (0.0%) |
| $800 to $1,499 | 0 (0.0%) | 0 (0.0%) |
| $800 to $1,499 | 162 (100.0%) | 0 (0.0%) |
| Total | 162 (100.0%) | 75 (100.0%) |
Health & Disability in Quonochontaug
Health Insurance Coverage by Age in Quonochontaug
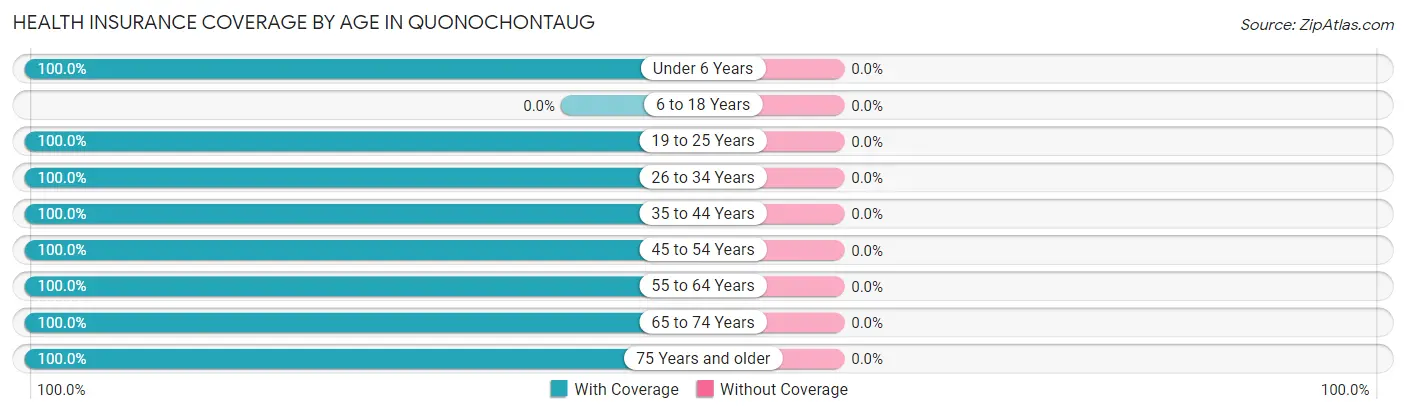
| Age Bracket | With Coverage | Without Coverage |
| Under 6 Years | 6 (100.0%) | 0 (0.0%) |
| 6 to 18 Years | 0 (0.0%) | 0 (0.0%) |
| 19 to 25 Years | 14 (100.0%) | 0 (0.0%) |
| 26 to 34 Years | 23 (100.0%) | 0 (0.0%) |
| 35 to 44 Years | 12 (100.0%) | 0 (0.0%) |
| 45 to 54 Years | 32 (100.0%) | 0 (0.0%) |
| 55 to 64 Years | 164 (100.0%) | 0 (0.0%) |
| 65 to 74 Years | 71 (100.0%) | 0 (0.0%) |
| 75 Years and older | 130 (100.0%) | 0 (0.0%) |
| Total | 452 (100.0%) | 0 (0.0%) |
Health Insurance Coverage by Citizenship Status in Quonochontaug
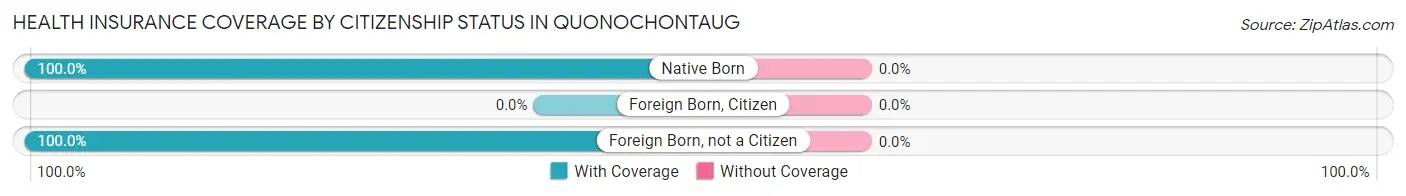
| Citizenship Status | With Coverage | Without Coverage |
| Native Born | 6 (100.0%) | 0 (0.0%) |
| Foreign Born, Citizen | 0 (0.0%) | 0 (0.0%) |
| Foreign Born, not a Citizen | 14 (100.0%) | 0 (0.0%) |
Health Insurance Coverage by Household Income in Quonochontaug
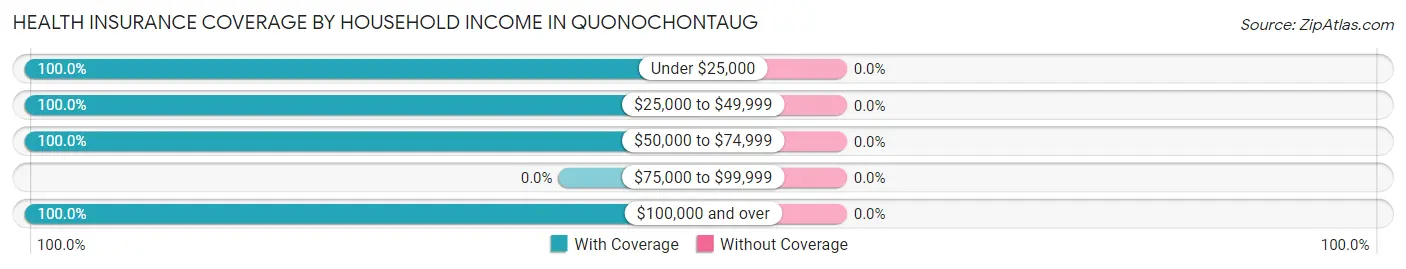
| Household Income | With Coverage | Without Coverage |
| Under $25,000 | 29 (100.0%) | 0 (0.0%) |
| $25,000 to $49,999 | 24 (100.0%) | 0 (0.0%) |
| $50,000 to $74,999 | 43 (100.0%) | 0 (0.0%) |
| $75,000 to $99,999 | 0 (0.0%) | 0 (0.0%) |
| $100,000 and over | 356 (100.0%) | 0 (0.0%) |
Public vs Private Health Insurance Coverage by Age in Quonochontaug
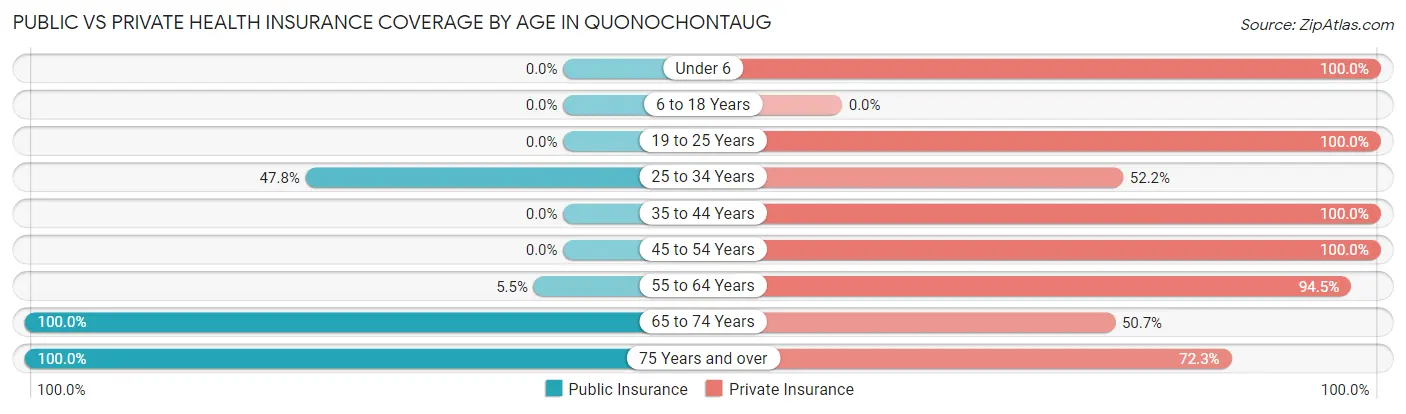
| Age Bracket | Public Insurance | Private Insurance |
| Under 6 | 0 (0.0%) | 6 (100.0%) |
| 6 to 18 Years | 0 (0.0%) | 0 (0.0%) |
| 19 to 25 Years | 0 (0.0%) | 14 (100.0%) |
| 25 to 34 Years | 11 (47.8%) | 12 (52.2%) |
| 35 to 44 Years | 0 (0.0%) | 12 (100.0%) |
| 45 to 54 Years | 0 (0.0%) | 32 (100.0%) |
| 55 to 64 Years | 9 (5.5%) | 155 (94.5%) |
| 65 to 74 Years | 71 (100.0%) | 36 (50.7%) |
| 75 Years and over | 130 (100.0%) | 94 (72.3%) |
| Total | 221 (48.9%) | 361 (79.9%) |
Disability Status by Sex by Age in Quonochontaug
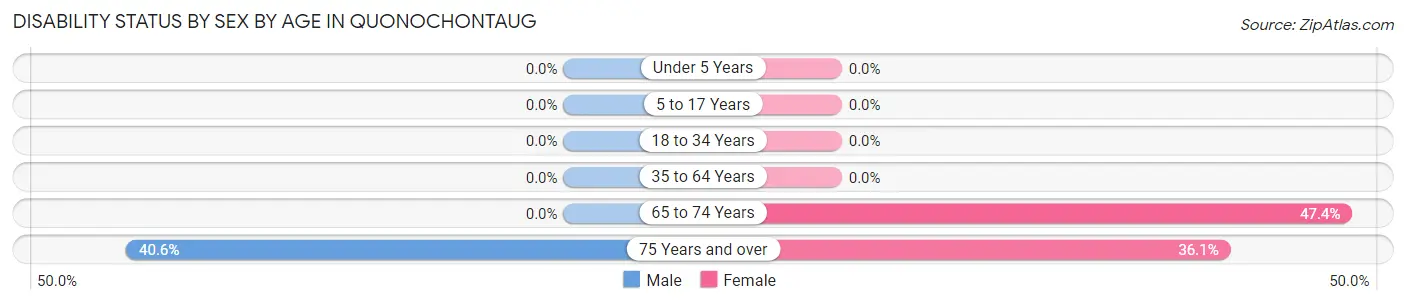
| Age Bracket | Male | Female |
| Under 5 Years | 0 (0.0%) | 0 (0.0%) |
| 5 to 17 Years | 0 (0.0%) | 0 (0.0%) |
| 18 to 34 Years | 0 (0.0%) | 0 (0.0%) |
| 35 to 64 Years | 0 (0.0%) | 0 (0.0%) |
| 65 to 74 Years | 0 (0.0%) | 18 (47.4%) |
| 75 Years and over | 28 (40.6%) | 22 (36.1%) |
Disability Class by Sex by Age in Quonochontaug
Disability Class: Hearing Difficulty
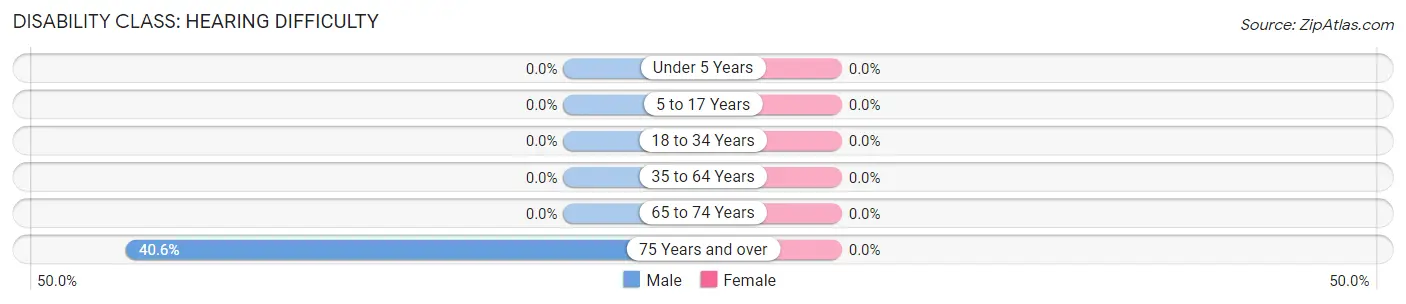
| Age Bracket | Male | Female |
| Under 5 Years | 0 (0.0%) | 0 (0.0%) |
| 5 to 17 Years | 0 (0.0%) | 0 (0.0%) |
| 18 to 34 Years | 0 (0.0%) | 0 (0.0%) |
| 35 to 64 Years | 0 (0.0%) | 0 (0.0%) |
| 65 to 74 Years | 0 (0.0%) | 0 (0.0%) |
| 75 Years and over | 28 (40.6%) | 0 (0.0%) |
Disability Class: Vision Difficulty
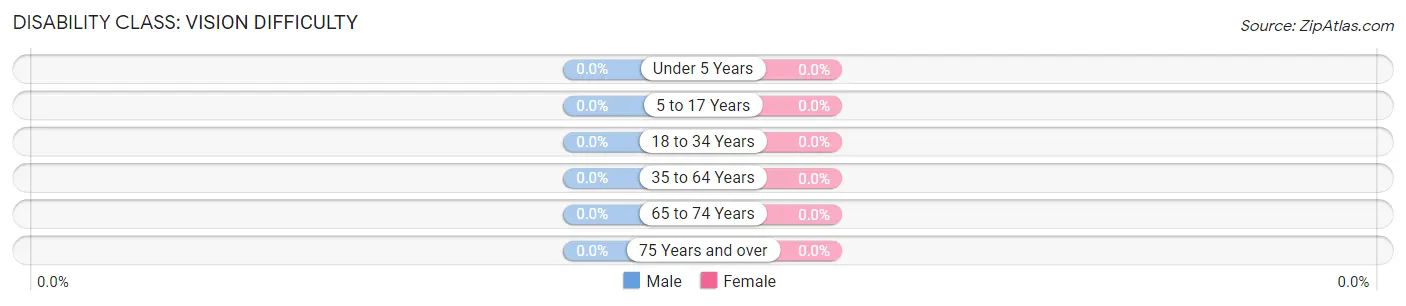
| Age Bracket | Male | Female |
| Under 5 Years | 0 (0.0%) | 0 (0.0%) |
| 5 to 17 Years | 0 (0.0%) | 0 (0.0%) |
| 18 to 34 Years | 0 (0.0%) | 0 (0.0%) |
| 35 to 64 Years | 0 (0.0%) | 0 (0.0%) |
| 65 to 74 Years | 0 (0.0%) | 0 (0.0%) |
| 75 Years and over | 0 (0.0%) | 0 (0.0%) |
Disability Class: Cognitive Difficulty
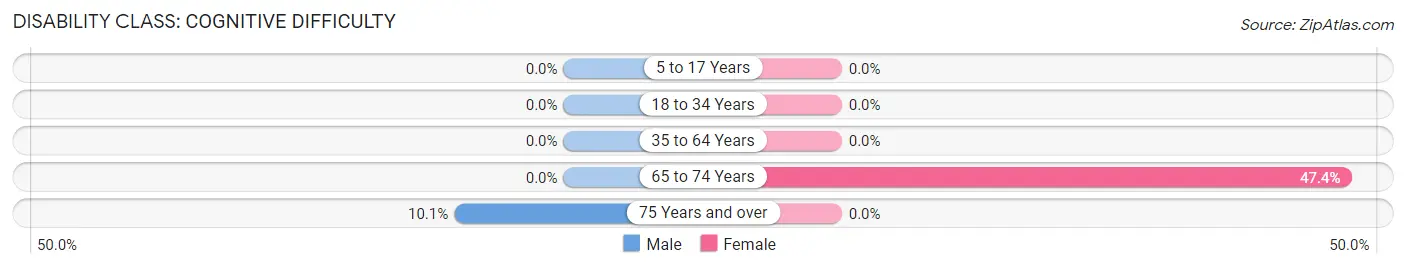
| Age Bracket | Male | Female |
| 5 to 17 Years | 0 (0.0%) | 0 (0.0%) |
| 18 to 34 Years | 0 (0.0%) | 0 (0.0%) |
| 35 to 64 Years | 0 (0.0%) | 0 (0.0%) |
| 65 to 74 Years | 0 (0.0%) | 18 (47.4%) |
| 75 Years and over | 7 (10.1%) | 0 (0.0%) |
Disability Class: Ambulatory Difficulty

| Age Bracket | Male | Female |
| 5 to 17 Years | 0 (0.0%) | 0 (0.0%) |
| 18 to 34 Years | 0 (0.0%) | 0 (0.0%) |
| 35 to 64 Years | 0 (0.0%) | 0 (0.0%) |
| 65 to 74 Years | 0 (0.0%) | 18 (47.4%) |
| 75 Years and over | 7 (10.1%) | 22 (36.1%) |
Disability Class: Self-Care Difficulty
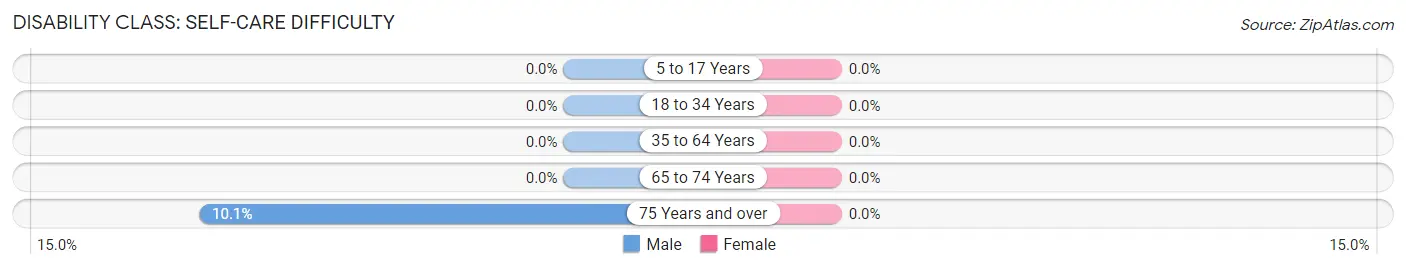
| Age Bracket | Male | Female |
| 5 to 17 Years | 0 (0.0%) | 0 (0.0%) |
| 18 to 34 Years | 0 (0.0%) | 0 (0.0%) |
| 35 to 64 Years | 0 (0.0%) | 0 (0.0%) |
| 65 to 74 Years | 0 (0.0%) | 0 (0.0%) |
| 75 Years and over | 7 (10.1%) | 0 (0.0%) |
Technology Access in Quonochontaug
Computing Device Access in Quonochontaug
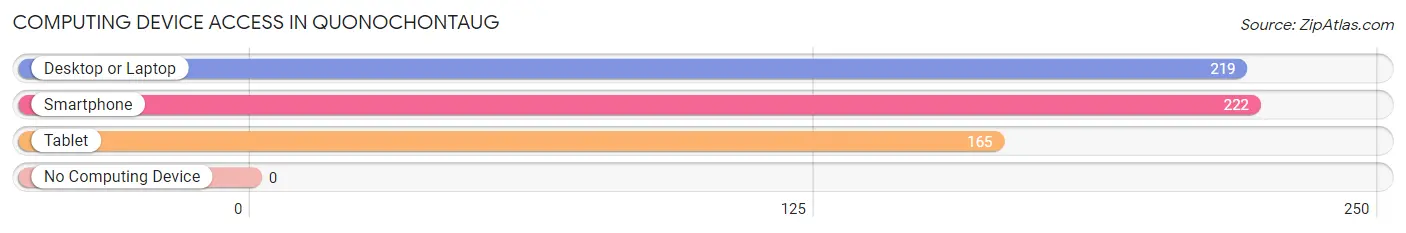
| Device Type | # Households | % Households |
| Desktop or Laptop | 219 | 92.4% |
| Smartphone | 222 | 93.7% |
| Tablet | 165 | 69.6% |
| No Computing Device | 0 | 0.0% |
| Total | 237 | 100.0% |
Internet Access in Quonochontaug
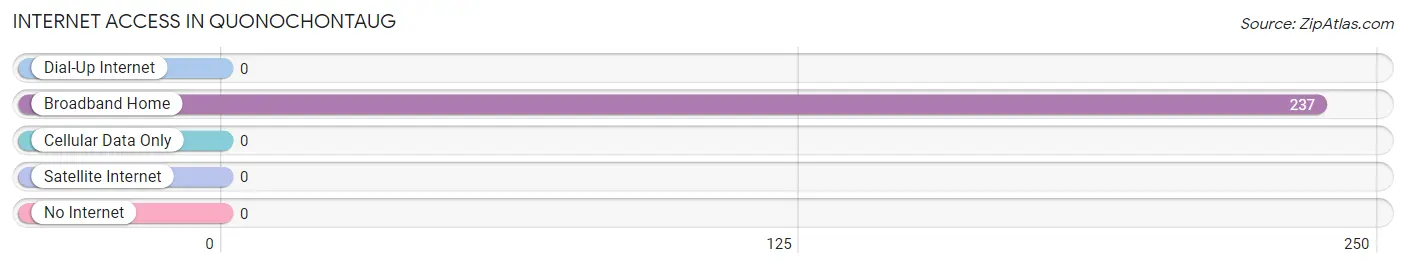
| Internet Type | # Households | % Households |
| Dial-Up Internet | 0 | 0.0% |
| Broadband Home | 237 | 100.0% |
| Cellular Data Only | 0 | 0.0% |
| Satellite Internet | 0 | 0.0% |
| No Internet | 0 | 0.0% |
| Total | 237 | 100.0% |
Quonochontaug Summary
Quonochontaug, Rhode Island is a small village located in the town of Charlestown in Washington County. It is situated on the western shore of Quonochontaug Pond, a saltwater estuary that is part of the Narragansett Bay. The village is home to a population of approximately 500 people and is known for its picturesque views of the pond and its surrounding wetlands.
History
The area now known as Quonochontaug was originally inhabited by the Narragansett Indians. The name Quonochontaug is derived from the Narragansett word for “long pond”. The area was first settled by Europeans in the late 1600s and was part of the town of Charlestown. In the early 1800s, the village was known as “Quonochontaug Neck” and was home to a small fishing and farming community.
In the late 1800s, the village began to grow as a summer resort destination. The Quonochontaug Beach Company was formed in 1891 and began to develop the area as a summer resort. The company built a hotel, a casino, and a boardwalk along the beach. The village also became a popular spot for fishing and boating.
In the early 1900s, the village began to decline as a resort destination. The hotel and casino were closed and the boardwalk was removed. The village continued to be a popular spot for fishing and boating, however, and the population remained relatively stable.
Geography
Quonochontaug is located on the western shore of Quonochontaug Pond, a saltwater estuary that is part of the Narragansett Bay. The village is surrounded by wetlands and is home to a variety of wildlife, including ospreys, herons, and egrets. The village is also home to a variety of plant life, including beach grass, sea lavender, and beach pea.
The village is located approximately 10 miles south of the city of Westerly and is accessible by car via Route 1. The nearest airport is T.F. Green Airport in Warwick, Rhode Island, which is approximately 40 miles away.
Economy
The economy of Quonochontaug is largely based on tourism and fishing. The village is home to a variety of restaurants, shops, and other businesses that cater to tourists and locals alike. The village is also home to a number of marinas and boatyards, which provide services to boaters and fishermen.
The village is also home to a number of small businesses, including a grocery store, a hardware store, and a post office.
Demographics
As of the 2010 census, the population of Quonochontaug was 498. The racial makeup of the village was 97.2% White, 0.6% African American, 0.2% Native American, 0.4% Asian, 0.2% from other races, and 1.4% from two or more races. Hispanic or Latino of any race were 1.2% of the population.
The median household income in Quonochontaug was $50,000, and the median family income was $54,375. The per capita income for the village was $25,945. About 8.3% of families and 10.2% of the population were below the poverty line, including 14.3% of those under age 18 and 4.2% of those age 65 or over.
Conclusion
Quonochontaug is a small village located in the town of Charlestown in Washington County, Rhode Island. It is situated on the western shore of Quonochontaug Pond, a saltwater estuary that is part of the Narragansett Bay. The village is home to a population of approximately 500 people and is known for its picturesque views of the pond and its surrounding wetlands. The economy of Quonochontaug is largely based on tourism and fishing, and the village is home to a variety of restaurants, shops, and other businesses that cater to tourists and locals alike. The village is also home to a number of small businesses, including a grocery store, a hardware store, and a post office. As of the 2010 census, the population of Quonochontaug was 498. The racial makeup of the village was 97.2% White, 0.6% African American, 0.2% Native American, 0.4% Asian, 0.2% from other races, and 1.4% from two or more races. Hispanic or Latino of any race were 1.2% of the population.
Common Questions
What is Per Capita Income in Quonochontaug?
Per Capita income in Quonochontaug is $109,370.
What is the Median Family Income in Quonochontaug?
Median Family Income in Quonochontaug is $181,500.
What is the Median Household income in Quonochontaug?
Median Household Income in Quonochontaug is $114,010.
What is Inequality or Gini Index in Quonochontaug?
Inequality or Gini Index in Quonochontaug is 0.49.
What is the Total Population of Quonochontaug?
Total Population of Quonochontaug is 452.
What is the Total Male Population of Quonochontaug?
Total Male Population of Quonochontaug is 212.
What is the Total Female Population of Quonochontaug?
Total Female Population of Quonochontaug is 240.
What is the Ratio of Males per 100 Females in Quonochontaug?
There are 88.33 Males per 100 Females in Quonochontaug.
What is the Ratio of Females per 100 Males in Quonochontaug?
There are 113.21 Females per 100 Males in Quonochontaug.
What is the Median Population Age in Quonochontaug?
Median Population Age in Quonochontaug is 61.6 Years.
What is the Average Family Size in Quonochontaug
Average Family Size in Quonochontaug is 2.3 People.
What is the Average Household Size in Quonochontaug
Average Household Size in Quonochontaug is 1.9 People.
How Large is the Labor Force in Quonochontaug?
There are 220 People in the Labor Forcein in Quonochontaug.
What is the Percentage of People in the Labor Force in Quonochontaug?
49.3% of People are in the Labor Force in Quonochontaug.
What is the Unemployment Rate in Quonochontaug?
Unemployment Rate in Quonochontaug is 12.7%.