East Providence, RI Map & Demographics
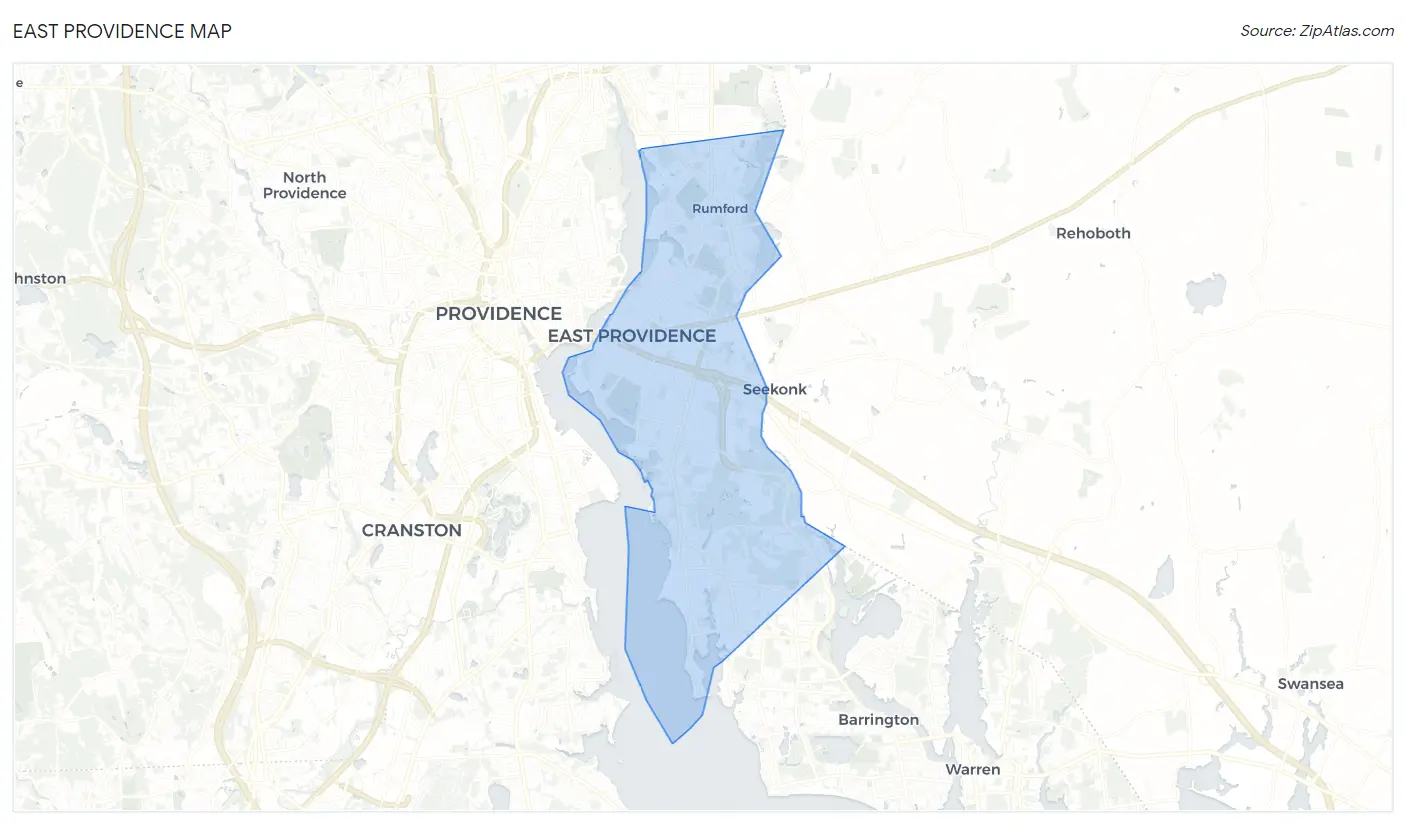
East Providence Map
East Providence Overview
$42,159
PER CAPITA INCOME
$103,175
AVG FAMILY INCOME
$71,736
AVG HOUSEHOLD INCOME
14.4%
WAGE / INCOME GAP [ % ]
85.6¢/ $1
WAGE / INCOME GAP [ $ ]
$9,335
FAMILY INCOME DEFICIT
0.46
INEQUALITY / GINI INDEX
47,012
TOTAL POPULATION
23,369
MALE POPULATION
23,643
FEMALE POPULATION
98.84
MALES / 100 FEMALES
101.17
FEMALES / 100 MALES
43.0
MEDIAN AGE
3.0
AVG FAMILY SIZE
2.3
AVG HOUSEHOLD SIZE
25,817
LABOR FORCE [ PEOPLE ]
64.8%
PERCENT IN LABOR FORCE
5.6%
UNEMPLOYMENT RATE
East Providence Zip Codes
East Providence Area Codes
Income in East Providence
Income Overview in East Providence
Per Capita Income in East Providence is $42,159, while median incomes of families and households are $103,175 and $71,736 respectively.
| Characteristic | Number | Measure |
| Per Capita Income | 47,012 | $42,159 |
| Median Family Income | 11,393 | $103,175 |
| Mean Family Income | 11,393 | $120,904 |
| Median Household Income | 20,410 | $71,736 |
| Mean Household Income | 20,410 | $93,229 |
| Income Deficit | 11,393 | $9,335 |
| Wage / Income Gap (%) | 47,012 | 14.40% |
| Wage / Income Gap ($) | 47,012 | 85.60¢ per $1 |
| Gini / Inequality Index | 47,012 | 0.46 |
Earnings by Sex in East Providence
Average Earnings in East Providence are $47,405, $51,534 for men and $44,115 for women, a difference of 14.4%.
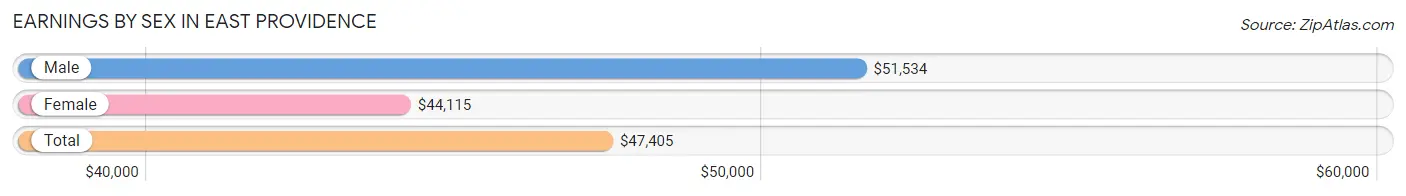
| Sex | Number | Average Earnings |
| Male | 13,381 (50.9%) | $51,534 |
| Female | 12,894 (49.1%) | $44,115 |
| Total | 26,275 (100.0%) | $47,405 |
Earnings by Sex by Income Bracket in East Providence
The most common earnings brackets in East Providence are $75,000 to $99,999 for men (2,005 | 15.0%) and $100,000+ for women (1,441 | 11.2%).
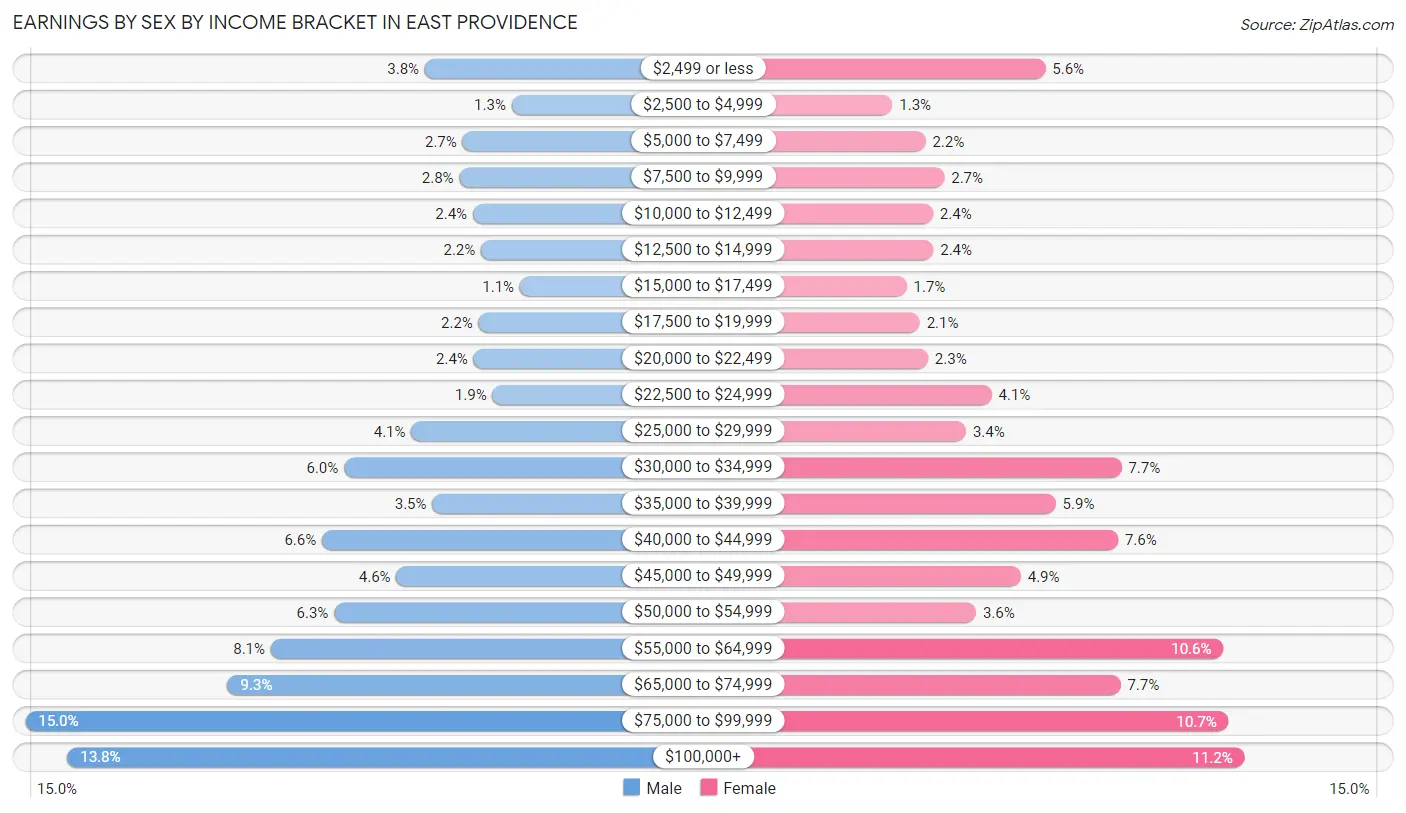
| Income | Male | Female |
| $2,499 or less | 502 (3.7%) | 720 (5.6%) |
| $2,500 to $4,999 | 175 (1.3%) | 165 (1.3%) |
| $5,000 to $7,499 | 360 (2.7%) | 285 (2.2%) |
| $7,500 to $9,999 | 372 (2.8%) | 353 (2.7%) |
| $10,000 to $12,499 | 321 (2.4%) | 312 (2.4%) |
| $12,500 to $14,999 | 290 (2.2%) | 313 (2.4%) |
| $15,000 to $17,499 | 145 (1.1%) | 217 (1.7%) |
| $17,500 to $19,999 | 300 (2.2%) | 264 (2.1%) |
| $20,000 to $22,499 | 319 (2.4%) | 294 (2.3%) |
| $22,500 to $24,999 | 247 (1.8%) | 525 (4.1%) |
| $25,000 to $29,999 | 553 (4.1%) | 432 (3.4%) |
| $30,000 to $34,999 | 805 (6.0%) | 995 (7.7%) |
| $35,000 to $39,999 | 474 (3.5%) | 757 (5.9%) |
| $40,000 to $44,999 | 889 (6.6%) | 982 (7.6%) |
| $45,000 to $49,999 | 609 (4.5%) | 631 (4.9%) |
| $50,000 to $54,999 | 843 (6.3%) | 468 (3.6%) |
| $55,000 to $64,999 | 1,081 (8.1%) | 1,364 (10.6%) |
| $65,000 to $74,999 | 1,245 (9.3%) | 992 (7.7%) |
| $75,000 to $99,999 | 2,005 (15.0%) | 1,384 (10.7%) |
| $100,000+ | 1,846 (13.8%) | 1,441 (11.2%) |
| Total | 13,381 (100.0%) | 12,894 (100.0%) |
Earnings by Sex by Educational Attainment in East Providence
Average earnings in East Providence are $56,414 for men and $47,149 for women, a difference of 16.4%. Men with an educational attainment of graduate degree enjoy the highest average annual earnings of $75,096, while those with less than high school education earn the least with $42,376. Women with an educational attainment of graduate degree earn the most with the average annual earnings of $80,268, while those with less than high school education have the smallest earnings of $33,949.
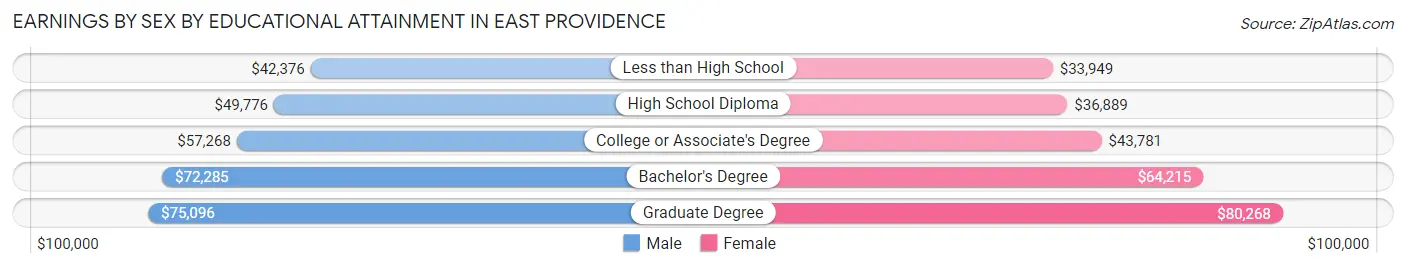
| Educational Attainment | Male Income | Female Income |
| Less than High School | $42,376 | $33,949 |
| High School Diploma | $49,776 | $36,889 |
| College or Associate's Degree | $57,268 | $43,781 |
| Bachelor's Degree | $72,285 | $64,215 |
| Graduate Degree | $75,096 | $80,268 |
| Total | $56,414 | $47,149 |
Family Income in East Providence
Family Income Brackets in East Providence
According to the East Providence family income data, there are 2,974 families falling into the $100,000 to $149,999 income range, which is the most common income bracket and makes up 26.1% of all families. Conversely, the $15,000 to $24,999 income bracket is the least frequent group with only 273 families (2.4%) belonging to this category.
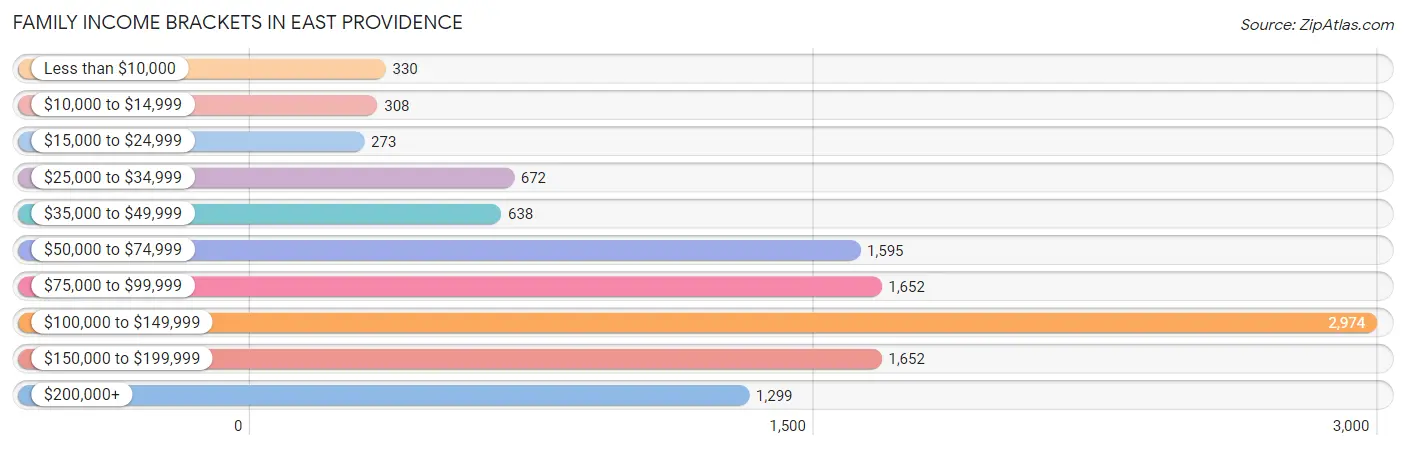
| Income Bracket | # Families | % Families |
| Less than $10,000 | 330 | 2.9% |
| $10,000 to $14,999 | 308 | 2.7% |
| $15,000 to $24,999 | 273 | 2.4% |
| $25,000 to $34,999 | 672 | 5.9% |
| $35,000 to $49,999 | 638 | 5.6% |
| $50,000 to $74,999 | 1,595 | 14.0% |
| $75,000 to $99,999 | 1,652 | 14.5% |
| $100,000 to $149,999 | 2,974 | 26.1% |
| $150,000 to $199,999 | 1,652 | 14.5% |
| $200,000+ | 1,299 | 11.4% |
Family Income by Famaliy Size in East Providence
7+ person families (45 | 0.4%) account for the highest median family income in East Providence with $190,956 per family, while 2-person families (5,970 | 52.4%) have the highest median income of $41,770 per family member.
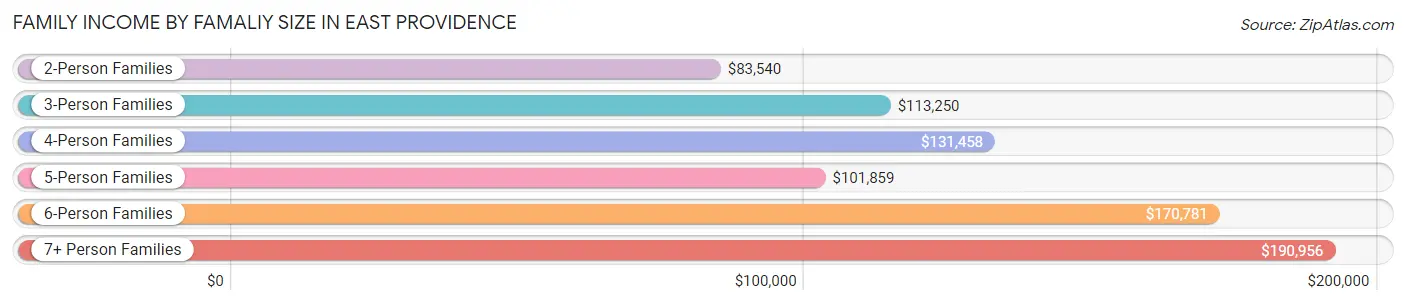
| Income Bracket | # Families | Median Income |
| 2-Person Families | 5,970 (52.4%) | $83,540 |
| 3-Person Families | 2,450 (21.5%) | $113,250 |
| 4-Person Families | 2,101 (18.4%) | $131,458 |
| 5-Person Families | 717 (6.3%) | $101,859 |
| 6-Person Families | 110 (1.0%) | $170,781 |
| 7+ Person Families | 45 (0.4%) | $190,956 |
| Total | 11,393 (100.0%) | $103,175 |
Family Income by Number of Earners in East Providence
The median family income in East Providence is $103,175, with families comprising 3+ earners (1,401) having the highest median family income of $171,771, while families with no earners (1,712) have the lowest median family income of $35,263, accounting for 12.3% and 15.0% of families, respectively.
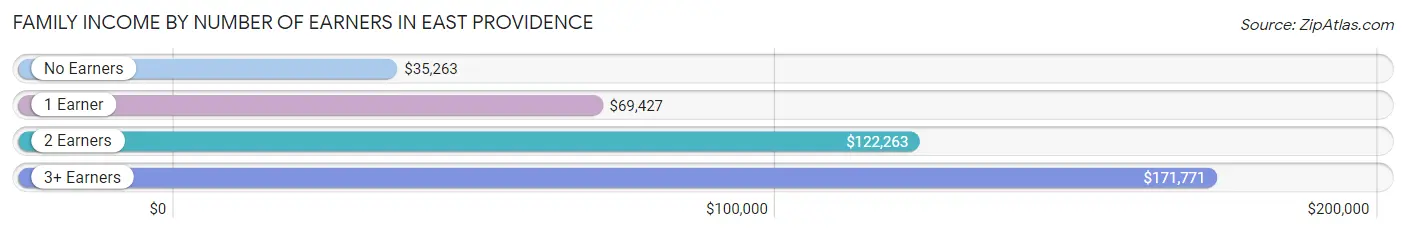
| Number of Earners | # Families | Median Income |
| No Earners | 1,712 (15.0%) | $35,263 |
| 1 Earner | 3,125 (27.4%) | $69,427 |
| 2 Earners | 5,155 (45.3%) | $122,263 |
| 3+ Earners | 1,401 (12.3%) | $171,771 |
| Total | 11,393 (100.0%) | $103,175 |
Household Income in East Providence
Household Income Brackets in East Providence
With 3,878 households falling in the category, the $100,000 to $149,999 income range is the most frequent in East Providence, accounting for 19.0% of all households. In contrast, only 959 households (4.7%) fall into the less than $10,000 income bracket, making it the least populous group.
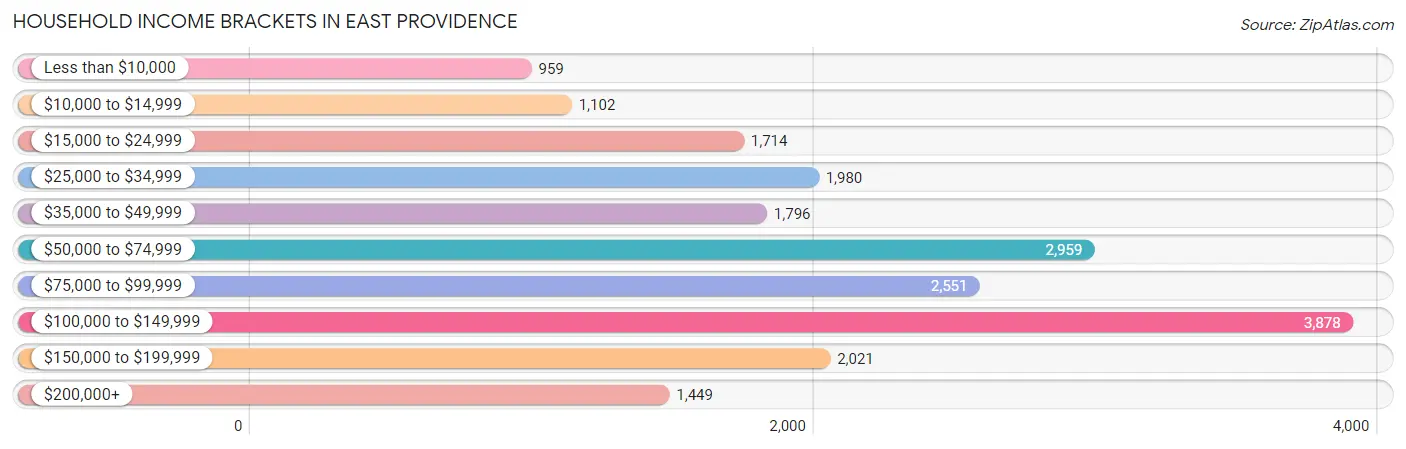
| Income Bracket | # Households | % Households |
| Less than $10,000 | 959 | 4.7% |
| $10,000 to $14,999 | 1,102 | 5.4% |
| $15,000 to $24,999 | 1,714 | 8.4% |
| $25,000 to $34,999 | 1,980 | 9.7% |
| $35,000 to $49,999 | 1,796 | 8.8% |
| $50,000 to $74,999 | 2,959 | 14.5% |
| $75,000 to $99,999 | 2,551 | 12.5% |
| $100,000 to $149,999 | 3,878 | 19.0% |
| $150,000 to $199,999 | 2,021 | 9.9% |
| $200,000+ | 1,449 | 7.1% |
Household Income by Householder Age in East Providence
The median household income in East Providence is $71,736, with the highest median household income of $89,871 found in the 25 to 44 years age bracket for the primary householder. A total of 6,115 households (30.0%) fall into this category. Meanwhile, the 15 to 24 years age bracket for the primary householder has the lowest median household income of $34,350, with 286 households (1.4%) in this group.
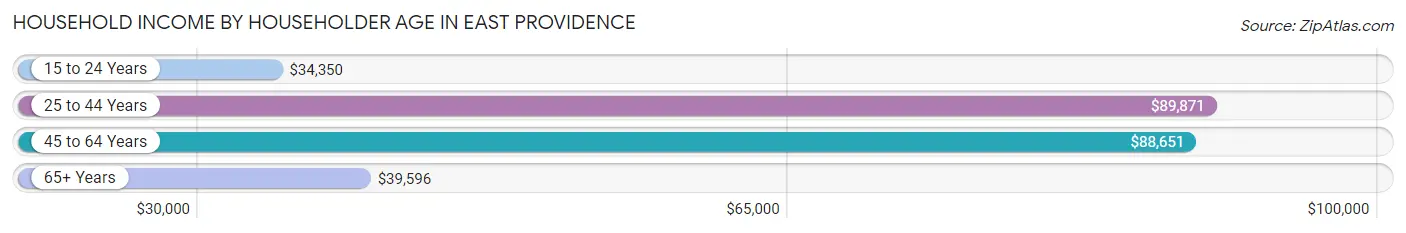
| Income Bracket | # Households | Median Income |
| 15 to 24 Years | 286 (1.4%) | $34,350 |
| 25 to 44 Years | 6,115 (30.0%) | $89,871 |
| 45 to 64 Years | 7,517 (36.8%) | $88,651 |
| 65+ Years | 6,492 (31.8%) | $39,596 |
| Total | 20,410 (100.0%) | $71,736 |
Poverty in East Providence
Income Below Poverty by Sex and Age in East Providence
With 11.3% poverty level for males and 10.5% for females among the residents of East Providence, 15 year old males and 16 and 17 year old females are the most vulnerable to poverty, with 33 males (29.2%) and 87 females (23.8%) in their respective age groups living below the poverty level.
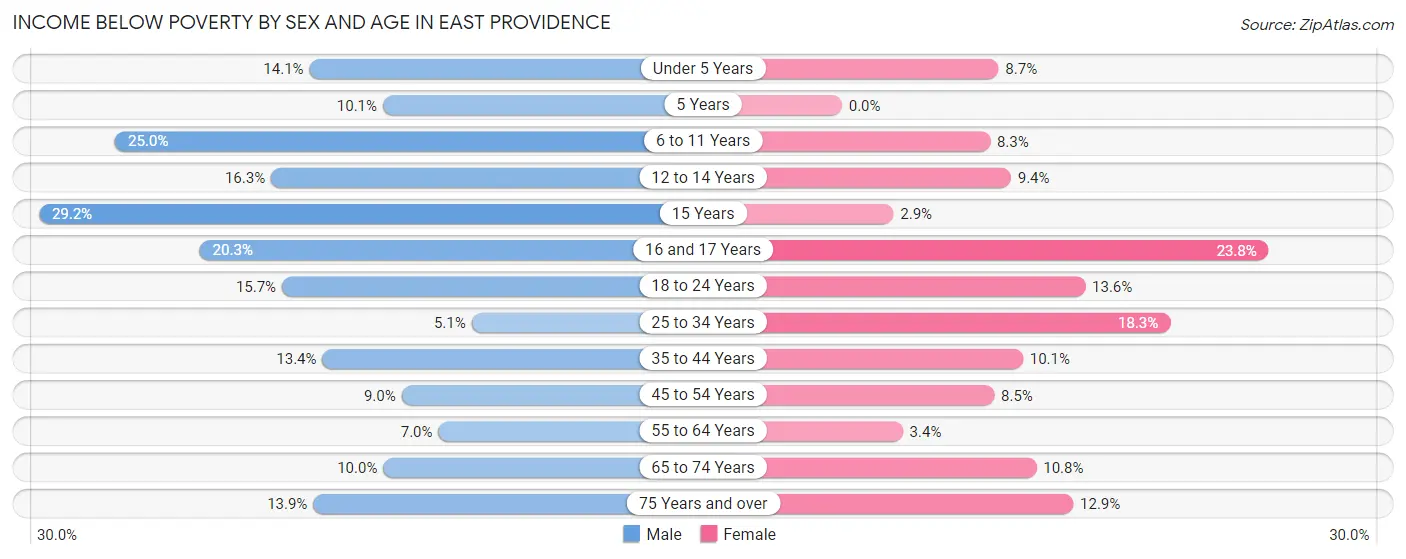
| Age Bracket | Male | Female |
| Under 5 Years | 197 (14.1%) | 91 (8.7%) |
| 5 Years | 20 (10.1%) | 0 (0.0%) |
| 6 to 11 Years | 315 (25.0%) | 96 (8.3%) |
| 12 to 14 Years | 140 (16.3%) | 62 (9.4%) |
| 15 Years | 33 (29.2%) | 5 (2.9%) |
| 16 and 17 Years | 49 (20.3%) | 87 (23.8%) |
| 18 to 24 Years | 263 (15.7%) | 208 (13.6%) |
| 25 to 34 Years | 189 (5.1%) | 614 (18.3%) |
| 35 to 44 Years | 426 (13.4%) | 291 (10.1%) |
| 45 to 54 Years | 276 (9.0%) | 224 (8.5%) |
| 55 to 64 Years | 227 (7.0%) | 133 (3.4%) |
| 65 to 74 Years | 266 (10.0%) | 287 (10.8%) |
| 75 Years and over | 202 (13.9%) | 338 (12.9%) |
| Total | 2,603 (11.3%) | 2,436 (10.5%) |
Income Above Poverty by Sex and Age in East Providence
According to the poverty statistics in East Providence, males aged 25 to 34 years and females aged 5 years are the age groups that are most secure financially, with 94.9% of males and 100.0% of females in these age groups living above the poverty line.
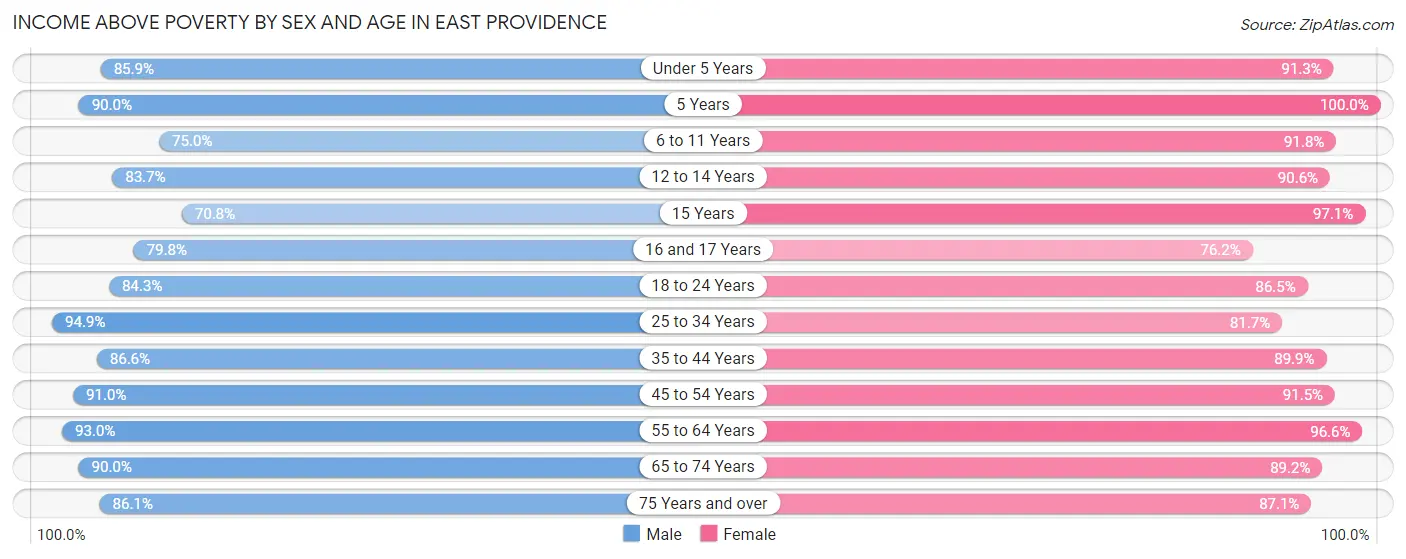
| Age Bracket | Male | Female |
| Under 5 Years | 1,196 (85.9%) | 953 (91.3%) |
| 5 Years | 179 (89.9%) | 173 (100.0%) |
| 6 to 11 Years | 947 (75.0%) | 1,068 (91.7%) |
| 12 to 14 Years | 720 (83.7%) | 597 (90.6%) |
| 15 Years | 80 (70.8%) | 169 (97.1%) |
| 16 and 17 Years | 193 (79.7%) | 279 (76.2%) |
| 18 to 24 Years | 1,415 (84.3%) | 1,327 (86.5%) |
| 25 to 34 Years | 3,508 (94.9%) | 2,745 (81.7%) |
| 35 to 44 Years | 2,748 (86.6%) | 2,596 (89.9%) |
| 45 to 54 Years | 2,788 (91.0%) | 2,417 (91.5%) |
| 55 to 64 Years | 3,036 (93.0%) | 3,790 (96.6%) |
| 65 to 74 Years | 2,387 (90.0%) | 2,362 (89.2%) |
| 75 Years and over | 1,248 (86.1%) | 2,286 (87.1%) |
| Total | 20,445 (88.7%) | 20,762 (89.5%) |
Income Below Poverty Among Married-Couple Families in East Providence
The poverty statistics for married-couple families in East Providence show that 2.2% or 187 of the total 8,321 families live below the poverty line. Families with 3 or 4 children have the highest poverty rate of 11.8%, comprising of 27 families. On the other hand, families with 1 or 2 children have the lowest poverty rate of 1.6%, which includes 43 families.
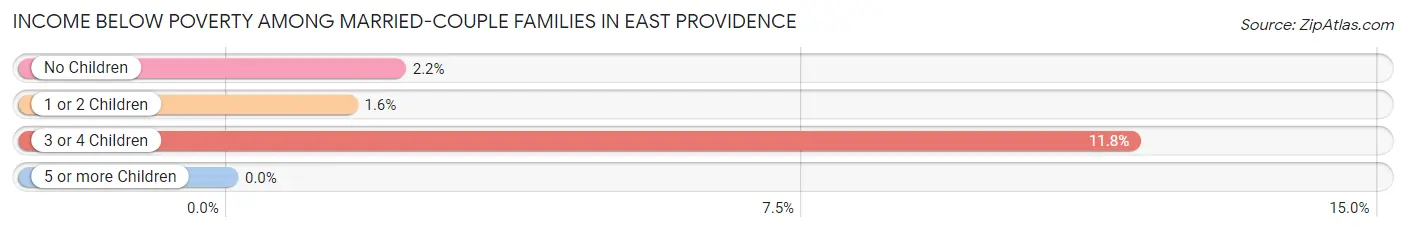
| Children | Above Poverty | Below Poverty |
| No Children | 5,215 (97.8%) | 117 (2.2%) |
| 1 or 2 Children | 2,717 (98.4%) | 43 (1.6%) |
| 3 or 4 Children | 202 (88.2%) | 27 (11.8%) |
| 5 or more Children | 0 (0.0%) | 0 (0.0%) |
| Total | 8,134 (97.8%) | 187 (2.2%) |
Income Below Poverty Among Single-Parent Households in East Providence
According to the poverty data in East Providence, 5.2% or 46 single-father households and 28.0% or 613 single-mother households are living below the poverty line. Among single-father households, those with 3 or 4 children have the highest poverty rate, with 8 households (14.0%) experiencing poverty. Likewise, among single-mother households, those with 1 or 2 children have the highest poverty rate, with 545 households (54.9%) falling below the poverty line.
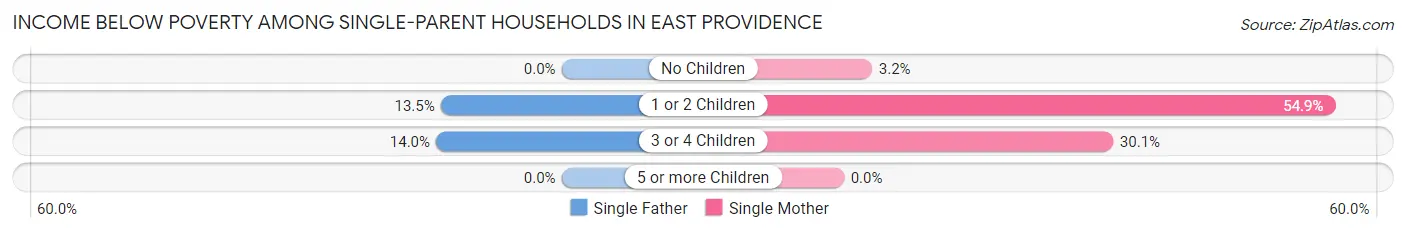
| Children | Single Father | Single Mother |
| No Children | 0 (0.0%) | 34 (3.2%) |
| 1 or 2 Children | 38 (13.5%) | 545 (54.9%) |
| 3 or 4 Children | 8 (14.0%) | 34 (30.1%) |
| 5 or more Children | 0 (0.0%) | 0 (0.0%) |
| Total | 46 (5.2%) | 613 (28.0%) |
Income Below Poverty Among Married-Couple vs Single-Parent Households in East Providence
The poverty data for East Providence shows that 187 of the married-couple family households (2.2%) and 659 of the single-parent households (21.4%) are living below the poverty level. Within the married-couple family households, those with 3 or 4 children have the highest poverty rate, with 27 households (11.8%) falling below the poverty line. Among the single-parent households, those with 1 or 2 children have the highest poverty rate, with 583 household (45.8%) living below poverty.
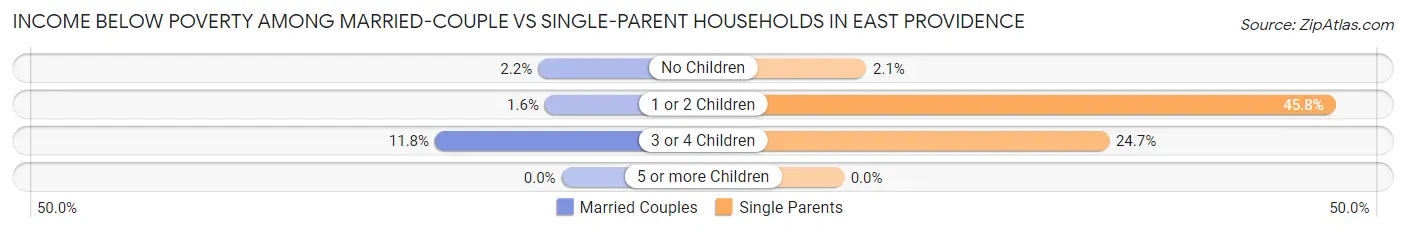
| Children | Married-Couple Families | Single-Parent Households |
| No Children | 117 (2.2%) | 34 (2.1%) |
| 1 or 2 Children | 43 (1.6%) | 583 (45.8%) |
| 3 or 4 Children | 27 (11.8%) | 42 (24.7%) |
| 5 or more Children | 0 (0.0%) | 0 (0.0%) |
| Total | 187 (2.2%) | 659 (21.4%) |
Race in East Providence
The most populous races in East Providence are White / Caucasian (37,592 | 80.0%), Hispanic or Latino (3,848 | 8.2%), and Two or more Races (3,708 | 7.9%).
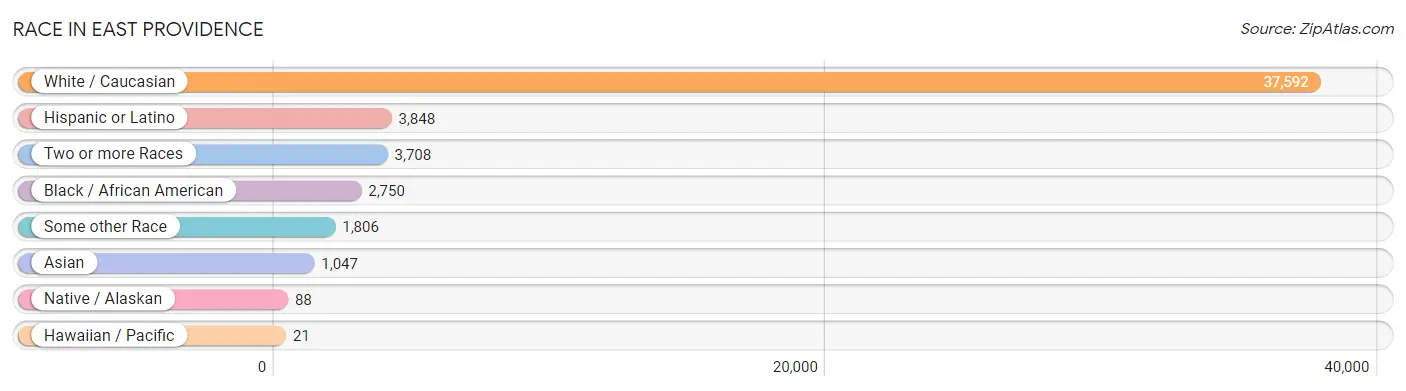
| Race | # Population | % Population |
| Asian | 1,047 | 2.2% |
| Black / African American | 2,750 | 5.9% |
| Hawaiian / Pacific | 21 | 0.0% |
| Hispanic or Latino | 3,848 | 8.2% |
| Native / Alaskan | 88 | 0.2% |
| White / Caucasian | 37,592 | 80.0% |
| Two or more Races | 3,708 | 7.9% |
| Some other Race | 1,806 | 3.8% |
| Total | 47,012 | 100.0% |
Ancestry in East Providence
The most populous ancestries reported in East Providence are Portuguese (10,733 | 22.8%), Irish (8,111 | 17.2%), English (4,983 | 10.6%), Italian (4,652 | 9.9%), and French (3,559 | 7.6%), together accounting for 68.1% of all East Providence residents.
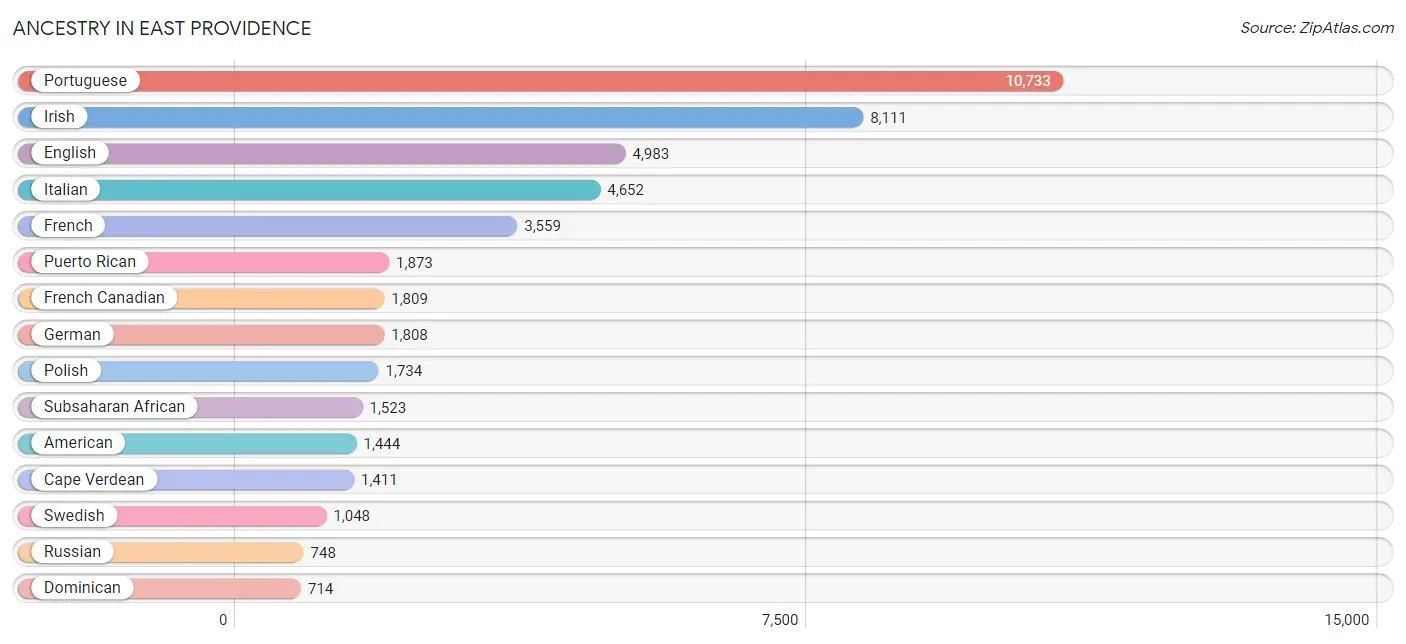
| Ancestry | # Population | % Population |
| African | 61 | 0.1% |
| American | 1,444 | 3.1% |
| Arab | 295 | 0.6% |
| Armenian | 284 | 0.6% |
| Austrian | 32 | 0.1% |
| Barbadian | 102 | 0.2% |
| Bhutanese | 36 | 0.1% |
| Blackfeet | 12 | 0.0% |
| Brazilian | 454 | 1.0% |
| British | 157 | 0.3% |
| British West Indian | 25 | 0.1% |
| Canadian | 114 | 0.2% |
| Cape Verdean | 1,411 | 3.0% |
| Central American | 272 | 0.6% |
| Central American Indian | 11 | 0.0% |
| Cherokee | 83 | 0.2% |
| Choctaw | 21 | 0.0% |
| Colombian | 136 | 0.3% |
| Costa Rican | 15 | 0.0% |
| Cuban | 119 | 0.3% |
| Czech | 58 | 0.1% |
| Czechoslovakian | 11 | 0.0% |
| Danish | 104 | 0.2% |
| Dominican | 714 | 1.5% |
| Dutch | 255 | 0.5% |
| Eastern European | 78 | 0.2% |
| English | 4,983 | 10.6% |
| European | 438 | 0.9% |
| Finnish | 23 | 0.1% |
| French | 3,559 | 7.6% |
| French Canadian | 1,809 | 3.8% |
| German | 1,808 | 3.8% |
| German Russian | 17 | 0.0% |
| Greek | 614 | 1.3% |
| Guatemalan | 165 | 0.4% |
| Haitian | 168 | 0.4% |
| Hungarian | 103 | 0.2% |
| Indian (Asian) | 342 | 0.7% |
| Iranian | 16 | 0.0% |
| Irish | 8,111 | 17.2% |
| Iroquois | 86 | 0.2% |
| Italian | 4,652 | 9.9% |
| Jamaican | 47 | 0.1% |
| Japanese | 186 | 0.4% |
| Korean | 198 | 0.4% |
| Lebanese | 97 | 0.2% |
| Liberian | 12 | 0.0% |
| Lithuanian | 46 | 0.1% |
| Malaysian | 37 | 0.1% |
| Mexican | 386 | 0.8% |
| Mexican American Indian | 58 | 0.1% |
| Native Hawaiian | 21 | 0.0% |
| Navajo | 9 | 0.0% |
| Nicaraguan | 92 | 0.2% |
| Nigerian | 36 | 0.1% |
| Northern European | 39 | 0.1% |
| Norwegian | 233 | 0.5% |
| Palestinian | 29 | 0.1% |
| Peruvian | 136 | 0.3% |
| Polish | 1,734 | 3.7% |
| Portuguese | 10,733 | 22.8% |
| Puerto Rican | 1,873 | 4.0% |
| Romanian | 6 | 0.0% |
| Russian | 748 | 1.6% |
| Scandinavian | 66 | 0.1% |
| Scotch-Irish | 144 | 0.3% |
| Scottish | 714 | 1.5% |
| Seminole | 86 | 0.2% |
| Slavic | 4 | 0.0% |
| Slovak | 11 | 0.0% |
| Somali | 15 | 0.0% |
| South American | 272 | 0.6% |
| Spaniard | 130 | 0.3% |
| Spanish | 34 | 0.1% |
| Sri Lankan | 33 | 0.1% |
| Subsaharan African | 1,523 | 3.2% |
| Swedish | 1,048 | 2.2% |
| Swiss | 32 | 0.1% |
| Syrian | 66 | 0.1% |
| Thai | 370 | 0.8% |
| Ukrainian | 42 | 0.1% |
| Welsh | 94 | 0.2% |
| West Indian | 41 | 0.1% | View All 83 Rows |
Immigrants in East Providence
The most numerous immigrant groups reported in East Providence came from Europe (4,371 | 9.3%), Southern Europe (3,851 | 8.2%), Portugal (3,814 | 8.1%), Latin America (1,346 | 2.9%), and Azores (1,201 | 2.5%), together accounting for 31.0% of all East Providence residents.
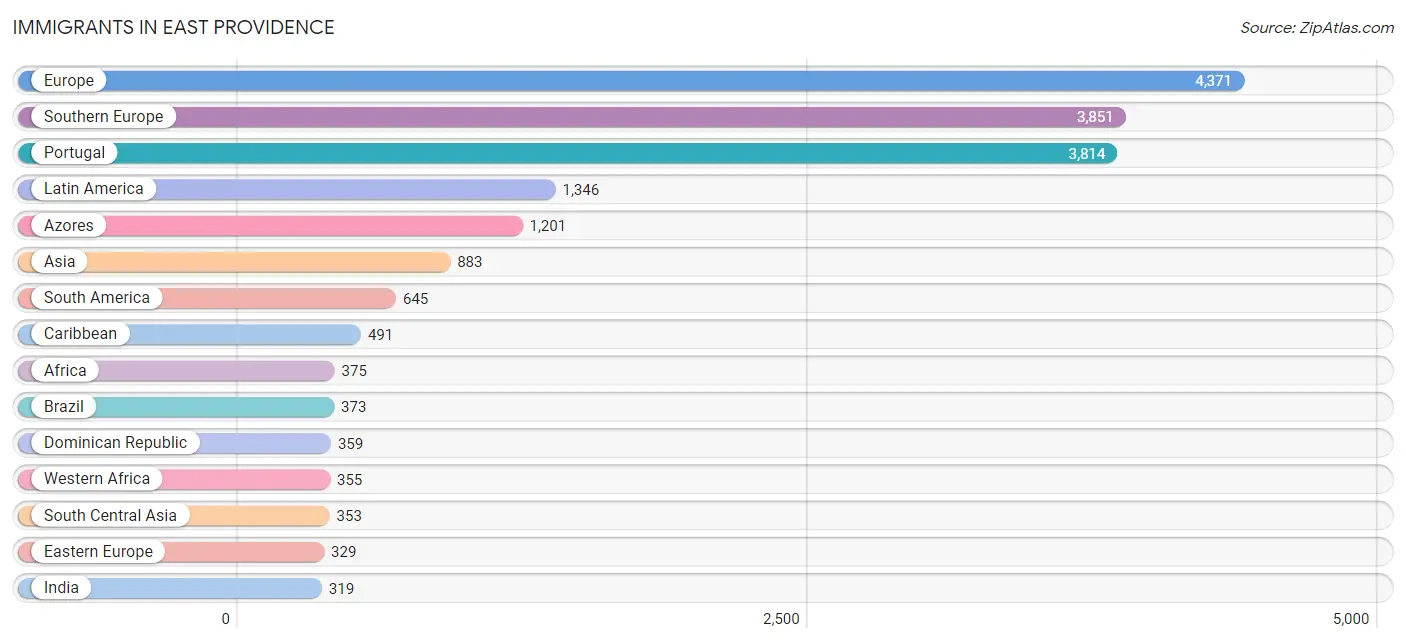
| Immigration Origin | # Population | % Population |
| Africa | 375 | 0.8% |
| Asia | 883 | 1.9% |
| Australia | 13 | 0.0% |
| Azores | 1,201 | 2.5% |
| Barbados | 18 | 0.0% |
| Brazil | 373 | 0.8% |
| Cabo Verde | 312 | 0.7% |
| Cambodia | 61 | 0.1% |
| Canada | 81 | 0.2% |
| Caribbean | 491 | 1.0% |
| Central America | 210 | 0.4% |
| China | 215 | 0.5% |
| Colombia | 136 | 0.3% |
| Costa Rica | 15 | 0.0% |
| Cuba | 46 | 0.1% |
| Dominican Republic | 359 | 0.8% |
| Eastern Asia | 240 | 0.5% |
| Eastern Europe | 329 | 0.7% |
| England | 36 | 0.1% |
| Europe | 4,371 | 9.3% |
| France | 34 | 0.1% |
| Germany | 57 | 0.1% |
| Guatemala | 84 | 0.2% |
| Haiti | 39 | 0.1% |
| Hong Kong | 21 | 0.0% |
| Hungary | 31 | 0.1% |
| India | 319 | 0.7% |
| Iran | 16 | 0.0% |
| Ireland | 4 | 0.0% |
| Italy | 36 | 0.1% |
| Japan | 25 | 0.1% |
| Kazakhstan | 18 | 0.0% |
| Latin America | 1,346 | 2.9% |
| Liberia | 16 | 0.0% |
| Mexico | 111 | 0.2% |
| Middle Africa | 2 | 0.0% |
| Netherlands | 22 | 0.1% |
| Nigeria | 27 | 0.1% |
| Northern Africa | 18 | 0.0% |
| Northern Europe | 78 | 0.2% |
| Oceania | 13 | 0.0% |
| Peru | 136 | 0.3% |
| Philippines | 123 | 0.3% |
| Poland | 9 | 0.0% |
| Portugal | 3,814 | 8.1% |
| Romania | 6 | 0.0% |
| Russia | 283 | 0.6% |
| Scotland | 24 | 0.1% |
| South America | 645 | 1.4% |
| South Central Asia | 353 | 0.7% |
| South Eastern Asia | 197 | 0.4% |
| Southern Europe | 3,851 | 8.2% |
| Spain | 1 | 0.0% |
| Syria | 80 | 0.2% |
| Vietnam | 13 | 0.0% |
| Western Africa | 355 | 0.8% |
| Western Asia | 93 | 0.2% |
| Western Europe | 113 | 0.2% | View All 58 Rows |
Sex and Age in East Providence
Sex and Age in East Providence
The most populous age groups in East Providence are 30 to 34 Years (1,886 | 8.1%) for men and 60 to 64 Years (2,189 | 9.3%) for women.
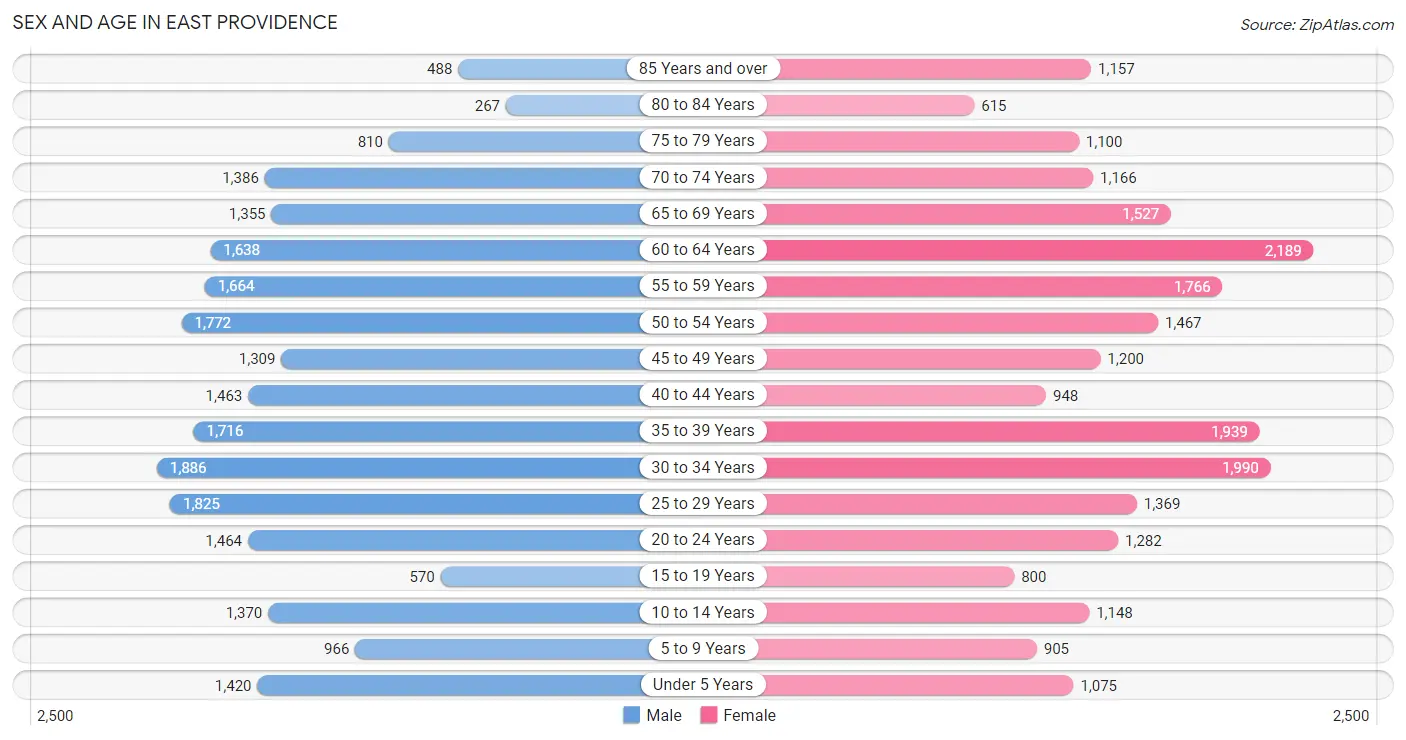
| Age Bracket | Male | Female |
| Under 5 Years | 1,420 (6.1%) | 1,075 (4.5%) |
| 5 to 9 Years | 966 (4.1%) | 905 (3.8%) |
| 10 to 14 Years | 1,370 (5.9%) | 1,148 (4.9%) |
| 15 to 19 Years | 570 (2.4%) | 800 (3.4%) |
| 20 to 24 Years | 1,464 (6.3%) | 1,282 (5.4%) |
| 25 to 29 Years | 1,825 (7.8%) | 1,369 (5.8%) |
| 30 to 34 Years | 1,886 (8.1%) | 1,990 (8.4%) |
| 35 to 39 Years | 1,716 (7.3%) | 1,939 (8.2%) |
| 40 to 44 Years | 1,463 (6.3%) | 948 (4.0%) |
| 45 to 49 Years | 1,309 (5.6%) | 1,200 (5.1%) |
| 50 to 54 Years | 1,772 (7.6%) | 1,467 (6.2%) |
| 55 to 59 Years | 1,664 (7.1%) | 1,766 (7.5%) |
| 60 to 64 Years | 1,638 (7.0%) | 2,189 (9.3%) |
| 65 to 69 Years | 1,355 (5.8%) | 1,527 (6.5%) |
| 70 to 74 Years | 1,386 (5.9%) | 1,166 (4.9%) |
| 75 to 79 Years | 810 (3.5%) | 1,100 (4.6%) |
| 80 to 84 Years | 267 (1.1%) | 615 (2.6%) |
| 85 Years and over | 488 (2.1%) | 1,157 (4.9%) |
| Total | 23,369 (100.0%) | 23,643 (100.0%) |
Families and Households in East Providence
Median Family Size in East Providence
The median family size in East Providence is 3.00 persons per family, with married-couple families (8,321 | 73.0%) accounting for the largest median family size of 3.13 persons per family. On the other hand, single male/father families (886 | 7.8%) represent the smallest median family size with 2.59 persons per family.
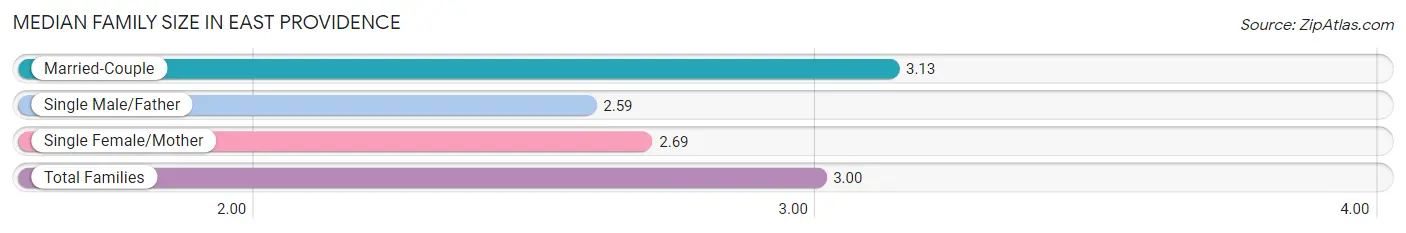
| Family Type | # Families | Family Size |
| Married-Couple | 8,321 (73.0%) | 3.13 |
| Single Male/Father | 886 (7.8%) | 2.59 |
| Single Female/Mother | 2,186 (19.2%) | 2.69 |
| Total Families | 11,393 (100.0%) | 3.00 |
Median Household Size in East Providence
The median household size in East Providence is 2.27 persons per household, with married-couple households (8,321 | 40.8%) accounting for the largest median household size of 3.17 persons per household. non-family households (9,017 | 44.2%) represent the smallest median household size with 1.18 persons per household.
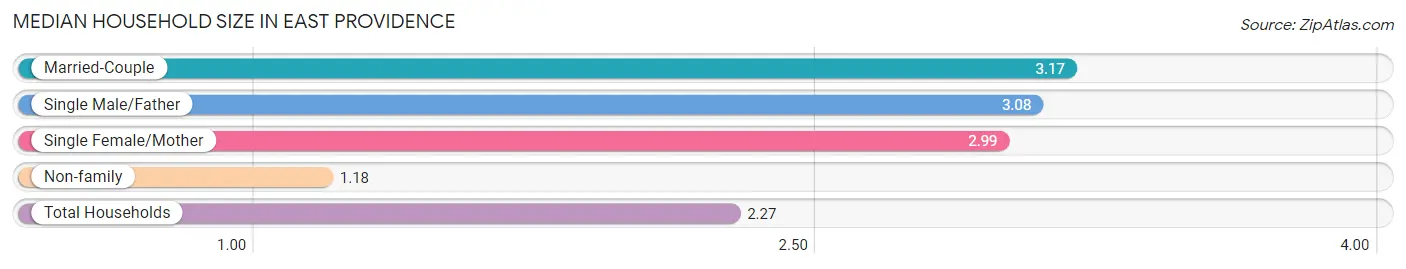
| Household Type | # Households | Household Size |
| Married-Couple | 8,321 (40.8%) | 3.17 |
| Single Male/Father | 886 (4.3%) | 3.08 |
| Single Female/Mother | 2,186 (10.7%) | 2.99 |
| Non-family | 9,017 (44.2%) | 1.18 |
| Total Households | 20,410 (100.0%) | 2.27 |
Household Size by Marriage Status in East Providence
Out of a total of 20,410 households in East Providence, 11,393 (55.8%) are family households, while 9,017 (44.2%) are nonfamily households. The most numerous type of family households are 2-person households, comprising 5,493, and the most common type of nonfamily households are 1-person households, comprising 7,592.
| Household Size | Family Households | Nonfamily Households |
| 1-Person Households | - | 7,592 (37.2%) |
| 2-Person Households | 5,493 (26.9%) | 1,371 (6.7%) |
| 3-Person Households | 2,566 (12.6%) | 50 (0.2%) |
| 4-Person Households | 2,200 (10.8%) | 4 (0.0%) |
| 5-Person Households | 851 (4.2%) | 0 (0.0%) |
| 6-Person Households | 139 (0.7%) | 0 (0.0%) |
| 7+ Person Households | 144 (0.7%) | 0 (0.0%) |
| Total | 11,393 (55.8%) | 9,017 (44.2%) |
Female Fertility in East Providence
Fertility by Age in East Providence
Average fertility rate in East Providence is 63.0 births per 1,000 women. Women in the age bracket of 20 to 34 years have the highest fertility rate with 84.0 births per 1,000 women. Women in the age bracket of 20 to 34 years acount for 63.1% of all women with births.
| Age Bracket | Women with Births | Births / 1,000 Women |
| 15 to 19 years | 0 (0.0%) | 0.0 |
| 20 to 34 years | 388 (63.1%) | 84.0 |
| 35 to 50 years | 227 (36.9%) | 52.0 |
| Total | 615 (100.0%) | 63.0 |
Fertility by Age by Marriage Status in East Providence
68.3% of women with births (615) in East Providence are married. The highest percentage of unmarried women with births falls into 20 to 34 years age bracket with 45.6% of them unmarried at the time of birth, while the lowest percentage of unmarried women with births belong to 35 to 50 years age bracket with 7.9% of them unmarried.
| Age Bracket | Married | Unmarried |
| 15 to 19 years | 0 (0.0%) | 0 (0.0%) |
| 20 to 34 years | 211 (54.4%) | 177 (45.6%) |
| 35 to 50 years | 209 (92.1%) | 18 (7.9%) |
| Total | 420 (68.3%) | 195 (31.7%) |
Fertility by Education in East Providence
Average fertility rate in East Providence is 63.0 births per 1,000 women. Women with the education attainment of high school diploma have the highest fertility rate of 105.0 births per 1,000 women, while women with the education attainment of bachelor's degree have the lowest fertility at 33.0 births per 1,000 women. Women with the education attainment of high school diploma represent 31.1% of all women with births.
| Educational Attainment | Women with Births | Births / 1,000 Women |
| Less than High School | 61 (9.9%) | 48.0 |
| High School Diploma | 191 (31.1%) | 105.0 |
| College or Associate's Degree | 140 (22.8%) | 47.0 |
| Bachelor's Degree | 69 (11.2%) | 33.0 |
| Graduate Degree | 154 (25.0%) | 93.0 |
| Total | 615 (100.0%) | 63.0 |
Fertility by Education by Marriage Status in East Providence
31.7% of women with births in East Providence are unmarried. Women with the educational attainment of less than high school are most likely to be married with 100.0% of them married at childbirth, while women with the educational attainment of college or associate's degree are least likely to be married with 70.0% of them unmarried at childbirth.
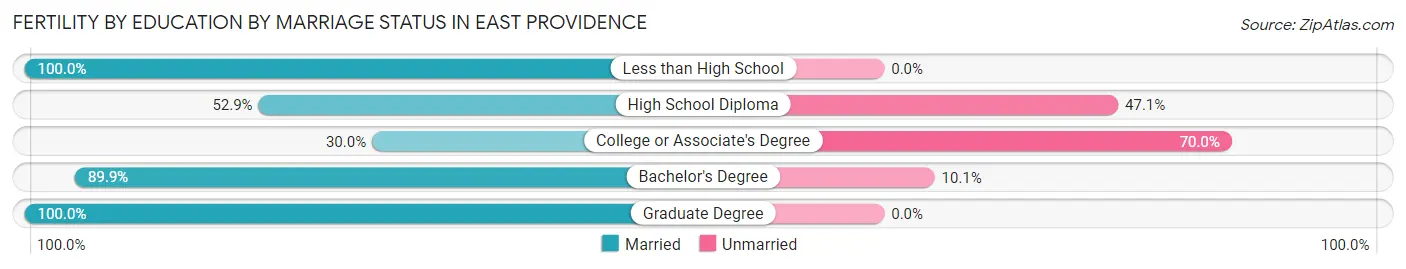
| Educational Attainment | Married | Unmarried |
| Less than High School | 61 (100.0%) | 0 (0.0%) |
| High School Diploma | 101 (52.9%) | 90 (47.1%) |
| College or Associate's Degree | 42 (30.0%) | 98 (70.0%) |
| Bachelor's Degree | 62 (89.9%) | 7 (10.1%) |
| Graduate Degree | 154 (100.0%) | 0 (0.0%) |
| Total | 420 (68.3%) | 195 (31.7%) |
Employment Characteristics in East Providence
Employment by Class of Employer in East Providence
Among the 23,765 employed individuals in East Providence, private company employees (16,149 | 67.9%), not-for-profit organizations (3,128 | 13.2%), and local government employees (1,578 | 6.6%) make up the most common classes of employment.
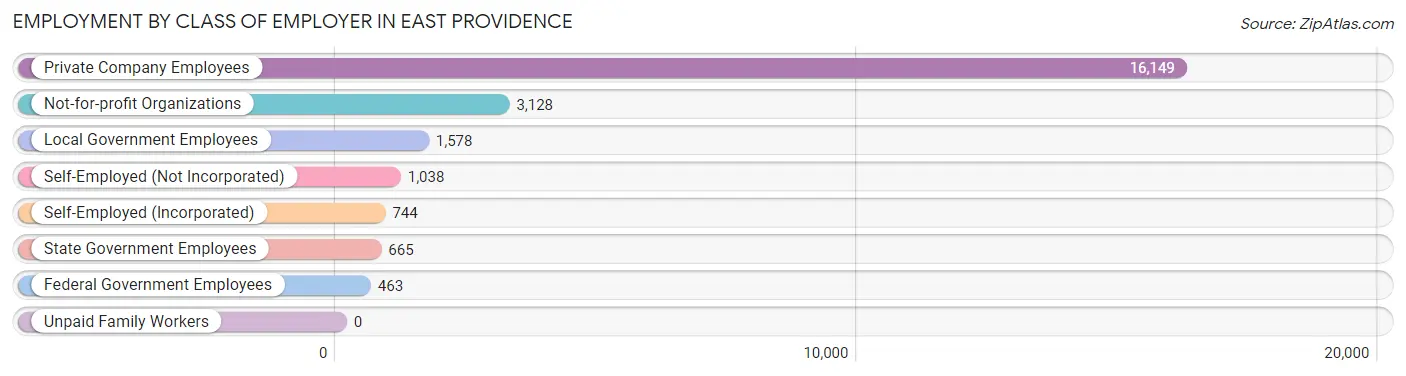
| Employer Class | # Employees | % Employees |
| Private Company Employees | 16,149 | 67.9% |
| Self-Employed (Incorporated) | 744 | 3.1% |
| Self-Employed (Not Incorporated) | 1,038 | 4.4% |
| Not-for-profit Organizations | 3,128 | 13.2% |
| Local Government Employees | 1,578 | 6.6% |
| State Government Employees | 665 | 2.8% |
| Federal Government Employees | 463 | 1.9% |
| Unpaid Family Workers | 0 | 0.0% |
| Total | 23,765 | 100.0% |
Employment Status by Age in East Providence
According to the labor force statistics for East Providence, out of the total population over 16 years of age (39,841), 64.8% or 25,817 individuals are in the labor force, with 5.6% or 1,446 of them unemployed. The age group with the highest labor force participation rate is 25 to 29 years, with 88.3% or 2,820 individuals in the labor force. Within the labor force, the 16 to 19 years age range has the highest percentage of unemployed individuals, with 14.8% or 63 of them being unemployed.
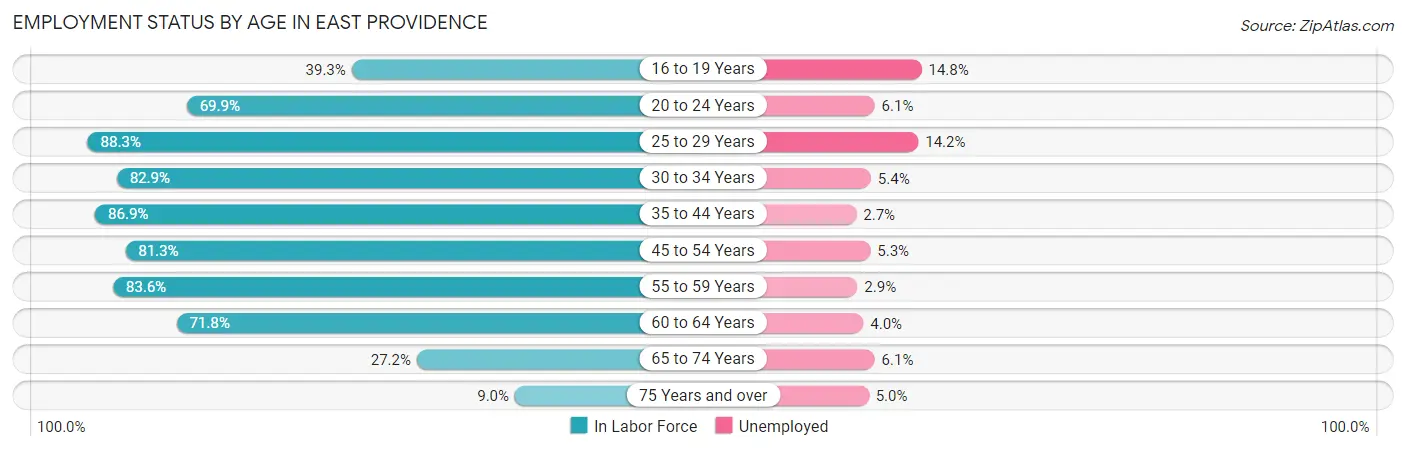
| Age Bracket | In Labor Force | Unemployed |
| 16 to 19 Years | 426 (39.3%) | 63 (14.8%) |
| 20 to 24 Years | 1,919 (69.9%) | 117 (6.1%) |
| 25 to 29 Years | 2,820 (88.3%) | 400 (14.2%) |
| 30 to 34 Years | 3,213 (82.9%) | 174 (5.4%) |
| 35 to 44 Years | 5,271 (86.9%) | 142 (2.7%) |
| 45 to 54 Years | 4,673 (81.3%) | 248 (5.3%) |
| 55 to 59 Years | 2,867 (83.6%) | 83 (2.9%) |
| 60 to 64 Years | 2,748 (71.8%) | 110 (4.0%) |
| 65 to 74 Years | 1,478 (27.2%) | 90 (6.1%) |
| 75 Years and over | 399 (9.0%) | 20 (5.0%) |
| Total | 25,817 (64.8%) | 1,446 (5.6%) |
Employment Status by Educational Attainment in East Providence
According to labor force statistics for East Providence, 82.6% of individuals (21,592) out of the total population between 25 and 64 years of age (26,141) are in the labor force, with 5.3% or 1,144 of them being unemployed. The group with the highest labor force participation rate are those with the educational attainment of college / associate degree, with 89.9% or 6,344 individuals in the labor force. Within the labor force, individuals with high school diploma education have the highest percentage of unemployment, with 10.5% or 543 of them being unemployed.
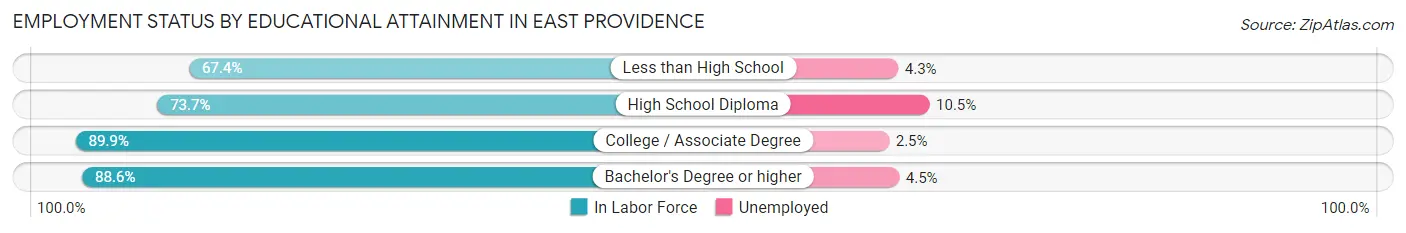
| Educational Attainment | In Labor Force | Unemployed |
| Less than High School | 1,940 (67.4%) | 124 (4.3%) |
| High School Diploma | 5,174 (73.7%) | 737 (10.5%) |
| College / Associate Degree | 6,344 (89.9%) | 176 (2.5%) |
| Bachelor's Degree or higher | 8,138 (88.6%) | 413 (4.5%) |
| Total | 21,592 (82.6%) | 1,385 (5.3%) |
Employment Occupations by Sex in East Providence
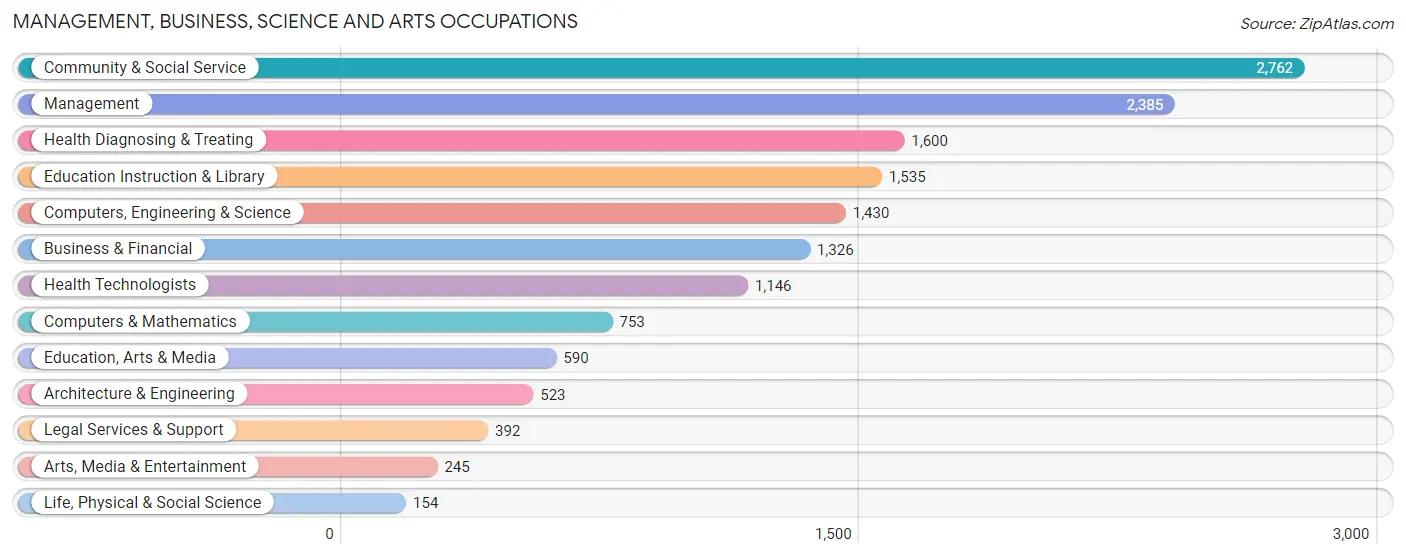
Management, Business, Science and Arts Occupations
The most common Management, Business, Science and Arts occupations in East Providence are Community & Social Service (2,762 | 11.3%), Management (2,385 | 9.8%), Health Diagnosing & Treating (1,600 | 6.6%), Education Instruction & Library (1,535 | 6.3%), and Computers, Engineering & Science (1,430 | 5.9%).
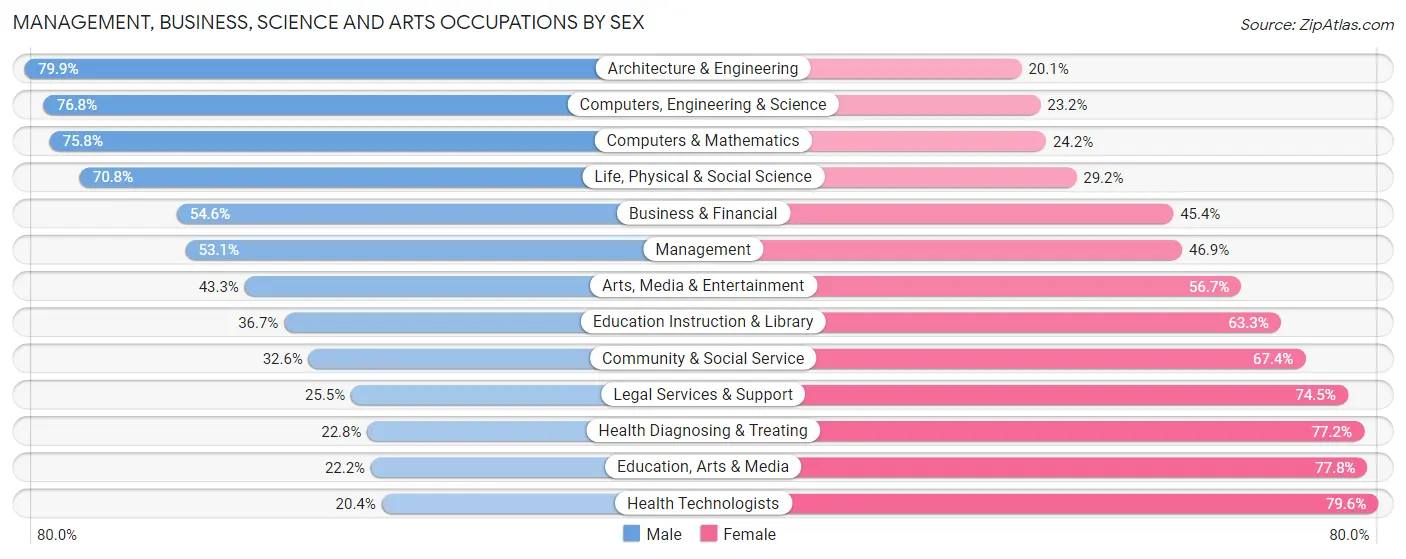
Management, Business, Science and Arts Occupations by Sex
Within the Management, Business, Science and Arts occupations in East Providence, the most male-oriented occupations are Architecture & Engineering (79.9%), Computers, Engineering & Science (76.8%), and Computers & Mathematics (75.8%), while the most female-oriented occupations are Health Technologists (79.6%), Education, Arts & Media (77.8%), and Health Diagnosing & Treating (77.2%).
| Occupation | Male | Female |
| Management | 1,267 (53.1%) | 1,118 (46.9%) |
| Business & Financial | 724 (54.6%) | 602 (45.4%) |
| Computers, Engineering & Science | 1,098 (76.8%) | 332 (23.2%) |
| Computers & Mathematics | 571 (75.8%) | 182 (24.2%) |
| Architecture & Engineering | 418 (79.9%) | 105 (20.1%) |
| Life, Physical & Social Science | 109 (70.8%) | 45 (29.2%) |
| Community & Social Service | 900 (32.6%) | 1,862 (67.4%) |
| Education, Arts & Media | 131 (22.2%) | 459 (77.8%) |
| Legal Services & Support | 100 (25.5%) | 292 (74.5%) |
| Education Instruction & Library | 563 (36.7%) | 972 (63.3%) |
| Arts, Media & Entertainment | 106 (43.3%) | 139 (56.7%) |
| Health Diagnosing & Treating | 365 (22.8%) | 1,235 (77.2%) |
| Health Technologists | 234 (20.4%) | 912 (79.6%) |
| Total (Category) | 4,354 (45.8%) | 5,149 (54.2%) |
| Total (Overall) | 12,244 (50.3%) | 12,107 (49.7%) |
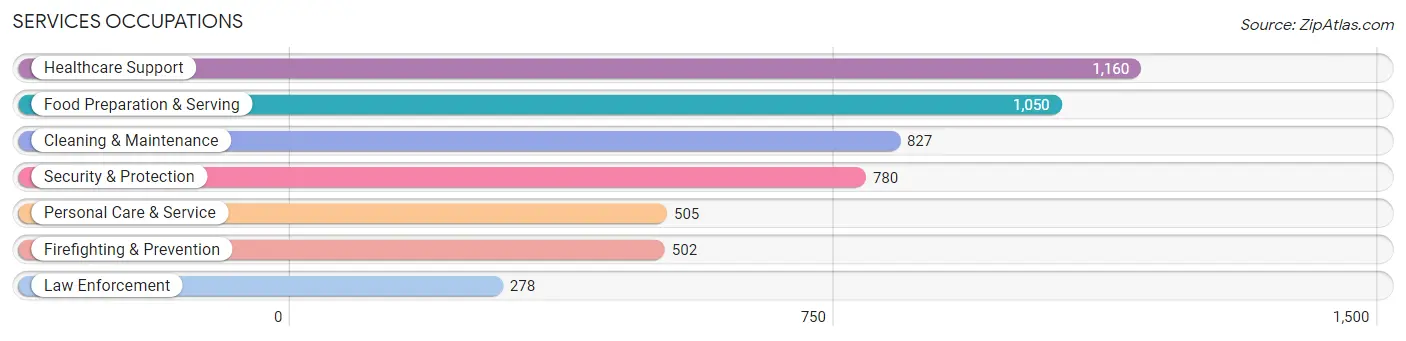
Services Occupations
The most common Services occupations in East Providence are Healthcare Support (1,160 | 4.8%), Food Preparation & Serving (1,050 | 4.3%), Cleaning & Maintenance (827 | 3.4%), Security & Protection (780 | 3.2%), and Personal Care & Service (505 | 2.1%).
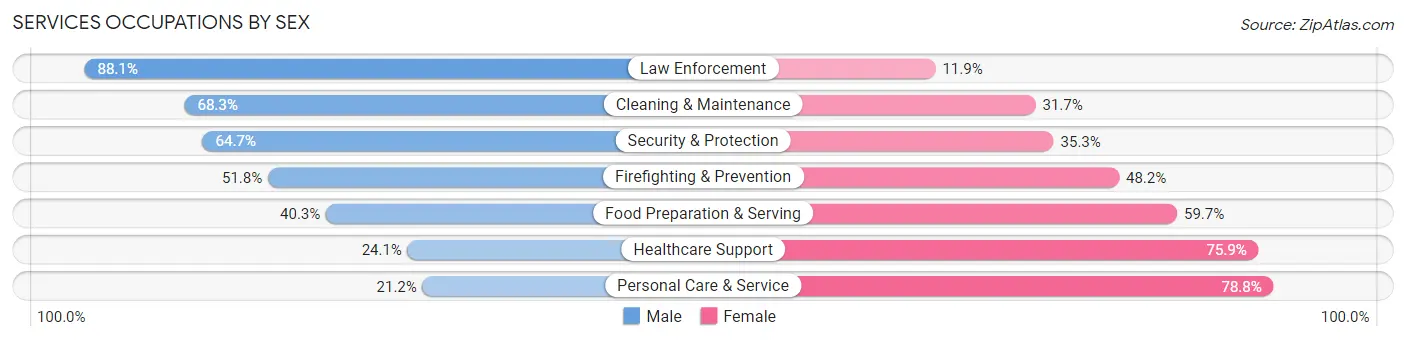
Services Occupations by Sex
Within the Services occupations in East Providence, the most male-oriented occupations are Law Enforcement (88.1%), Cleaning & Maintenance (68.3%), and Security & Protection (64.7%), while the most female-oriented occupations are Personal Care & Service (78.8%), Healthcare Support (75.9%), and Food Preparation & Serving (59.7%).
| Occupation | Male | Female |
| Healthcare Support | 280 (24.1%) | 880 (75.9%) |
| Security & Protection | 505 (64.7%) | 275 (35.3%) |
| Firefighting & Prevention | 260 (51.8%) | 242 (48.2%) |
| Law Enforcement | 245 (88.1%) | 33 (11.9%) |
| Food Preparation & Serving | 423 (40.3%) | 627 (59.7%) |
| Cleaning & Maintenance | 565 (68.3%) | 262 (31.7%) |
| Personal Care & Service | 107 (21.2%) | 398 (78.8%) |
| Total (Category) | 1,880 (43.5%) | 2,442 (56.5%) |
| Total (Overall) | 12,244 (50.3%) | 12,107 (49.7%) |
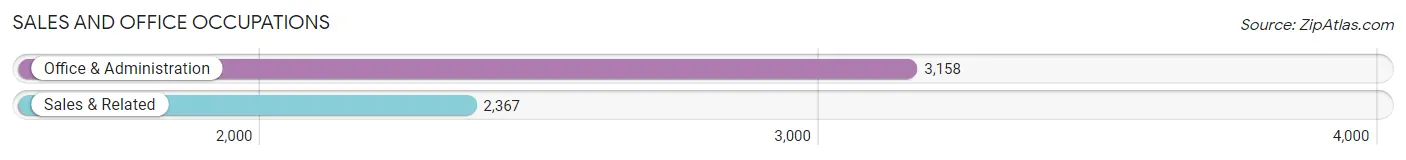
Sales and Office Occupations
The most common Sales and Office occupations in East Providence are Office & Administration (3,158 | 13.0%), and Sales & Related (2,367 | 9.7%).
Sales and Office Occupations by Sex
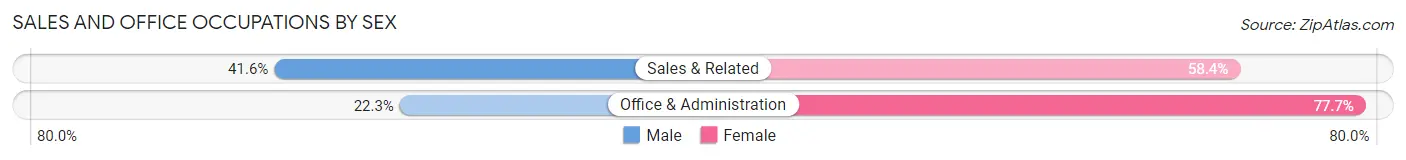
| Occupation | Male | Female |
| Sales & Related | 985 (41.6%) | 1,382 (58.4%) |
| Office & Administration | 704 (22.3%) | 2,454 (77.7%) |
| Total (Category) | 1,689 (30.6%) | 3,836 (69.4%) |
| Total (Overall) | 12,244 (50.3%) | 12,107 (49.7%) |
Natural Resources, Construction and Maintenance Occupations
The most common Natural Resources, Construction and Maintenance occupations in East Providence are Construction & Extraction (1,305 | 5.4%), Installation, Maintenance & Repair (877 | 3.6%), and Farming, Fishing & Forestry (78 | 0.3%).

Natural Resources, Construction and Maintenance Occupations by Sex
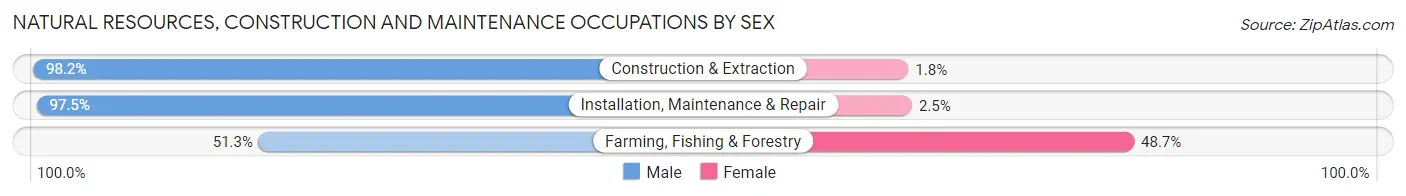
| Occupation | Male | Female |
| Farming, Fishing & Forestry | 40 (51.3%) | 38 (48.7%) |
| Construction & Extraction | 1,282 (98.2%) | 23 (1.8%) |
| Installation, Maintenance & Repair | 855 (97.5%) | 22 (2.5%) |
| Total (Category) | 2,177 (96.3%) | 83 (3.7%) |
| Total (Overall) | 12,244 (50.3%) | 12,107 (49.7%) |
Production, Transportation and Moving Occupations
The most common Production, Transportation and Moving occupations in East Providence are Production (1,224 | 5.0%), Material Moving (930 | 3.8%), and Transportation (587 | 2.4%).
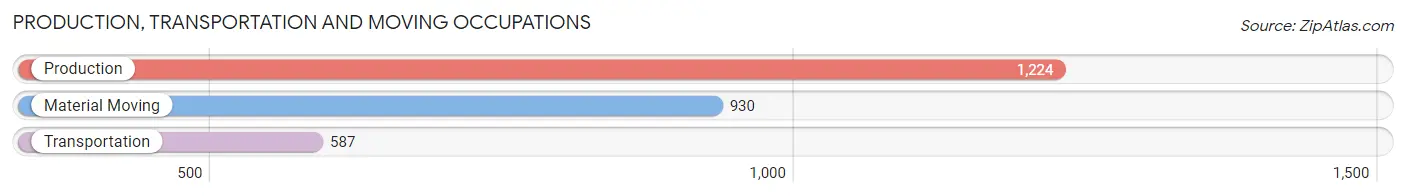
Production, Transportation and Moving Occupations by Sex
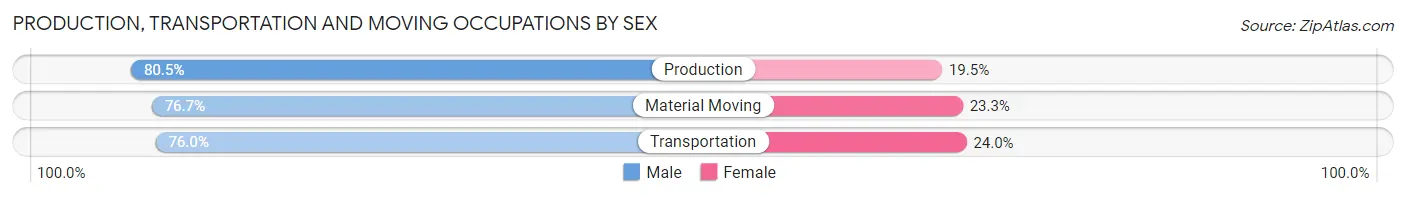
| Occupation | Male | Female |
| Production | 985 (80.5%) | 239 (19.5%) |
| Transportation | 446 (76.0%) | 141 (24.0%) |
| Material Moving | 713 (76.7%) | 217 (23.3%) |
| Total (Category) | 2,144 (78.2%) | 597 (21.8%) |
| Total (Overall) | 12,244 (50.3%) | 12,107 (49.7%) |
Employment Industries by Sex in East Providence
Employment Industries in East Providence
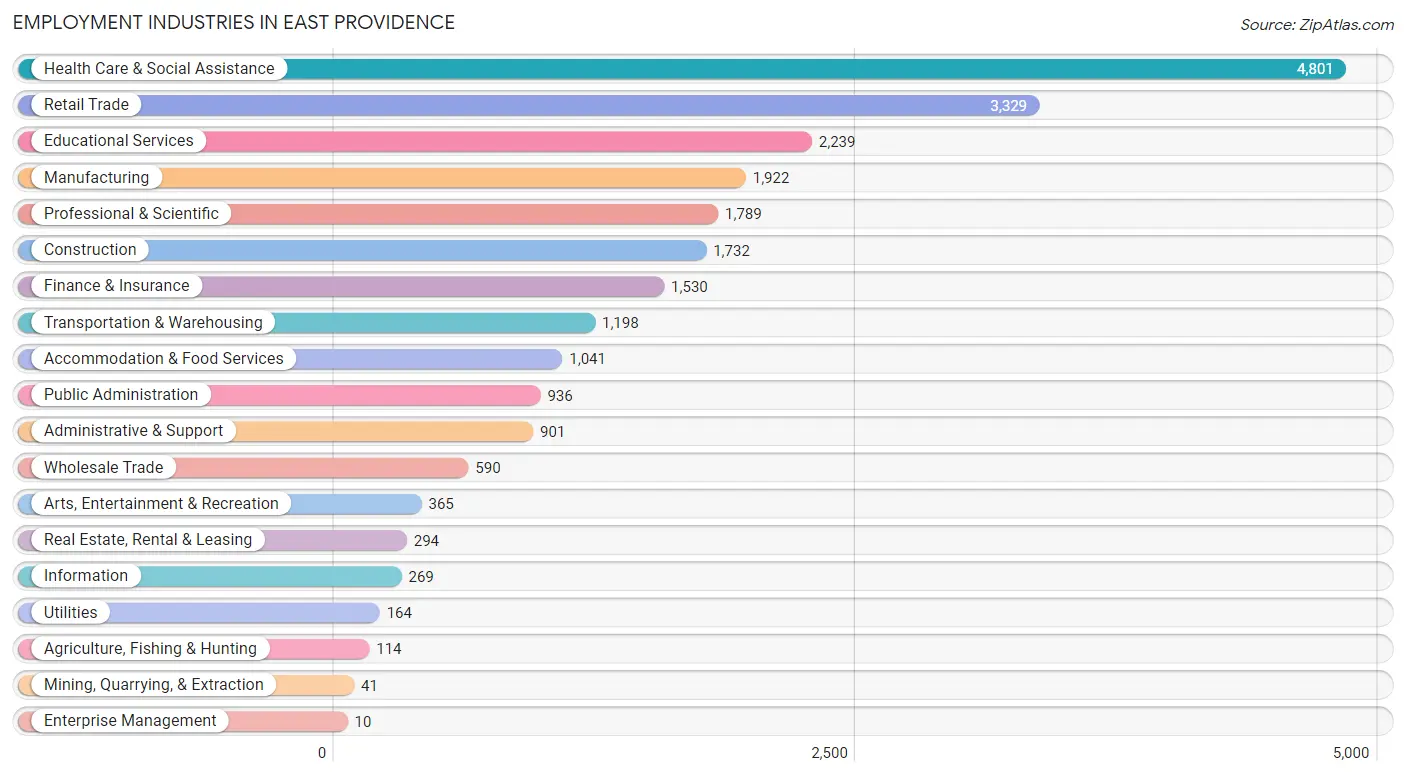
The major employment industries in East Providence include Health Care & Social Assistance (4,801 | 19.7%), Retail Trade (3,329 | 13.7%), Educational Services (2,239 | 9.2%), Manufacturing (1,922 | 7.9%), and Professional & Scientific (1,789 | 7.3%).
Employment Industries by Sex in East Providence
The East Providence industries that see more men than women are Utilities (90.8%), Construction (87.7%), and Manufacturing (74.0%), whereas the industries that tend to have a higher number of women are Enterprise Management (100.0%), Health Care & Social Assistance (75.3%), and Finance & Insurance (63.8%).
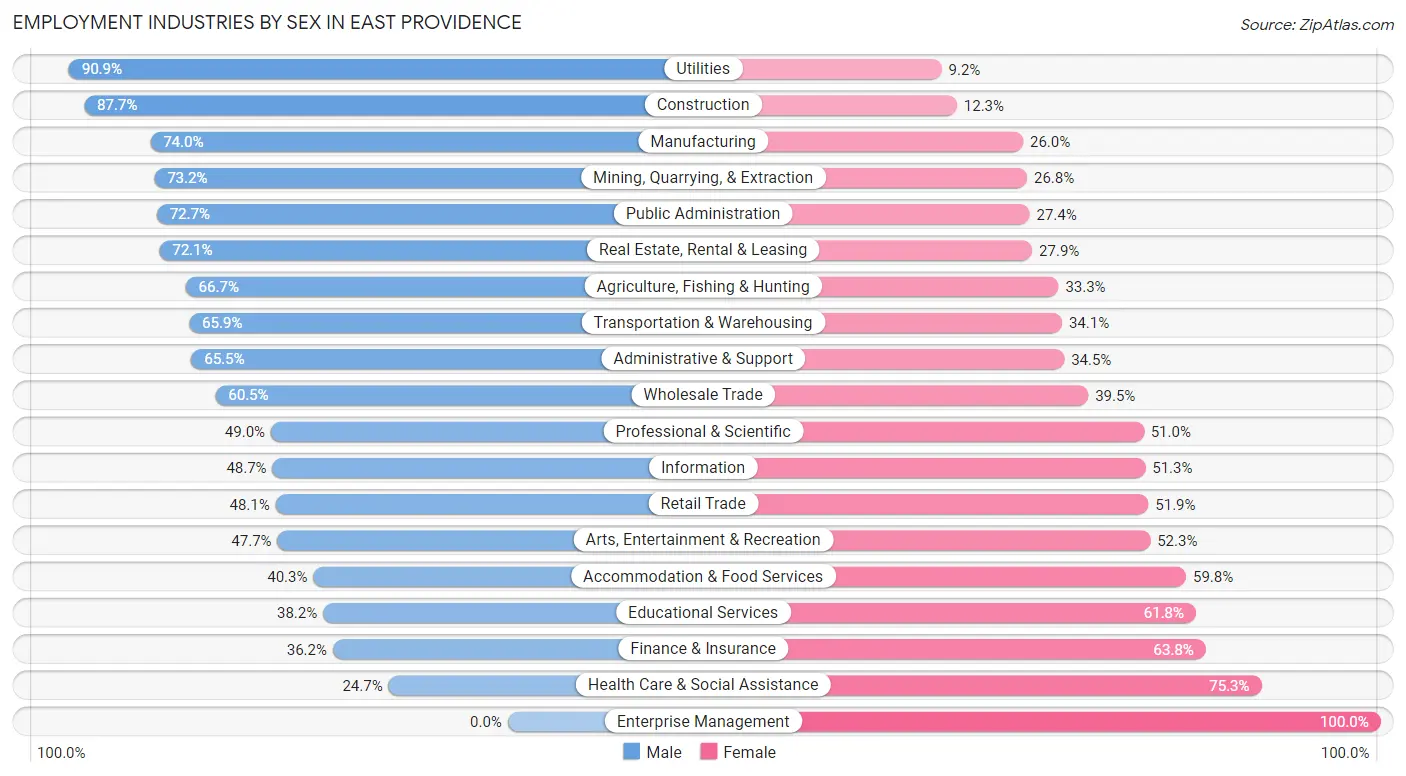
| Industry | Male | Female |
| Agriculture, Fishing & Hunting | 76 (66.7%) | 38 (33.3%) |
| Mining, Quarrying, & Extraction | 30 (73.2%) | 11 (26.8%) |
| Construction | 1,519 (87.7%) | 213 (12.3%) |
| Manufacturing | 1,422 (74.0%) | 500 (26.0%) |
| Wholesale Trade | 357 (60.5%) | 233 (39.5%) |
| Retail Trade | 1,600 (48.1%) | 1,729 (51.9%) |
| Transportation & Warehousing | 790 (65.9%) | 408 (34.1%) |
| Utilities | 149 (90.8%) | 15 (9.1%) |
| Information | 131 (48.7%) | 138 (51.3%) |
| Finance & Insurance | 554 (36.2%) | 976 (63.8%) |
| Real Estate, Rental & Leasing | 212 (72.1%) | 82 (27.9%) |
| Professional & Scientific | 877 (49.0%) | 912 (51.0%) |
| Enterprise Management | 0 (0.0%) | 10 (100.0%) |
| Administrative & Support | 590 (65.5%) | 311 (34.5%) |
| Educational Services | 856 (38.2%) | 1,383 (61.8%) |
| Health Care & Social Assistance | 1,185 (24.7%) | 3,616 (75.3%) |
| Arts, Entertainment & Recreation | 174 (47.7%) | 191 (52.3%) |
| Accommodation & Food Services | 419 (40.3%) | 622 (59.8%) |
| Public Administration | 680 (72.7%) | 256 (27.4%) |
| Total | 12,244 (50.3%) | 12,107 (49.7%) |
Education in East Providence
School Enrollment in East Providence
The most common levels of schooling among the 8,520 students in East Providence are middle school (1,796 | 21.1%), elementary school (1,701 | 20.0%), and college / undergraduate (1,575 | 18.5%).
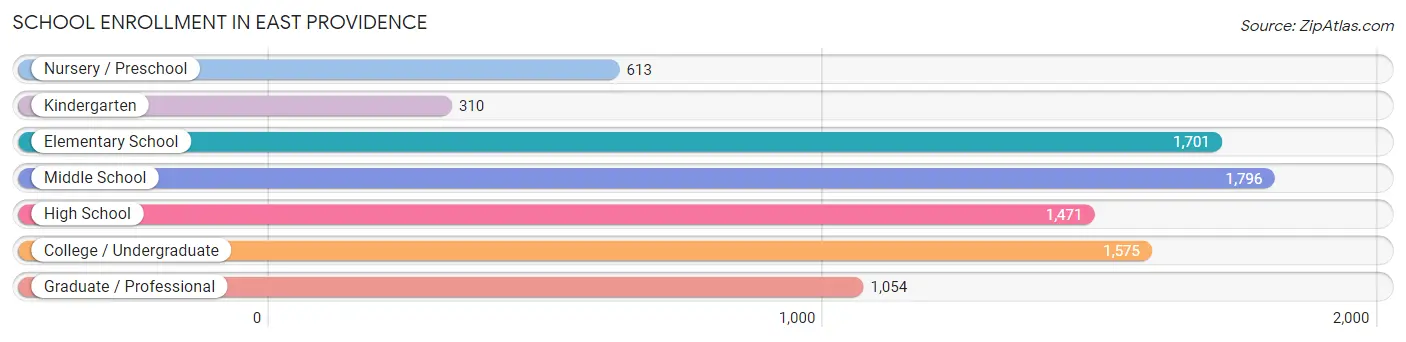
| School Level | # Students | % Students |
| Nursery / Preschool | 613 | 7.2% |
| Kindergarten | 310 | 3.6% |
| Elementary School | 1,701 | 20.0% |
| Middle School | 1,796 | 21.1% |
| High School | 1,471 | 17.3% |
| College / Undergraduate | 1,575 | 18.5% |
| Graduate / Professional | 1,054 | 12.4% |
| Total | 8,520 | 100.0% |
School Enrollment by Age by Funding Source in East Providence
Out of a total of 8,520 students who are enrolled in schools in East Providence, 2,113 (24.8%) attend a private institution, while the remaining 6,407 (75.2%) are enrolled in public schools. The age group of 35 years and over has the highest likelihood of being enrolled in private schools, with 518 (65.8% in the age bracket) enrolled. Conversely, the age group of 18 to 19 year olds has the lowest likelihood of being enrolled in a private school, with 300 (92.3% in the age bracket) attending a public institution.
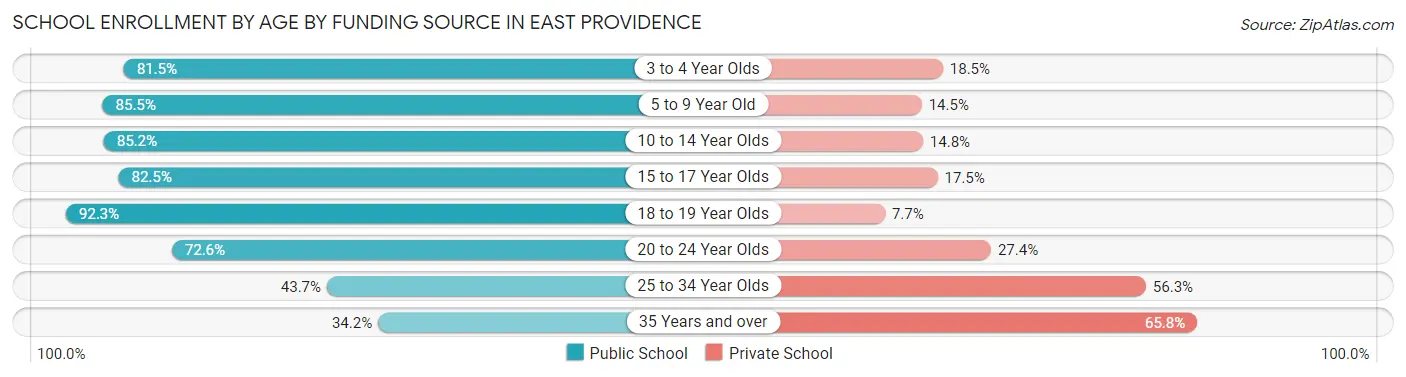
| Age Bracket | Public School | Private School |
| 3 to 4 Year Olds | 397 (81.5%) | 90 (18.5%) |
| 5 to 9 Year Old | 1,534 (85.5%) | 261 (14.5%) |
| 10 to 14 Year Olds | 2,126 (85.2%) | 368 (14.8%) |
| 15 to 17 Year Olds | 740 (82.5%) | 157 (17.5%) |
| 18 to 19 Year Olds | 300 (92.3%) | 25 (7.7%) |
| 20 to 24 Year Olds | 706 (72.6%) | 267 (27.4%) |
| 25 to 34 Year Olds | 333 (43.7%) | 429 (56.3%) |
| 35 Years and over | 269 (34.2%) | 518 (65.8%) |
| Total | 6,407 (75.2%) | 2,113 (24.8%) |
Educational Attainment by Field of Study in East Providence
Business (2,047 | 16.9%), education (1,419 | 11.7%), science & technology (1,357 | 11.2%), social sciences (1,067 | 8.8%), and psychology (886 | 7.3%) are the most common fields of study among 12,144 individuals in East Providence who have obtained a bachelor's degree or higher.
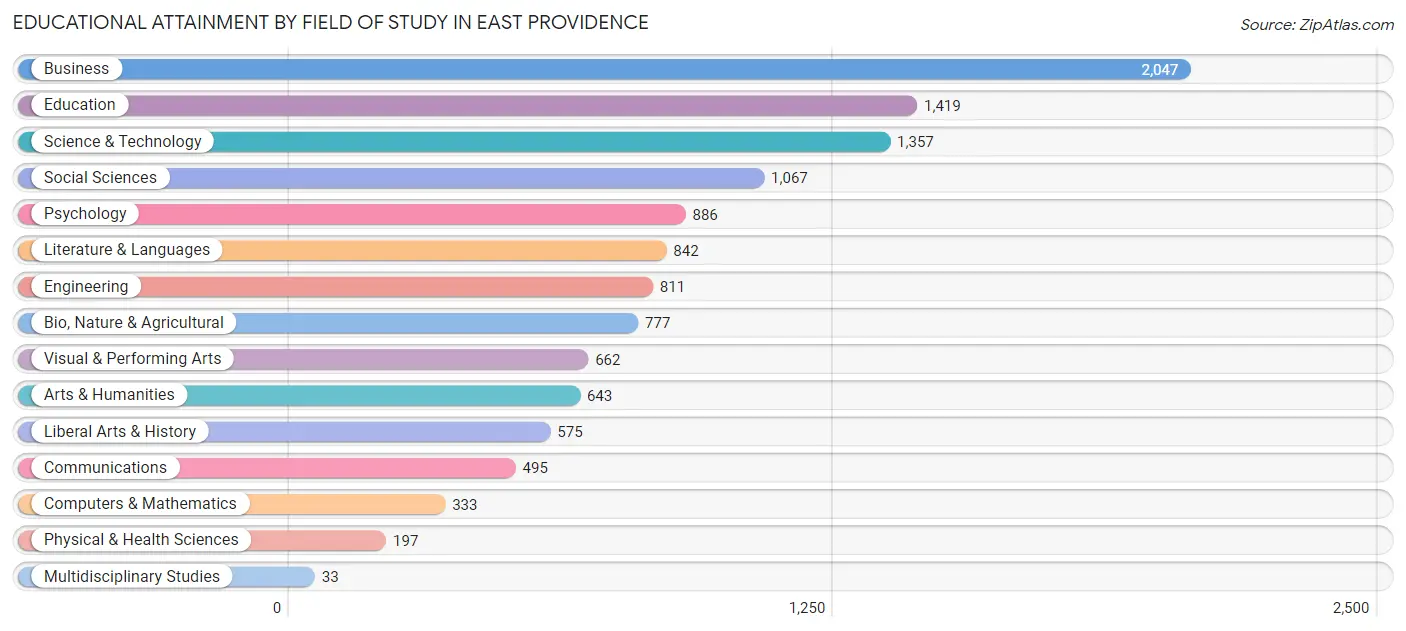
| Field of Study | # Graduates | % Graduates |
| Computers & Mathematics | 333 | 2.7% |
| Bio, Nature & Agricultural | 777 | 6.4% |
| Physical & Health Sciences | 197 | 1.6% |
| Psychology | 886 | 7.3% |
| Social Sciences | 1,067 | 8.8% |
| Engineering | 811 | 6.7% |
| Multidisciplinary Studies | 33 | 0.3% |
| Science & Technology | 1,357 | 11.2% |
| Business | 2,047 | 16.9% |
| Education | 1,419 | 11.7% |
| Literature & Languages | 842 | 6.9% |
| Liberal Arts & History | 575 | 4.7% |
| Visual & Performing Arts | 662 | 5.4% |
| Communications | 495 | 4.1% |
| Arts & Humanities | 643 | 5.3% |
| Total | 12,144 | 100.0% |
Transportation & Commute in East Providence
Vehicle Availability by Sex in East Providence
The most prevalent vehicle ownership categories in East Providence are males with 2 vehicles (5,245, accounting for 43.2%) and females with 2 vehicles (5,034, making up 45.2%).
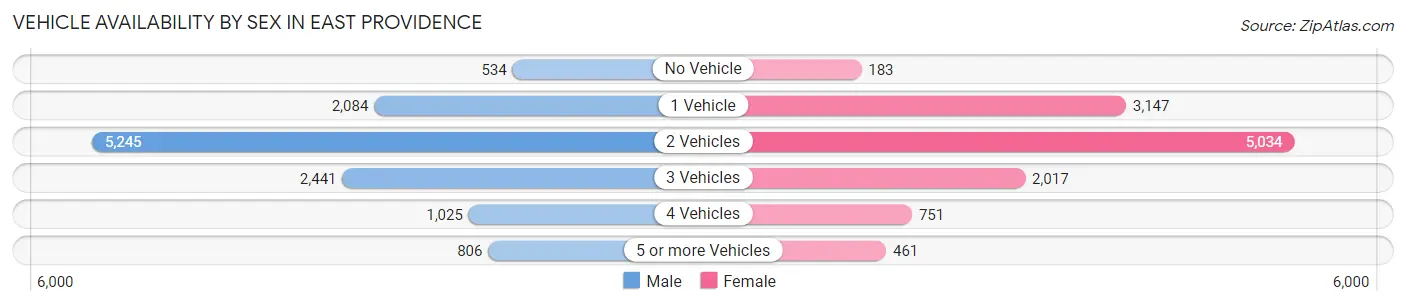
| Vehicles Available | Male | Female |
| No Vehicle | 534 (4.4%) | 183 (1.6%) |
| 1 Vehicle | 2,084 (17.2%) | 3,147 (27.2%) |
| 2 Vehicles | 5,245 (43.2%) | 5,034 (43.4%) |
| 3 Vehicles | 2,441 (20.1%) | 2,017 (17.4%) |
| 4 Vehicles | 1,025 (8.5%) | 751 (6.5%) |
| 5 or more Vehicles | 806 (6.6%) | 461 (4.0%) |
| Total | 12,135 (100.0%) | 11,593 (100.0%) |
Commute Time in East Providence
The most frequently occuring commute durations in East Providence are 10 to 14 minutes (4,577 commuters, 21.1%), 20 to 24 minutes (3,478 commuters, 16.1%), and 15 to 19 minutes (3,397 commuters, 15.7%).
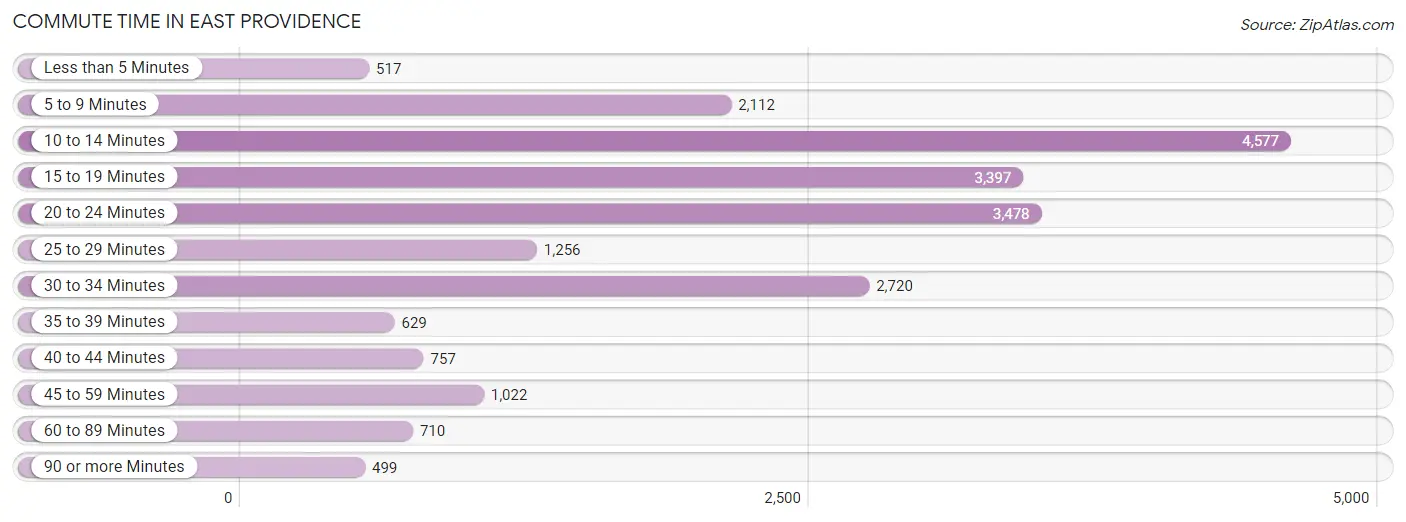
| Commute Time | # Commuters | % Commuters |
| Less than 5 Minutes | 517 | 2.4% |
| 5 to 9 Minutes | 2,112 | 9.7% |
| 10 to 14 Minutes | 4,577 | 21.1% |
| 15 to 19 Minutes | 3,397 | 15.7% |
| 20 to 24 Minutes | 3,478 | 16.1% |
| 25 to 29 Minutes | 1,256 | 5.8% |
| 30 to 34 Minutes | 2,720 | 12.6% |
| 35 to 39 Minutes | 629 | 2.9% |
| 40 to 44 Minutes | 757 | 3.5% |
| 45 to 59 Minutes | 1,022 | 4.7% |
| 60 to 89 Minutes | 710 | 3.3% |
| 90 or more Minutes | 499 | 2.3% |
Commute Time by Sex in East Providence
The most common commute times in East Providence are 10 to 14 minutes (2,048 commuters, 18.0%) for males and 10 to 14 minutes (2,529 commuters, 24.6%) for females.
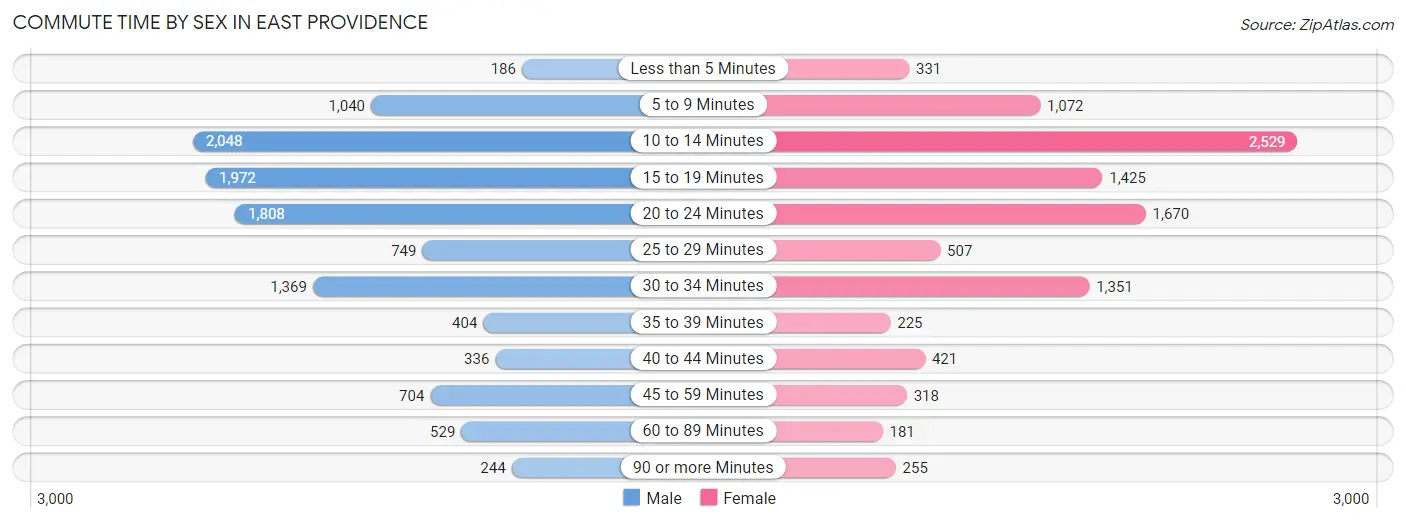
| Commute Time | Male | Female |
| Less than 5 Minutes | 186 (1.6%) | 331 (3.2%) |
| 5 to 9 Minutes | 1,040 (9.1%) | 1,072 (10.4%) |
| 10 to 14 Minutes | 2,048 (18.0%) | 2,529 (24.6%) |
| 15 to 19 Minutes | 1,972 (17.3%) | 1,425 (13.9%) |
| 20 to 24 Minutes | 1,808 (15.9%) | 1,670 (16.2%) |
| 25 to 29 Minutes | 749 (6.6%) | 507 (4.9%) |
| 30 to 34 Minutes | 1,369 (12.0%) | 1,351 (13.1%) |
| 35 to 39 Minutes | 404 (3.5%) | 225 (2.2%) |
| 40 to 44 Minutes | 336 (2.9%) | 421 (4.1%) |
| 45 to 59 Minutes | 704 (6.2%) | 318 (3.1%) |
| 60 to 89 Minutes | 529 (4.6%) | 181 (1.8%) |
| 90 or more Minutes | 244 (2.1%) | 255 (2.5%) |
Time of Departure to Work by Sex in East Providence
The most frequent times of departure to work in East Providence are 7:00 AM to 7:29 AM (1,883, 16.5%) for males and 8:00 AM to 8:29 AM (1,808, 17.6%) for females.
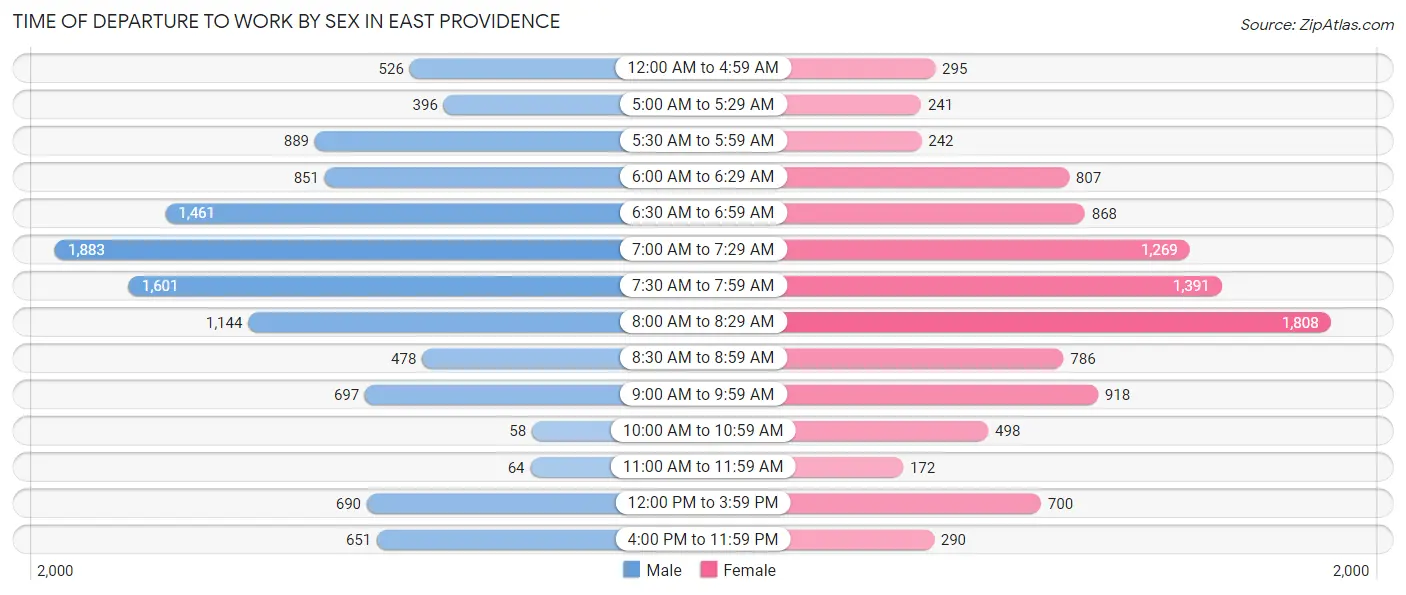
| Time of Departure | Male | Female |
| 12:00 AM to 4:59 AM | 526 (4.6%) | 295 (2.9%) |
| 5:00 AM to 5:29 AM | 396 (3.5%) | 241 (2.3%) |
| 5:30 AM to 5:59 AM | 889 (7.8%) | 242 (2.4%) |
| 6:00 AM to 6:29 AM | 851 (7.5%) | 807 (7.9%) |
| 6:30 AM to 6:59 AM | 1,461 (12.8%) | 868 (8.4%) |
| 7:00 AM to 7:29 AM | 1,883 (16.5%) | 1,269 (12.3%) |
| 7:30 AM to 7:59 AM | 1,601 (14.1%) | 1,391 (13.5%) |
| 8:00 AM to 8:29 AM | 1,144 (10.0%) | 1,808 (17.6%) |
| 8:30 AM to 8:59 AM | 478 (4.2%) | 786 (7.6%) |
| 9:00 AM to 9:59 AM | 697 (6.1%) | 918 (8.9%) |
| 10:00 AM to 10:59 AM | 58 (0.5%) | 498 (4.8%) |
| 11:00 AM to 11:59 AM | 64 (0.6%) | 172 (1.7%) |
| 12:00 PM to 3:59 PM | 690 (6.1%) | 700 (6.8%) |
| 4:00 PM to 11:59 PM | 651 (5.7%) | 290 (2.8%) |
| Total | 11,389 (100.0%) | 10,285 (100.0%) |
Housing Occupancy in East Providence
Occupancy by Ownership in East Providence
Of the total 20,410 dwellings in East Providence, owner-occupied units account for 12,327 (60.4%), while renter-occupied units make up 8,083 (39.6%).
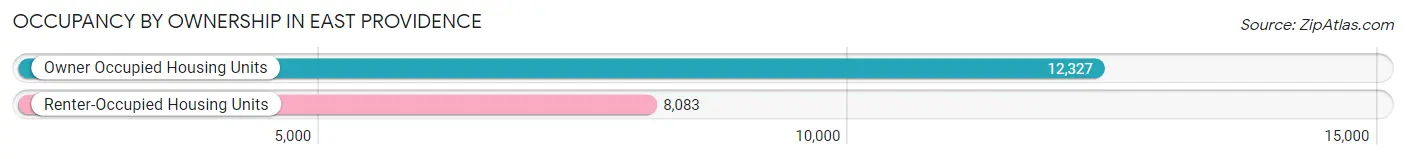
| Occupancy | # Housing Units | % Housing Units |
| Owner Occupied Housing Units | 12,327 | 60.4% |
| Renter-Occupied Housing Units | 8,083 | 39.6% |
| Total Occupied Housing Units | 20,410 | 100.0% |
Occupancy by Household Size in East Providence
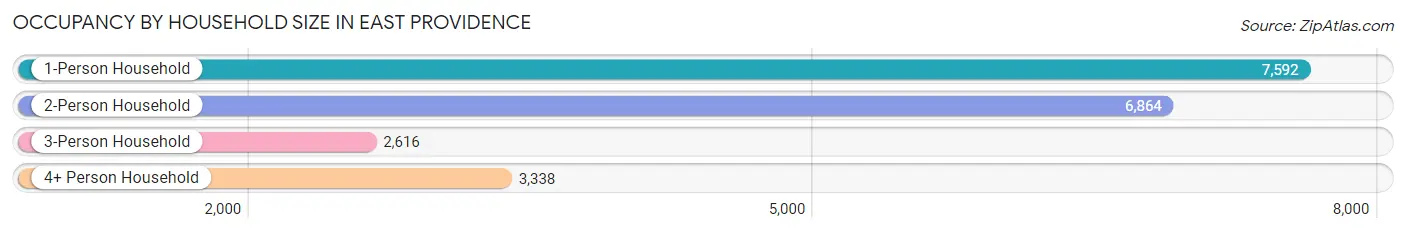
| Household Size | # Housing Units | % Housing Units |
| 1-Person Household | 7,592 | 37.2% |
| 2-Person Household | 6,864 | 33.6% |
| 3-Person Household | 2,616 | 12.8% |
| 4+ Person Household | 3,338 | 16.4% |
| Total Housing Units | 20,410 | 100.0% |
Occupancy by Ownership by Household Size in East Providence
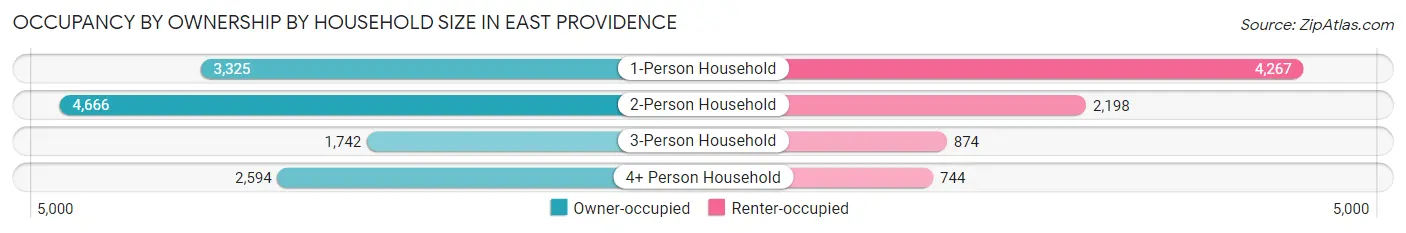
| Household Size | Owner-occupied | Renter-occupied |
| 1-Person Household | 3,325 (43.8%) | 4,267 (56.2%) |
| 2-Person Household | 4,666 (68.0%) | 2,198 (32.0%) |
| 3-Person Household | 1,742 (66.6%) | 874 (33.4%) |
| 4+ Person Household | 2,594 (77.7%) | 744 (22.3%) |
| Total Housing Units | 12,327 (60.4%) | 8,083 (39.6%) |
Occupancy by Educational Attainment in East Providence
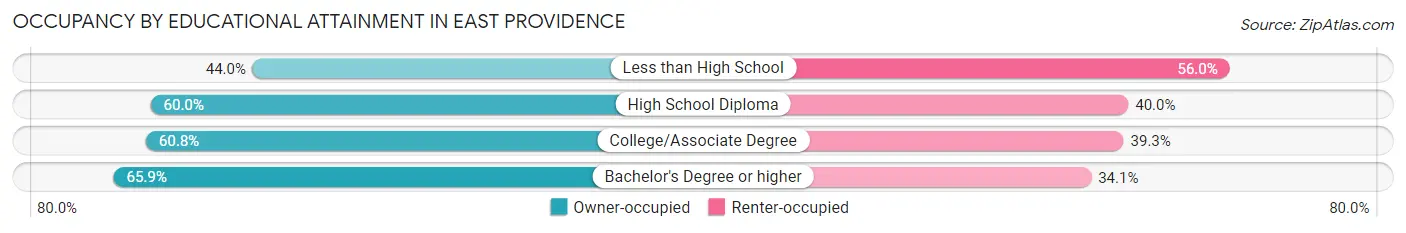
| Household Size | Owner-occupied | Renter-occupied |
| Less than High School | 1,055 (44.0%) | 1,345 (56.0%) |
| High School Diploma | 3,040 (60.0%) | 2,026 (40.0%) |
| College/Associate Degree | 3,504 (60.8%) | 2,264 (39.3%) |
| Bachelor's Degree or higher | 4,728 (65.9%) | 2,448 (34.1%) |
Occupancy by Age of Householder in East Providence
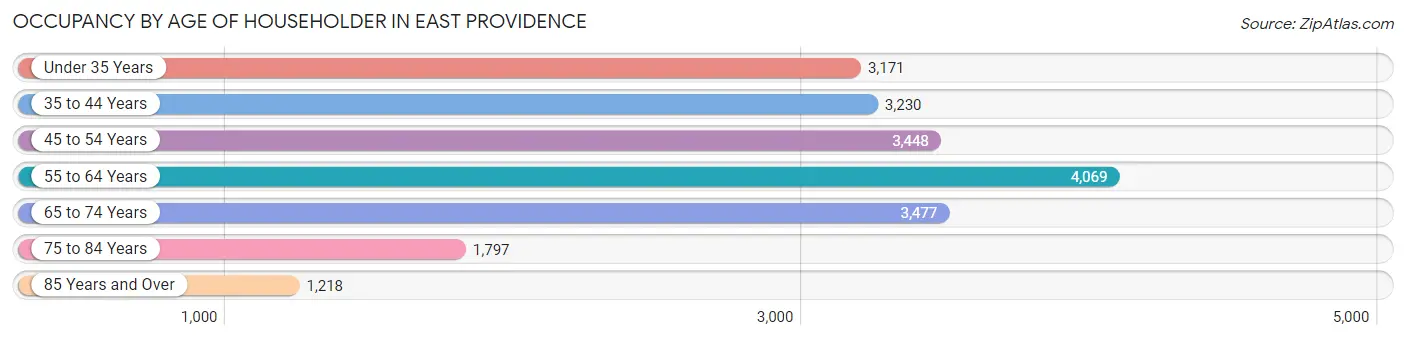
| Age Bracket | # Households | % Households |
| Under 35 Years | 3,171 | 15.5% |
| 35 to 44 Years | 3,230 | 15.8% |
| 45 to 54 Years | 3,448 | 16.9% |
| 55 to 64 Years | 4,069 | 19.9% |
| 65 to 74 Years | 3,477 | 17.0% |
| 75 to 84 Years | 1,797 | 8.8% |
| 85 Years and Over | 1,218 | 6.0% |
| Total | 20,410 | 100.0% |
Housing Finances in East Providence
Median Income by Occupancy in East Providence
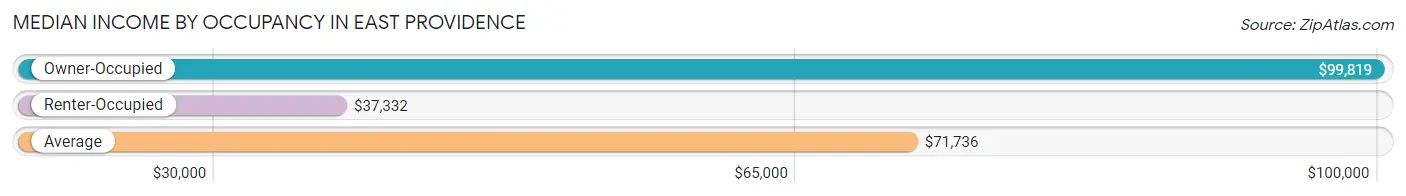
| Occupancy Type | # Households | Median Income |
| Owner-Occupied | 12,327 (60.4%) | $99,819 |
| Renter-Occupied | 8,083 (39.6%) | $37,332 |
| Average | 20,410 (100.0%) | $71,736 |
Occupancy by Householder Income Bracket in East Providence
| Income Bracket | Owner-occupied | Renter-occupied |
| Less than $5,000 | 183 (1.5%) | 493 (6.1%) |
| $5,000 to $9,999 | 30 (0.2%) | 245 (3.0%) |
| $10,000 to $14,999 | 262 (2.1%) | 843 (10.4%) |
| $15,000 to $19,999 | 202 (1.6%) | 413 (5.1%) |
| $20,000 to $24,999 | 428 (3.5%) | 674 (8.3%) |
| $25,000 to $34,999 | 692 (5.6%) | 1,283 (15.9%) |
| $35,000 to $49,999 | 898 (7.3%) | 897 (11.1%) |
| $50,000 to $74,999 | 1,931 (15.7%) | 1,019 (12.6%) |
| $75,000 to $99,999 | 1,542 (12.5%) | 1,017 (12.6%) |
| $100,000 to $149,999 | 3,023 (24.5%) | 858 (10.6%) |
| $150,000 or more | 3,136 (25.4%) | 341 (4.2%) |
| Total | 12,327 (100.0%) | 8,083 (100.0%) |
Monthly Housing Cost Tiers in East Providence
| Monthly Cost | Owner-occupied | Renter-occupied |
| Less than $300 | 189 (1.5%) | 623 (7.7%) |
| $300 to $499 | 506 (4.1%) | 781 (9.7%) |
| $500 to $799 | 2,150 (17.4%) | 787 (9.7%) |
| $800 to $999 | 1,201 (9.7%) | 672 (8.3%) |
| $1,000 to $1,499 | 1,935 (15.7%) | 2,619 (32.4%) |
| $1,500 to $1,999 | 2,668 (21.6%) | 1,392 (17.2%) |
| $2,000 to $2,499 | 2,204 (17.9%) | 826 (10.2%) |
| $2,500 to $2,999 | 827 (6.7%) | 57 (0.7%) |
| $3,000 or more | 647 (5.2%) | 22 (0.3%) |
| Total | 12,327 (100.0%) | 8,083 (100.0%) |
Physical Housing Characteristics in East Providence
Housing Structures in East Providence
| Structure Type | # Housing Units | % Housing Units |
| Single Unit, Detached | 10,974 | 53.8% |
| Single Unit, Attached | 732 | 3.6% |
| 2 Unit Apartments | 2,297 | 11.3% |
| 3 or 4 Unit Apartments | 1,657 | 8.1% |
| 5 to 9 Unit Apartments | 680 | 3.3% |
| 10 or more Apartments | 3,970 | 19.5% |
| Mobile Home / Other | 100 | 0.5% |
| Total | 20,410 | 100.0% |
Housing Structures by Occupancy in East Providence
| Structure Type | Owner-occupied | Renter-occupied |
| Single Unit, Detached | 10,098 (92.0%) | 876 (8.0%) |
| Single Unit, Attached | 333 (45.5%) | 399 (54.5%) |
| 2 Unit Apartments | 1,218 (53.0%) | 1,079 (47.0%) |
| 3 or 4 Unit Apartments | 292 (17.6%) | 1,365 (82.4%) |
| 5 to 9 Unit Apartments | 120 (17.6%) | 560 (82.4%) |
| 10 or more Apartments | 166 (4.2%) | 3,804 (95.8%) |
| Mobile Home / Other | 100 (100.0%) | 0 (0.0%) |
| Total | 12,327 (60.4%) | 8,083 (39.6%) |
Housing Structures by Number of Rooms in East Providence
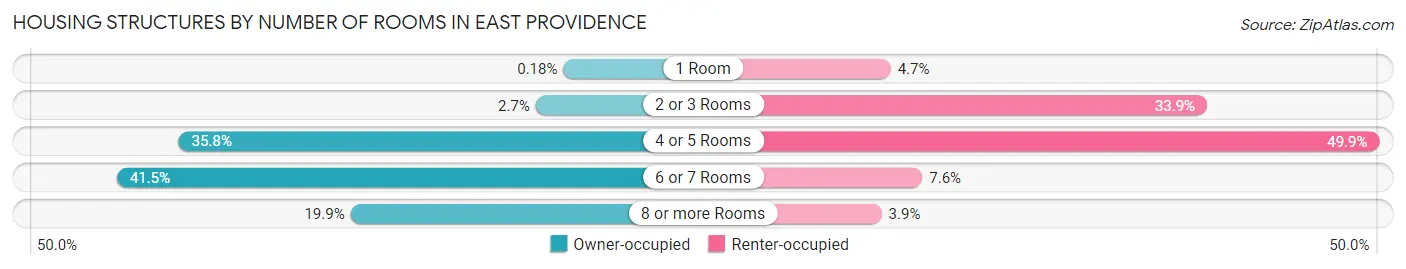
| Number of Rooms | Owner-occupied | Renter-occupied |
| 1 Room | 22 (0.2%) | 380 (4.7%) |
| 2 or 3 Rooms | 337 (2.7%) | 2,743 (33.9%) |
| 4 or 5 Rooms | 4,408 (35.8%) | 4,032 (49.9%) |
| 6 or 7 Rooms | 5,112 (41.5%) | 616 (7.6%) |
| 8 or more Rooms | 2,448 (19.9%) | 312 (3.9%) |
| Total | 12,327 (100.0%) | 8,083 (100.0%) |
Housing Structure by Heating Type in East Providence
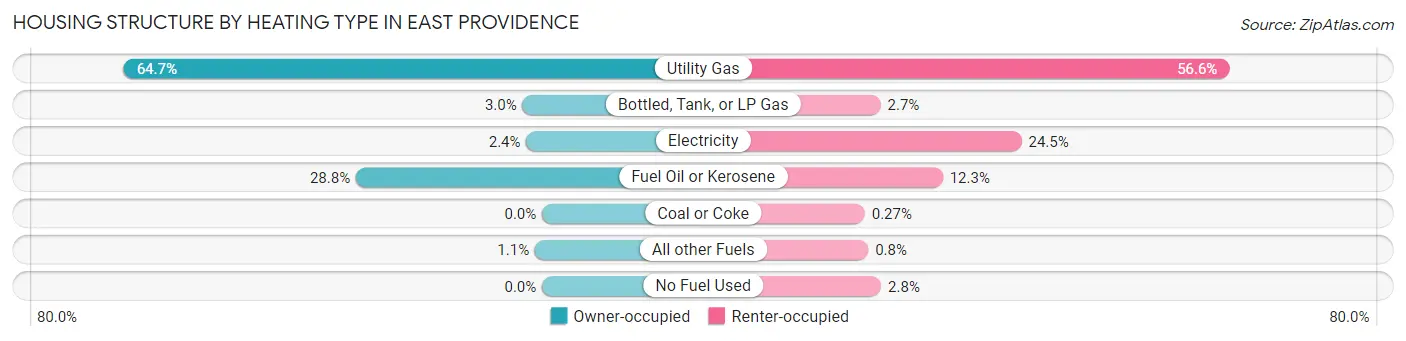
| Heating Type | Owner-occupied | Renter-occupied |
| Utility Gas | 7,972 (64.7%) | 4,575 (56.6%) |
| Bottled, Tank, or LP Gas | 372 (3.0%) | 219 (2.7%) |
| Electricity | 300 (2.4%) | 1,980 (24.5%) |
| Fuel Oil or Kerosene | 3,547 (28.8%) | 996 (12.3%) |
| Coal or Coke | 0 (0.0%) | 22 (0.3%) |
| All other Fuels | 136 (1.1%) | 65 (0.8%) |
| No Fuel Used | 0 (0.0%) | 226 (2.8%) |
| Total | 12,327 (100.0%) | 8,083 (100.0%) |
Household Vehicle Usage in East Providence
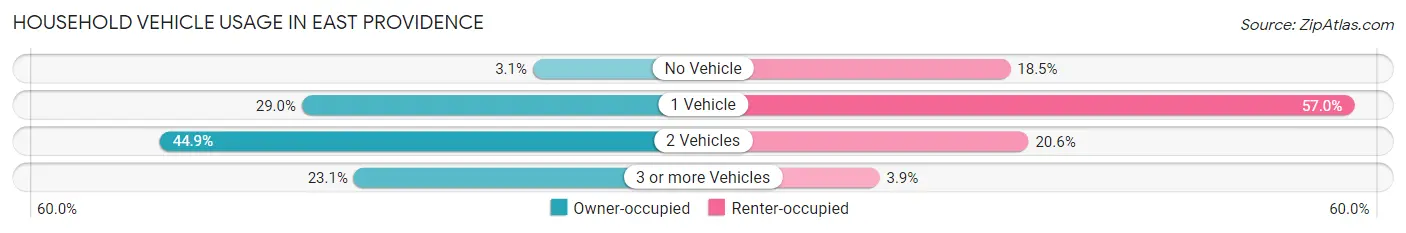
| Vehicles per Household | Owner-occupied | Renter-occupied |
| No Vehicle | 378 (3.1%) | 1,498 (18.5%) |
| 1 Vehicle | 3,569 (28.9%) | 4,609 (57.0%) |
| 2 Vehicles | 5,529 (44.9%) | 1,662 (20.6%) |
| 3 or more Vehicles | 2,851 (23.1%) | 314 (3.9%) |
| Total | 12,327 (100.0%) | 8,083 (100.0%) |
Real Estate & Mortgages in East Providence
Real Estate and Mortgage Overview in East Providence
| Characteristic | Without Mortgage | With Mortgage |
| Housing Units | 4,344 | 7,983 |
| Median Property Value | $269,000 | $296,100 |
| Median Household Income | $72,593 | $2,485 |
| Monthly Housing Costs | $741 | $605 |
| Real Estate Taxes | $4,227 | $85 |
Property Value by Mortgage Status in East Providence
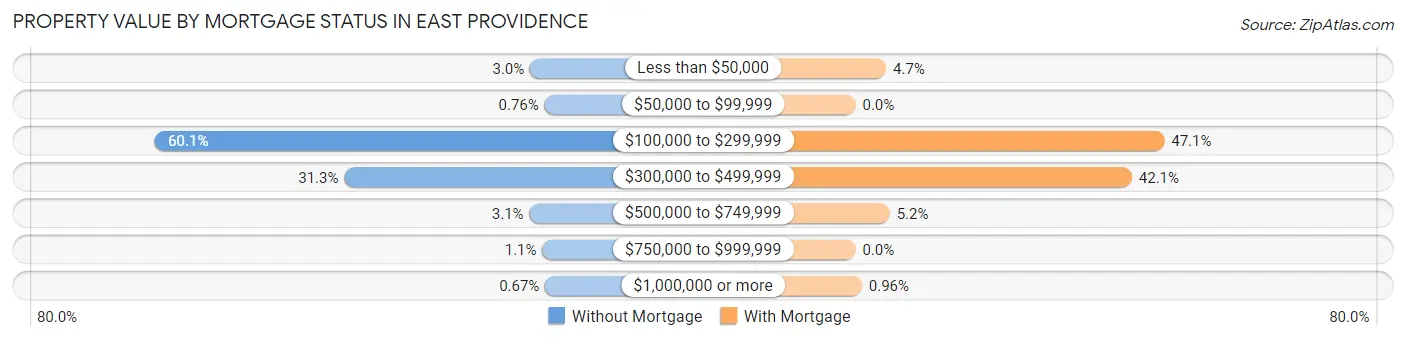
| Property Value | Without Mortgage | With Mortgage |
| Less than $50,000 | 129 (3.0%) | 372 (4.7%) |
| $50,000 to $99,999 | 33 (0.8%) | 0 (0.0%) |
| $100,000 to $299,999 | 2,612 (60.1%) | 3,756 (47.0%) |
| $300,000 to $499,999 | 1,359 (31.3%) | 3,362 (42.1%) |
| $500,000 to $749,999 | 134 (3.1%) | 416 (5.2%) |
| $750,000 to $999,999 | 48 (1.1%) | 0 (0.0%) |
| $1,000,000 or more | 29 (0.7%) | 77 (1.0%) |
| Total | 4,344 (100.0%) | 7,983 (100.0%) |
Household Income by Mortgage Status in East Providence
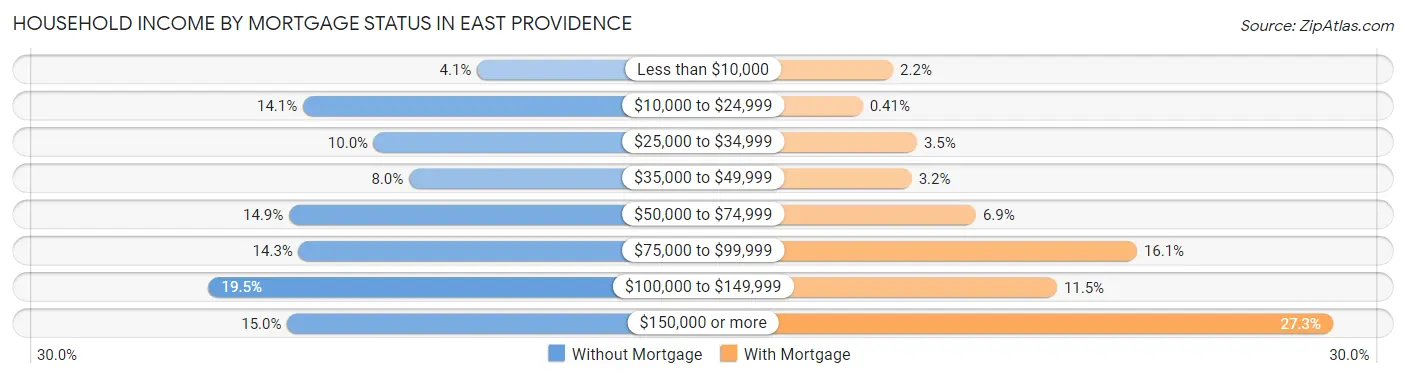
| Household Income | Without Mortgage | With Mortgage |
| Less than $10,000 | 180 (4.1%) | 172 (2.1%) |
| $10,000 to $24,999 | 612 (14.1%) | 33 (0.4%) |
| $25,000 to $34,999 | 436 (10.0%) | 280 (3.5%) |
| $35,000 to $49,999 | 349 (8.0%) | 256 (3.2%) |
| $50,000 to $74,999 | 647 (14.9%) | 549 (6.9%) |
| $75,000 to $99,999 | 623 (14.3%) | 1,284 (16.1%) |
| $100,000 to $149,999 | 846 (19.5%) | 919 (11.5%) |
| $150,000 or more | 651 (15.0%) | 2,177 (27.3%) |
| Total | 4,344 (100.0%) | 7,983 (100.0%) |
Property Value to Household Income Ratio in East Providence
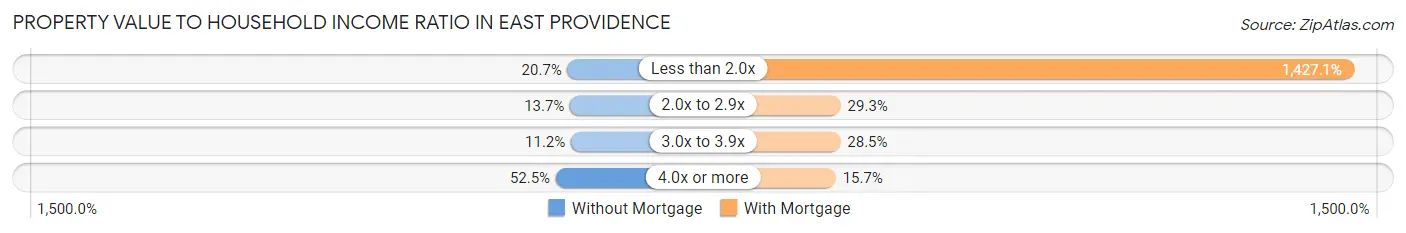
| Value-to-Income Ratio | Without Mortgage | With Mortgage |
| Less than 2.0x | 897 (20.6%) | 113,926 (1,427.1%) |
| 2.0x to 2.9x | 595 (13.7%) | 2,338 (29.3%) |
| 3.0x to 3.9x | 488 (11.2%) | 2,271 (28.4%) |
| 4.0x or more | 2,280 (52.5%) | 1,256 (15.7%) |
| Total | 4,344 (100.0%) | 7,983 (100.0%) |
Real Estate Taxes by Mortgage Status in East Providence
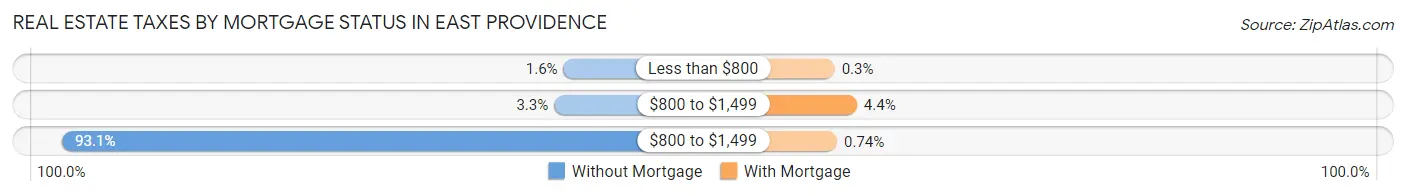
| Property Taxes | Without Mortgage | With Mortgage |
| Less than $800 | 69 (1.6%) | 24 (0.3%) |
| $800 to $1,499 | 143 (3.3%) | 348 (4.4%) |
| $800 to $1,499 | 4,046 (93.1%) | 59 (0.7%) |
| Total | 4,344 (100.0%) | 7,983 (100.0%) |
Health & Disability in East Providence
Health Insurance Coverage by Age in East Providence
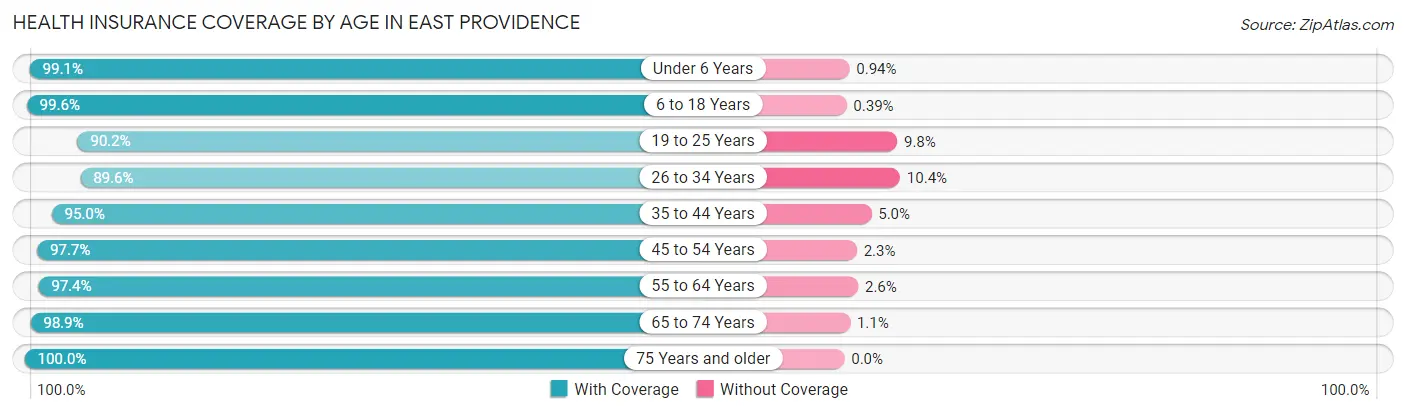
| Age Bracket | With Coverage | Without Coverage |
| Under 6 Years | 2,840 (99.1%) | 27 (0.9%) |
| 6 to 18 Years | 5,168 (99.6%) | 20 (0.4%) |
| 19 to 25 Years | 3,062 (90.2%) | 334 (9.8%) |
| 26 to 34 Years | 5,903 (89.6%) | 683 (10.4%) |
| 35 to 44 Years | 5,756 (95.0%) | 305 (5.0%) |
| 45 to 54 Years | 5,563 (97.7%) | 132 (2.3%) |
| 55 to 64 Years | 7,002 (97.4%) | 184 (2.6%) |
| 65 to 74 Years | 5,246 (98.9%) | 56 (1.1%) |
| 75 Years and older | 4,074 (100.0%) | 0 (0.0%) |
| Total | 44,614 (96.2%) | 1,741 (3.8%) |
Health Insurance Coverage by Citizenship Status in East Providence
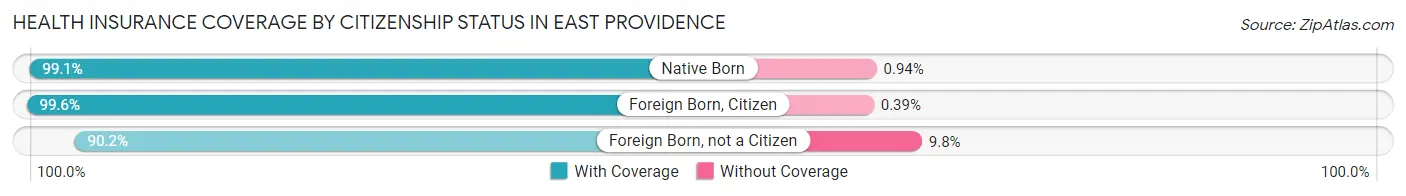
| Citizenship Status | With Coverage | Without Coverage |
| Native Born | 2,840 (99.1%) | 27 (0.9%) |
| Foreign Born, Citizen | 5,168 (99.6%) | 20 (0.4%) |
| Foreign Born, not a Citizen | 3,062 (90.2%) | 334 (9.8%) |
Health Insurance Coverage by Household Income in East Providence
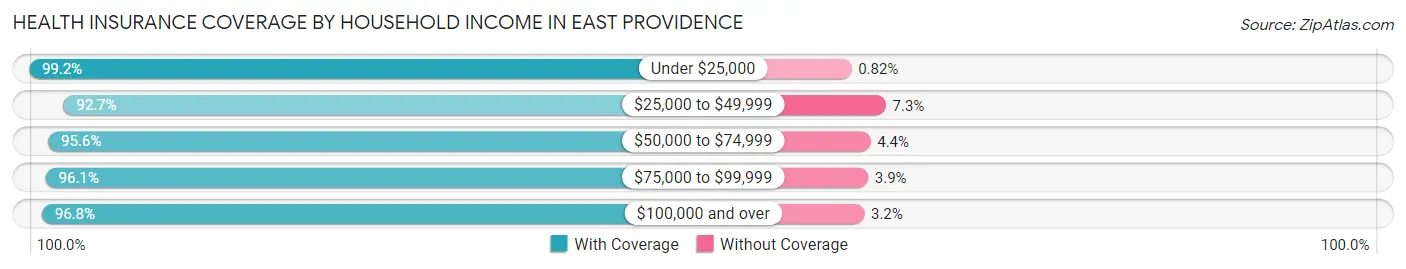
| Household Income | With Coverage | Without Coverage |
| Under $25,000 | 4,964 (99.2%) | 41 (0.8%) |
| $25,000 to $49,999 | 5,756 (92.7%) | 451 (7.3%) |
| $50,000 to $74,999 | 5,925 (95.6%) | 273 (4.4%) |
| $75,000 to $99,999 | 6,096 (96.1%) | 250 (3.9%) |
| $100,000 and over | 21,764 (96.8%) | 726 (3.2%) |
Public vs Private Health Insurance Coverage by Age in East Providence
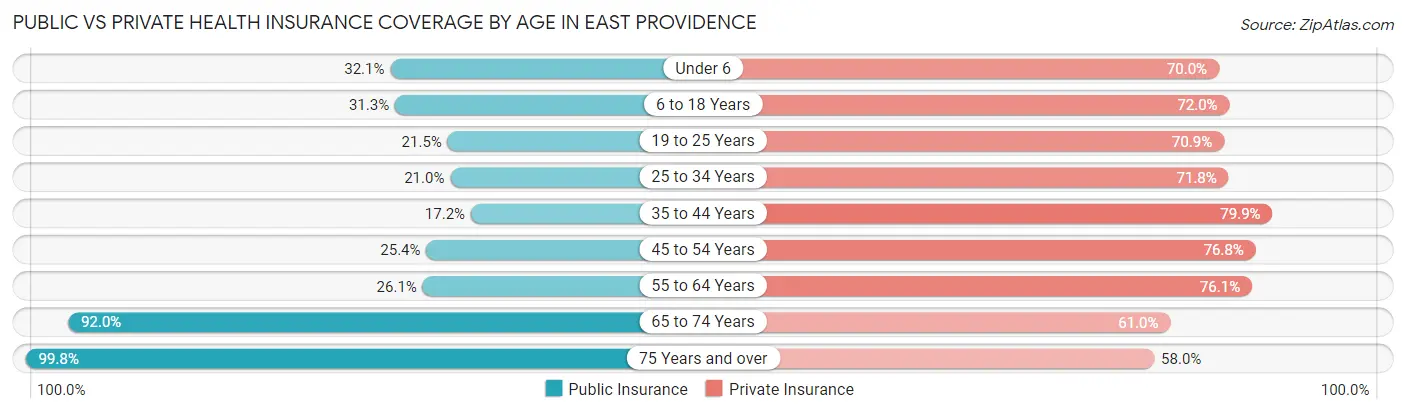
| Age Bracket | Public Insurance | Private Insurance |
| Under 6 | 921 (32.1%) | 2,007 (70.0%) |
| 6 to 18 Years | 1,621 (31.2%) | 3,733 (72.0%) |
| 19 to 25 Years | 729 (21.5%) | 2,409 (70.9%) |
| 25 to 34 Years | 1,383 (21.0%) | 4,728 (71.8%) |
| 35 to 44 Years | 1,040 (17.2%) | 4,844 (79.9%) |
| 45 to 54 Years | 1,448 (25.4%) | 4,375 (76.8%) |
| 55 to 64 Years | 1,876 (26.1%) | 5,471 (76.1%) |
| 65 to 74 Years | 4,875 (91.9%) | 3,232 (61.0%) |
| 75 Years and over | 4,067 (99.8%) | 2,362 (58.0%) |
| Total | 17,960 (38.7%) | 33,161 (71.5%) |
Disability Status by Sex by Age in East Providence
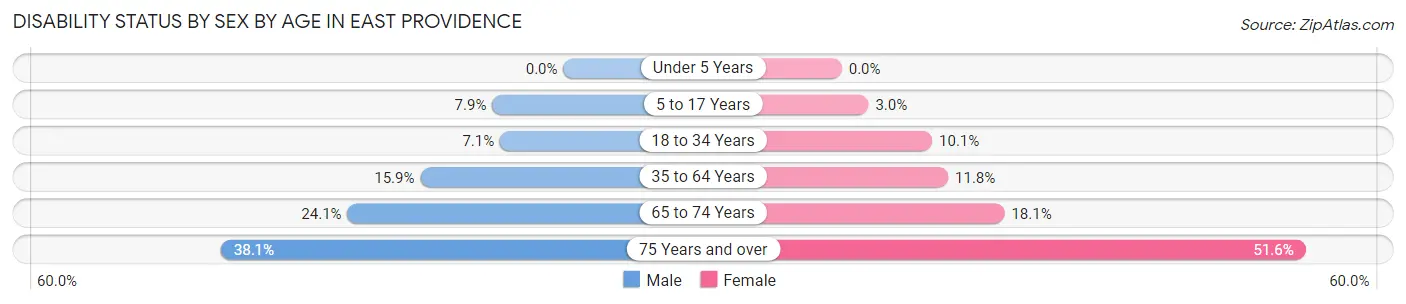
| Age Bracket | Male | Female |
| Under 5 Years | 0 (0.0%) | 0 (0.0%) |
| 5 to 17 Years | 213 (7.9%) | 77 (3.0%) |
| 18 to 34 Years | 378 (7.0%) | 493 (10.1%) |
| 35 to 64 Years | 1,512 (15.9%) | 1,119 (11.8%) |
| 65 to 74 Years | 638 (24.0%) | 480 (18.1%) |
| 75 Years and over | 553 (38.1%) | 1,355 (51.6%) |
Disability Class by Sex by Age in East Providence
Disability Class: Hearing Difficulty
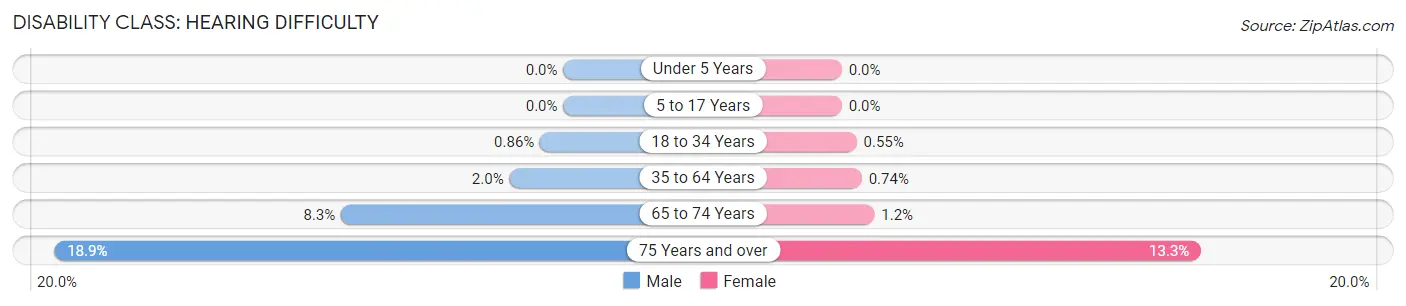
| Age Bracket | Male | Female |
| Under 5 Years | 0 (0.0%) | 0 (0.0%) |
| 5 to 17 Years | 0 (0.0%) | 0 (0.0%) |
| 18 to 34 Years | 46 (0.9%) | 27 (0.5%) |
| 35 to 64 Years | 190 (2.0%) | 70 (0.7%) |
| 65 to 74 Years | 219 (8.3%) | 32 (1.2%) |
| 75 Years and over | 274 (18.9%) | 350 (13.3%) |
Disability Class: Vision Difficulty
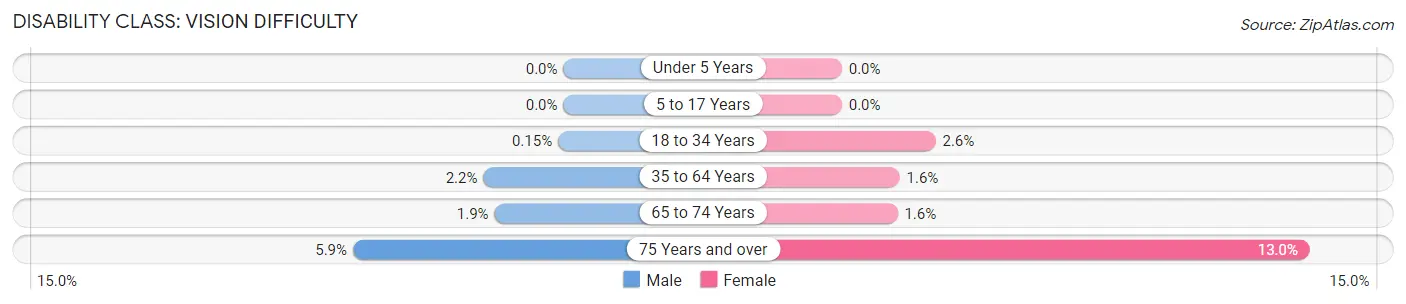
| Age Bracket | Male | Female |
| Under 5 Years | 0 (0.0%) | 0 (0.0%) |
| 5 to 17 Years | 0 (0.0%) | 0 (0.0%) |
| 18 to 34 Years | 8 (0.2%) | 128 (2.6%) |
| 35 to 64 Years | 212 (2.2%) | 152 (1.6%) |
| 65 to 74 Years | 51 (1.9%) | 41 (1.5%) |
| 75 Years and over | 85 (5.9%) | 342 (13.0%) |
Disability Class: Cognitive Difficulty
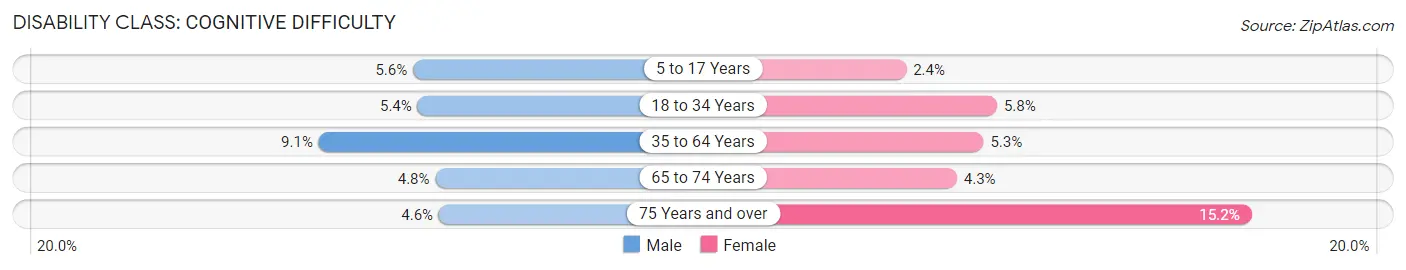
| Age Bracket | Male | Female |
| 5 to 17 Years | 150 (5.6%) | 62 (2.4%) |
| 18 to 34 Years | 290 (5.4%) | 282 (5.8%) |
| 35 to 64 Years | 862 (9.1%) | 497 (5.3%) |
| 65 to 74 Years | 126 (4.8%) | 113 (4.3%) |
| 75 Years and over | 67 (4.6%) | 399 (15.2%) |
Disability Class: Ambulatory Difficulty
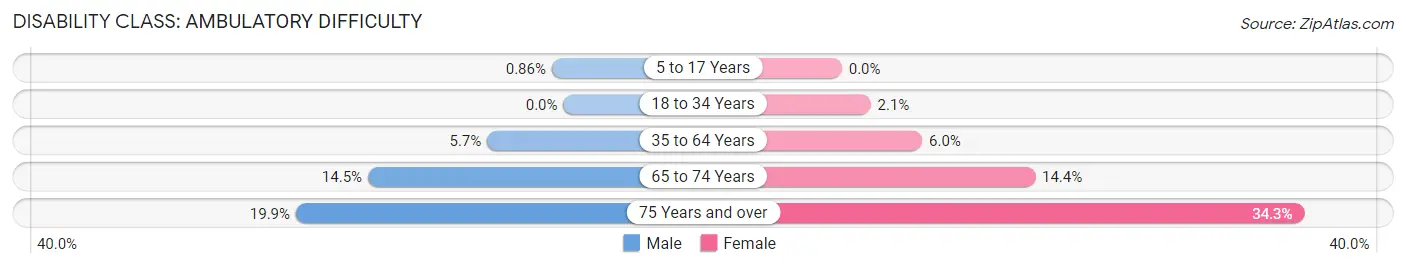
| Age Bracket | Male | Female |
| 5 to 17 Years | 23 (0.9%) | 0 (0.0%) |
| 18 to 34 Years | 0 (0.0%) | 105 (2.1%) |
| 35 to 64 Years | 537 (5.7%) | 563 (6.0%) |
| 65 to 74 Years | 385 (14.5%) | 380 (14.3%) |
| 75 Years and over | 288 (19.9%) | 901 (34.3%) |
Disability Class: Self-Care Difficulty
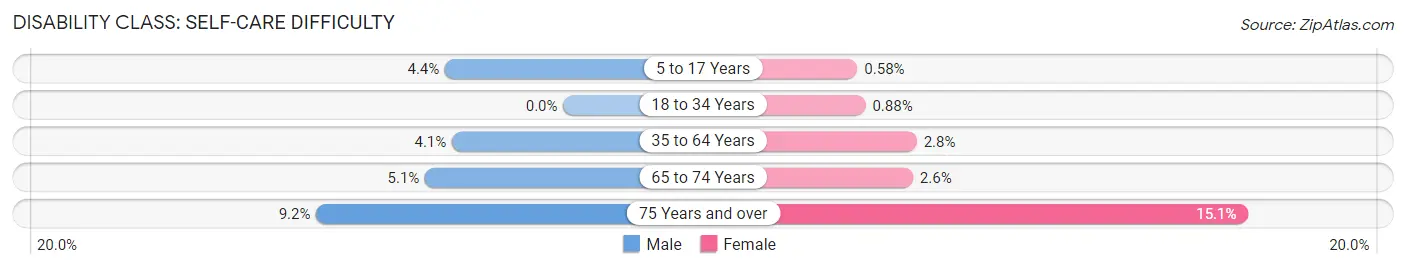
| Age Bracket | Male | Female |
| 5 to 17 Years | 118 (4.4%) | 15 (0.6%) |
| 18 to 34 Years | 0 (0.0%) | 43 (0.9%) |
| 35 to 64 Years | 392 (4.1%) | 263 (2.8%) |
| 65 to 74 Years | 136 (5.1%) | 70 (2.6%) |
| 75 Years and over | 133 (9.2%) | 396 (15.1%) |
Technology Access in East Providence
Computing Device Access in East Providence
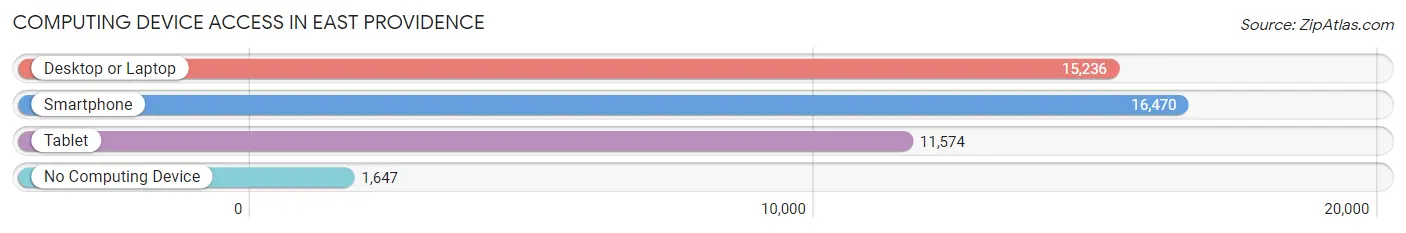
| Device Type | # Households | % Households |
| Desktop or Laptop | 15,236 | 74.7% |
| Smartphone | 16,470 | 80.7% |
| Tablet | 11,574 | 56.7% |
| No Computing Device | 1,647 | 8.1% |
| Total | 20,410 | 100.0% |
Internet Access in East Providence
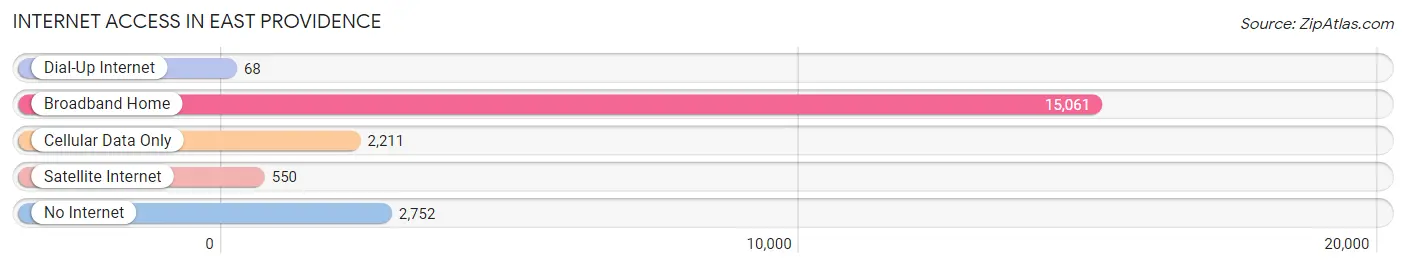
| Internet Type | # Households | % Households |
| Dial-Up Internet | 68 | 0.3% |
| Broadband Home | 15,061 | 73.8% |
| Cellular Data Only | 2,211 | 10.8% |
| Satellite Internet | 550 | 2.7% |
| No Internet | 2,752 | 13.5% |
| Total | 20,410 | 100.0% |
East Providence Summary
History
East Providence, Rhode Island is a city located in Providence County, Rhode Island. It is located on the eastern shore of Narragansett Bay, and is bordered by the cities of Providence, Barrington, and Warren. The city was originally part of the town of Rehoboth, Massachusetts, and was incorporated as a city in 1862.
East Providence was originally inhabited by the Wampanoag tribe, who were part of the Algonquin nation. The first European settlers arrived in the area in 1636, and the town of Rehoboth was established in 1643. The town was divided in 1747, and the portion that became East Providence was known as Seekonk. The area was part of Massachusetts until 1747, when it became part of Rhode Island.
In the 19th century, East Providence became an important industrial center, with the development of the Providence and Worcester Railroad in 1847. The railroad connected East Providence to Providence and other cities in the region, and allowed for the transportation of goods and people. The city also became a popular summer resort destination, with the development of several hotels and resorts.
In the 20th century, East Providence continued to grow and develop. The city was home to several large manufacturing companies, including the American Locomotive Company, which produced locomotives and other railroad equipment. The city also became a popular residential area, with the development of several neighborhoods and subdivisions.
Geography
East Providence is located in Providence County, Rhode Island, on the eastern shore of Narragansett Bay. The city is bordered by the cities of Providence, Barrington, and Warren. The city covers an area of 10.7 square miles, and has a population of 47,037, according to the 2010 census.
The city is located on the Seekonk River, which flows into Narragansett Bay. The city is located on the eastern edge of the Blackstone Valley, and is part of the Providence metropolitan area. The city is located in a humid continental climate zone, with hot, humid summers and cold, snowy winters.
Economy
East Providence is a major economic center in Rhode Island. The city is home to several large companies, including the American Locomotive Company, which produces locomotives and other railroad equipment. The city is also home to several large retail stores, including the Providence Place Mall.
The city is also home to several educational institutions, including the University of Rhode Island, Rhode Island College, and the Community College of Rhode Island. The city is also home to several hospitals, including Rhode Island Hospital and Women & Infants Hospital.
Demographics
According to the 2010 census, East Providence has a population of 47,037. The city has a median household income of $50,945, and a median family income of $62,945. The city has a poverty rate of 11.3%, and a population that is 79.2% white, 8.3% Hispanic or Latino, 6.2% African American, and 4.3% Asian. The city also has a population that is 18.3% foreign-born, and 8.2% speak a language other than English at home.
Common Questions
What is Per Capita Income in East Providence?
Per Capita income in East Providence is $42,159.
What is the Median Family Income in East Providence?
Median Family Income in East Providence is $103,175.
What is the Median Household income in East Providence?
Median Household Income in East Providence is $71,736.
What is Income or Wage Gap in East Providence?
Income or Wage Gap in East Providence is 14.4%.
Women in East Providence earn 85.6 cents for every dollar earned by a man.
What is Family Income Deficit in East Providence?
Family Income Deficit in East Providence is $9,335.
Families that are below poverty line in East Providence earn $9,335 less on average than the poverty threshold level.
What is Inequality or Gini Index in East Providence?
Inequality or Gini Index in East Providence is 0.46.
What is the Total Population of East Providence?
Total Population of East Providence is 47,012.
What is the Total Male Population of East Providence?
Total Male Population of East Providence is 23,369.
What is the Total Female Population of East Providence?
Total Female Population of East Providence is 23,643.
What is the Ratio of Males per 100 Females in East Providence?
There are 98.84 Males per 100 Females in East Providence.
What is the Ratio of Females per 100 Males in East Providence?
There are 101.17 Females per 100 Males in East Providence.
What is the Median Population Age in East Providence?
Median Population Age in East Providence is 43.0 Years.
What is the Average Family Size in East Providence
Average Family Size in East Providence is 3.0 People.
What is the Average Household Size in East Providence
Average Household Size in East Providence is 2.3 People.
How Large is the Labor Force in East Providence?
There are 25,817 People in the Labor Forcein in East Providence.
What is the Percentage of People in the Labor Force in East Providence?
64.8% of People are in the Labor Force in East Providence.
What is the Unemployment Rate in East Providence?
Unemployment Rate in East Providence is 5.6%.