Hope Valley, RI Map & Demographics
Hope Valley Map
Hope Valley Overview
$37,786
PER CAPITA INCOME
$94,883
AVG FAMILY INCOME
$93,888
AVG HOUSEHOLD INCOME
61.1%
WAGE / INCOME GAP [ % ]
38.9¢/ $1
WAGE / INCOME GAP [ $ ]
0.38
INEQUALITY / GINI INDEX
2,209
TOTAL POPULATION
1,202
MALE POPULATION
1,007
FEMALE POPULATION
119.36
MALES / 100 FEMALES
83.78
FEMALES / 100 MALES
39.5
MEDIAN AGE
3.2
AVG FAMILY SIZE
3.1
AVG HOUSEHOLD SIZE
1,181
LABOR FORCE [ PEOPLE ]
68.8%
PERCENT IN LABOR FORCE
8.4%
UNEMPLOYMENT RATE
Hope Valley Zip Codes
Hope Valley Area Codes
Income in Hope Valley
Income Overview in Hope Valley
Per Capita Income in Hope Valley is $37,786, while median incomes of families and households are $94,883 and $93,888 respectively.
| Characteristic | Number | Measure |
| Per Capita Income | 2,209 | $37,786 |
| Median Family Income | 611 | $94,883 |
| Mean Family Income | 611 | $118,433 |
| Median Household Income | 705 | $93,888 |
| Mean Household Income | 705 | $113,350 |
| Income Deficit | 611 | $0 |
| Wage / Income Gap (%) | 2,209 | 61.11% |
| Wage / Income Gap ($) | 2,209 | 38.89¢ per $1 |
| Gini / Inequality Index | 2,209 | 0.38 |
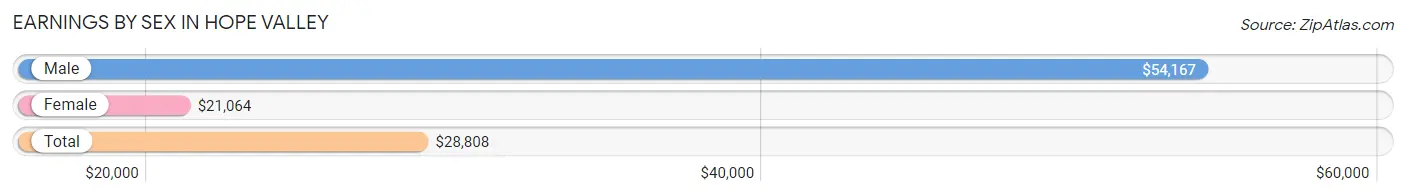
Earnings by Sex in Hope Valley
Average Earnings in Hope Valley are $28,808, $54,167 for men and $21,064 for women, a difference of 61.1%.
| Sex | Number | Average Earnings |
| Male | 590 (51.3%) | $54,167 |
| Female | 559 (48.6%) | $21,064 |
| Total | 1,149 (100.0%) | $28,808 |
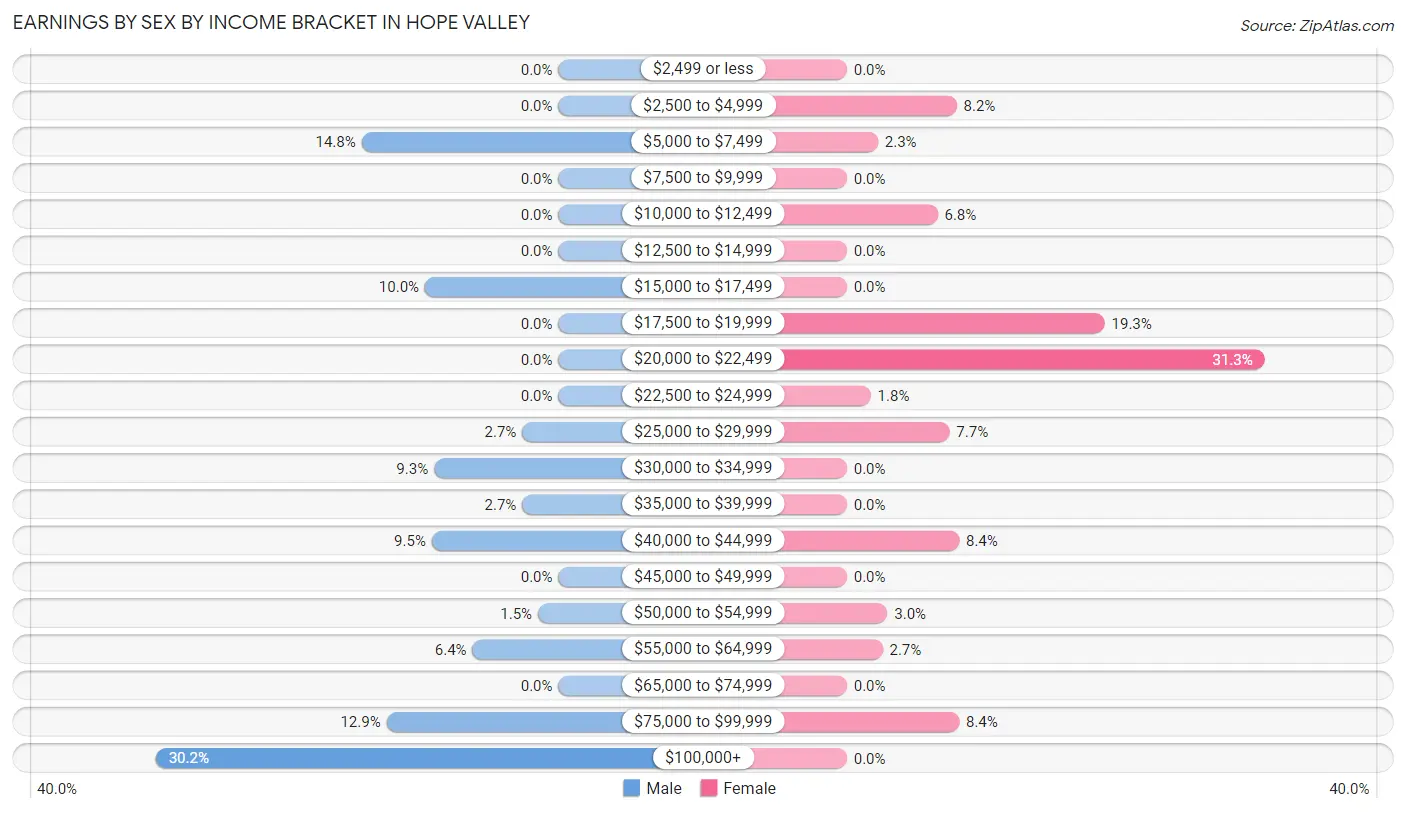
Earnings by Sex by Income Bracket in Hope Valley
The most common earnings brackets in Hope Valley are $100,000+ for men (178 | 30.2%) and $20,000 to $22,499 for women (175 | 31.3%).
| Income | Male | Female |
| $2,499 or less | 0 (0.0%) | 0 (0.0%) |
| $2,500 to $4,999 | 0 (0.0%) | 46 (8.2%) |
| $5,000 to $7,499 | 87 (14.7%) | 13 (2.3%) |
| $7,500 to $9,999 | 0 (0.0%) | 0 (0.0%) |
| $10,000 to $12,499 | 0 (0.0%) | 38 (6.8%) |
| $12,500 to $14,999 | 0 (0.0%) | 0 (0.0%) |
| $15,000 to $17,499 | 59 (10.0%) | 0 (0.0%) |
| $17,500 to $19,999 | 0 (0.0%) | 108 (19.3%) |
| $20,000 to $22,499 | 0 (0.0%) | 175 (31.3%) |
| $22,500 to $24,999 | 0 (0.0%) | 10 (1.8%) |
| $25,000 to $29,999 | 16 (2.7%) | 43 (7.7%) |
| $30,000 to $34,999 | 55 (9.3%) | 0 (0.0%) |
| $35,000 to $39,999 | 16 (2.7%) | 0 (0.0%) |
| $40,000 to $44,999 | 56 (9.5%) | 47 (8.4%) |
| $45,000 to $49,999 | 0 (0.0%) | 0 (0.0%) |
| $50,000 to $54,999 | 9 (1.5%) | 17 (3.0%) |
| $55,000 to $64,999 | 38 (6.4%) | 15 (2.7%) |
| $65,000 to $74,999 | 0 (0.0%) | 0 (0.0%) |
| $75,000 to $99,999 | 76 (12.9%) | 47 (8.4%) |
| $100,000+ | 178 (30.2%) | 0 (0.0%) |
| Total | 590 (100.0%) | 559 (100.0%) |
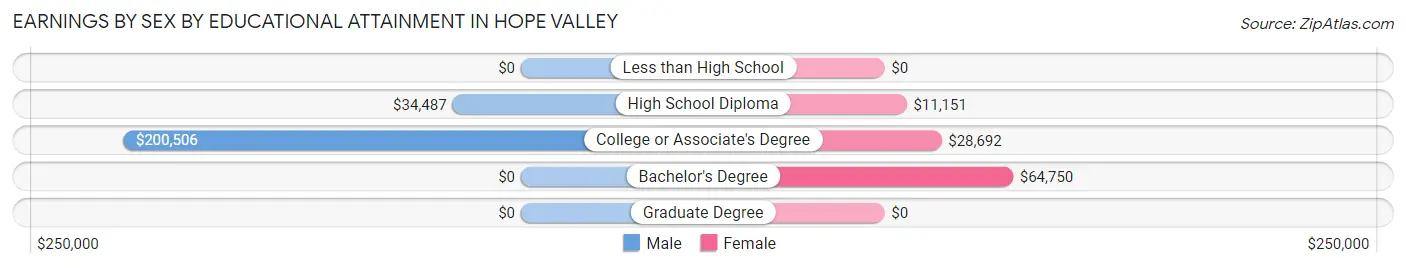
Earnings by Sex by Educational Attainment in Hope Valley
Average earnings in Hope Valley are $54,167 for men and $21,836 for women, a difference of 59.7%. Men with an educational attainment of college or associate's degree enjoy the highest average annual earnings of $200,506, while those with high school diploma education earn the least with $34,487. Women with an educational attainment of bachelor's degree earn the most with the average annual earnings of $64,750, while those with high school diploma education have the smallest earnings of $11,151.
| Educational Attainment | Male Income | Female Income |
| Less than High School | - | - |
| High School Diploma | $34,487 | $11,151 |
| College or Associate's Degree | $200,506 | $28,692 |
| Bachelor's Degree | - | - |
| Graduate Degree | - | - |
| Total | $54,167 | $21,836 |
Family Income in Hope Valley
Family Income Brackets in Hope Valley
According to the Hope Valley family income data, there are 127 families falling into the $200,000+ income range, which is the most common income bracket and makes up 20.8% of all families.
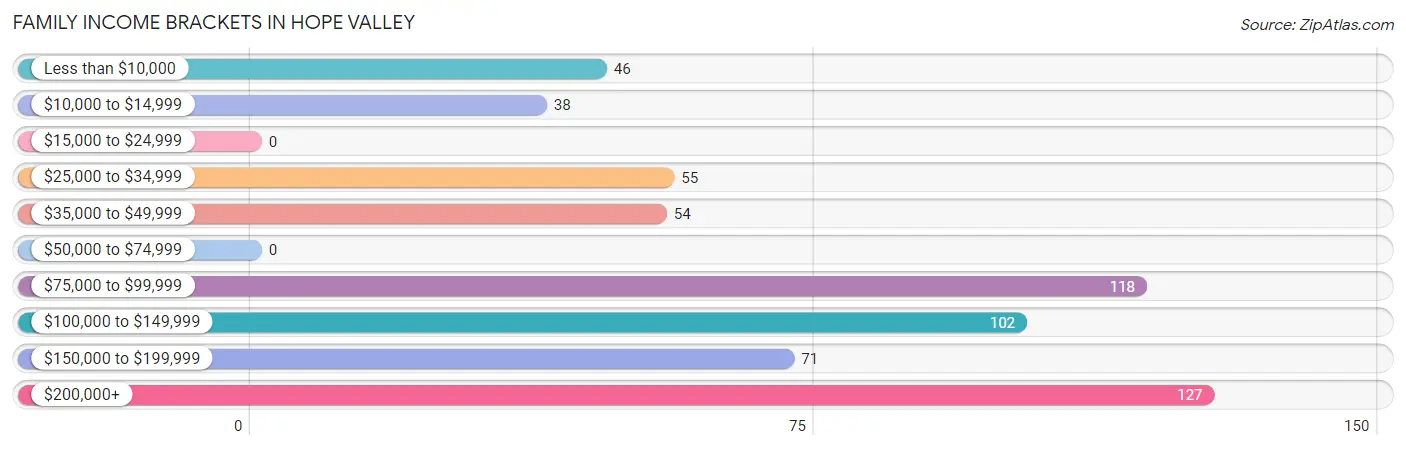
| Income Bracket | # Families | % Families |
| Less than $10,000 | 46 | 7.5% |
| $10,000 to $14,999 | 38 | 6.2% |
| $15,000 to $24,999 | 0 | 0.0% |
| $25,000 to $34,999 | 55 | 9.0% |
| $35,000 to $49,999 | 54 | 8.8% |
| $50,000 to $74,999 | 0 | 0.0% |
| $75,000 to $99,999 | 118 | 19.3% |
| $100,000 to $149,999 | 102 | 16.7% |
| $150,000 to $199,999 | 71 | 11.6% |
| $200,000+ | 127 | 20.8% |
Family Income by Famaliy Size in Hope Valley
4-person families (105 | 17.2%) account for the highest median family income in Hope Valley with $124,250 per family, while 2-person families (240 | 39.3%) have the highest median income of $46,632 per family member.
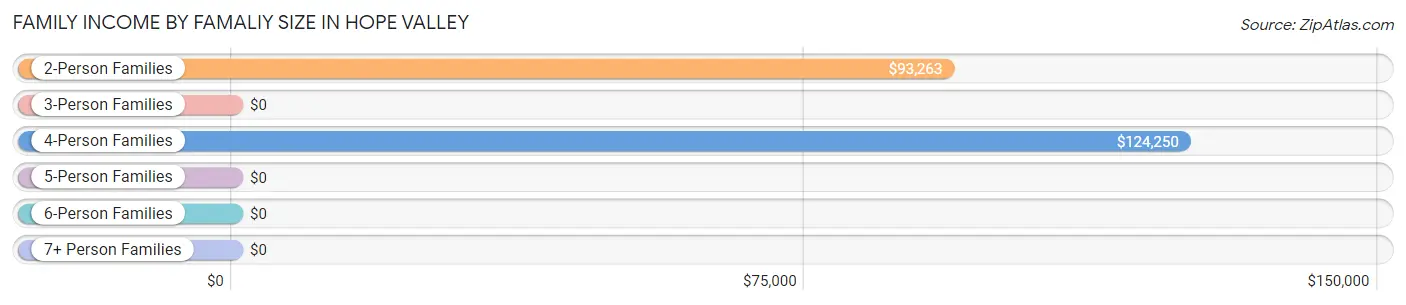
| Income Bracket | # Families | Median Income |
| 2-Person Families | 240 (39.3%) | $93,263 |
| 3-Person Families | 193 (31.6%) | $0 |
| 4-Person Families | 105 (17.2%) | $124,250 |
| 5-Person Families | 47 (7.7%) | $0 |
| 6-Person Families | 0 (0.0%) | $0 |
| 7+ Person Families | 26 (4.3%) | $0 |
| Total | 611 (100.0%) | $94,883 |
Family Income by Number of Earners in Hope Valley
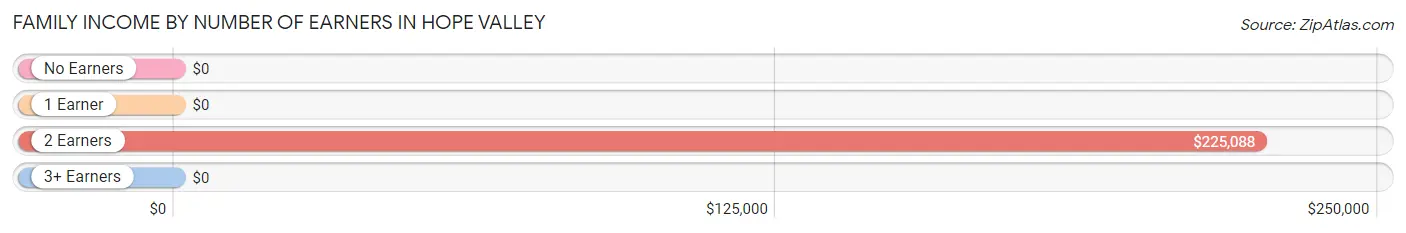
| Number of Earners | # Families | Median Income |
| No Earners | 67 (11.0%) | $0 |
| 1 Earner | 271 (44.4%) | $0 |
| 2 Earners | 210 (34.4%) | $225,088 |
| 3+ Earners | 63 (10.3%) | $0 |
| Total | 611 (100.0%) | $94,883 |
Household Income in Hope Valley
Household Income Brackets in Hope Valley
With 133 households falling in the category, the $75,000 to $99,999 income range is the most frequent in Hope Valley, accounting for 18.9% of all households.
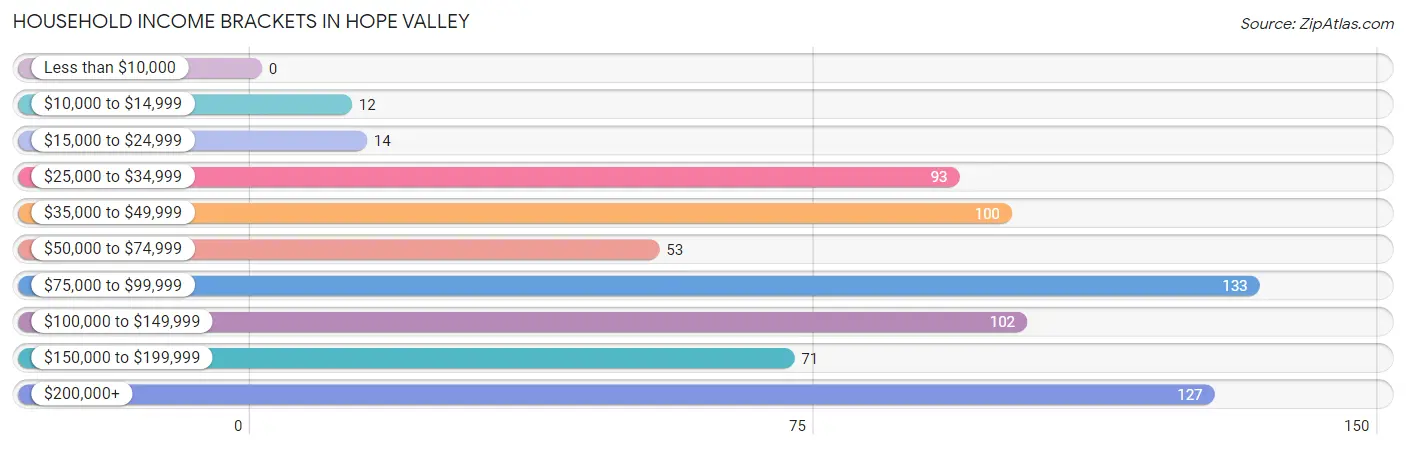
| Income Bracket | # Households | % Households |
| Less than $10,000 | 0 | 0.0% |
| $10,000 to $14,999 | 12 | 1.7% |
| $15,000 to $24,999 | 14 | 2.0% |
| $25,000 to $34,999 | 93 | 13.2% |
| $35,000 to $49,999 | 100 | 14.2% |
| $50,000 to $74,999 | 53 | 7.5% |
| $75,000 to $99,999 | 133 | 18.9% |
| $100,000 to $149,999 | 102 | 14.5% |
| $150,000 to $199,999 | 71 | 10.1% |
| $200,000+ | 127 | 18.0% |
Household Income by Householder Age in Hope Valley
The median household income in Hope Valley is $93,888, with the highest median household income of $225,691 found in the 45 to 64 years age bracket for the primary householder. A total of 207 households (29.4%) fall into this category.
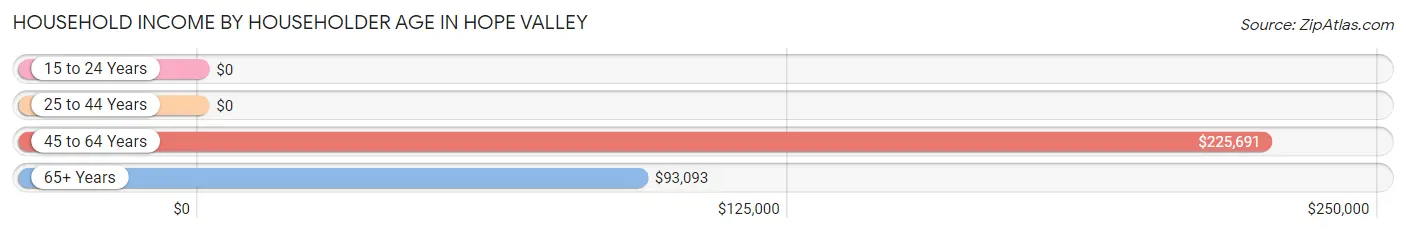
| Income Bracket | # Households | Median Income |
| 15 to 24 Years | 0 (0.0%) | $0 |
| 25 to 44 Years | 246 (34.9%) | $0 |
| 45 to 64 Years | 207 (29.4%) | $225,691 |
| 65+ Years | 252 (35.7%) | $93,093 |
| Total | 705 (100.0%) | $93,888 |
Poverty in Hope Valley
Income Below Poverty by Sex and Age in Hope Valley
With 5.3% poverty level for males and 16.7% for females among the residents of Hope Valley, 18 to 24 year old males and under 5 year old females are the most vulnerable to poverty, with 45 males (49.4%) and 72 females (52.5%) in their respective age groups living below the poverty level.
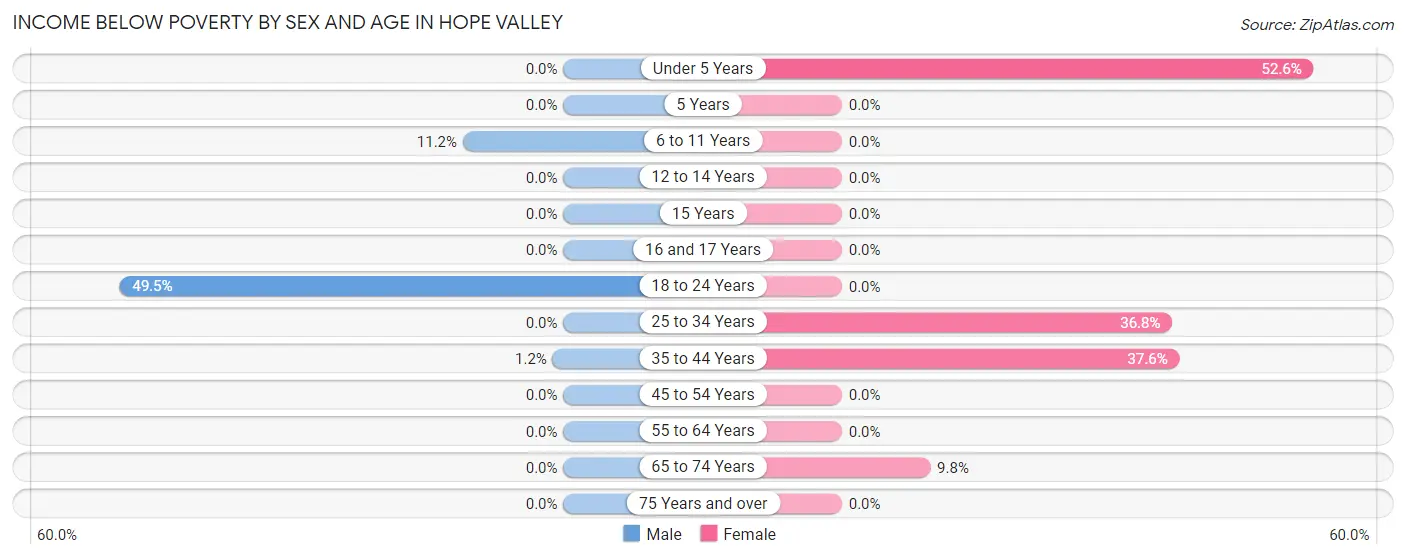
| Age Bracket | Male | Female |
| Under 5 Years | 0 (0.0%) | 72 (52.5%) |
| 5 Years | 0 (0.0%) | 0 (0.0%) |
| 6 to 11 Years | 15 (11.2%) | 0 (0.0%) |
| 12 to 14 Years | 0 (0.0%) | 0 (0.0%) |
| 15 Years | 0 (0.0%) | 0 (0.0%) |
| 16 and 17 Years | 0 (0.0%) | 0 (0.0%) |
| 18 to 24 Years | 45 (49.4%) | 0 (0.0%) |
| 25 to 34 Years | 0 (0.0%) | 46 (36.8%) |
| 35 to 44 Years | 4 (1.2%) | 38 (37.6%) |
| 45 to 54 Years | 0 (0.0%) | 0 (0.0%) |
| 55 to 64 Years | 0 (0.0%) | 0 (0.0%) |
| 65 to 74 Years | 0 (0.0%) | 12 (9.8%) |
| 75 Years and over | 0 (0.0%) | 0 (0.0%) |
| Total | 64 (5.3%) | 168 (16.7%) |
Income Above Poverty by Sex and Age in Hope Valley
According to the poverty statistics in Hope Valley, males aged under 5 years and females aged 6 to 11 years are the age groups that are most secure financially, with 100.0% of males and 100.0% of females in these age groups living above the poverty line.
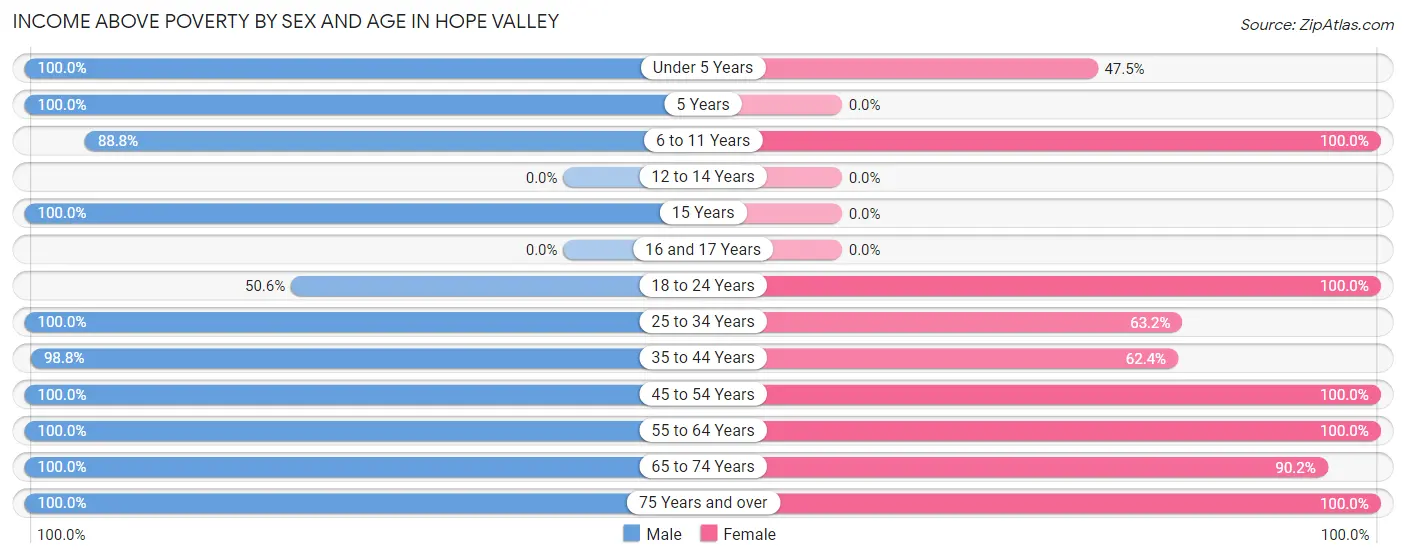
| Age Bracket | Male | Female |
| Under 5 Years | 32 (100.0%) | 65 (47.4%) |
| 5 Years | 45 (100.0%) | 0 (0.0%) |
| 6 to 11 Years | 119 (88.8%) | 62 (100.0%) |
| 12 to 14 Years | 0 (0.0%) | 0 (0.0%) |
| 15 Years | 83 (100.0%) | 0 (0.0%) |
| 16 and 17 Years | 0 (0.0%) | 0 (0.0%) |
| 18 to 24 Years | 46 (50.5%) | 108 (100.0%) |
| 25 to 34 Years | 72 (100.0%) | 79 (63.2%) |
| 35 to 44 Years | 331 (98.8%) | 63 (62.4%) |
| 45 to 54 Years | 16 (100.0%) | 74 (100.0%) |
| 55 to 64 Years | 175 (100.0%) | 265 (100.0%) |
| 65 to 74 Years | 155 (100.0%) | 110 (90.2%) |
| 75 Years and over | 64 (100.0%) | 13 (100.0%) |
| Total | 1,138 (94.7%) | 839 (83.3%) |
Income Below Poverty Among Married-Couple Families in Hope Valley
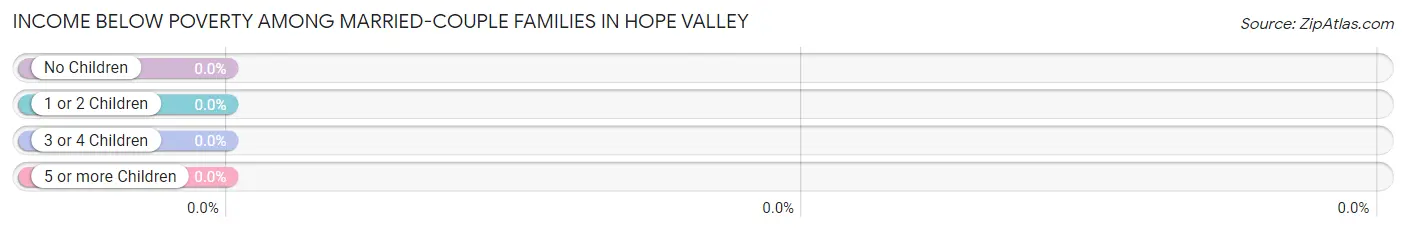
| Children | Above Poverty | Below Poverty |
| No Children | 358 (100.0%) | 0 (0.0%) |
| 1 or 2 Children | 57 (100.0%) | 0 (0.0%) |
| 3 or 4 Children | 47 (100.0%) | 0 (0.0%) |
| 5 or more Children | 26 (100.0%) | 0 (0.0%) |
| Total | 488 (100.0%) | 0 (0.0%) |
Income Below Poverty Among Single-Parent Households in Hope Valley
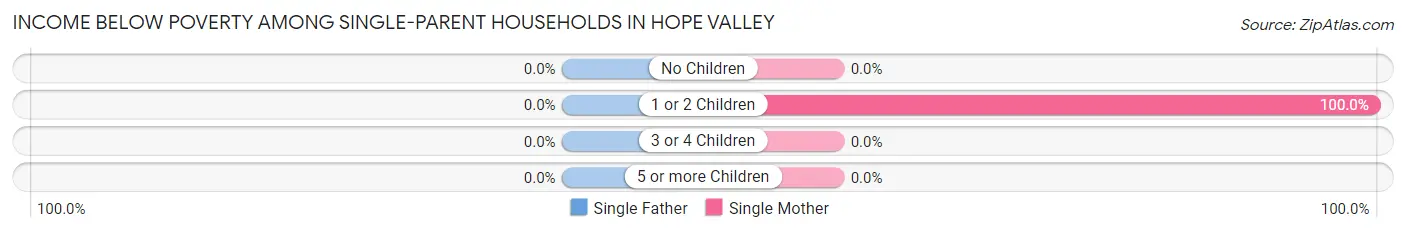
| Children | Single Father | Single Mother |
| No Children | 0 (0.0%) | 0 (0.0%) |
| 1 or 2 Children | 0 (0.0%) | 84 (100.0%) |
| 3 or 4 Children | 0 (0.0%) | 0 (0.0%) |
| 5 or more Children | 0 (0.0%) | 0 (0.0%) |
| Total | 0 (0.0%) | 84 (100.0%) |
Income Below Poverty Among Married-Couple vs Single-Parent Households in Hope Valley
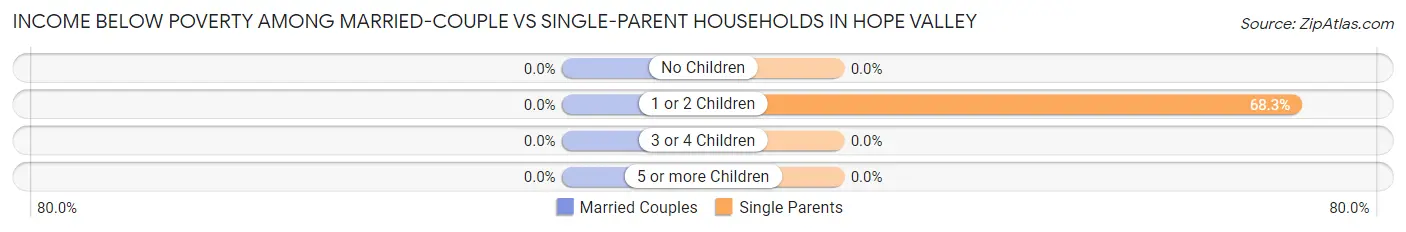
| Children | Married-Couple Families | Single-Parent Households |
| No Children | 0 (0.0%) | 0 (0.0%) |
| 1 or 2 Children | 0 (0.0%) | 84 (68.3%) |
| 3 or 4 Children | 0 (0.0%) | 0 (0.0%) |
| 5 or more Children | 0 (0.0%) | 0 (0.0%) |
| Total | 0 (0.0%) | 84 (68.3%) |
Race in Hope Valley
The most populous races in Hope Valley are White / Caucasian (2,107 | 95.4%), and Two or more Races (102 | 4.6%).
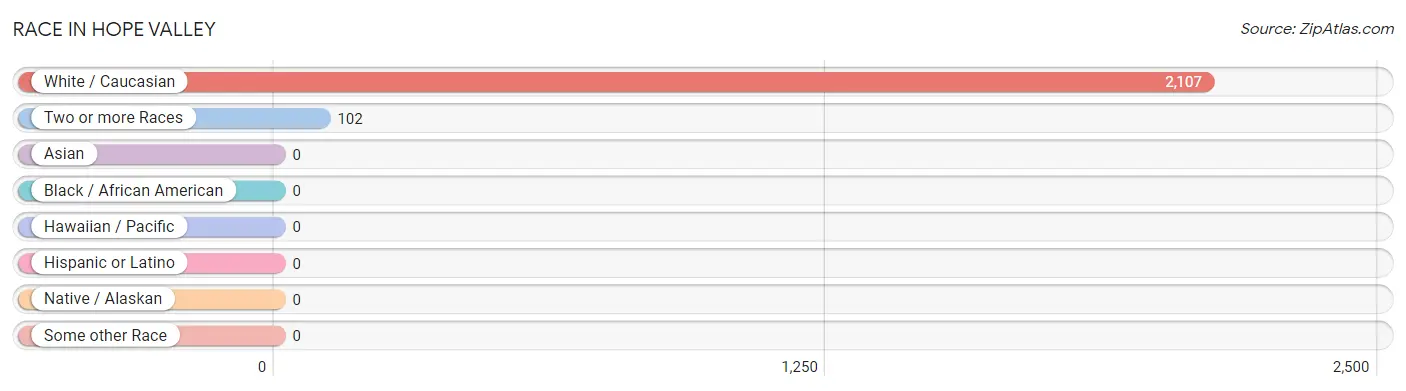
| Race | # Population | % Population |
| Asian | 0 | 0.0% |
| Black / African American | 0 | 0.0% |
| Hawaiian / Pacific | 0 | 0.0% |
| Hispanic or Latino | 0 | 0.0% |
| Native / Alaskan | 0 | 0.0% |
| White / Caucasian | 2,107 | 95.4% |
| Two or more Races | 102 | 4.6% |
| Some other Race | 0 | 0.0% |
| Total | 2,209 | 100.0% |
Ancestry in Hope Valley
The most populous ancestries reported in Hope Valley are English (621 | 28.1%), Italian (383 | 17.3%), French (370 | 16.8%), Irish (314 | 14.2%), and German (240 | 10.9%), together accounting for 87.3% of all Hope Valley residents.
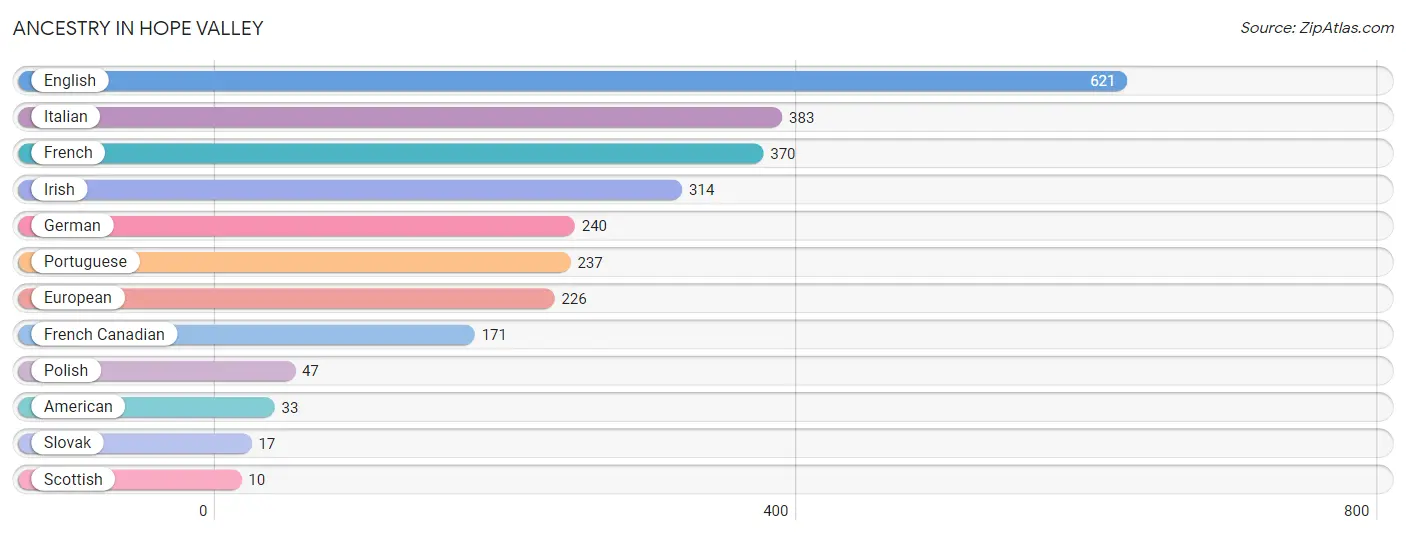
| Ancestry | # Population | % Population |
| American | 33 | 1.5% |
| English | 621 | 28.1% |
| European | 226 | 10.2% |
| French | 370 | 16.8% |
| French Canadian | 171 | 7.7% |
| German | 240 | 10.9% |
| Irish | 314 | 14.2% |
| Italian | 383 | 17.3% |
| Polish | 47 | 2.1% |
| Portuguese | 237 | 10.7% |
| Scottish | 10 | 0.4% |
| Slovak | 17 | 0.8% | View All 12 Rows |
Immigrants in Hope Valley

| Immigration Origin | # Population | % Population | View All 0 Rows |
Sex and Age in Hope Valley
Sex and Age in Hope Valley
The most populous age groups in Hope Valley are 15 to 19 Years (174 | 14.5%) for men and 60 to 64 Years (265 | 26.3%) for women.
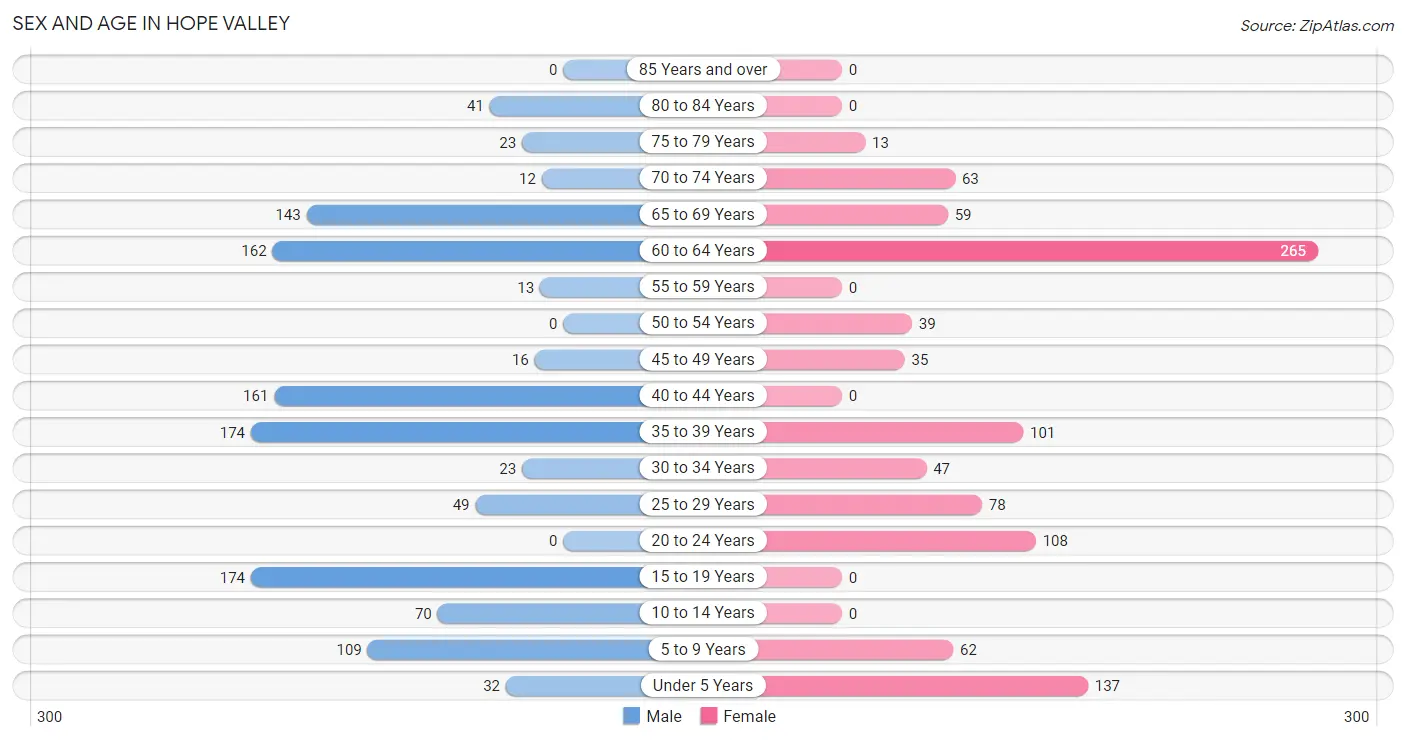
| Age Bracket | Male | Female |
| Under 5 Years | 32 (2.7%) | 137 (13.6%) |
| 5 to 9 Years | 109 (9.1%) | 62 (6.2%) |
| 10 to 14 Years | 70 (5.8%) | 0 (0.0%) |
| 15 to 19 Years | 174 (14.5%) | 0 (0.0%) |
| 20 to 24 Years | 0 (0.0%) | 108 (10.7%) |
| 25 to 29 Years | 49 (4.1%) | 78 (7.7%) |
| 30 to 34 Years | 23 (1.9%) | 47 (4.7%) |
| 35 to 39 Years | 174 (14.5%) | 101 (10.0%) |
| 40 to 44 Years | 161 (13.4%) | 0 (0.0%) |
| 45 to 49 Years | 16 (1.3%) | 35 (3.5%) |
| 50 to 54 Years | 0 (0.0%) | 39 (3.9%) |
| 55 to 59 Years | 13 (1.1%) | 0 (0.0%) |
| 60 to 64 Years | 162 (13.5%) | 265 (26.3%) |
| 65 to 69 Years | 143 (11.9%) | 59 (5.9%) |
| 70 to 74 Years | 12 (1.0%) | 63 (6.3%) |
| 75 to 79 Years | 23 (1.9%) | 13 (1.3%) |
| 80 to 84 Years | 41 (3.4%) | 0 (0.0%) |
| 85 Years and over | 0 (0.0%) | 0 (0.0%) |
| Total | 1,202 (100.0%) | 1,007 (100.0%) |
Families and Households in Hope Valley
Median Family Size in Hope Valley
The median family size in Hope Valley is 3.25 persons per family, with married-couple families (488 | 79.9%) accounting for the largest median family size of 3.44 persons per family. On the other hand, single male/father families (39 | 6.4%) represent the smallest median family size with 2.28 persons per family.
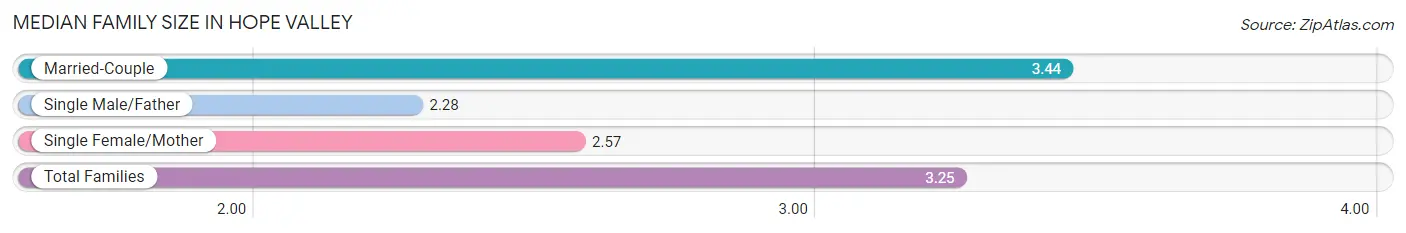
| Family Type | # Families | Family Size |
| Married-Couple | 488 (79.9%) | 3.44 |
| Single Male/Father | 39 (6.4%) | 2.28 |
| Single Female/Mother | 84 (13.8%) | 2.57 |
| Total Families | 611 (100.0%) | 3.25 |
Median Household Size in Hope Valley
The median household size in Hope Valley is 3.13 persons per household, with single female/mother households (84 | 11.9%) accounting for the largest median household size of 3.86 persons per household. non-family households (94 | 13.3%) represent the smallest median household size with 1.18 persons per household.
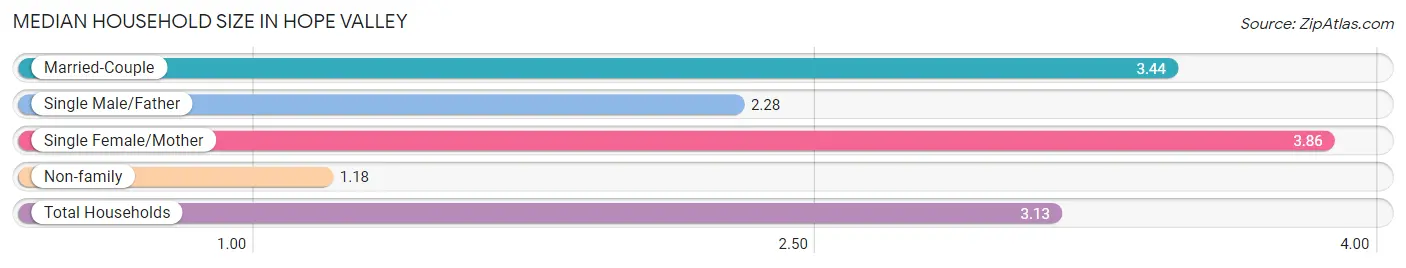
| Household Type | # Households | Household Size |
| Married-Couple | 488 (69.2%) | 3.44 |
| Single Male/Father | 39 (5.5%) | 2.28 |
| Single Female/Mother | 84 (11.9%) | 3.86 |
| Non-family | 94 (13.3%) | 1.18 |
| Total Households | 705 (100.0%) | 3.13 |
Household Size by Marriage Status in Hope Valley
Out of a total of 705 households in Hope Valley, 611 (86.7%) are family households, while 94 (13.3%) are nonfamily households. The most numerous type of family households are 2-person households, comprising 240, and the most common type of nonfamily households are 1-person households, comprising 78.
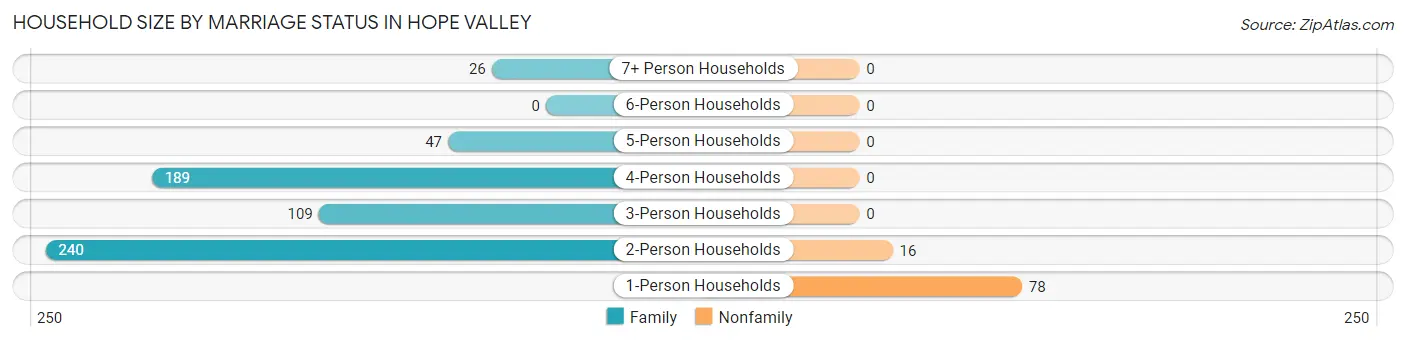
| Household Size | Family Households | Nonfamily Households |
| 1-Person Households | - | 78 (11.1%) |
| 2-Person Households | 240 (34.0%) | 16 (2.3%) |
| 3-Person Households | 109 (15.5%) | 0 (0.0%) |
| 4-Person Households | 189 (26.8%) | 0 (0.0%) |
| 5-Person Households | 47 (6.7%) | 0 (0.0%) |
| 6-Person Households | 0 (0.0%) | 0 (0.0%) |
| 7+ Person Households | 26 (3.7%) | 0 (0.0%) |
| Total | 611 (86.7%) | 94 (13.3%) |
Female Fertility in Hope Valley
Fertility by Age in Hope Valley
| Age Bracket | Women with Births | Births / 1,000 Women |
| 15 to 19 years | 0 (0.0%) | 0.0 |
| 20 to 34 years | 0 (0.0%) | 0.0 |
| 35 to 50 years | 0 (0.0%) | 0.0 |
| Total | 0 (0.0%) | 0.0 |
Fertility by Age by Marriage Status in Hope Valley
| Age Bracket | Married | Unmarried |
| 15 to 19 years | 0 (0.0%) | 0 (0.0%) |
| 20 to 34 years | 0 (0.0%) | 0 (0.0%) |
| 35 to 50 years | 0 (0.0%) | 0 (0.0%) |
| Total | 0 (0.0%) | 0 (0.0%) |
Fertility by Education in Hope Valley
| Educational Attainment | Women with Births | Births / 1,000 Women |
| Less than High School | 0 (0.0%) | 0.0 |
| High School Diploma | 0 (0.0%) | 0.0 |
| College or Associate's Degree | 0 (0.0%) | 0.0 |
| Bachelor's Degree | 0 (0.0%) | 0.0 |
| Graduate Degree | 0 (0.0%) | 0.0 |
| Total | 0 (0.0%) | 0.0 |
Fertility by Education by Marriage Status in Hope Valley
| Educational Attainment | Married | Unmarried |
| Less than High School | 0 (0.0%) | 0 (0.0%) |
| High School Diploma | 0 (0.0%) | 0 (0.0%) |
| College or Associate's Degree | 0 (0.0%) | 0 (0.0%) |
| Bachelor's Degree | 0 (0.0%) | 0 (0.0%) |
| Graduate Degree | 0 (0.0%) | 0 (0.0%) |
| Total | 0 (0.0%) | 0 (0.0%) |
Employment Characteristics in Hope Valley
Employment by Class of Employer in Hope Valley
Among the 1,038 employed individuals in Hope Valley, private company employees (641 | 61.8%), not-for-profit organizations (197 | 19.0%), and self-employed (not incorporated) (84 | 8.1%) make up the most common classes of employment.
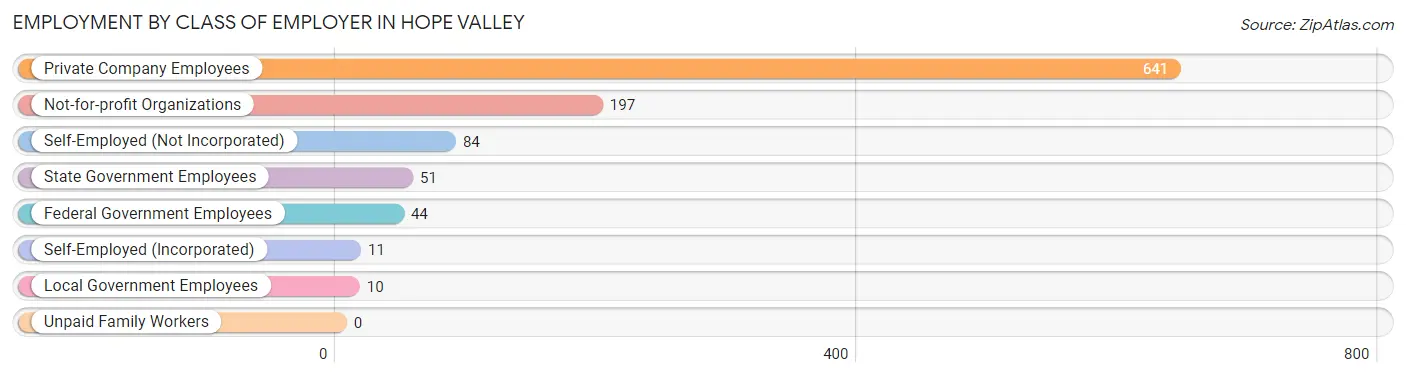
| Employer Class | # Employees | % Employees |
| Private Company Employees | 641 | 61.8% |
| Self-Employed (Incorporated) | 11 | 1.1% |
| Self-Employed (Not Incorporated) | 84 | 8.1% |
| Not-for-profit Organizations | 197 | 19.0% |
| Local Government Employees | 10 | 1.0% |
| State Government Employees | 51 | 4.9% |
| Federal Government Employees | 44 | 4.2% |
| Unpaid Family Workers | 0 | 0.0% |
| Total | 1,038 | 100.0% |
Employment Status by Age in Hope Valley
According to the labor force statistics for Hope Valley, out of the total population over 16 years of age (1,716), 68.8% or 1,181 individuals are in the labor force, with 8.4% or 99 of them unemployed. The age group with the highest labor force participation rate is 20 to 24 years, with 100.0% or 108 individuals in the labor force. Within the labor force, the 16 to 19 years age range has the highest percentage of unemployed individuals, with 100.0% or 45 of them being unemployed.
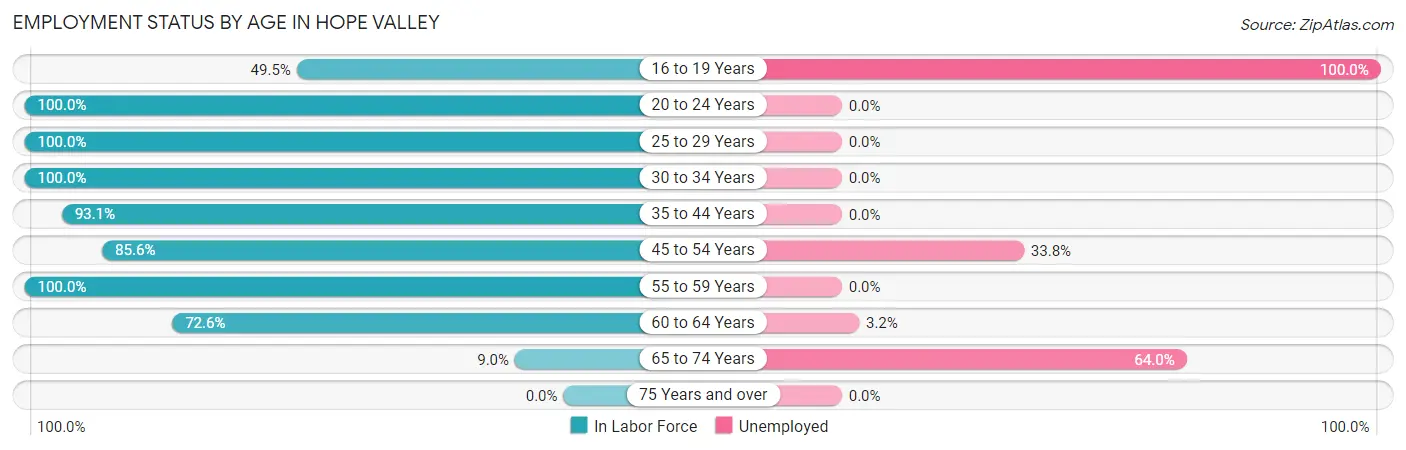
| Age Bracket | In Labor Force | Unemployed |
| 16 to 19 Years | 45 (49.5%) | 45 (100.0%) |
| 20 to 24 Years | 108 (100.0%) | 0 (0.0%) |
| 25 to 29 Years | 127 (100.0%) | 0 (0.0%) |
| 30 to 34 Years | 70 (100.0%) | 0 (0.0%) |
| 35 to 44 Years | 406 (93.1%) | 0 (0.0%) |
| 45 to 54 Years | 77 (85.6%) | 26 (33.8%) |
| 55 to 59 Years | 13 (100.0%) | 0 (0.0%) |
| 60 to 64 Years | 310 (72.6%) | 10 (3.2%) |
| 65 to 74 Years | 25 (9.0%) | 16 (64.0%) |
| 75 Years and over | 0 (0.0%) | 0 (0.0%) |
| Total | 1,181 (68.8%) | 99 (8.4%) |
Employment Status by Educational Attainment in Hope Valley
According to labor force statistics for Hope Valley, 86.2% of individuals (1,003) out of the total population between 25 and 64 years of age (1,163) are in the labor force, with 3.7% or 37 of them being unemployed. The group with the highest labor force participation rate are those with the educational attainment of less than high school, with 98.0% or 199 individuals in the labor force. Within the labor force, individuals with college / associate degree education have the highest percentage of unemployment, with 13.6% or 40 of them being unemployed.
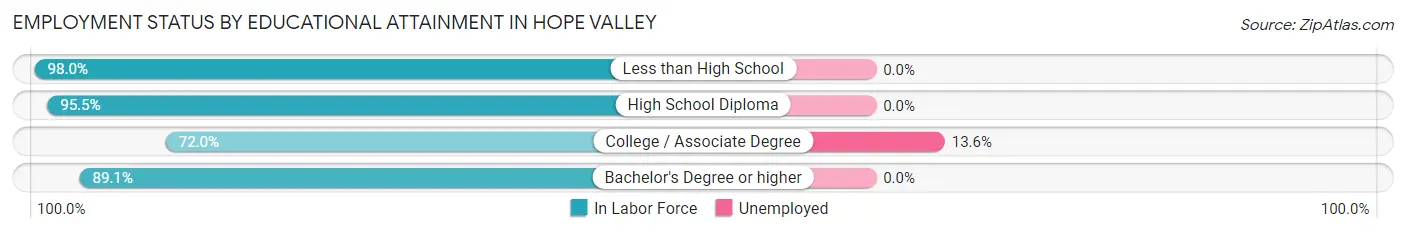
| Educational Attainment | In Labor Force | Unemployed |
| Less than High School | 199 (98.0%) | 0 (0.0%) |
| High School Diploma | 275 (95.5%) | 0 (0.0%) |
| College / Associate Degree | 293 (72.0%) | 55 (13.6%) |
| Bachelor's Degree or higher | 236 (89.1%) | 0 (0.0%) |
| Total | 1,003 (86.2%) | 43 (3.7%) |
Employment Occupations by Sex in Hope Valley
Management, Business, Science and Arts Occupations
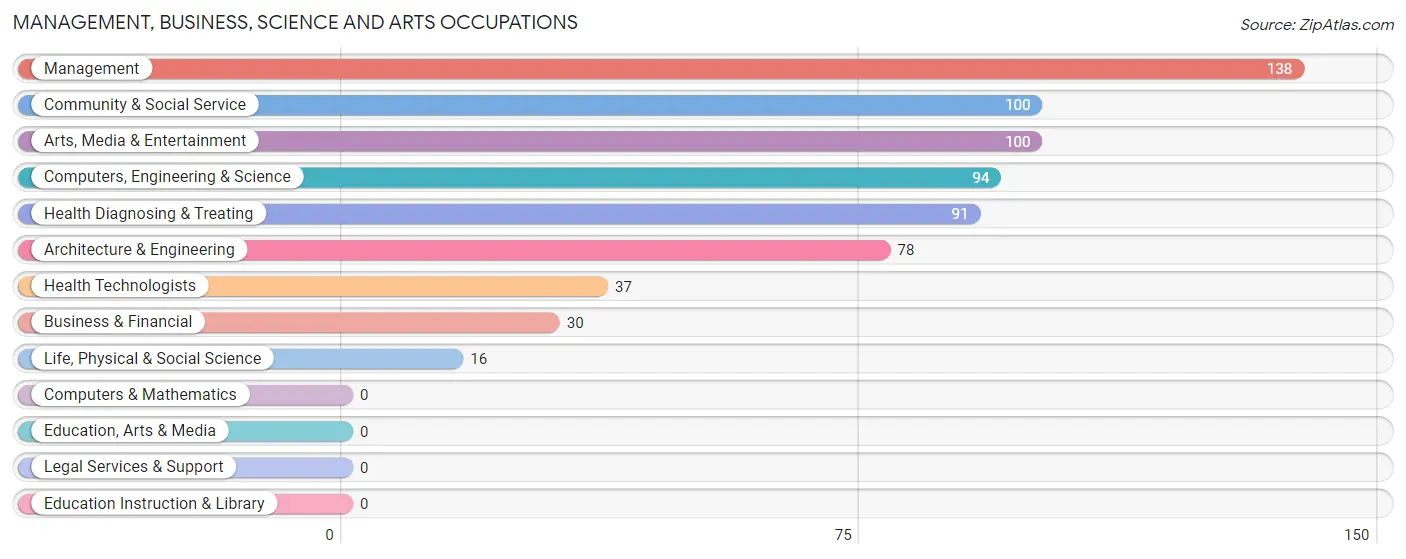
The most common Management, Business, Science and Arts occupations in Hope Valley are Management (138 | 13.1%), Community & Social Service (100 | 9.5%), Arts, Media & Entertainment (100 | 9.5%), Computers, Engineering & Science (94 | 8.9%), and Health Diagnosing & Treating (91 | 8.6%).
Management, Business, Science and Arts Occupations by Sex
Within the Management, Business, Science and Arts occupations in Hope Valley, the most male-oriented occupations are Life, Physical & Social Science (100.0%), Community & Social Service (100.0%), and Arts, Media & Entertainment (100.0%), while the most female-oriented occupations are Business & Financial (100.0%), Health Diagnosing & Treating (59.3%), and Architecture & Engineering (15.4%).
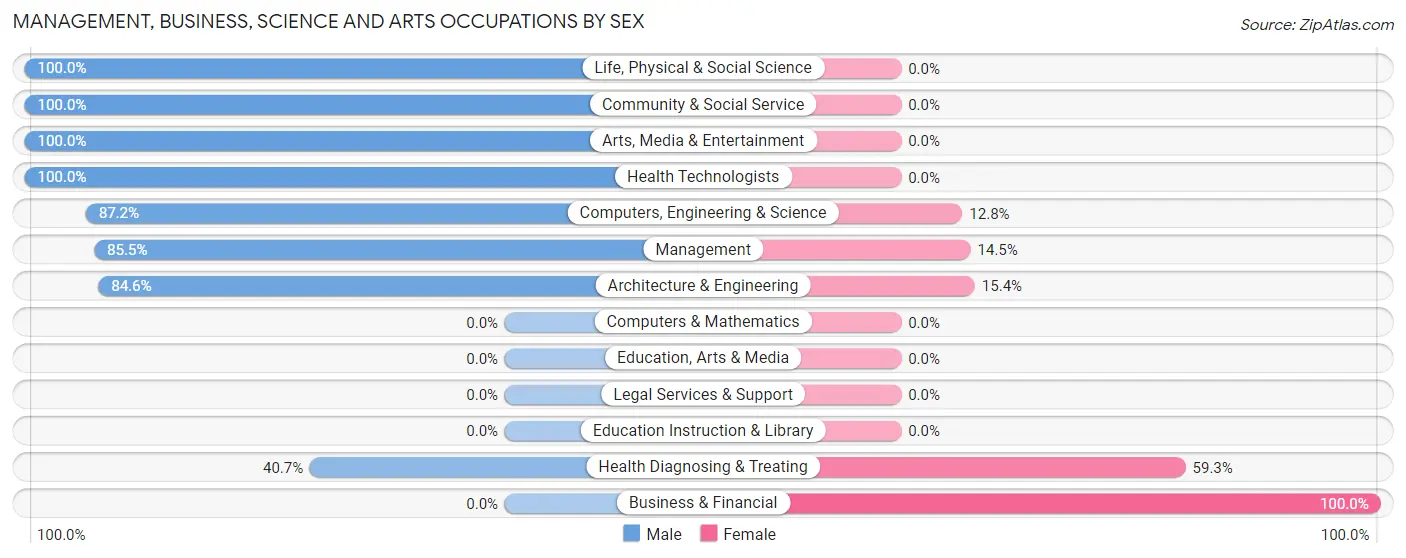
| Occupation | Male | Female |
| Management | 118 (85.5%) | 20 (14.5%) |
| Business & Financial | 0 (0.0%) | 30 (100.0%) |
| Computers, Engineering & Science | 82 (87.2%) | 12 (12.8%) |
| Computers & Mathematics | 0 (0.0%) | 0 (0.0%) |
| Architecture & Engineering | 66 (84.6%) | 12 (15.4%) |
| Life, Physical & Social Science | 16 (100.0%) | 0 (0.0%) |
| Community & Social Service | 100 (100.0%) | 0 (0.0%) |
| Education, Arts & Media | 0 (0.0%) | 0 (0.0%) |
| Legal Services & Support | 0 (0.0%) | 0 (0.0%) |
| Education Instruction & Library | 0 (0.0%) | 0 (0.0%) |
| Arts, Media & Entertainment | 100 (100.0%) | 0 (0.0%) |
| Health Diagnosing & Treating | 37 (40.7%) | 54 (59.3%) |
| Health Technologists | 37 (100.0%) | 0 (0.0%) |
| Total (Category) | 337 (74.4%) | 116 (25.6%) |
| Total (Overall) | 545 (51.7%) | 510 (48.3%) |
Services Occupations
The most common Services occupations in Hope Valley are Healthcare Support (140 | 13.3%), Personal Care & Service (108 | 10.2%), Cleaning & Maintenance (87 | 8.3%), and Food Preparation & Serving (16 | 1.5%).
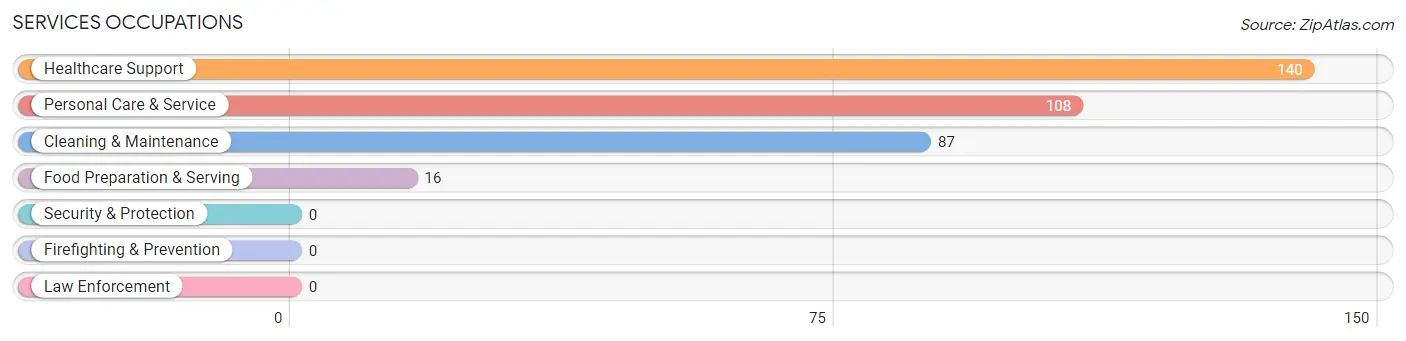
Services Occupations by Sex
Within the Services occupations in Hope Valley, the most male-oriented occupations are Food Preparation & Serving (100.0%), and Cleaning & Maintenance (56.3%), while the most female-oriented occupations are Healthcare Support (100.0%), Personal Care & Service (100.0%), and Cleaning & Maintenance (43.7%).
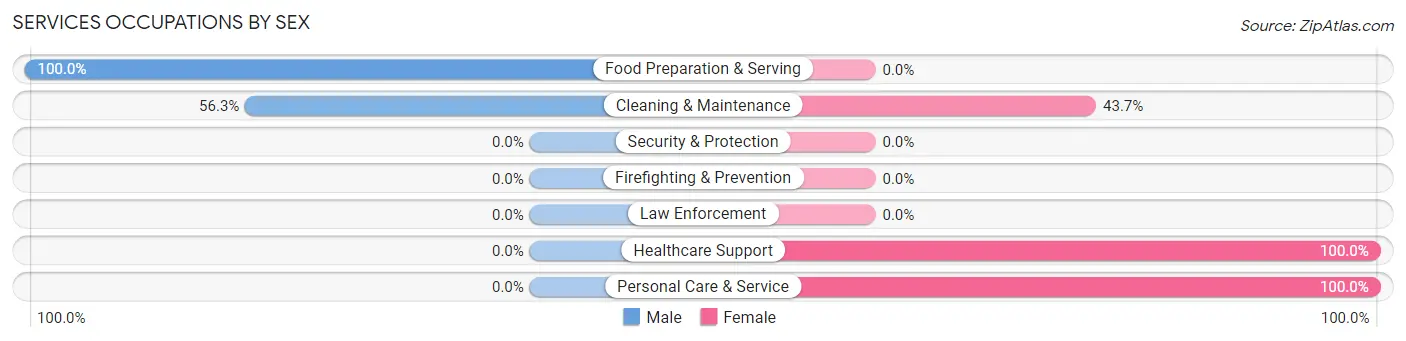
| Occupation | Male | Female |
| Healthcare Support | 0 (0.0%) | 140 (100.0%) |
| Security & Protection | 0 (0.0%) | 0 (0.0%) |
| Firefighting & Prevention | 0 (0.0%) | 0 (0.0%) |
| Law Enforcement | 0 (0.0%) | 0 (0.0%) |
| Food Preparation & Serving | 16 (100.0%) | 0 (0.0%) |
| Cleaning & Maintenance | 49 (56.3%) | 38 (43.7%) |
| Personal Care & Service | 0 (0.0%) | 108 (100.0%) |
| Total (Category) | 65 (18.5%) | 286 (81.5%) |
| Total (Overall) | 545 (51.7%) | 510 (48.3%) |
Sales and Office Occupations
The most common Sales and Office occupations in Hope Valley are , and Office & Administration (62 | 5.9%).
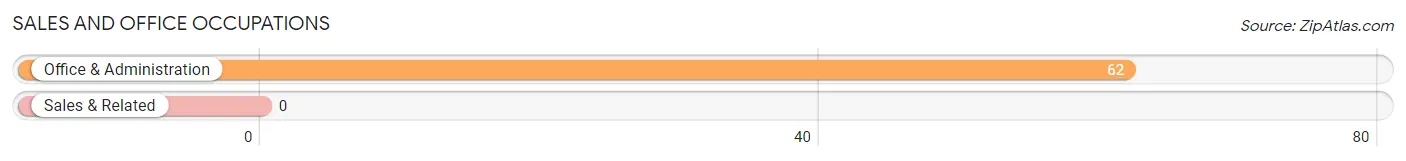
Sales and Office Occupations by Sex
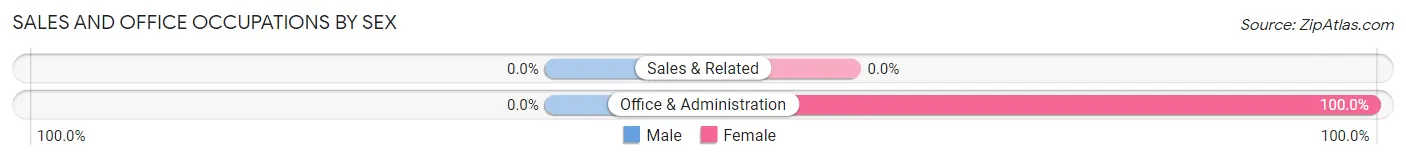
| Occupation | Male | Female |
| Sales & Related | 0 (0.0%) | 0 (0.0%) |
| Office & Administration | 0 (0.0%) | 62 (100.0%) |
| Total (Category) | 0 (0.0%) | 62 (100.0%) |
| Total (Overall) | 545 (51.7%) | 510 (48.3%) |
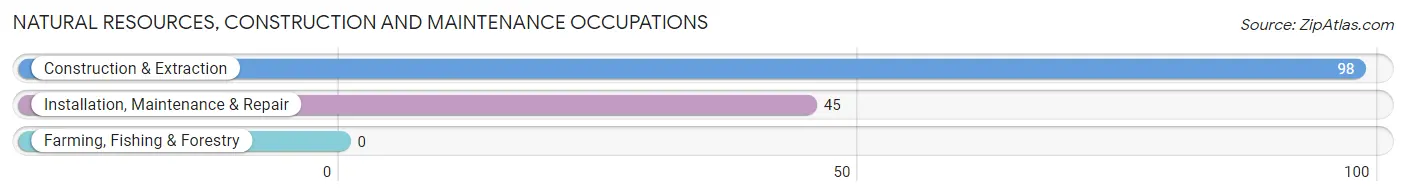
Natural Resources, Construction and Maintenance Occupations
The most common Natural Resources, Construction and Maintenance occupations in Hope Valley are Construction & Extraction (98 | 9.3%), and Installation, Maintenance & Repair (45 | 4.3%).
Natural Resources, Construction and Maintenance Occupations by Sex
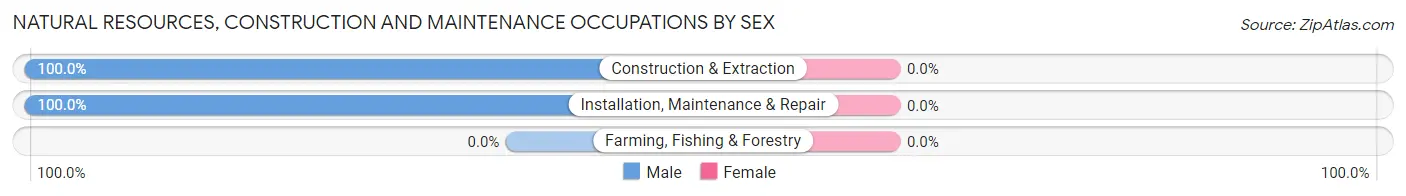
| Occupation | Male | Female |
| Farming, Fishing & Forestry | 0 (0.0%) | 0 (0.0%) |
| Construction & Extraction | 98 (100.0%) | 0 (0.0%) |
| Installation, Maintenance & Repair | 45 (100.0%) | 0 (0.0%) |
| Total (Category) | 143 (100.0%) | 0 (0.0%) |
| Total (Overall) | 545 (51.7%) | 510 (48.3%) |
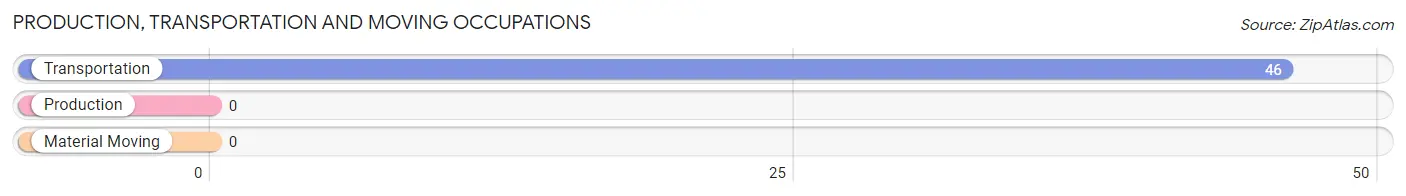
Production, Transportation and Moving Occupations
The most common Production, Transportation and Moving occupations in Hope Valley are , and Transportation (46 | 4.4%).
Production, Transportation and Moving Occupations by Sex
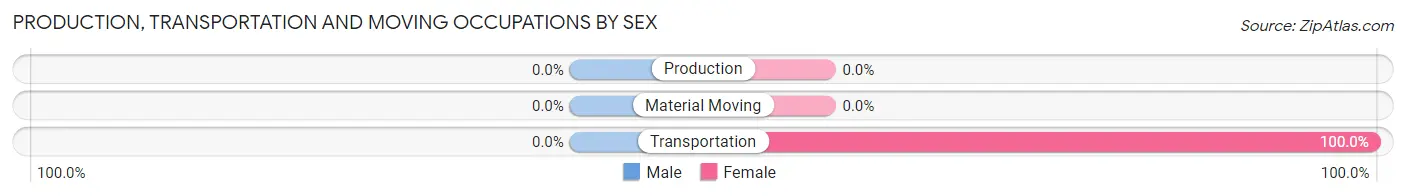
| Occupation | Male | Female |
| Production | 0 (0.0%) | 0 (0.0%) |
| Transportation | 0 (0.0%) | 46 (100.0%) |
| Material Moving | 0 (0.0%) | 0 (0.0%) |
| Total (Category) | 0 (0.0%) | 46 (100.0%) |
| Total (Overall) | 545 (51.7%) | 510 (48.3%) |
Employment Industries by Sex in Hope Valley
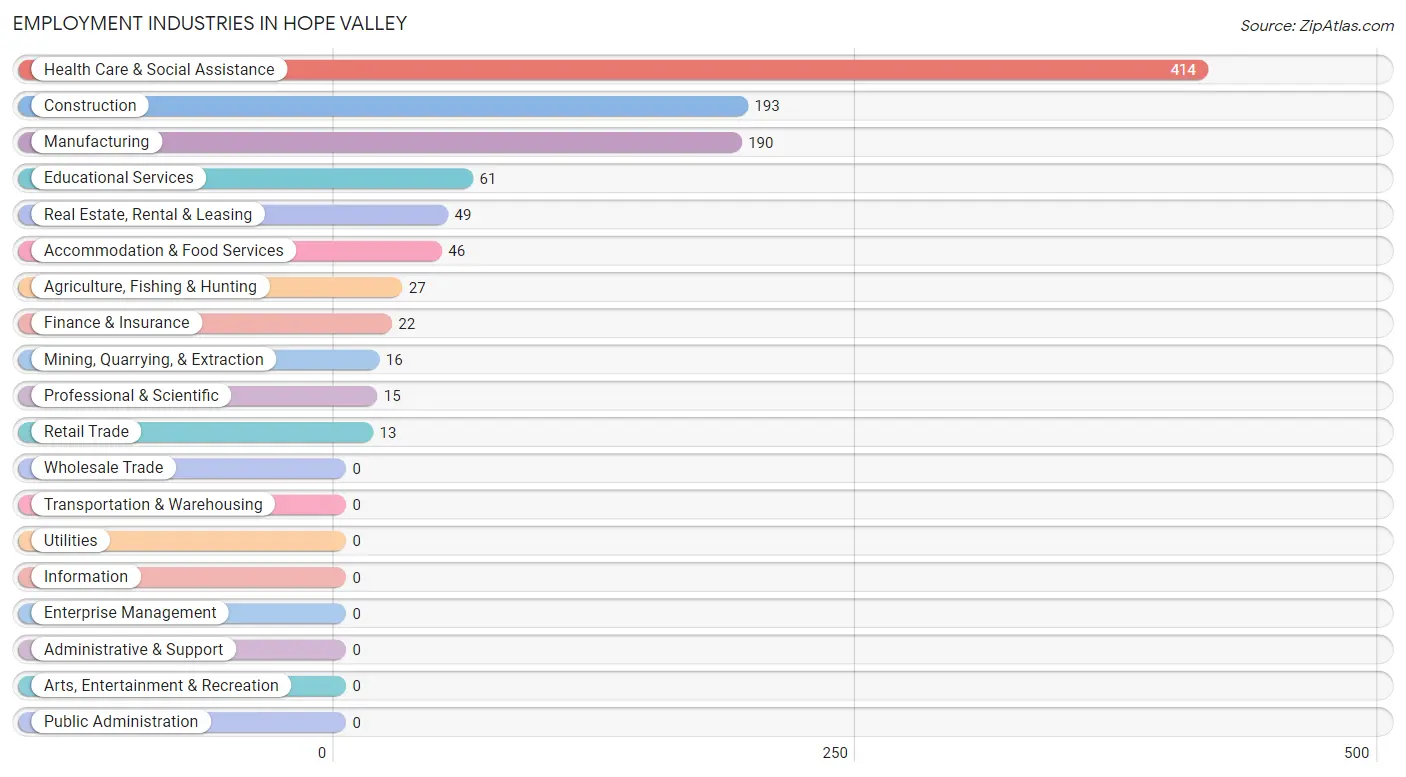
Employment Industries in Hope Valley
The major employment industries in Hope Valley include Health Care & Social Assistance (414 | 39.2%), Construction (193 | 18.3%), Manufacturing (190 | 18.0%), Educational Services (61 | 5.8%), and Real Estate, Rental & Leasing (49 | 4.6%).
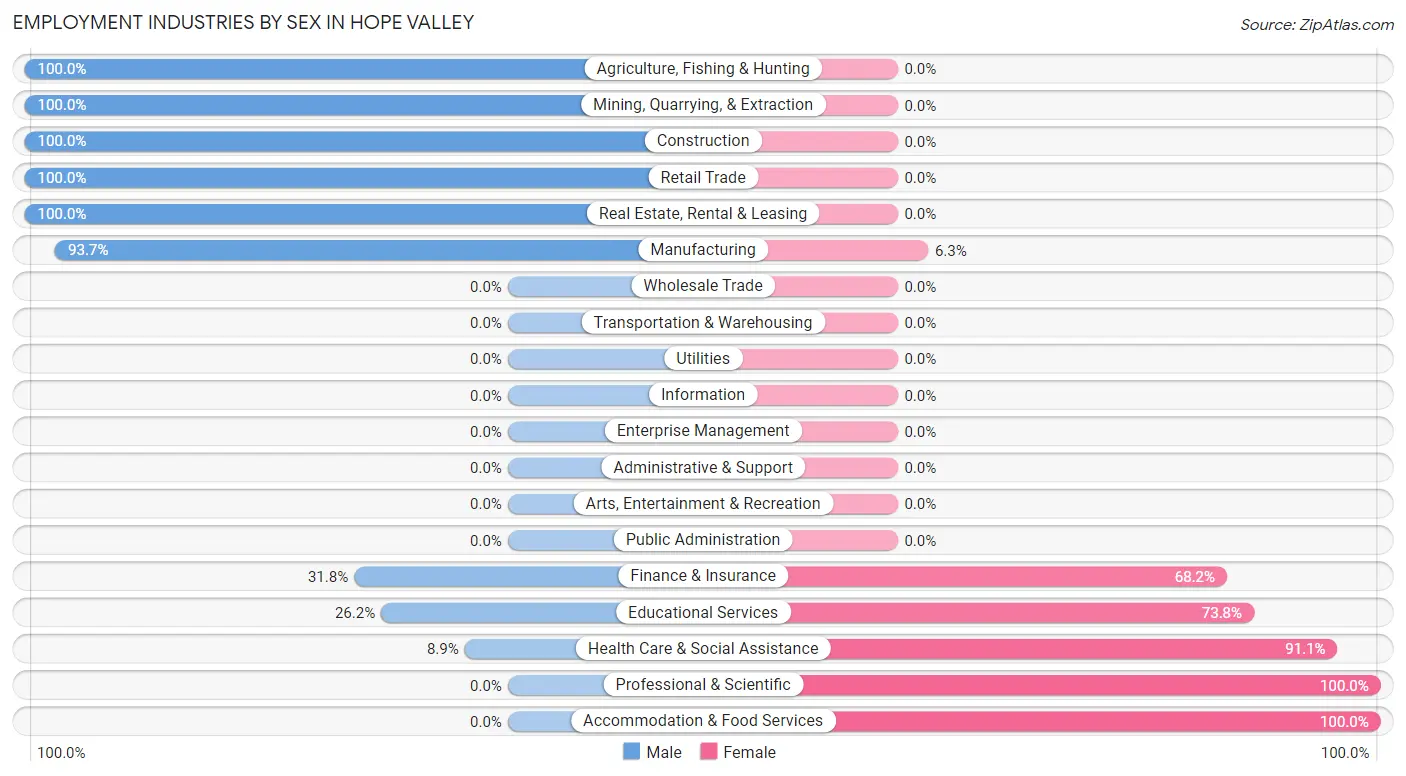
Employment Industries by Sex in Hope Valley
The Hope Valley industries that see more men than women are Agriculture, Fishing & Hunting (100.0%), Mining, Quarrying, & Extraction (100.0%), and Construction (100.0%), whereas the industries that tend to have a higher number of women are Professional & Scientific (100.0%), Accommodation & Food Services (100.0%), and Health Care & Social Assistance (91.1%).
| Industry | Male | Female |
| Agriculture, Fishing & Hunting | 27 (100.0%) | 0 (0.0%) |
| Mining, Quarrying, & Extraction | 16 (100.0%) | 0 (0.0%) |
| Construction | 193 (100.0%) | 0 (0.0%) |
| Manufacturing | 178 (93.7%) | 12 (6.3%) |
| Wholesale Trade | 0 (0.0%) | 0 (0.0%) |
| Retail Trade | 13 (100.0%) | 0 (0.0%) |
| Transportation & Warehousing | 0 (0.0%) | 0 (0.0%) |
| Utilities | 0 (0.0%) | 0 (0.0%) |
| Information | 0 (0.0%) | 0 (0.0%) |
| Finance & Insurance | 7 (31.8%) | 15 (68.2%) |
| Real Estate, Rental & Leasing | 49 (100.0%) | 0 (0.0%) |
| Professional & Scientific | 0 (0.0%) | 15 (100.0%) |
| Enterprise Management | 0 (0.0%) | 0 (0.0%) |
| Administrative & Support | 0 (0.0%) | 0 (0.0%) |
| Educational Services | 16 (26.2%) | 45 (73.8%) |
| Health Care & Social Assistance | 37 (8.9%) | 377 (91.1%) |
| Arts, Entertainment & Recreation | 0 (0.0%) | 0 (0.0%) |
| Accommodation & Food Services | 0 (0.0%) | 46 (100.0%) |
| Public Administration | 0 (0.0%) | 0 (0.0%) |
| Total | 545 (51.7%) | 510 (48.3%) |
Education in Hope Valley
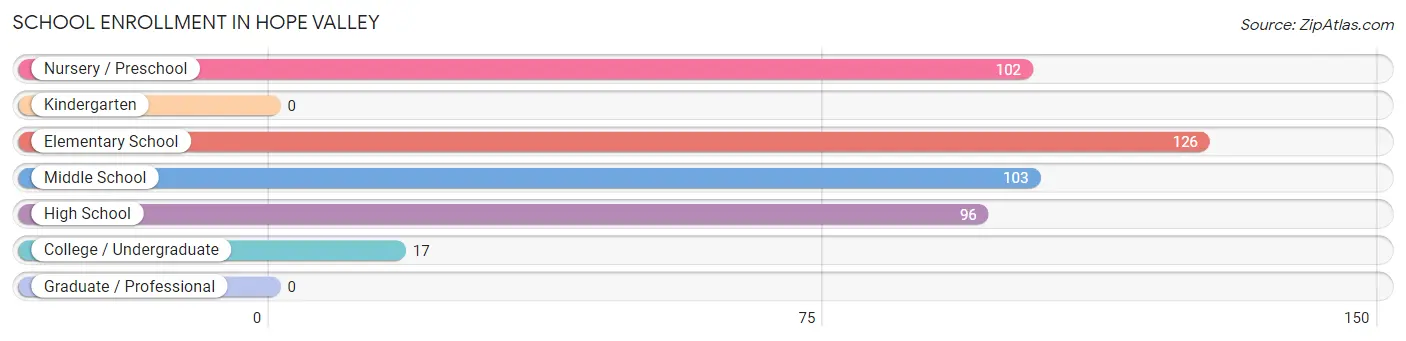
School Enrollment in Hope Valley
The most common levels of schooling among the 444 students in Hope Valley are elementary school (126 | 28.4%), middle school (103 | 23.2%), and nursery / preschool (102 | 23.0%).
| School Level | # Students | % Students |
| Nursery / Preschool | 102 | 23.0% |
| Kindergarten | 0 | 0.0% |
| Elementary School | 126 | 28.4% |
| Middle School | 103 | 23.2% |
| High School | 96 | 21.6% |
| College / Undergraduate | 17 | 3.8% |
| Graduate / Professional | 0 | 0.0% |
| Total | 444 | 100.0% |
School Enrollment by Age by Funding Source in Hope Valley
Out of a total of 444 students who are enrolled in schools in Hope Valley, 16 (3.6%) attend a private institution, while the remaining 428 (96.4%) are enrolled in public schools. The age group of 3 to 4 year olds has the highest likelihood of being enrolled in private schools, with 16 (28.1% in the age bracket) enrolled. Conversely, the age group of 5 to 9 year old has the lowest likelihood of being enrolled in a private school, with 171 (100.0% in the age bracket) attending a public institution.
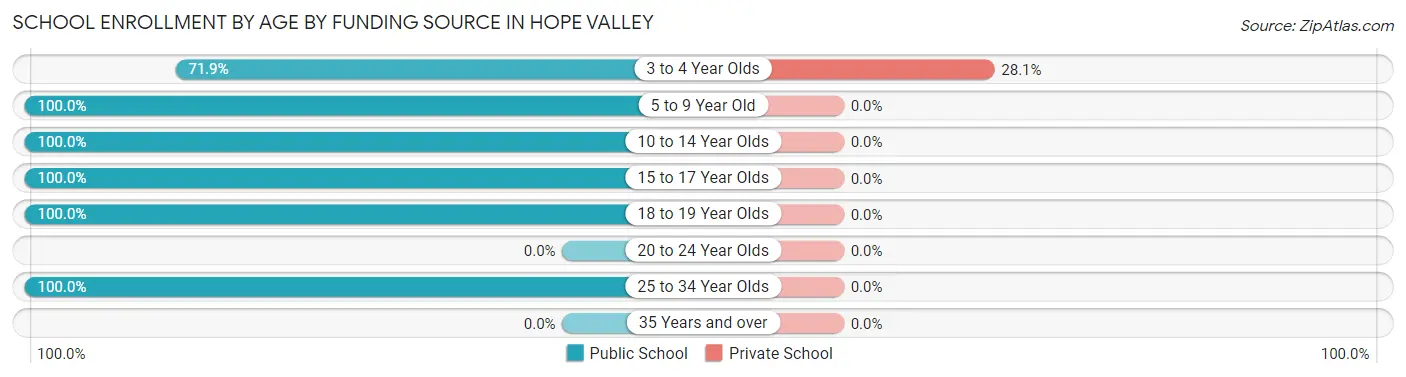
| Age Bracket | Public School | Private School |
| 3 to 4 Year Olds | 41 (71.9%) | 16 (28.1%) |
| 5 to 9 Year Old | 171 (100.0%) | 0 (0.0%) |
| 10 to 14 Year Olds | 70 (100.0%) | 0 (0.0%) |
| 15 to 17 Year Olds | 83 (100.0%) | 0 (0.0%) |
| 18 to 19 Year Olds | 46 (100.0%) | 0 (0.0%) |
| 20 to 24 Year Olds | 0 (0.0%) | 0 (0.0%) |
| 25 to 34 Year Olds | 17 (100.0%) | 0 (0.0%) |
| 35 Years and over | 0 (0.0%) | 0 (0.0%) |
| Total | 428 (96.4%) | 16 (3.6%) |
Educational Attainment by Field of Study in Hope Valley
Science & technology (98 | 21.7%), engineering (72 | 16.0%), social sciences (53 | 11.7%), business (51 | 11.3%), and education (48 | 10.6%) are the most common fields of study among 451 individuals in Hope Valley who have obtained a bachelor's degree or higher.
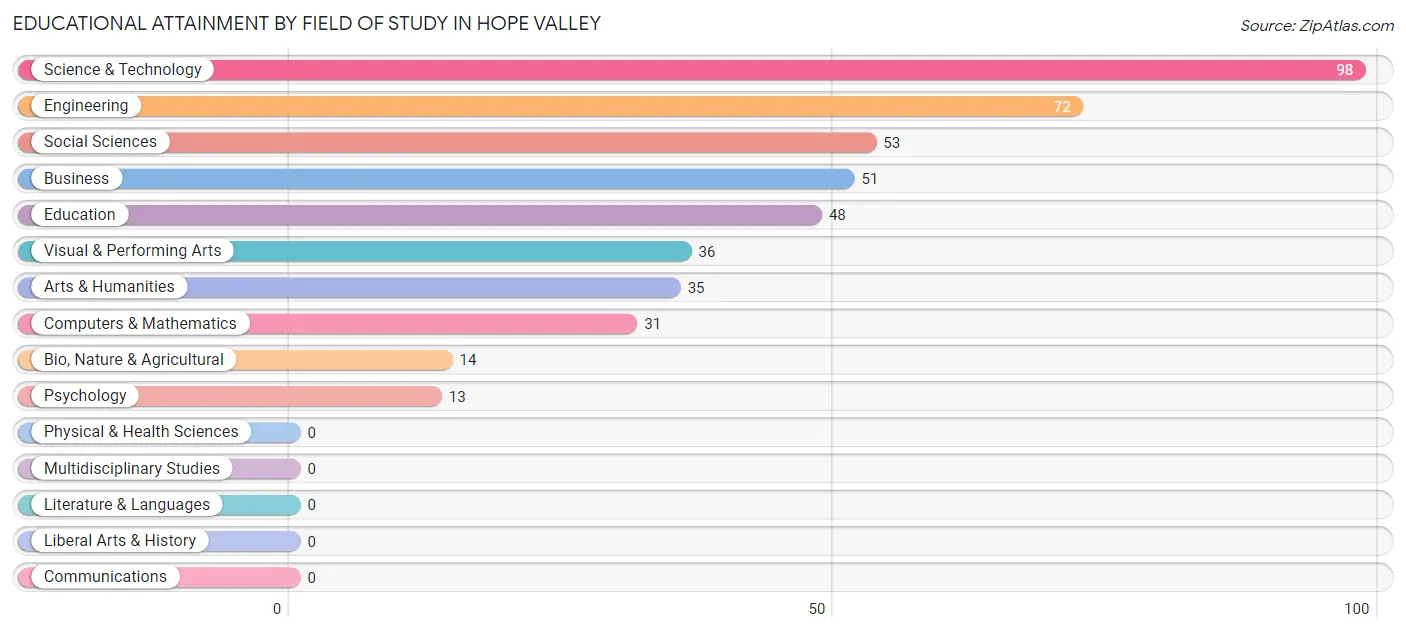
| Field of Study | # Graduates | % Graduates |
| Computers & Mathematics | 31 | 6.9% |
| Bio, Nature & Agricultural | 14 | 3.1% |
| Physical & Health Sciences | 0 | 0.0% |
| Psychology | 13 | 2.9% |
| Social Sciences | 53 | 11.7% |
| Engineering | 72 | 16.0% |
| Multidisciplinary Studies | 0 | 0.0% |
| Science & Technology | 98 | 21.7% |
| Business | 51 | 11.3% |
| Education | 48 | 10.6% |
| Literature & Languages | 0 | 0.0% |
| Liberal Arts & History | 0 | 0.0% |
| Visual & Performing Arts | 36 | 8.0% |
| Communications | 0 | 0.0% |
| Arts & Humanities | 35 | 7.8% |
| Total | 451 | 100.0% |
Transportation & Commute in Hope Valley
Vehicle Availability by Sex in Hope Valley
The most prevalent vehicle ownership categories in Hope Valley are males with 4 vehicles (246, accounting for 42.9%) and females with 4 vehicles (177, making up 53.0%).
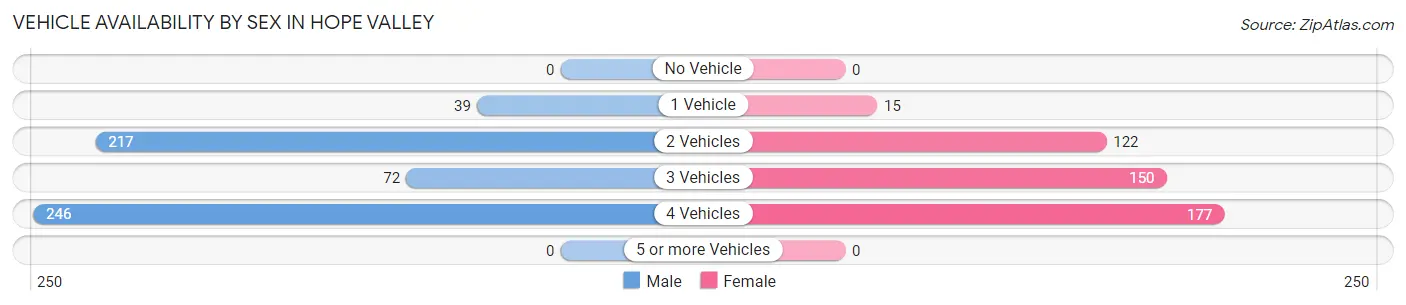
| Vehicles Available | Male | Female |
| No Vehicle | 0 (0.0%) | 0 (0.0%) |
| 1 Vehicle | 39 (6.8%) | 15 (3.2%) |
| 2 Vehicles | 217 (37.8%) | 122 (26.3%) |
| 3 Vehicles | 72 (12.5%) | 150 (32.3%) |
| 4 Vehicles | 246 (42.9%) | 177 (38.2%) |
| 5 or more Vehicles | 0 (0.0%) | 0 (0.0%) |
| Total | 574 (100.0%) | 464 (100.0%) |
Commute Time in Hope Valley
The most frequently occuring commute durations in Hope Valley are 30 to 34 minutes (453 commuters, 45.4%), 35 to 39 minutes (167 commuters, 16.7%), and 45 to 59 minutes (128 commuters, 12.8%).
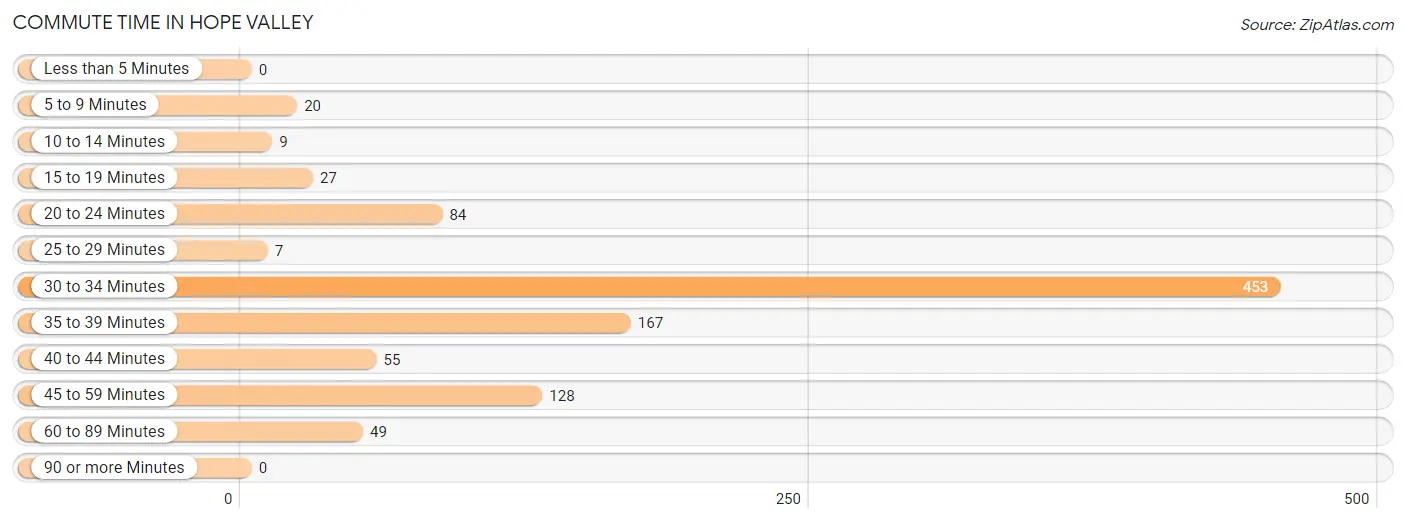
| Commute Time | # Commuters | % Commuters |
| Less than 5 Minutes | 0 | 0.0% |
| 5 to 9 Minutes | 20 | 2.0% |
| 10 to 14 Minutes | 9 | 0.9% |
| 15 to 19 Minutes | 27 | 2.7% |
| 20 to 24 Minutes | 84 | 8.4% |
| 25 to 29 Minutes | 7 | 0.7% |
| 30 to 34 Minutes | 453 | 45.4% |
| 35 to 39 Minutes | 167 | 16.7% |
| 40 to 44 Minutes | 55 | 5.5% |
| 45 to 59 Minutes | 128 | 12.8% |
| 60 to 89 Minutes | 49 | 4.9% |
| 90 or more Minutes | 0 | 0.0% |
Commute Time by Sex in Hope Valley
The most common commute times in Hope Valley are 30 to 34 minutes (251 commuters, 44.7%) for males and 30 to 34 minutes (202 commuters, 46.2%) for females.
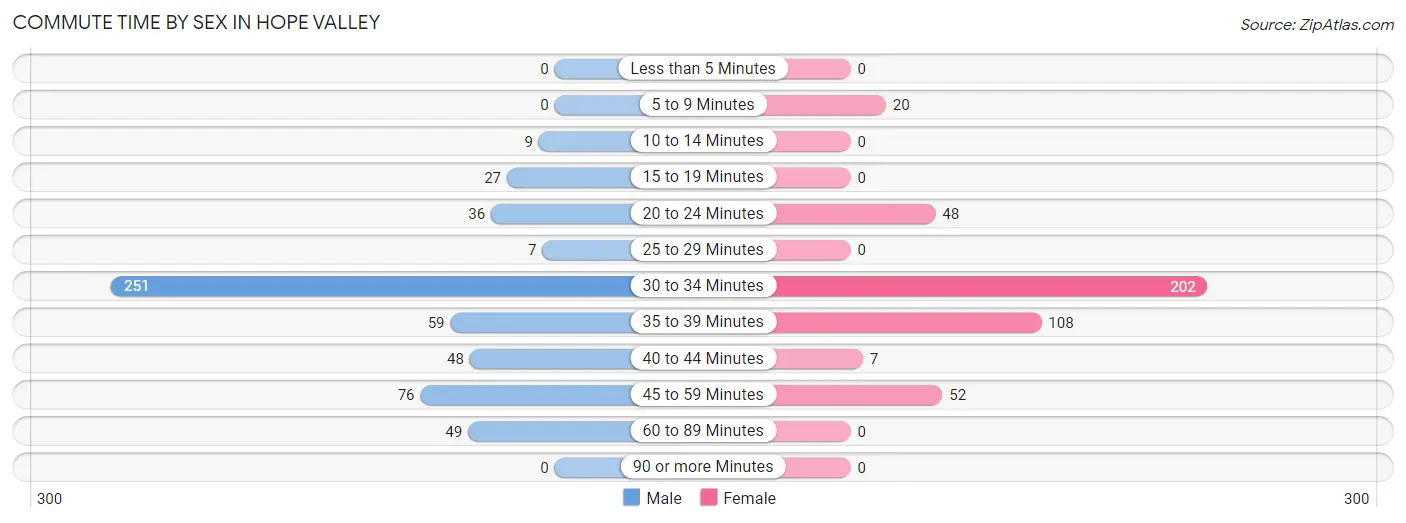
| Commute Time | Male | Female |
| Less than 5 Minutes | 0 (0.0%) | 0 (0.0%) |
| 5 to 9 Minutes | 0 (0.0%) | 20 (4.6%) |
| 10 to 14 Minutes | 9 (1.6%) | 0 (0.0%) |
| 15 to 19 Minutes | 27 (4.8%) | 0 (0.0%) |
| 20 to 24 Minutes | 36 (6.4%) | 48 (11.0%) |
| 25 to 29 Minutes | 7 (1.3%) | 0 (0.0%) |
| 30 to 34 Minutes | 251 (44.7%) | 202 (46.2%) |
| 35 to 39 Minutes | 59 (10.5%) | 108 (24.7%) |
| 40 to 44 Minutes | 48 (8.5%) | 7 (1.6%) |
| 45 to 59 Minutes | 76 (13.5%) | 52 (11.9%) |
| 60 to 89 Minutes | 49 (8.7%) | 0 (0.0%) |
| 90 or more Minutes | 0 (0.0%) | 0 (0.0%) |
Time of Departure to Work by Sex in Hope Valley
The most frequent times of departure to work in Hope Valley are 6:00 AM to 6:29 AM (224, 39.9%) for males and 8:00 AM to 8:29 AM (160, 36.6%) for females.
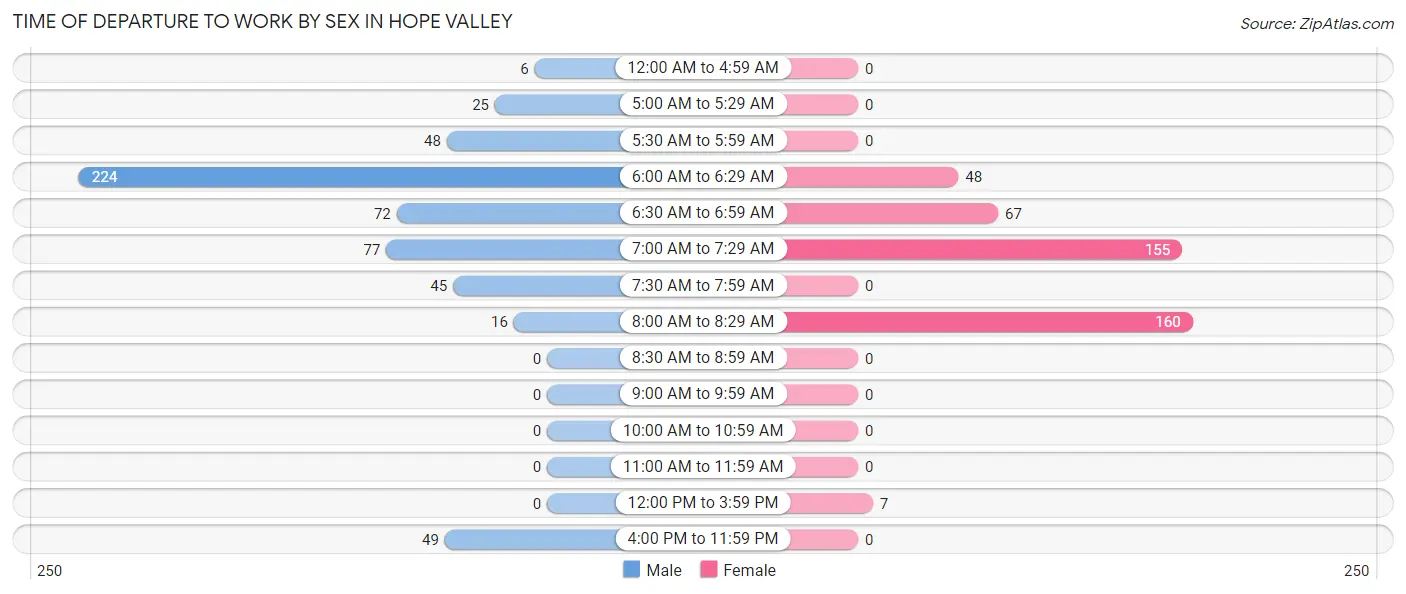
| Time of Departure | Male | Female |
| 12:00 AM to 4:59 AM | 6 (1.1%) | 0 (0.0%) |
| 5:00 AM to 5:29 AM | 25 (4.4%) | 0 (0.0%) |
| 5:30 AM to 5:59 AM | 48 (8.5%) | 0 (0.0%) |
| 6:00 AM to 6:29 AM | 224 (39.9%) | 48 (11.0%) |
| 6:30 AM to 6:59 AM | 72 (12.8%) | 67 (15.3%) |
| 7:00 AM to 7:29 AM | 77 (13.7%) | 155 (35.5%) |
| 7:30 AM to 7:59 AM | 45 (8.0%) | 0 (0.0%) |
| 8:00 AM to 8:29 AM | 16 (2.9%) | 160 (36.6%) |
| 8:30 AM to 8:59 AM | 0 (0.0%) | 0 (0.0%) |
| 9:00 AM to 9:59 AM | 0 (0.0%) | 0 (0.0%) |
| 10:00 AM to 10:59 AM | 0 (0.0%) | 0 (0.0%) |
| 11:00 AM to 11:59 AM | 0 (0.0%) | 0 (0.0%) |
| 12:00 PM to 3:59 PM | 0 (0.0%) | 7 (1.6%) |
| 4:00 PM to 11:59 PM | 49 (8.7%) | 0 (0.0%) |
| Total | 562 (100.0%) | 437 (100.0%) |
Housing Occupancy in Hope Valley
Occupancy by Ownership in Hope Valley
Of the total 705 dwellings in Hope Valley, owner-occupied units account for 533 (75.6%), while renter-occupied units make up 172 (24.4%).
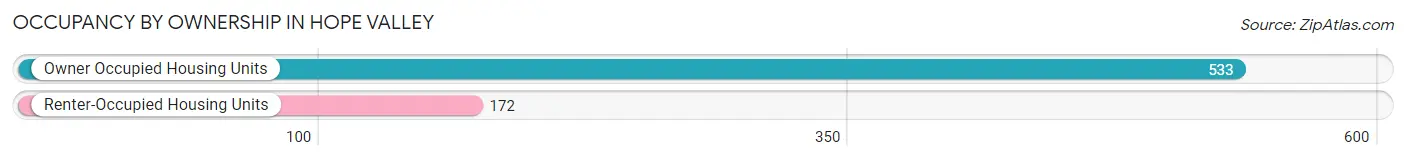
| Occupancy | # Housing Units | % Housing Units |
| Owner Occupied Housing Units | 533 | 75.6% |
| Renter-Occupied Housing Units | 172 | 24.4% |
| Total Occupied Housing Units | 705 | 100.0% |
Occupancy by Household Size in Hope Valley
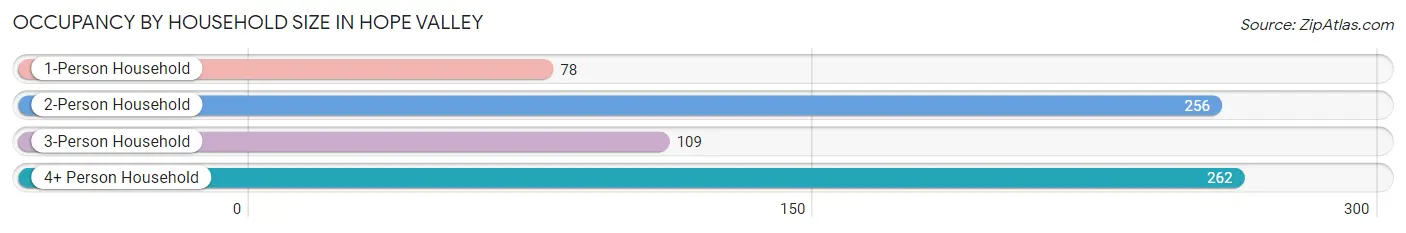
| Household Size | # Housing Units | % Housing Units |
| 1-Person Household | 78 | 11.1% |
| 2-Person Household | 256 | 36.3% |
| 3-Person Household | 109 | 15.5% |
| 4+ Person Household | 262 | 37.2% |
| Total Housing Units | 705 | 100.0% |
Occupancy by Ownership by Household Size in Hope Valley
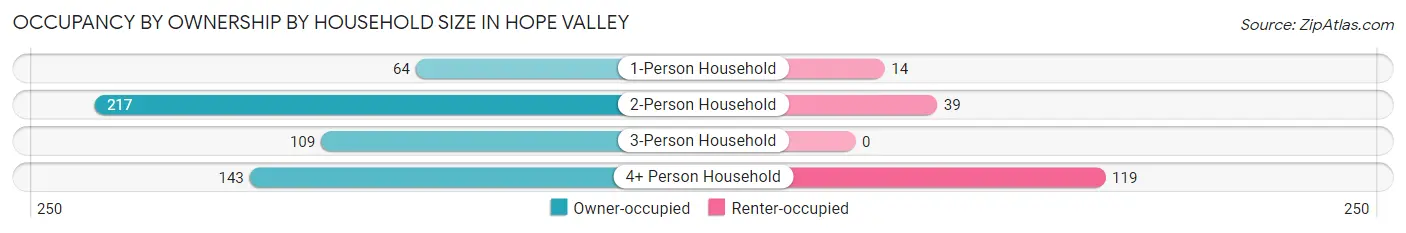
| Household Size | Owner-occupied | Renter-occupied |
| 1-Person Household | 64 (82.1%) | 14 (17.9%) |
| 2-Person Household | 217 (84.8%) | 39 (15.2%) |
| 3-Person Household | 109 (100.0%) | 0 (0.0%) |
| 4+ Person Household | 143 (54.6%) | 119 (45.4%) |
| Total Housing Units | 533 (75.6%) | 172 (24.4%) |
Occupancy by Educational Attainment in Hope Valley
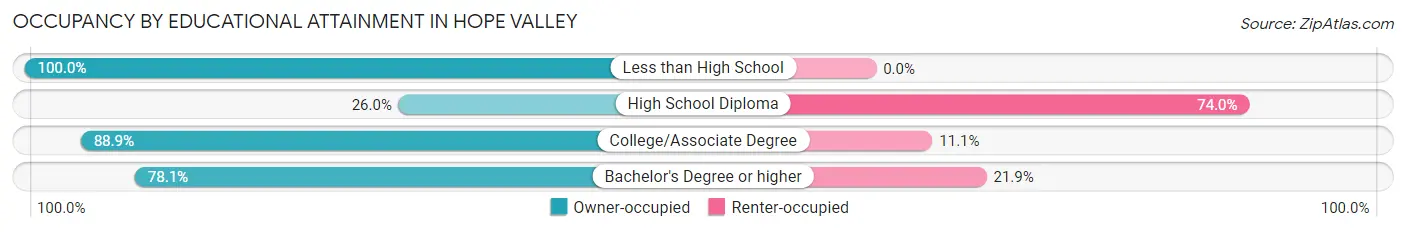
| Household Size | Owner-occupied | Renter-occupied |
| Less than High School | 9 (100.0%) | 0 (0.0%) |
| High School Diploma | 32 (26.0%) | 91 (74.0%) |
| College/Associate Degree | 367 (88.9%) | 46 (11.1%) |
| Bachelor's Degree or higher | 125 (78.1%) | 35 (21.9%) |
Occupancy by Age of Householder in Hope Valley
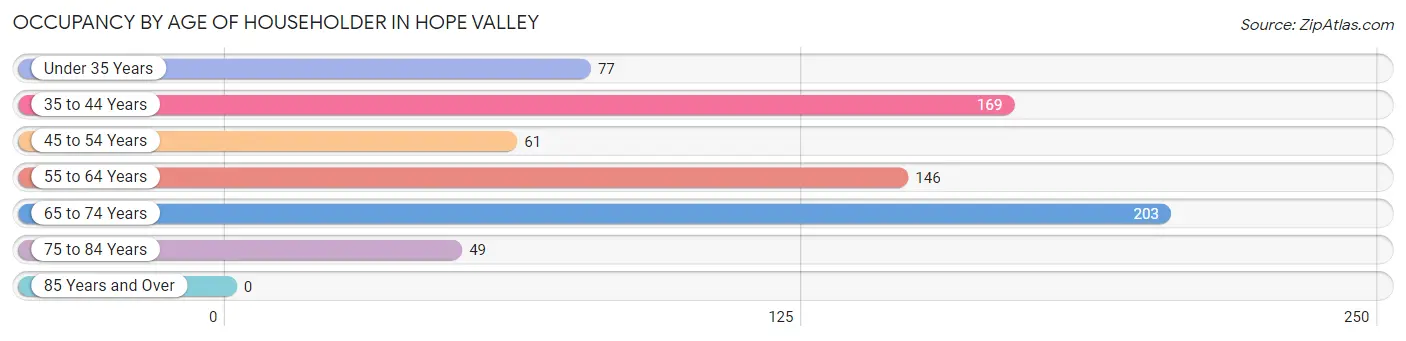
| Age Bracket | # Households | % Households |
| Under 35 Years | 77 | 10.9% |
| 35 to 44 Years | 169 | 24.0% |
| 45 to 54 Years | 61 | 8.6% |
| 55 to 64 Years | 146 | 20.7% |
| 65 to 74 Years | 203 | 28.8% |
| 75 to 84 Years | 49 | 7.0% |
| 85 Years and Over | 0 | 0.0% |
| Total | 705 | 100.0% |
Housing Finances in Hope Valley
Median Income by Occupancy in Hope Valley
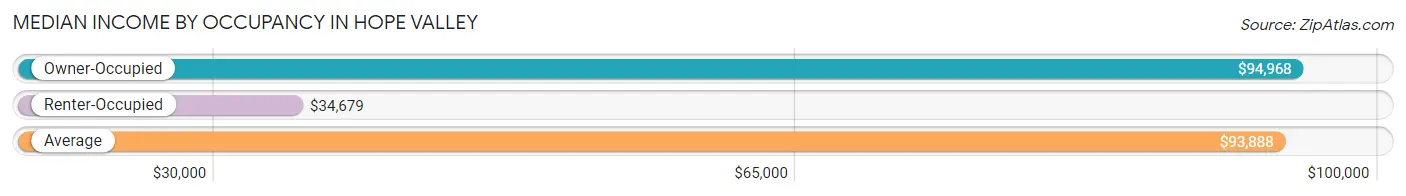
| Occupancy Type | # Households | Median Income |
| Owner-Occupied | 533 (75.6%) | $94,968 |
| Renter-Occupied | 172 (24.4%) | $34,679 |
| Average | 705 (100.0%) | $93,888 |
Occupancy by Householder Income Bracket in Hope Valley
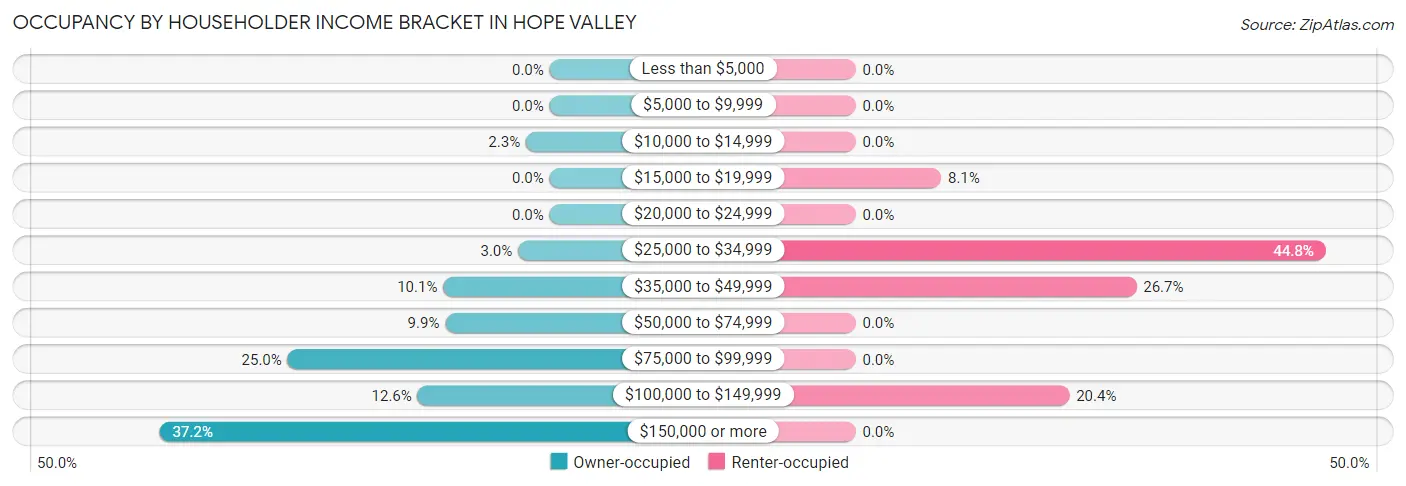
| Income Bracket | Owner-occupied | Renter-occupied |
| Less than $5,000 | 0 (0.0%) | 0 (0.0%) |
| $5,000 to $9,999 | 0 (0.0%) | 0 (0.0%) |
| $10,000 to $14,999 | 12 (2.2%) | 0 (0.0%) |
| $15,000 to $19,999 | 0 (0.0%) | 14 (8.1%) |
| $20,000 to $24,999 | 0 (0.0%) | 0 (0.0%) |
| $25,000 to $34,999 | 16 (3.0%) | 77 (44.8%) |
| $35,000 to $49,999 | 54 (10.1%) | 46 (26.7%) |
| $50,000 to $74,999 | 53 (9.9%) | 0 (0.0%) |
| $75,000 to $99,999 | 133 (24.9%) | 0 (0.0%) |
| $100,000 to $149,999 | 67 (12.6%) | 35 (20.3%) |
| $150,000 or more | 198 (37.1%) | 0 (0.0%) |
| Total | 533 (100.0%) | 172 (100.0%) |
Monthly Housing Cost Tiers in Hope Valley
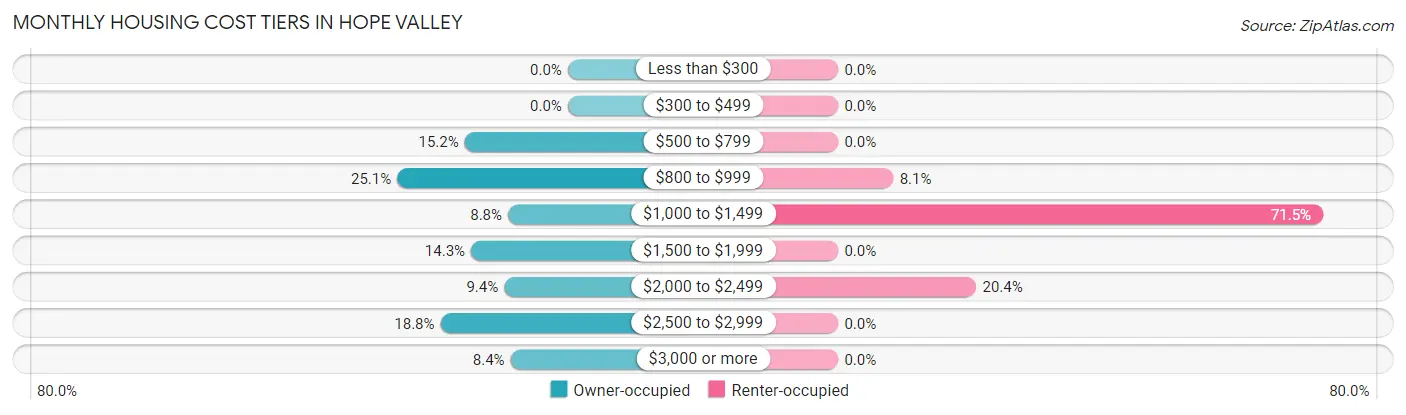
| Monthly Cost | Owner-occupied | Renter-occupied |
| Less than $300 | 0 (0.0%) | 0 (0.0%) |
| $300 to $499 | 0 (0.0%) | 0 (0.0%) |
| $500 to $799 | 81 (15.2%) | 0 (0.0%) |
| $800 to $999 | 134 (25.1%) | 14 (8.1%) |
| $1,000 to $1,499 | 47 (8.8%) | 123 (71.5%) |
| $1,500 to $1,999 | 76 (14.3%) | 0 (0.0%) |
| $2,000 to $2,499 | 50 (9.4%) | 35 (20.3%) |
| $2,500 to $2,999 | 100 (18.8%) | 0 (0.0%) |
| $3,000 or more | 45 (8.4%) | 0 (0.0%) |
| Total | 533 (100.0%) | 172 (100.0%) |
Physical Housing Characteristics in Hope Valley
Housing Structures in Hope Valley
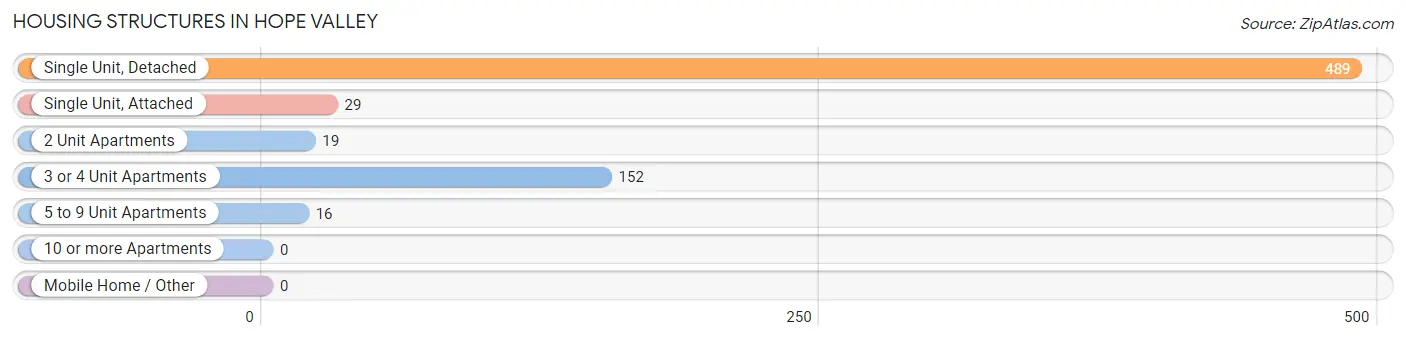
| Structure Type | # Housing Units | % Housing Units |
| Single Unit, Detached | 489 | 69.4% |
| Single Unit, Attached | 29 | 4.1% |
| 2 Unit Apartments | 19 | 2.7% |
| 3 or 4 Unit Apartments | 152 | 21.6% |
| 5 to 9 Unit Apartments | 16 | 2.3% |
| 10 or more Apartments | 0 | 0.0% |
| Mobile Home / Other | 0 | 0.0% |
| Total | 705 | 100.0% |
Housing Structures by Occupancy in Hope Valley
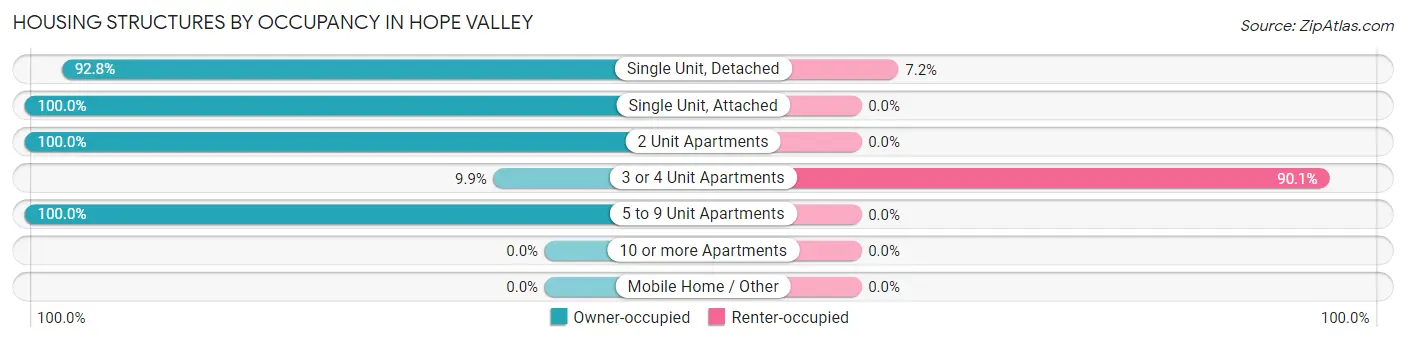
| Structure Type | Owner-occupied | Renter-occupied |
| Single Unit, Detached | 454 (92.8%) | 35 (7.2%) |
| Single Unit, Attached | 29 (100.0%) | 0 (0.0%) |
| 2 Unit Apartments | 19 (100.0%) | 0 (0.0%) |
| 3 or 4 Unit Apartments | 15 (9.9%) | 137 (90.1%) |
| 5 to 9 Unit Apartments | 16 (100.0%) | 0 (0.0%) |
| 10 or more Apartments | 0 (0.0%) | 0 (0.0%) |
| Mobile Home / Other | 0 (0.0%) | 0 (0.0%) |
| Total | 533 (75.6%) | 172 (24.4%) |
Housing Structures by Number of Rooms in Hope Valley
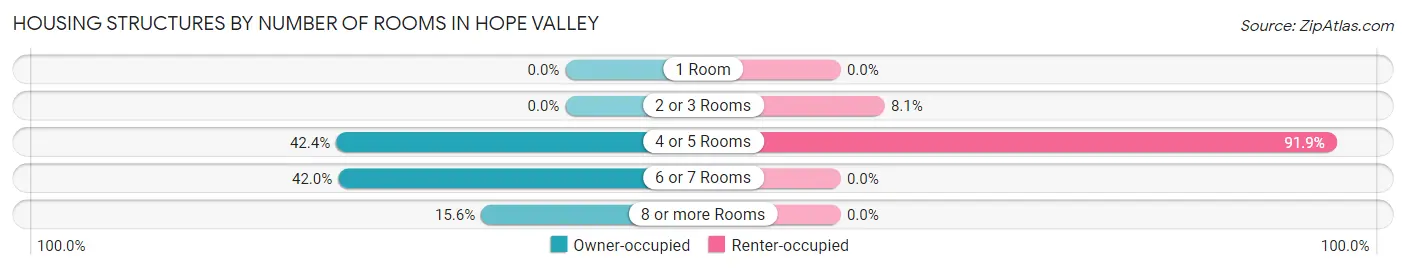
| Number of Rooms | Owner-occupied | Renter-occupied |
| 1 Room | 0 (0.0%) | 0 (0.0%) |
| 2 or 3 Rooms | 0 (0.0%) | 14 (8.1%) |
| 4 or 5 Rooms | 226 (42.4%) | 158 (91.9%) |
| 6 or 7 Rooms | 224 (42.0%) | 0 (0.0%) |
| 8 or more Rooms | 83 (15.6%) | 0 (0.0%) |
| Total | 533 (100.0%) | 172 (100.0%) |
Housing Structure by Heating Type in Hope Valley
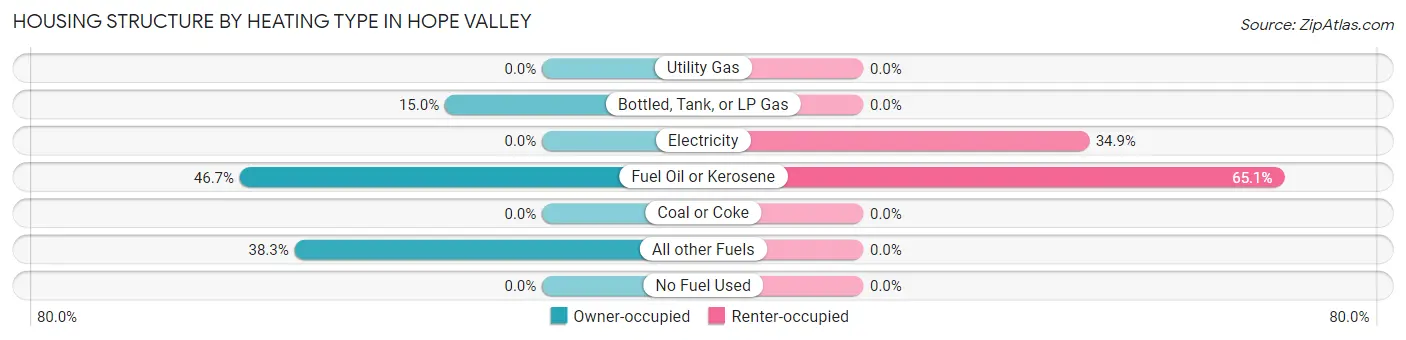
| Heating Type | Owner-occupied | Renter-occupied |
| Utility Gas | 0 (0.0%) | 0 (0.0%) |
| Bottled, Tank, or LP Gas | 80 (15.0%) | 0 (0.0%) |
| Electricity | 0 (0.0%) | 60 (34.9%) |
| Fuel Oil or Kerosene | 249 (46.7%) | 112 (65.1%) |
| Coal or Coke | 0 (0.0%) | 0 (0.0%) |
| All other Fuels | 204 (38.3%) | 0 (0.0%) |
| No Fuel Used | 0 (0.0%) | 0 (0.0%) |
| Total | 533 (100.0%) | 172 (100.0%) |
Household Vehicle Usage in Hope Valley
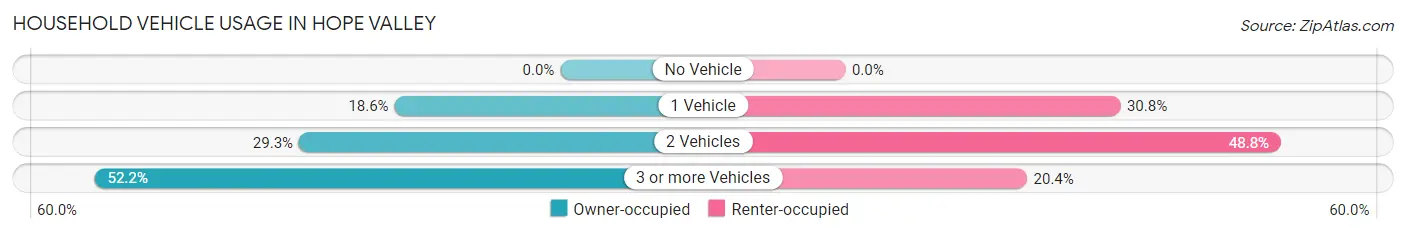
| Vehicles per Household | Owner-occupied | Renter-occupied |
| No Vehicle | 0 (0.0%) | 0 (0.0%) |
| 1 Vehicle | 99 (18.6%) | 53 (30.8%) |
| 2 Vehicles | 156 (29.3%) | 84 (48.8%) |
| 3 or more Vehicles | 278 (52.2%) | 35 (20.3%) |
| Total | 533 (100.0%) | 172 (100.0%) |
Real Estate & Mortgages in Hope Valley
Real Estate and Mortgage Overview in Hope Valley
| Characteristic | Without Mortgage | With Mortgage |
| Housing Units | 224 | 309 |
| Median Property Value | $453,200 | $407,000 |
| Median Household Income | - | - |
| Monthly Housing Costs | $930 | $45 |
| Real Estate Taxes | $6,293 | $0 |
Property Value by Mortgage Status in Hope Valley
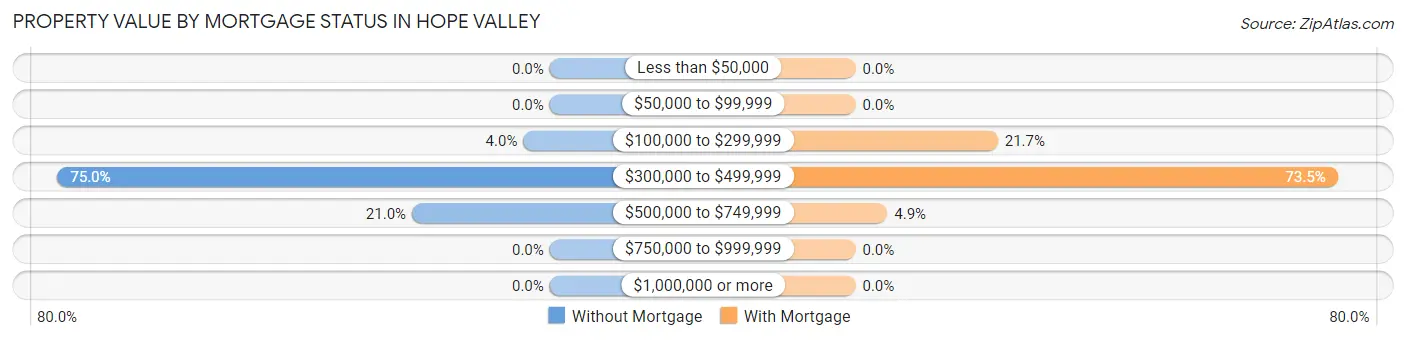
| Property Value | Without Mortgage | With Mortgage |
| Less than $50,000 | 0 (0.0%) | 0 (0.0%) |
| $50,000 to $99,999 | 0 (0.0%) | 0 (0.0%) |
| $100,000 to $299,999 | 9 (4.0%) | 67 (21.7%) |
| $300,000 to $499,999 | 168 (75.0%) | 227 (73.5%) |
| $500,000 to $749,999 | 47 (21.0%) | 15 (4.9%) |
| $750,000 to $999,999 | 0 (0.0%) | 0 (0.0%) |
| $1,000,000 or more | 0 (0.0%) | 0 (0.0%) |
| Total | 224 (100.0%) | 309 (100.0%) |
Household Income by Mortgage Status in Hope Valley
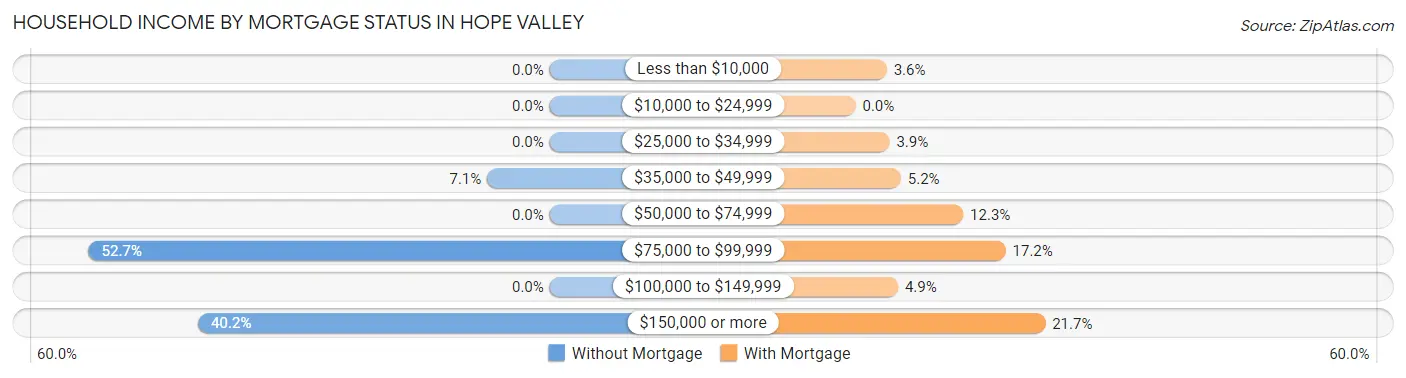
| Household Income | Without Mortgage | With Mortgage |
| Less than $10,000 | 0 (0.0%) | 11 (3.6%) |
| $10,000 to $24,999 | 0 (0.0%) | 0 (0.0%) |
| $25,000 to $34,999 | 0 (0.0%) | 12 (3.9%) |
| $35,000 to $49,999 | 16 (7.1%) | 16 (5.2%) |
| $50,000 to $74,999 | 0 (0.0%) | 38 (12.3%) |
| $75,000 to $99,999 | 118 (52.7%) | 53 (17.2%) |
| $100,000 to $149,999 | 0 (0.0%) | 15 (4.9%) |
| $150,000 or more | 90 (40.2%) | 67 (21.7%) |
| Total | 224 (100.0%) | 309 (100.0%) |
Property Value to Household Income Ratio in Hope Valley
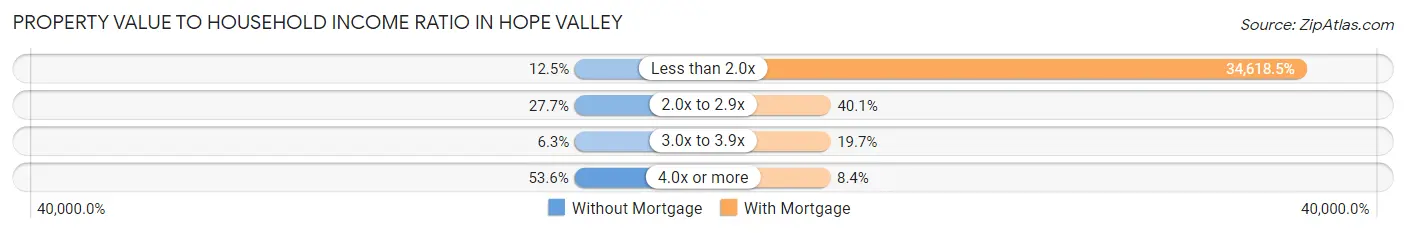
| Value-to-Income Ratio | Without Mortgage | With Mortgage |
| Less than 2.0x | 28 (12.5%) | 106,971 (34,618.5%) |
| 2.0x to 2.9x | 62 (27.7%) | 124 (40.1%) |
| 3.0x to 3.9x | 14 (6.2%) | 61 (19.7%) |
| 4.0x or more | 120 (53.6%) | 26 (8.4%) |
| Total | 224 (100.0%) | 309 (100.0%) |
Real Estate Taxes by Mortgage Status in Hope Valley
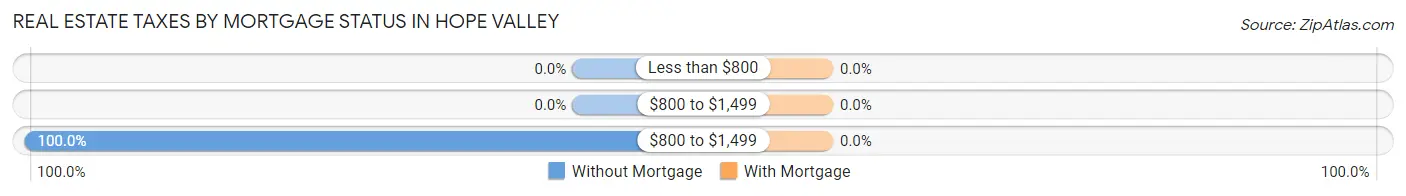
| Property Taxes | Without Mortgage | With Mortgage |
| Less than $800 | 0 (0.0%) | 0 (0.0%) |
| $800 to $1,499 | 0 (0.0%) | 0 (0.0%) |
| $800 to $1,499 | 224 (100.0%) | 0 (0.0%) |
| Total | 224 (100.0%) | 309 (100.0%) |
Health & Disability in Hope Valley
Health Insurance Coverage by Age in Hope Valley
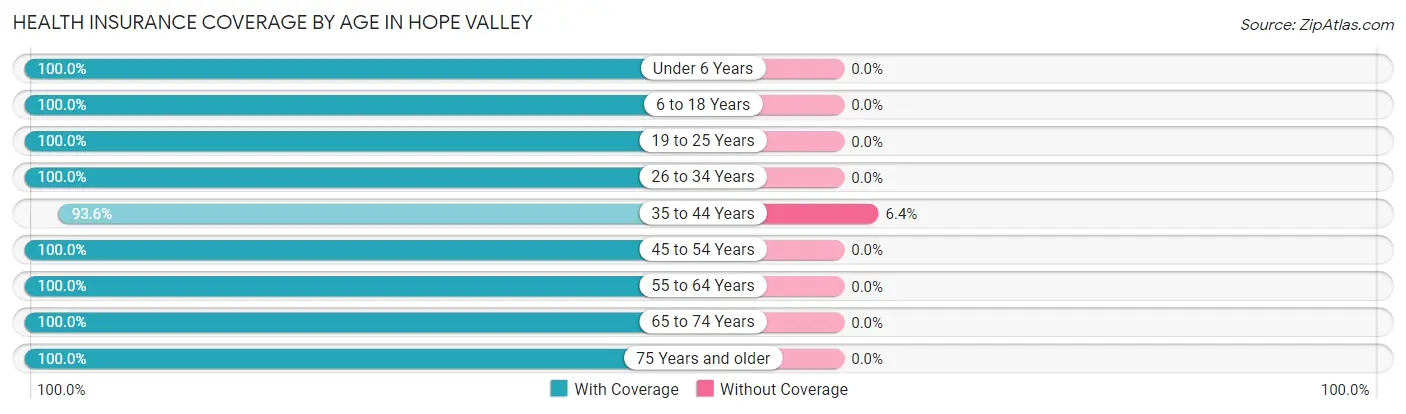
| Age Bracket | With Coverage | Without Coverage |
| Under 6 Years | 214 (100.0%) | 0 (0.0%) |
| 6 to 18 Years | 370 (100.0%) | 0 (0.0%) |
| 19 to 25 Years | 154 (100.0%) | 0 (0.0%) |
| 26 to 34 Years | 151 (100.0%) | 0 (0.0%) |
| 35 to 44 Years | 381 (93.6%) | 26 (6.4%) |
| 45 to 54 Years | 90 (100.0%) | 0 (0.0%) |
| 55 to 64 Years | 440 (100.0%) | 0 (0.0%) |
| 65 to 74 Years | 277 (100.0%) | 0 (0.0%) |
| 75 Years and older | 77 (100.0%) | 0 (0.0%) |
| Total | 2,154 (98.8%) | 26 (1.2%) |
Health Insurance Coverage by Citizenship Status in Hope Valley
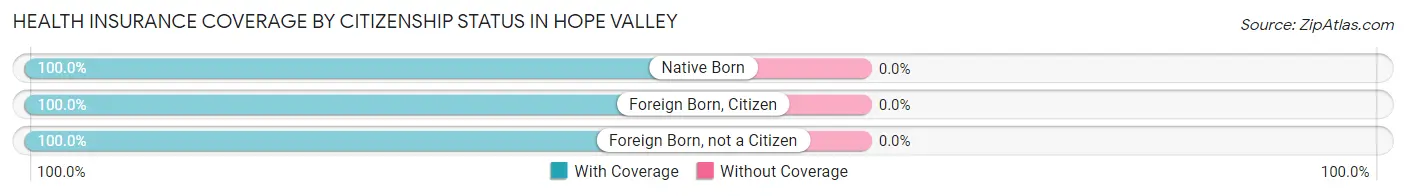
| Citizenship Status | With Coverage | Without Coverage |
| Native Born | 214 (100.0%) | 0 (0.0%) |
| Foreign Born, Citizen | 370 (100.0%) | 0 (0.0%) |
| Foreign Born, not a Citizen | 154 (100.0%) | 0 (0.0%) |
Health Insurance Coverage by Household Income in Hope Valley
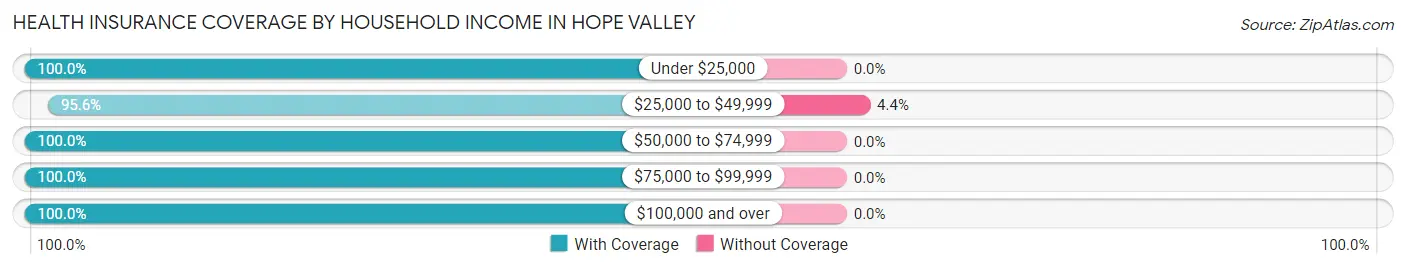
| Household Income | With Coverage | Without Coverage |
| Under $25,000 | 26 (100.0%) | 0 (0.0%) |
| $25,000 to $49,999 | 568 (95.6%) | 26 (4.4%) |
| $50,000 to $74,999 | 70 (100.0%) | 0 (0.0%) |
| $75,000 to $99,999 | 290 (100.0%) | 0 (0.0%) |
| $100,000 and over | 1,196 (100.0%) | 0 (0.0%) |
Public vs Private Health Insurance Coverage by Age in Hope Valley
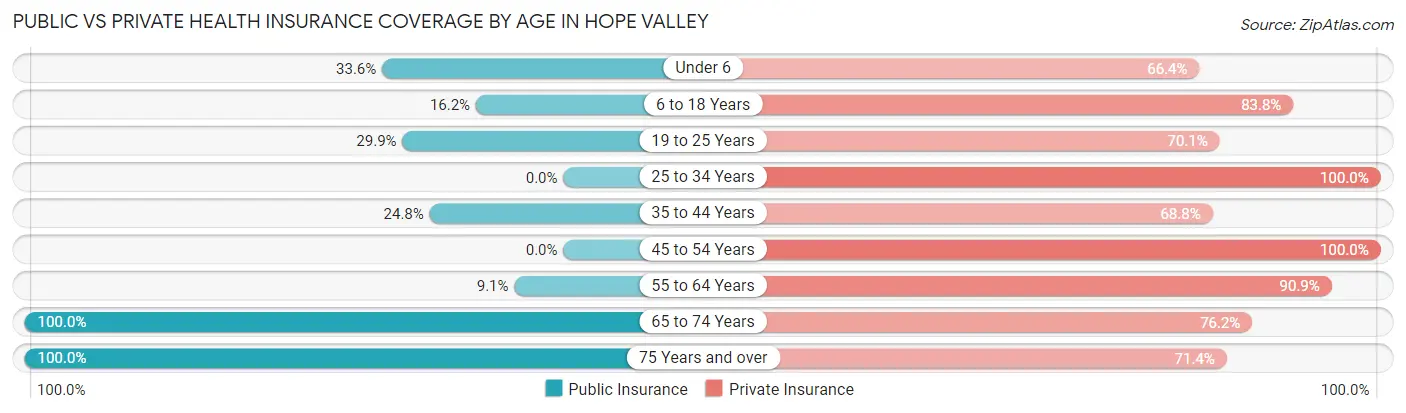
| Age Bracket | Public Insurance | Private Insurance |
| Under 6 | 72 (33.6%) | 142 (66.4%) |
| 6 to 18 Years | 60 (16.2%) | 310 (83.8%) |
| 19 to 25 Years | 46 (29.9%) | 108 (70.1%) |
| 25 to 34 Years | 0 (0.0%) | 151 (100.0%) |
| 35 to 44 Years | 101 (24.8%) | 280 (68.8%) |
| 45 to 54 Years | 0 (0.0%) | 90 (100.0%) |
| 55 to 64 Years | 40 (9.1%) | 400 (90.9%) |
| 65 to 74 Years | 277 (100.0%) | 211 (76.2%) |
| 75 Years and over | 77 (100.0%) | 55 (71.4%) |
| Total | 673 (30.9%) | 1,747 (80.1%) |
Disability Status by Sex by Age in Hope Valley
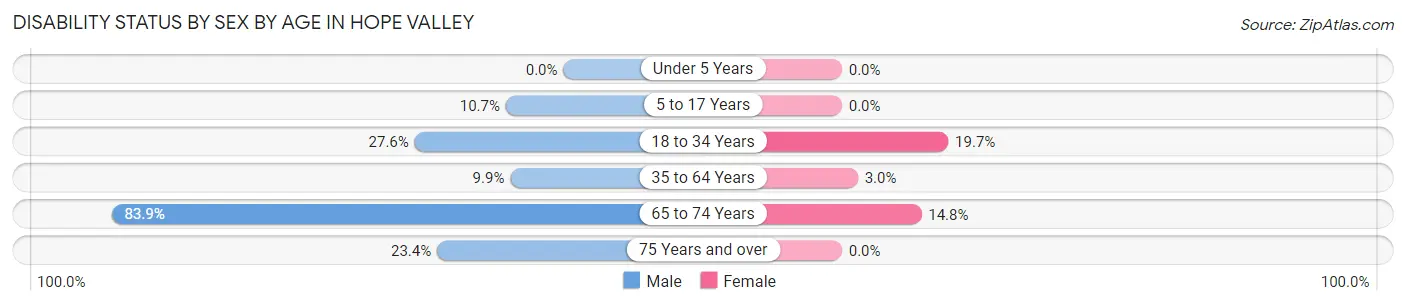
| Age Bracket | Male | Female |
| Under 5 Years | 0 (0.0%) | 0 (0.0%) |
| 5 to 17 Years | 28 (10.7%) | 0 (0.0%) |
| 18 to 34 Years | 45 (27.6%) | 46 (19.7%) |
| 35 to 64 Years | 49 (9.9%) | 13 (2.9%) |
| 65 to 74 Years | 130 (83.9%) | 18 (14.7%) |
| 75 Years and over | 15 (23.4%) | 0 (0.0%) |
Disability Class by Sex by Age in Hope Valley
Disability Class: Hearing Difficulty
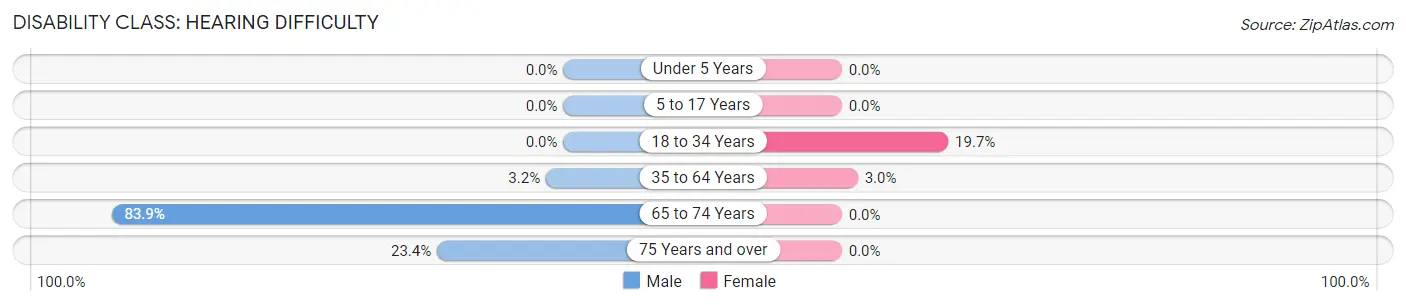
| Age Bracket | Male | Female |
| Under 5 Years | 0 (0.0%) | 0 (0.0%) |
| 5 to 17 Years | 0 (0.0%) | 0 (0.0%) |
| 18 to 34 Years | 0 (0.0%) | 46 (19.7%) |
| 35 to 64 Years | 16 (3.2%) | 13 (2.9%) |
| 65 to 74 Years | 130 (83.9%) | 0 (0.0%) |
| 75 Years and over | 15 (23.4%) | 0 (0.0%) |
Disability Class: Vision Difficulty
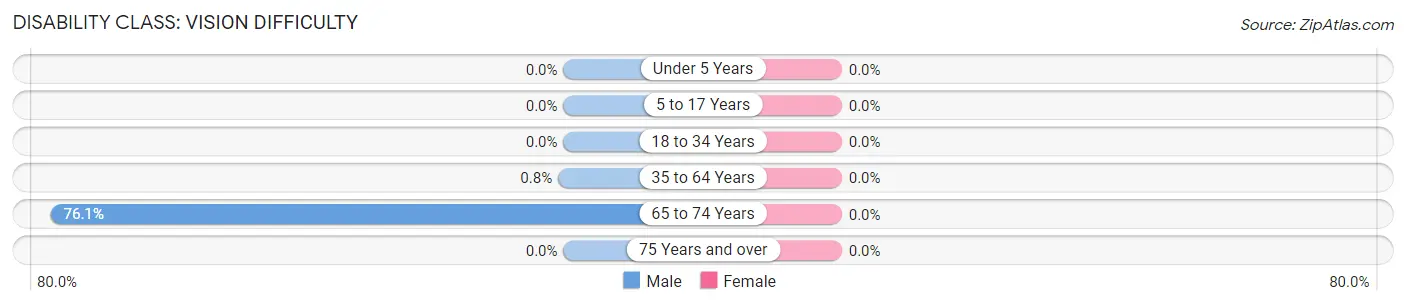
| Age Bracket | Male | Female |
| Under 5 Years | 0 (0.0%) | 0 (0.0%) |
| 5 to 17 Years | 0 (0.0%) | 0 (0.0%) |
| 18 to 34 Years | 0 (0.0%) | 0 (0.0%) |
| 35 to 64 Years | 4 (0.8%) | 0 (0.0%) |
| 65 to 74 Years | 118 (76.1%) | 0 (0.0%) |
| 75 Years and over | 0 (0.0%) | 0 (0.0%) |
Disability Class: Cognitive Difficulty
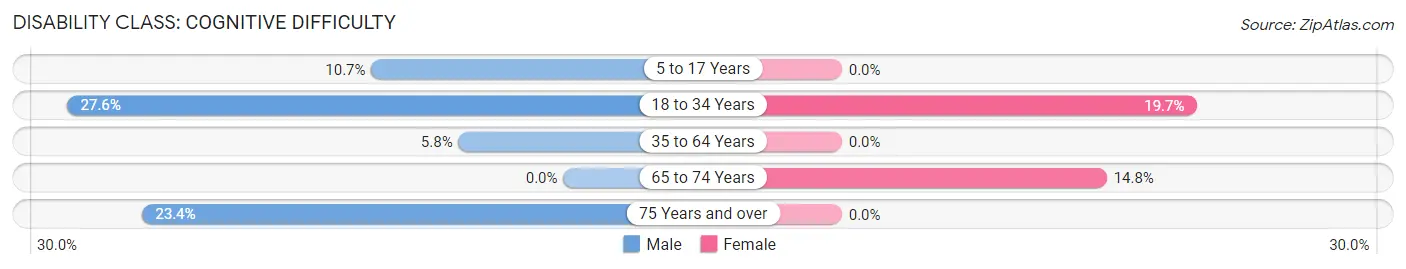
| Age Bracket | Male | Female |
| 5 to 17 Years | 28 (10.7%) | 0 (0.0%) |
| 18 to 34 Years | 45 (27.6%) | 46 (19.7%) |
| 35 to 64 Years | 29 (5.8%) | 0 (0.0%) |
| 65 to 74 Years | 0 (0.0%) | 18 (14.7%) |
| 75 Years and over | 15 (23.4%) | 0 (0.0%) |
Disability Class: Ambulatory Difficulty
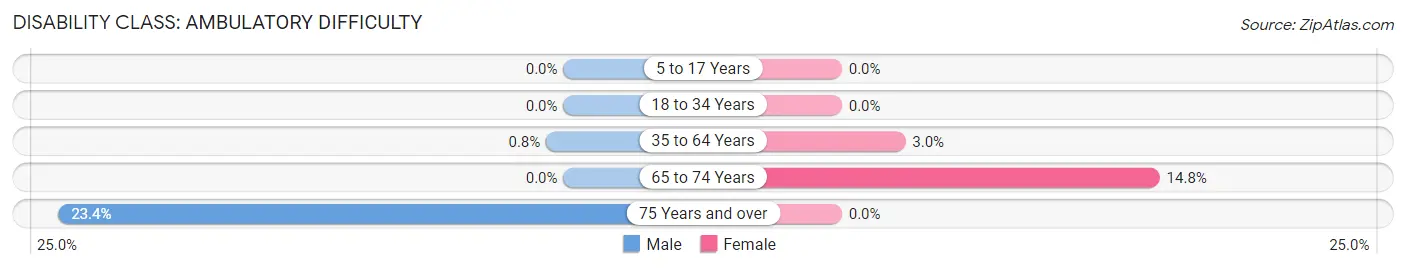
| Age Bracket | Male | Female |
| 5 to 17 Years | 0 (0.0%) | 0 (0.0%) |
| 18 to 34 Years | 0 (0.0%) | 0 (0.0%) |
| 35 to 64 Years | 4 (0.8%) | 13 (2.9%) |
| 65 to 74 Years | 0 (0.0%) | 18 (14.7%) |
| 75 Years and over | 15 (23.4%) | 0 (0.0%) |
Disability Class: Self-Care Difficulty
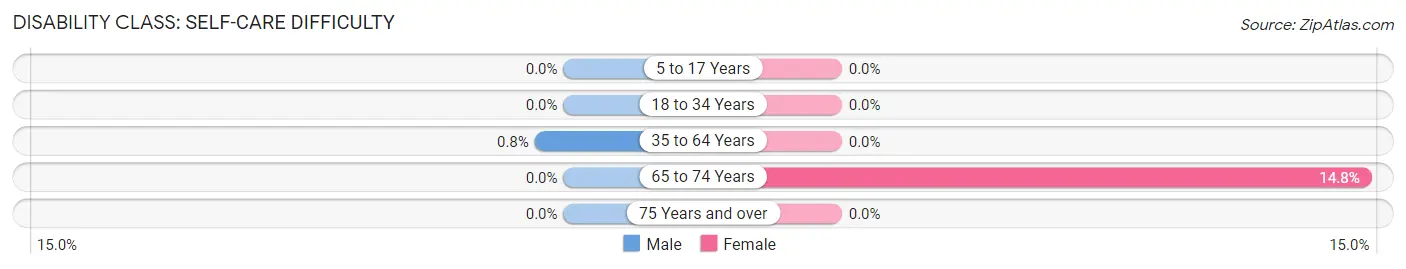
| Age Bracket | Male | Female |
| 5 to 17 Years | 0 (0.0%) | 0 (0.0%) |
| 18 to 34 Years | 0 (0.0%) | 0 (0.0%) |
| 35 to 64 Years | 4 (0.8%) | 0 (0.0%) |
| 65 to 74 Years | 0 (0.0%) | 18 (14.7%) |
| 75 Years and over | 0 (0.0%) | 0 (0.0%) |
Technology Access in Hope Valley
Computing Device Access in Hope Valley
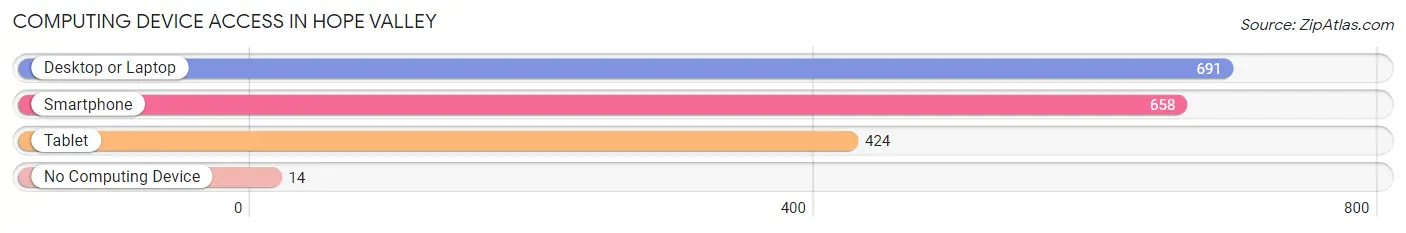
| Device Type | # Households | % Households |
| Desktop or Laptop | 691 | 98.0% |
| Smartphone | 658 | 93.3% |
| Tablet | 424 | 60.1% |
| No Computing Device | 14 | 2.0% |
| Total | 705 | 100.0% |
Internet Access in Hope Valley
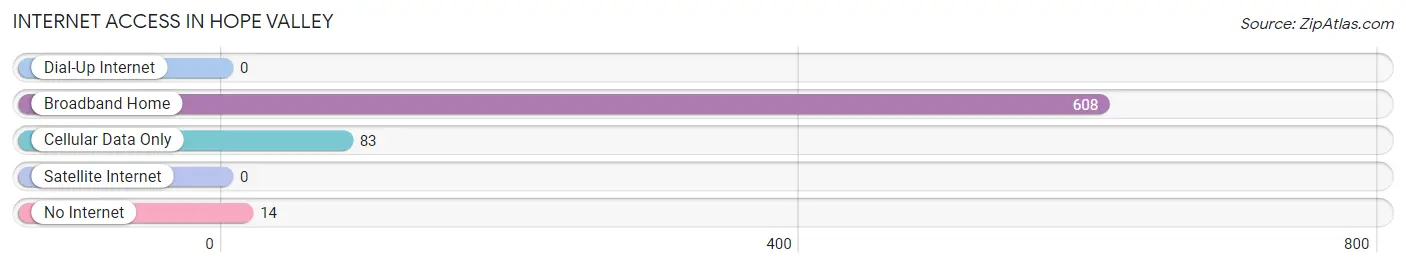
| Internet Type | # Households | % Households |
| Dial-Up Internet | 0 | 0.0% |
| Broadband Home | 608 | 86.2% |
| Cellular Data Only | 83 | 11.8% |
| Satellite Internet | 0 | 0.0% |
| No Internet | 14 | 2.0% |
| Total | 705 | 100.0% |
Hope Valley Summary
Hope Valley is a small town located in the southwestern corner of Rhode Island. It is bordered by the towns of Charlestown, Richmond, Exeter, and Westerly. The town has a population of approximately 4,000 people and covers an area of about 10 square miles.
History
Hope Valley was first settled in 1661 by a group of English settlers from Massachusetts. The town was originally known as “Little Rest” and was part of the larger town of Westerly. In 1730, the town was officially incorporated and renamed “Hope Valley”. The name was chosen to reflect the settlers’ hope for a better life in the new settlement.
The town was primarily an agricultural community for much of its history. In the 19th century, the town was home to several mills, including a cotton mill, a woolen mill, and a paper mill. These mills provided employment for many of the town’s residents.
In the late 19th century, the town began to develop as a tourist destination. The town was home to several summer resorts, including the Hope Valley Inn, which was built in 1891. The inn was a popular destination for wealthy families from New York and Boston.
Geography
Hope Valley is located in the southwestern corner of Rhode Island. It is bordered by the towns of Charlestown, Richmond, Exeter, and Westerly. The town is situated in a valley between two hills, which gives it its name. The town is located in the Narragansett Bay watershed and is home to several rivers and streams, including the Pawcatuck River, the Wood River, and the Shunock River.
The town is mostly rural, with a few small villages scattered throughout. The largest village is Hope Valley, which is located in the center of the town. Other villages include Shunock, Wood River Junction, and Richmond.
Economy
Hope Valley’s economy is primarily based on tourism and agriculture. The town is home to several summer resorts, including the Hope Valley Inn, which attracts visitors from all over the region. The town is also home to several farms, which produce a variety of crops, including corn, potatoes, and hay.
The town is also home to several small businesses, including restaurants, retail stores, and service providers. The town is also home to several manufacturing companies, including a paper mill and a plastics factory.
Demographics
As of the 2010 census, the population of Hope Valley was 4,068. The racial makeup of the town was 94.3% White, 1.2% African American, 0.4% Native American, 0.7% Asian, 0.1% Pacific Islander, 1.2% from other races, and 2.1% from two or more races. Hispanic or Latino of any race were 3.2% of the population.
The median household income in Hope Valley was $50,938, and the median family income was $60,938. The per capita income for the town was $25,938. About 8.2% of families and 10.2% of the population were below the poverty line, including 14.2% of those under age 18 and 5.2% of those age 65 or over.
Common Questions
What is Per Capita Income in Hope Valley?
Per Capita income in Hope Valley is $37,786.
What is the Median Family Income in Hope Valley?
Median Family Income in Hope Valley is $94,883.
What is the Median Household income in Hope Valley?
Median Household Income in Hope Valley is $93,888.
What is Income or Wage Gap in Hope Valley?
Income or Wage Gap in Hope Valley is 61.1%.
Women in Hope Valley earn 38.9 cents for every dollar earned by a man.
What is Inequality or Gini Index in Hope Valley?
Inequality or Gini Index in Hope Valley is 0.38.
What is the Total Population of Hope Valley?
Total Population of Hope Valley is 2,209.
What is the Total Male Population of Hope Valley?
Total Male Population of Hope Valley is 1,202.
What is the Total Female Population of Hope Valley?
Total Female Population of Hope Valley is 1,007.
What is the Ratio of Males per 100 Females in Hope Valley?
There are 119.36 Males per 100 Females in Hope Valley.
What is the Ratio of Females per 100 Males in Hope Valley?
There are 83.78 Females per 100 Males in Hope Valley.
What is the Median Population Age in Hope Valley?
Median Population Age in Hope Valley is 39.5 Years.
What is the Average Family Size in Hope Valley
Average Family Size in Hope Valley is 3.2 People.
What is the Average Household Size in Hope Valley
Average Household Size in Hope Valley is 3.1 People.
How Large is the Labor Force in Hope Valley?
There are 1,181 People in the Labor Forcein in Hope Valley.
What is the Percentage of People in the Labor Force in Hope Valley?
68.8% of People are in the Labor Force in Hope Valley.
What is the Unemployment Rate in Hope Valley?
Unemployment Rate in Hope Valley is 8.4%.