Westerly, RI Map & Demographics
Westerly Map
Westerly Overview
$46,503
PER CAPITA INCOME
$108,682
AVG FAMILY INCOME
$86,343
AVG HOUSEHOLD INCOME
22.8%
WAGE / INCOME GAP [ % ]
77.2¢/ $1
WAGE / INCOME GAP [ $ ]
0.39
INEQUALITY / GINI INDEX
18,272
TOTAL POPULATION
9,346
MALE POPULATION
8,926
FEMALE POPULATION
104.71
MALES / 100 FEMALES
95.51
FEMALES / 100 MALES
50.6
MEDIAN AGE
2.8
AVG FAMILY SIZE
2.2
AVG HOUSEHOLD SIZE
10,358
LABOR FORCE [ PEOPLE ]
64.6%
PERCENT IN LABOR FORCE
6.5%
UNEMPLOYMENT RATE
Westerly Zip Codes
Westerly Area Codes
Income in Westerly
Income Overview in Westerly
Per Capita Income in Westerly is $46,503, while median incomes of families and households are $108,682 and $86,343 respectively.
| Characteristic | Number | Measure |
| Per Capita Income | 18,272 | $46,503 |
| Median Family Income | 5,116 | $108,682 |
| Mean Family Income | 5,116 | $123,576 |
| Median Household Income | 8,222 | $86,343 |
| Mean Household Income | 8,222 | $102,118 |
| Income Deficit | 5,116 | $0 |
| Wage / Income Gap (%) | 18,272 | 22.76% |
| Wage / Income Gap ($) | 18,272 | 77.24¢ per $1 |
| Gini / Inequality Index | 18,272 | 0.39 |
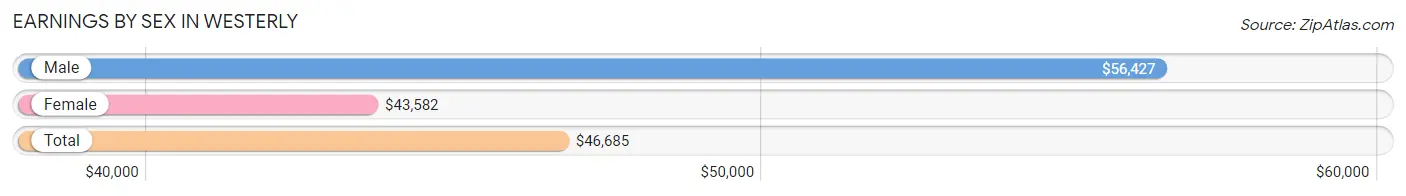
Earnings by Sex in Westerly
Average Earnings in Westerly are $46,685, $56,427 for men and $43,582 for women, a difference of 22.8%.
| Sex | Number | Average Earnings |
| Male | 5,971 (55.8%) | $56,427 |
| Female | 4,729 (44.2%) | $43,582 |
| Total | 10,700 (100.0%) | $46,685 |
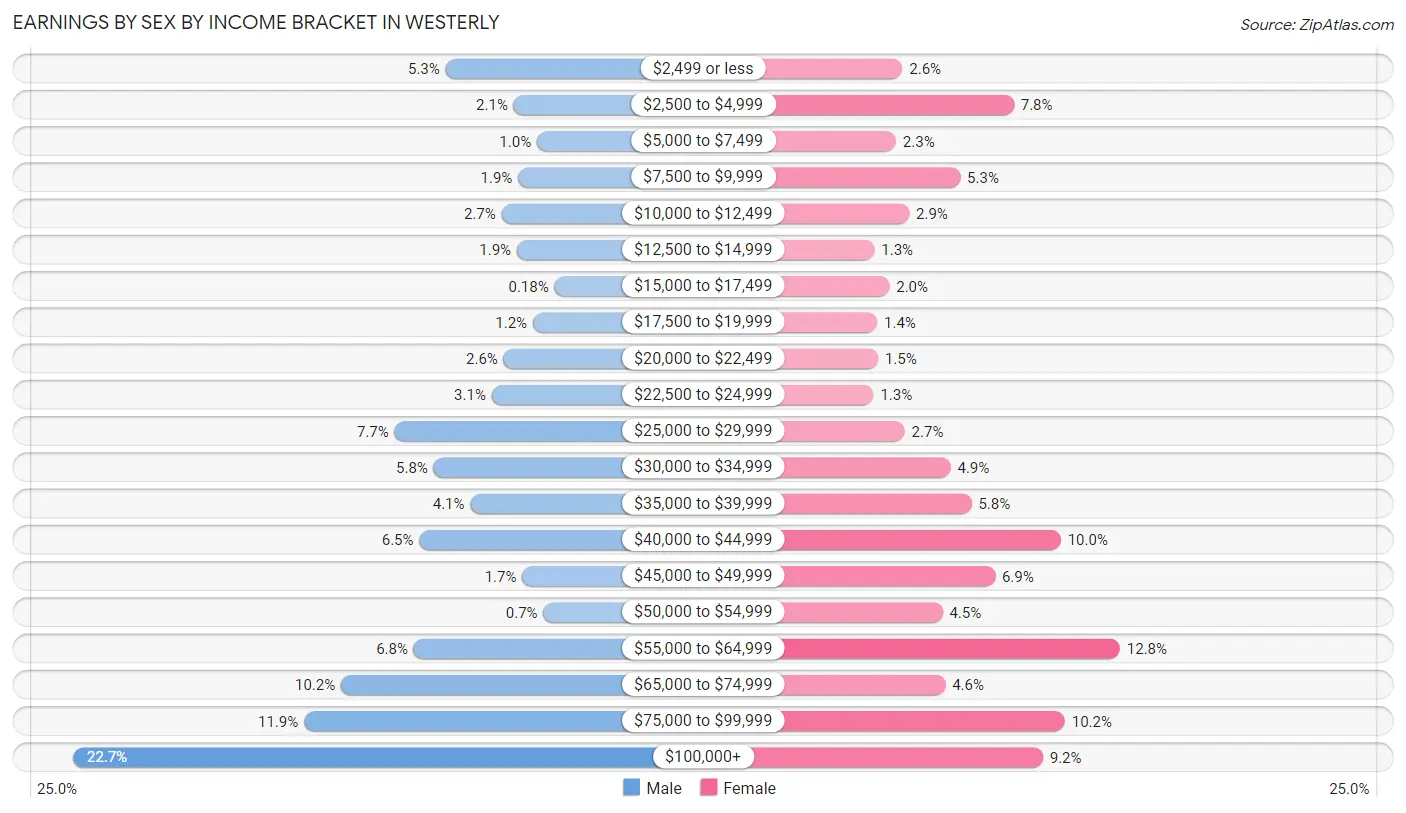
Earnings by Sex by Income Bracket in Westerly
The most common earnings brackets in Westerly are $100,000+ for men (1,355 | 22.7%) and $55,000 to $64,999 for women (605 | 12.8%).
| Income | Male | Female |
| $2,499 or less | 315 (5.3%) | 123 (2.6%) |
| $2,500 to $4,999 | 125 (2.1%) | 370 (7.8%) |
| $5,000 to $7,499 | 60 (1.0%) | 109 (2.3%) |
| $7,500 to $9,999 | 112 (1.9%) | 251 (5.3%) |
| $10,000 to $12,499 | 159 (2.7%) | 138 (2.9%) |
| $12,500 to $14,999 | 116 (1.9%) | 61 (1.3%) |
| $15,000 to $17,499 | 11 (0.2%) | 94 (2.0%) |
| $17,500 to $19,999 | 71 (1.2%) | 67 (1.4%) |
| $20,000 to $22,499 | 153 (2.6%) | 69 (1.5%) |
| $22,500 to $24,999 | 186 (3.1%) | 59 (1.3%) |
| $25,000 to $29,999 | 458 (7.7%) | 128 (2.7%) |
| $30,000 to $34,999 | 349 (5.8%) | 230 (4.9%) |
| $35,000 to $39,999 | 246 (4.1%) | 276 (5.8%) |
| $40,000 to $44,999 | 389 (6.5%) | 474 (10.0%) |
| $45,000 to $49,999 | 101 (1.7%) | 328 (6.9%) |
| $50,000 to $54,999 | 42 (0.7%) | 212 (4.5%) |
| $55,000 to $64,999 | 404 (6.8%) | 605 (12.8%) |
| $65,000 to $74,999 | 608 (10.2%) | 218 (4.6%) |
| $75,000 to $99,999 | 711 (11.9%) | 483 (10.2%) |
| $100,000+ | 1,355 (22.7%) | 434 (9.2%) |
| Total | 5,971 (100.0%) | 4,729 (100.0%) |
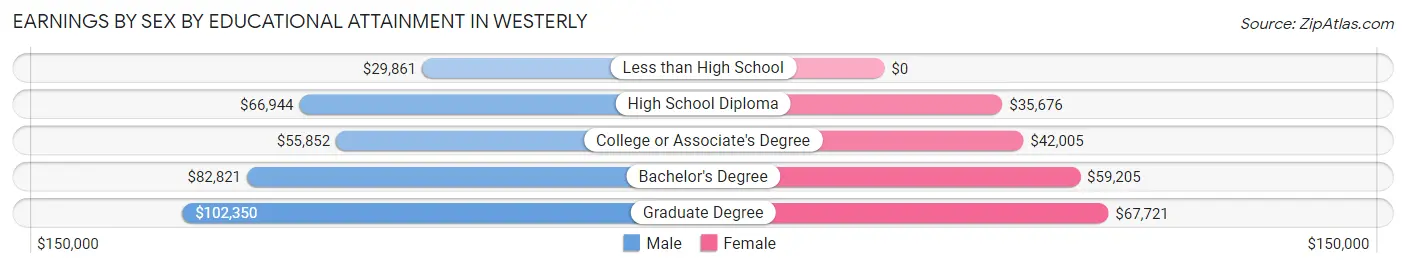
Earnings by Sex by Educational Attainment in Westerly
Average earnings in Westerly are $67,745 for men and $46,768 for women, a difference of 31.0%. Men with an educational attainment of graduate degree enjoy the highest average annual earnings of $102,350, while those with less than high school education earn the least with $29,861. Women with an educational attainment of graduate degree earn the most with the average annual earnings of $67,721, while those with high school diploma education have the smallest earnings of $35,676.
| Educational Attainment | Male Income | Female Income |
| Less than High School | $29,861 | $0 |
| High School Diploma | $66,944 | $35,676 |
| College or Associate's Degree | $55,852 | $42,005 |
| Bachelor's Degree | $82,821 | $59,205 |
| Graduate Degree | $102,350 | $67,721 |
| Total | $67,745 | $46,768 |
Family Income in Westerly
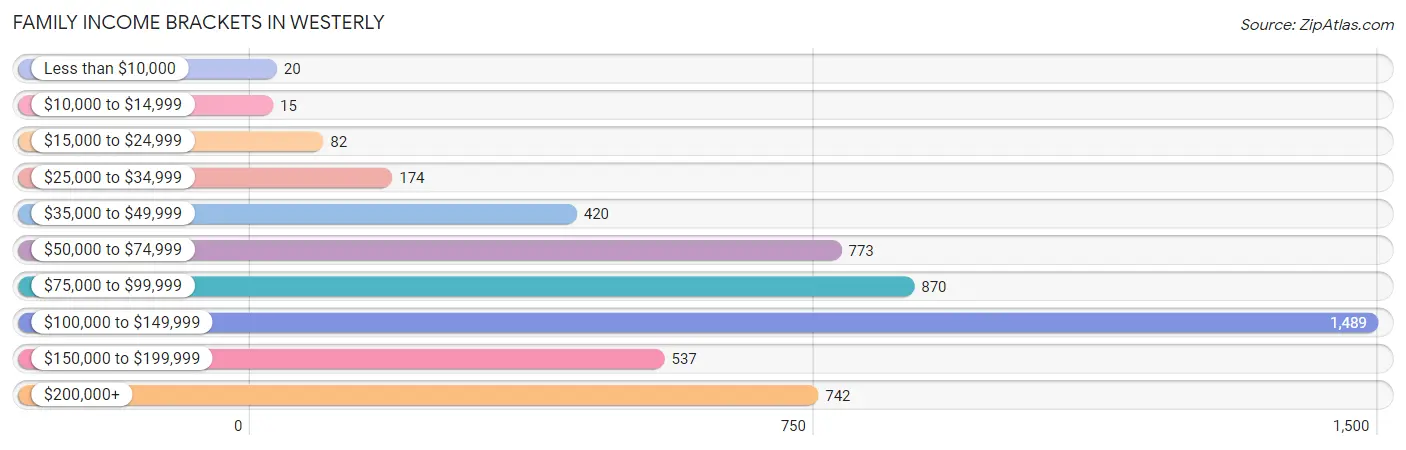
Family Income Brackets in Westerly
According to the Westerly family income data, there are 1,489 families falling into the $100,000 to $149,999 income range, which is the most common income bracket and makes up 29.1% of all families. Conversely, the $10,000 to $14,999 income bracket is the least frequent group with only 15 families (0.3%) belonging to this category.
| Income Bracket | # Families | % Families |
| Less than $10,000 | 20 | 0.4% |
| $10,000 to $14,999 | 15 | 0.3% |
| $15,000 to $24,999 | 82 | 1.6% |
| $25,000 to $34,999 | 174 | 3.4% |
| $35,000 to $49,999 | 420 | 8.2% |
| $50,000 to $74,999 | 773 | 15.1% |
| $75,000 to $99,999 | 870 | 17.0% |
| $100,000 to $149,999 | 1,489 | 29.1% |
| $150,000 to $199,999 | 537 | 10.5% |
| $200,000+ | 742 | 14.5% |
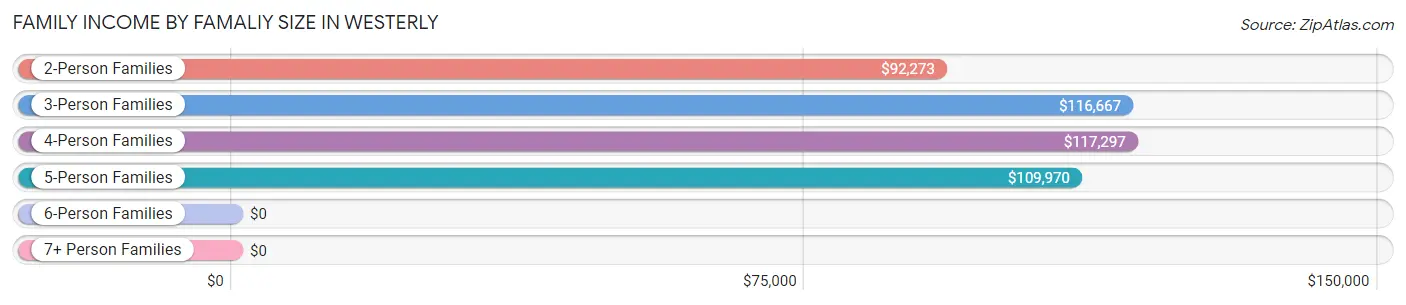
Family Income by Famaliy Size in Westerly
4-person families (913 | 17.8%) account for the highest median family income in Westerly with $117,297 per family, while 2-person families (2,988 | 58.4%) have the highest median income of $46,136 per family member.
| Income Bracket | # Families | Median Income |
| 2-Person Families | 2,988 (58.4%) | $92,273 |
| 3-Person Families | 922 (18.0%) | $116,667 |
| 4-Person Families | 913 (17.8%) | $117,297 |
| 5-Person Families | 249 (4.9%) | $109,970 |
| 6-Person Families | 20 (0.4%) | $0 |
| 7+ Person Families | 24 (0.5%) | $0 |
| Total | 5,116 (100.0%) | $108,682 |
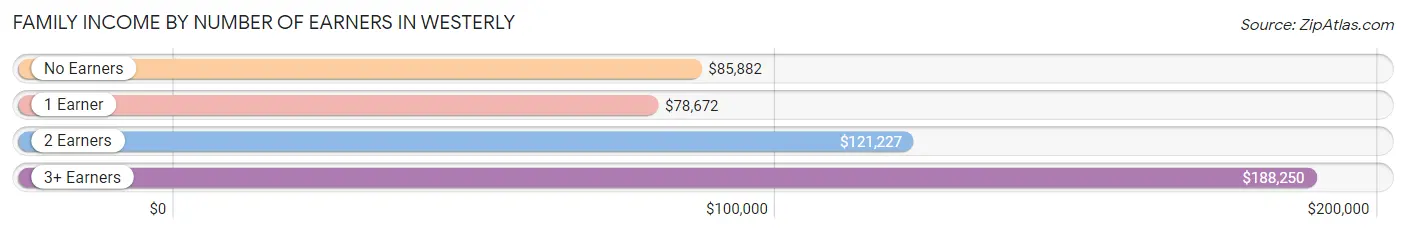
Family Income by Number of Earners in Westerly
The median family income in Westerly is $108,682, with families comprising 3+ earners (711) having the highest median family income of $188,250, while families with 1 earner (1,508) have the lowest median family income of $78,672, accounting for 13.9% and 29.5% of families, respectively.
| Number of Earners | # Families | Median Income |
| No Earners | 944 (18.4%) | $85,882 |
| 1 Earner | 1,508 (29.5%) | $78,672 |
| 2 Earners | 1,953 (38.2%) | $121,227 |
| 3+ Earners | 711 (13.9%) | $188,250 |
| Total | 5,116 (100.0%) | $108,682 |
Household Income in Westerly
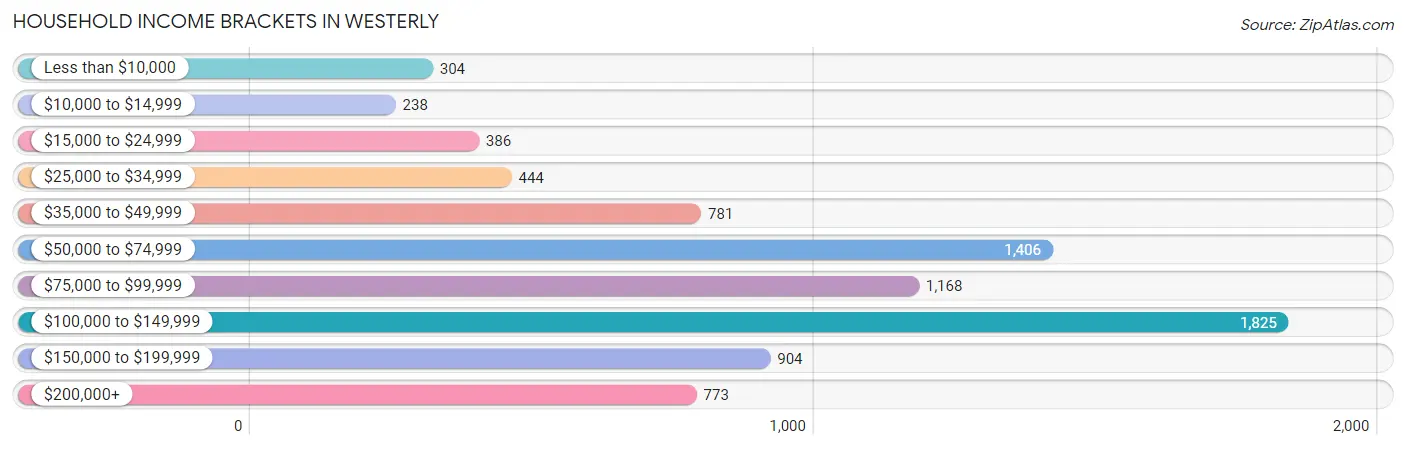
Household Income Brackets in Westerly
With 1,825 households falling in the category, the $100,000 to $149,999 income range is the most frequent in Westerly, accounting for 22.2% of all households. In contrast, only 238 households (2.9%) fall into the $10,000 to $14,999 income bracket, making it the least populous group.
| Income Bracket | # Households | % Households |
| Less than $10,000 | 304 | 3.7% |
| $10,000 to $14,999 | 238 | 2.9% |
| $15,000 to $24,999 | 386 | 4.7% |
| $25,000 to $34,999 | 444 | 5.4% |
| $35,000 to $49,999 | 781 | 9.5% |
| $50,000 to $74,999 | 1,406 | 17.1% |
| $75,000 to $99,999 | 1,168 | 14.2% |
| $100,000 to $149,999 | 1,825 | 22.2% |
| $150,000 to $199,999 | 904 | 11.0% |
| $200,000+ | 773 | 9.4% |
Household Income by Householder Age in Westerly
The median household income in Westerly is $86,343, with the highest median household income of $116,250 found in the 45 to 64 years age bracket for the primary householder. A total of 3,167 households (38.5%) fall into this category. Meanwhile, the 15 to 24 years age bracket for the primary householder has the lowest median household income of $0, with 188 households (2.3%) in this group.
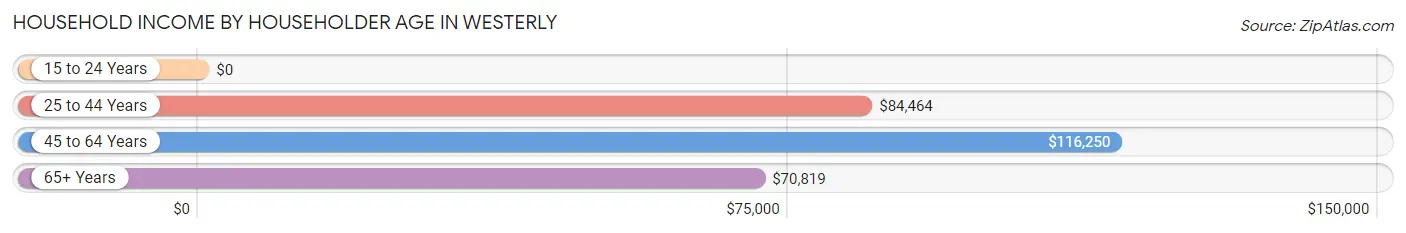
| Income Bracket | # Households | Median Income |
| 15 to 24 Years | 188 (2.3%) | $0 |
| 25 to 44 Years | 2,094 (25.5%) | $84,464 |
| 45 to 64 Years | 3,167 (38.5%) | $116,250 |
| 65+ Years | 2,773 (33.7%) | $70,819 |
| Total | 8,222 (100.0%) | $86,343 |
Poverty in Westerly
Income Below Poverty by Sex and Age in Westerly
With 6.4% poverty level for males and 6.2% for females among the residents of Westerly, under 5 year old males and 35 to 44 year old females are the most vulnerable to poverty, with 49 males (18.1%) and 109 females (12.4%) in their respective age groups living below the poverty level.
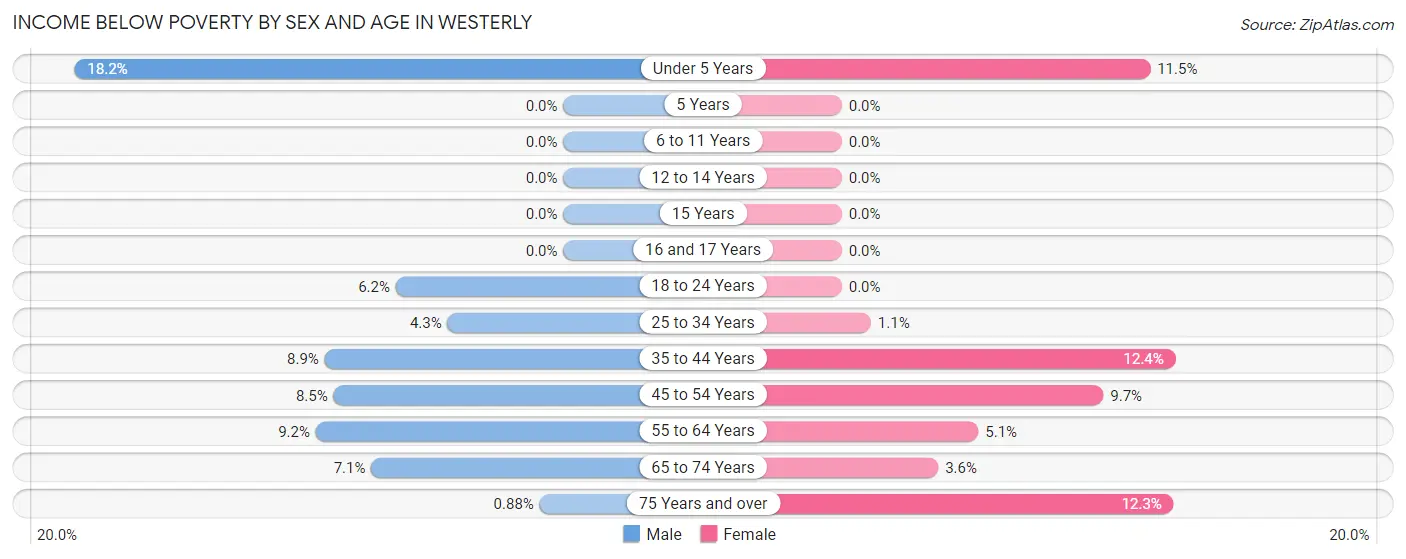
| Age Bracket | Male | Female |
| Under 5 Years | 49 (18.1%) | 49 (11.5%) |
| 5 Years | 0 (0.0%) | 0 (0.0%) |
| 6 to 11 Years | 0 (0.0%) | 0 (0.0%) |
| 12 to 14 Years | 0 (0.0%) | 0 (0.0%) |
| 15 Years | 0 (0.0%) | 0 (0.0%) |
| 16 and 17 Years | 0 (0.0%) | 0 (0.0%) |
| 18 to 24 Years | 70 (6.2%) | 0 (0.0%) |
| 25 to 34 Years | 48 (4.3%) | 11 (1.1%) |
| 35 to 44 Years | 67 (8.9%) | 109 (12.4%) |
| 45 to 54 Years | 106 (8.5%) | 112 (9.7%) |
| 55 to 64 Years | 150 (9.2%) | 85 (5.1%) |
| 65 to 74 Years | 93 (7.1%) | 45 (3.6%) |
| 75 Years and over | 6 (0.9%) | 137 (12.3%) |
| Total | 589 (6.4%) | 548 (6.2%) |
Income Above Poverty by Sex and Age in Westerly
According to the poverty statistics in Westerly, males aged 5 years and females aged 5 years are the age groups that are most secure financially, with 100.0% of males and 100.0% of females in these age groups living above the poverty line.
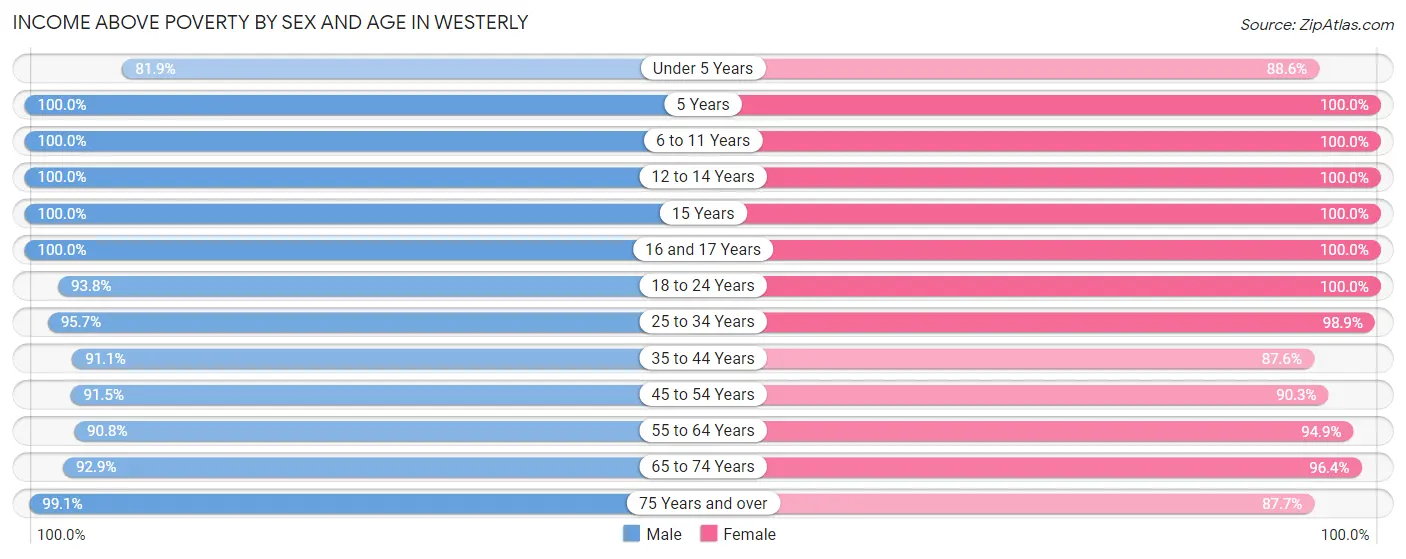
| Age Bracket | Male | Female |
| Under 5 Years | 221 (81.9%) | 379 (88.5%) |
| 5 Years | 114 (100.0%) | 57 (100.0%) |
| 6 to 11 Years | 441 (100.0%) | 367 (100.0%) |
| 12 to 14 Years | 227 (100.0%) | 95 (100.0%) |
| 15 Years | 82 (100.0%) | 152 (100.0%) |
| 16 and 17 Years | 262 (100.0%) | 28 (100.0%) |
| 18 to 24 Years | 1,056 (93.8%) | 587 (100.0%) |
| 25 to 34 Years | 1,068 (95.7%) | 1,007 (98.9%) |
| 35 to 44 Years | 689 (91.1%) | 771 (87.6%) |
| 45 to 54 Years | 1,136 (91.5%) | 1,042 (90.3%) |
| 55 to 64 Years | 1,483 (90.8%) | 1,591 (94.9%) |
| 65 to 74 Years | 1,212 (92.9%) | 1,213 (96.4%) |
| 75 Years and over | 679 (99.1%) | 975 (87.7%) |
| Total | 8,670 (93.6%) | 8,264 (93.8%) |
Income Below Poverty Among Married-Couple Families in Westerly
The poverty statistics for married-couple families in Westerly show that 2.9% or 111 of the total 3,831 families live below the poverty line. Families with 1 or 2 children have the highest poverty rate of 9.8%, comprising of 82 families. On the other hand, families with 3 or 4 children have the lowest poverty rate of 0.0%, which includes 0 families.
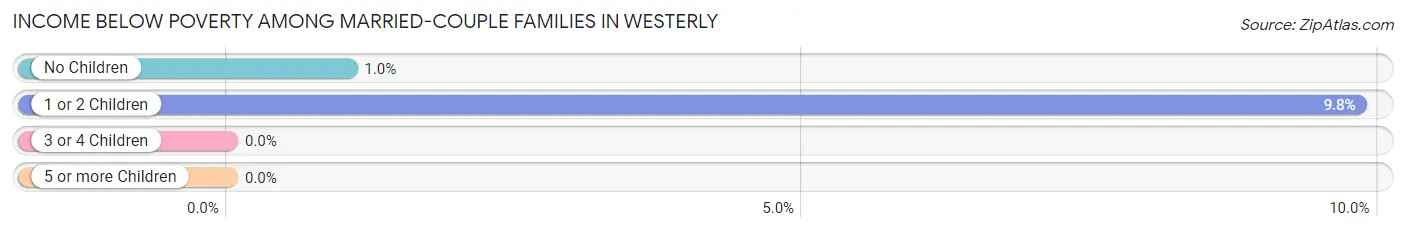
| Children | Above Poverty | Below Poverty |
| No Children | 2,762 (99.0%) | 29 (1.0%) |
| 1 or 2 Children | 752 (90.2%) | 82 (9.8%) |
| 3 or 4 Children | 206 (100.0%) | 0 (0.0%) |
| 5 or more Children | 0 (0.0%) | 0 (0.0%) |
| Total | 3,720 (97.1%) | 111 (2.9%) |
Income Below Poverty Among Single-Parent Households in Westerly
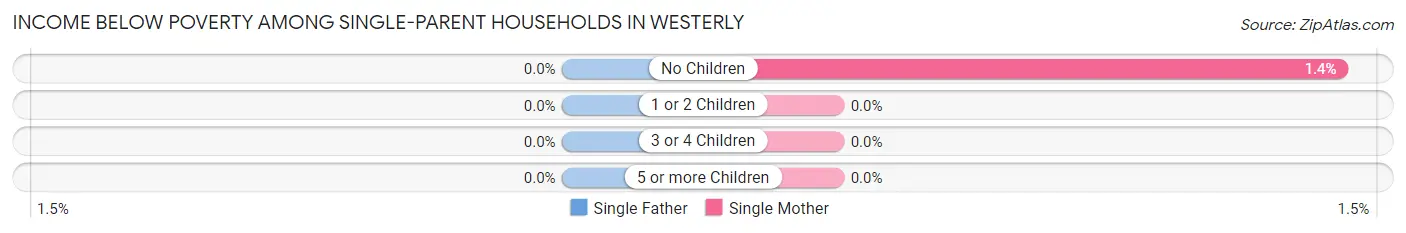
| Children | Single Father | Single Mother |
| No Children | 0 (0.0%) | 6 (1.4%) |
| 1 or 2 Children | 0 (0.0%) | 0 (0.0%) |
| 3 or 4 Children | 0 (0.0%) | 0 (0.0%) |
| 5 or more Children | 0 (0.0%) | 0 (0.0%) |
| Total | 0 (0.0%) | 6 (0.7%) |
Income Below Poverty Among Married-Couple vs Single-Parent Households in Westerly
The poverty data for Westerly shows that 111 of the married-couple family households (2.9%) and 6 of the single-parent households (0.5%) are living below the poverty level. Within the married-couple family households, those with 1 or 2 children have the highest poverty rate, with 82 households (9.8%) falling below the poverty line. Among the single-parent households, those with no children have the highest poverty rate, with 6 household (0.8%) living below poverty.
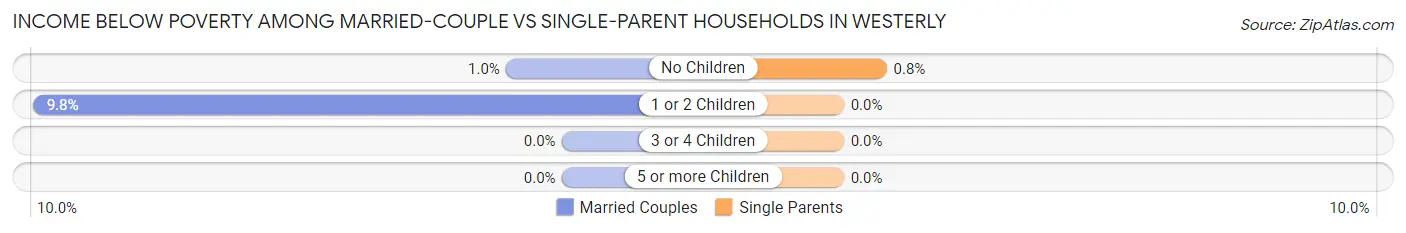
| Children | Married-Couple Families | Single-Parent Households |
| No Children | 29 (1.0%) | 6 (0.8%) |
| 1 or 2 Children | 82 (9.8%) | 0 (0.0%) |
| 3 or 4 Children | 0 (0.0%) | 0 (0.0%) |
| 5 or more Children | 0 (0.0%) | 0 (0.0%) |
| Total | 111 (2.9%) | 6 (0.5%) |
Race in Westerly
The most populous races in Westerly are White / Caucasian (16,432 | 89.9%), Hispanic or Latino (826 | 4.5%), and Two or more Races (625 | 3.4%).
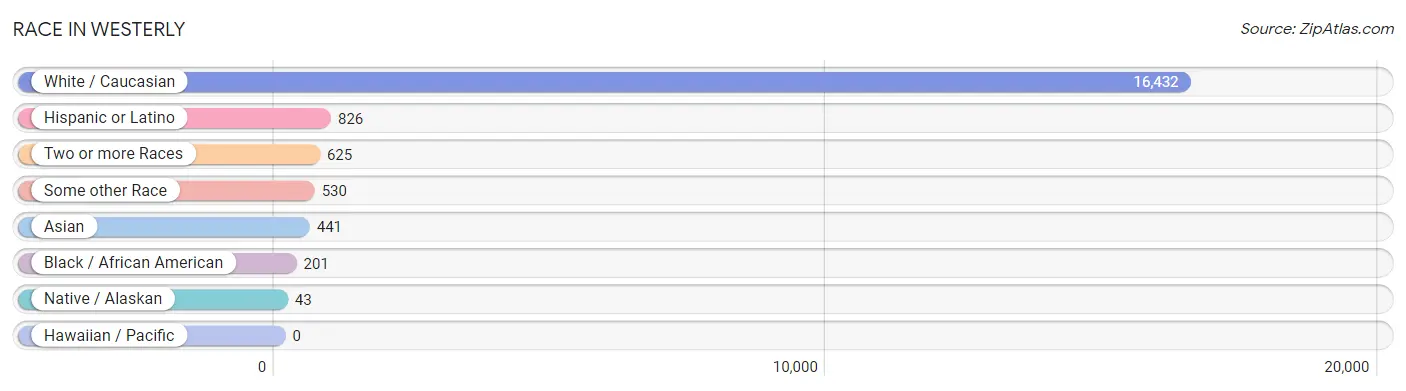
| Race | # Population | % Population |
| Asian | 441 | 2.4% |
| Black / African American | 201 | 1.1% |
| Hawaiian / Pacific | 0 | 0.0% |
| Hispanic or Latino | 826 | 4.5% |
| Native / Alaskan | 43 | 0.2% |
| White / Caucasian | 16,432 | 89.9% |
| Two or more Races | 625 | 3.4% |
| Some other Race | 530 | 2.9% |
| Total | 18,272 | 100.0% |
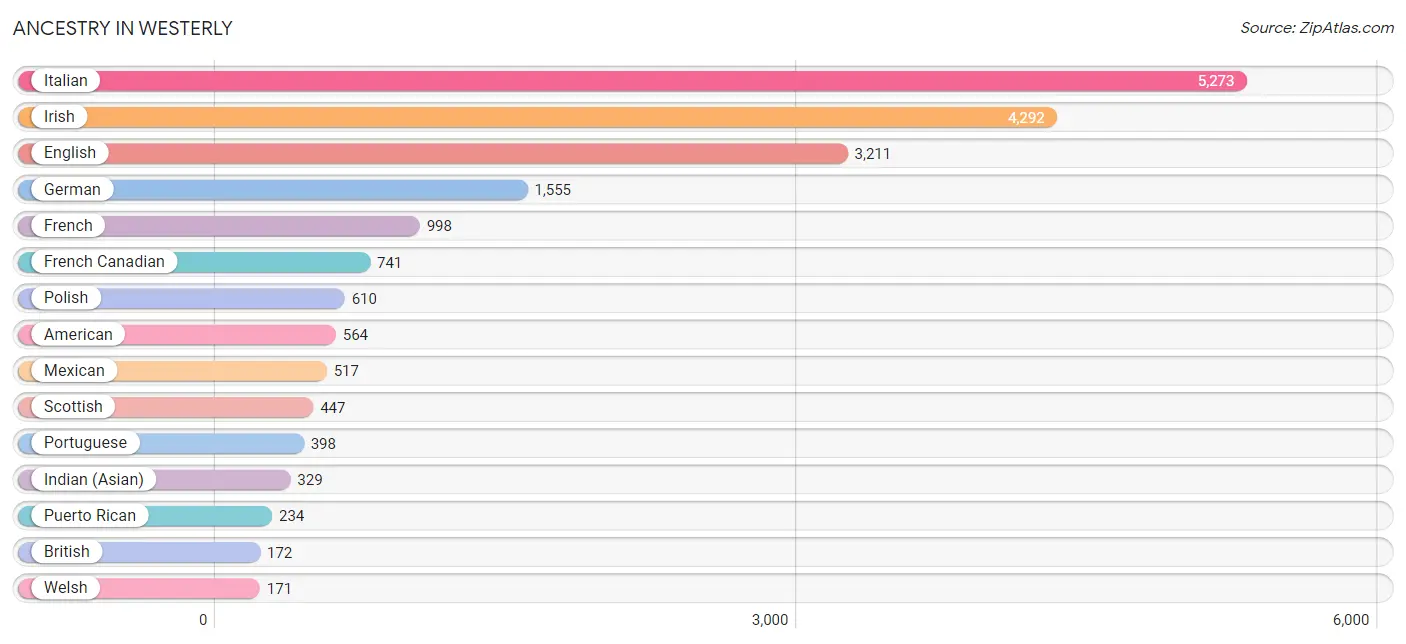
Ancestry in Westerly
The most populous ancestries reported in Westerly are Italian (5,273 | 28.9%), Irish (4,292 | 23.5%), English (3,211 | 17.6%), German (1,555 | 8.5%), and French (998 | 5.5%), together accounting for 83.9% of all Westerly residents.
| Ancestry | # Population | % Population |
| African | 17 | 0.1% |
| American | 564 | 3.1% |
| Arab | 89 | 0.5% |
| Armenian | 16 | 0.1% |
| Bhutanese | 168 | 0.9% |
| Blackfeet | 26 | 0.1% |
| British | 172 | 0.9% |
| Burmese | 96 | 0.5% |
| Cape Verdean | 106 | 0.6% |
| Central American | 6 | 0.0% |
| Cherokee | 6 | 0.0% |
| Creek | 16 | 0.1% |
| Cuban | 36 | 0.2% |
| Czech | 33 | 0.2% |
| Czechoslovakian | 7 | 0.0% |
| Danish | 24 | 0.1% |
| Dutch | 56 | 0.3% |
| Eastern European | 90 | 0.5% |
| Egyptian | 11 | 0.1% |
| English | 3,211 | 17.6% |
| European | 111 | 0.6% |
| Finnish | 70 | 0.4% |
| French | 998 | 5.5% |
| French Canadian | 741 | 4.1% |
| German | 1,555 | 8.5% |
| Greek | 128 | 0.7% |
| Hungarian | 65 | 0.4% |
| Indian (Asian) | 329 | 1.8% |
| Iranian | 7 | 0.0% |
| Irish | 4,292 | 23.5% |
| Italian | 5,273 | 28.9% |
| Korean | 39 | 0.2% |
| Lebanese | 51 | 0.3% |
| Lithuanian | 56 | 0.3% |
| Mexican | 517 | 2.8% |
| Nicaraguan | 6 | 0.0% |
| Northern European | 65 | 0.4% |
| Norwegian | 76 | 0.4% |
| Pakistani | 5 | 0.0% |
| Polish | 610 | 3.3% |
| Portuguese | 398 | 2.2% |
| Puerto Rican | 234 | 1.3% |
| Romanian | 100 | 0.5% |
| Russian | 106 | 0.6% |
| Scandinavian | 86 | 0.5% |
| Scotch-Irish | 66 | 0.4% |
| Scottish | 447 | 2.5% |
| Subsaharan African | 123 | 0.7% |
| Swedish | 137 | 0.7% |
| Swiss | 54 | 0.3% |
| Thai | 32 | 0.2% |
| Ukrainian | 13 | 0.1% |
| Welsh | 171 | 0.9% |
| Yugoslavian | 12 | 0.1% | View All 54 Rows |
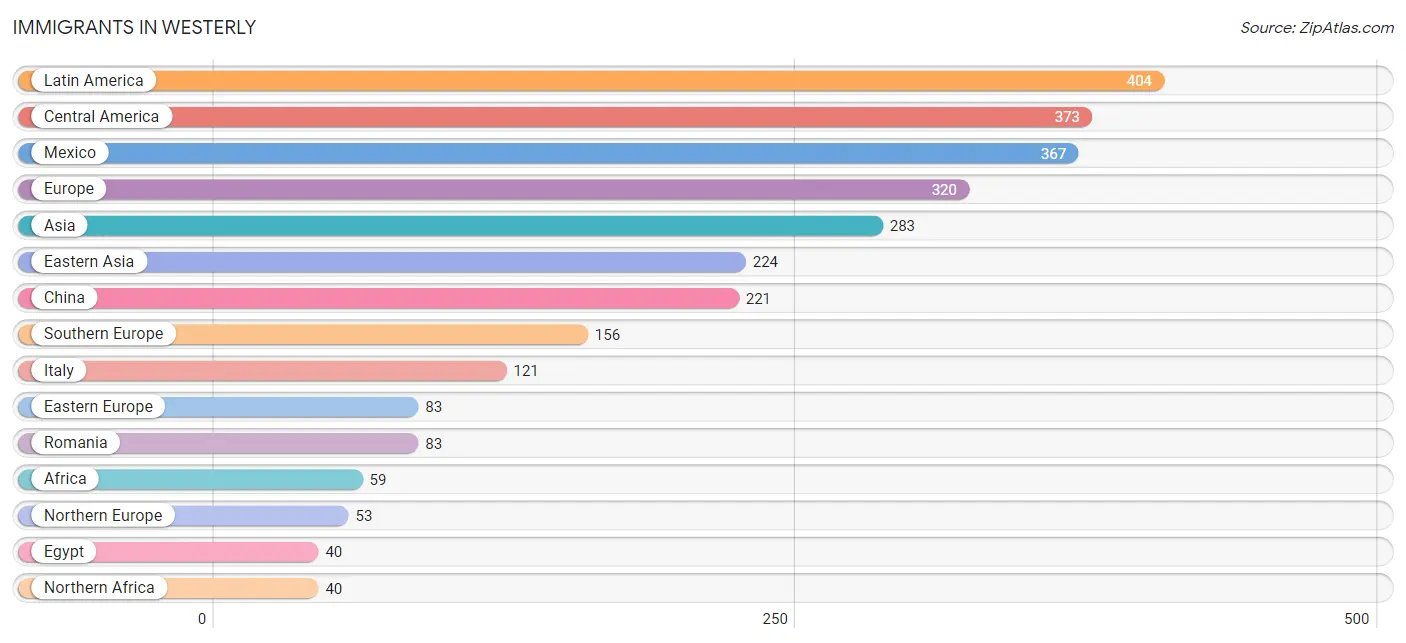
Immigrants in Westerly
The most numerous immigrant groups reported in Westerly came from Latin America (404 | 2.2%), Central America (373 | 2.0%), Mexico (367 | 2.0%), Europe (320 | 1.8%), and Asia (283 | 1.5%), together accounting for 9.6% of all Westerly residents.
| Immigration Origin | # Population | % Population |
| Africa | 59 | 0.3% |
| Asia | 283 | 1.5% |
| Azores | 15 | 0.1% |
| Cabo Verde | 19 | 0.1% |
| Canada | 15 | 0.1% |
| Caribbean | 31 | 0.2% |
| Central America | 373 | 2.0% |
| China | 221 | 1.2% |
| Cuba | 31 | 0.2% |
| Eastern Asia | 224 | 1.2% |
| Eastern Europe | 83 | 0.4% |
| Egypt | 40 | 0.2% |
| England | 14 | 0.1% |
| Europe | 320 | 1.8% |
| Germany | 28 | 0.2% |
| Hong Kong | 30 | 0.2% |
| Iran | 7 | 0.0% |
| Italy | 121 | 0.7% |
| Korea | 3 | 0.0% |
| Latin America | 404 | 2.2% |
| Mexico | 367 | 2.0% |
| Nicaragua | 6 | 0.0% |
| Northern Africa | 40 | 0.2% |
| Northern Europe | 53 | 0.3% |
| Pakistan | 12 | 0.1% |
| Philippines | 35 | 0.2% |
| Portugal | 35 | 0.2% |
| Romania | 83 | 0.4% |
| Scotland | 10 | 0.1% |
| South Central Asia | 19 | 0.1% |
| South Eastern Asia | 40 | 0.2% |
| Southern Europe | 156 | 0.9% |
| Thailand | 5 | 0.0% |
| Western Africa | 19 | 0.1% |
| Western Europe | 28 | 0.2% | View All 35 Rows |
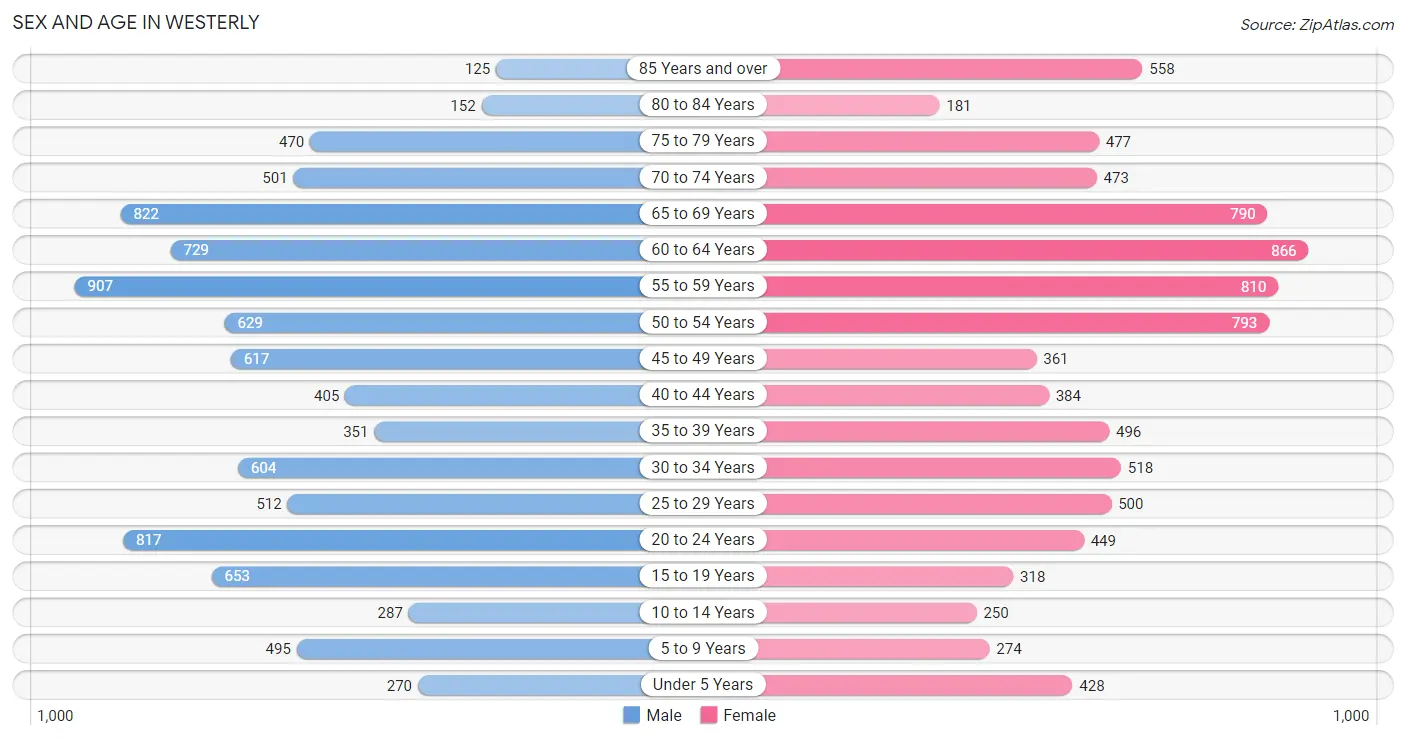
Sex and Age in Westerly
Sex and Age in Westerly
The most populous age groups in Westerly are 55 to 59 Years (907 | 9.7%) for men and 60 to 64 Years (866 | 9.7%) for women.
| Age Bracket | Male | Female |
| Under 5 Years | 270 (2.9%) | 428 (4.8%) |
| 5 to 9 Years | 495 (5.3%) | 274 (3.1%) |
| 10 to 14 Years | 287 (3.1%) | 250 (2.8%) |
| 15 to 19 Years | 653 (7.0%) | 318 (3.6%) |
| 20 to 24 Years | 817 (8.7%) | 449 (5.0%) |
| 25 to 29 Years | 512 (5.5%) | 500 (5.6%) |
| 30 to 34 Years | 604 (6.5%) | 518 (5.8%) |
| 35 to 39 Years | 351 (3.8%) | 496 (5.6%) |
| 40 to 44 Years | 405 (4.3%) | 384 (4.3%) |
| 45 to 49 Years | 617 (6.6%) | 361 (4.0%) |
| 50 to 54 Years | 629 (6.7%) | 793 (8.9%) |
| 55 to 59 Years | 907 (9.7%) | 810 (9.1%) |
| 60 to 64 Years | 729 (7.8%) | 866 (9.7%) |
| 65 to 69 Years | 822 (8.8%) | 790 (8.8%) |
| 70 to 74 Years | 501 (5.4%) | 473 (5.3%) |
| 75 to 79 Years | 470 (5.0%) | 477 (5.3%) |
| 80 to 84 Years | 152 (1.6%) | 181 (2.0%) |
| 85 Years and over | 125 (1.3%) | 558 (6.2%) |
| Total | 9,346 (100.0%) | 8,926 (100.0%) |
Families and Households in Westerly
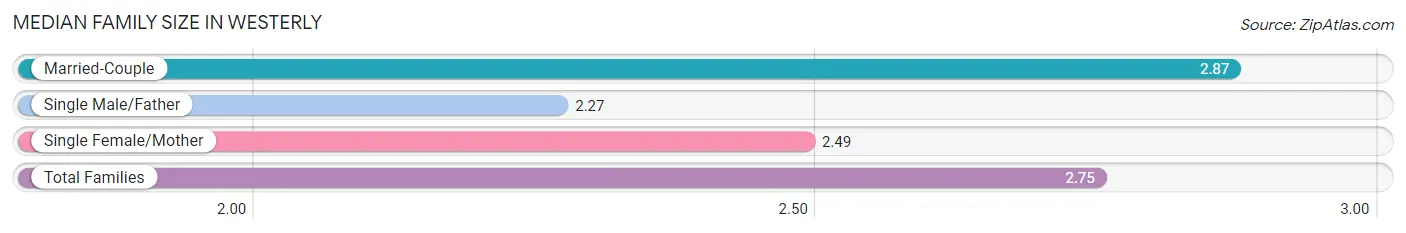
Median Family Size in Westerly
The median family size in Westerly is 2.75 persons per family, with married-couple families (3,831 | 74.9%) accounting for the largest median family size of 2.87 persons per family. On the other hand, single male/father families (417 | 8.2%) represent the smallest median family size with 2.27 persons per family.
| Family Type | # Families | Family Size |
| Married-Couple | 3,831 (74.9%) | 2.87 |
| Single Male/Father | 417 (8.2%) | 2.27 |
| Single Female/Mother | 868 (17.0%) | 2.49 |
| Total Families | 5,116 (100.0%) | 2.75 |
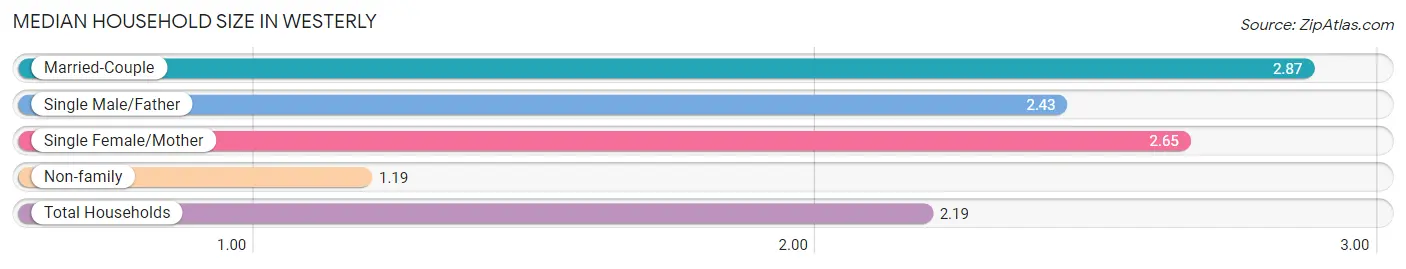
Median Household Size in Westerly
The median household size in Westerly is 2.19 persons per household, with married-couple households (3,831 | 46.6%) accounting for the largest median household size of 2.87 persons per household. non-family households (3,106 | 37.8%) represent the smallest median household size with 1.19 persons per household.
| Household Type | # Households | Household Size |
| Married-Couple | 3,831 (46.6%) | 2.87 |
| Single Male/Father | 417 (5.1%) | 2.43 |
| Single Female/Mother | 868 (10.6%) | 2.65 |
| Non-family | 3,106 (37.8%) | 1.19 |
| Total Households | 8,222 (100.0%) | 2.19 |
Household Size by Marriage Status in Westerly
Out of a total of 8,222 households in Westerly, 5,116 (62.2%) are family households, while 3,106 (37.8%) are nonfamily households. The most numerous type of family households are 2-person households, comprising 2,864, and the most common type of nonfamily households are 1-person households, comprising 2,457.
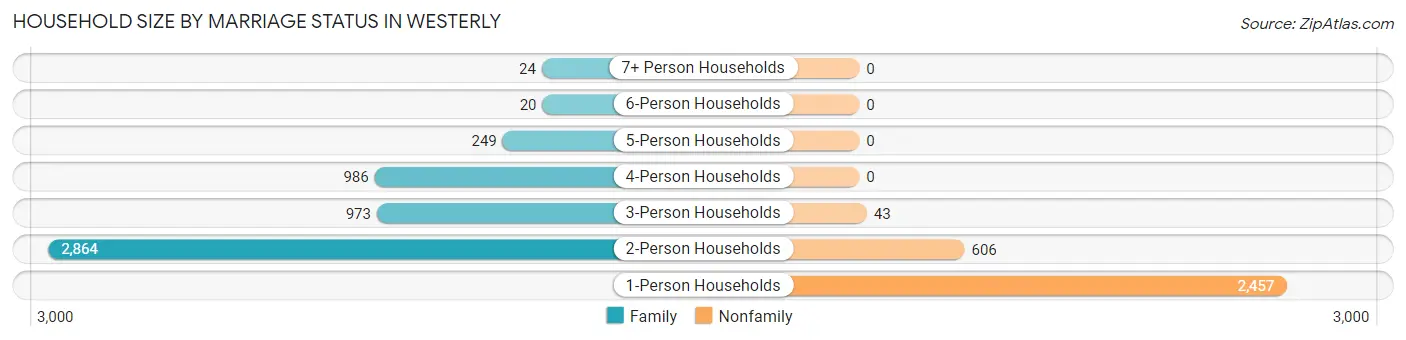
| Household Size | Family Households | Nonfamily Households |
| 1-Person Households | - | 2,457 (29.9%) |
| 2-Person Households | 2,864 (34.8%) | 606 (7.4%) |
| 3-Person Households | 973 (11.8%) | 43 (0.5%) |
| 4-Person Households | 986 (12.0%) | 0 (0.0%) |
| 5-Person Households | 249 (3.0%) | 0 (0.0%) |
| 6-Person Households | 20 (0.2%) | 0 (0.0%) |
| 7+ Person Households | 24 (0.3%) | 0 (0.0%) |
| Total | 5,116 (62.2%) | 3,106 (37.8%) |
Female Fertility in Westerly
Fertility by Age in Westerly
Average fertility rate in Westerly is 15.0 births per 1,000 women. Women in the age bracket of 20 to 34 years have the highest fertility rate with 34.0 births per 1,000 women. Women in the age bracket of 20 to 34 years acount for 100.0% of all women with births.
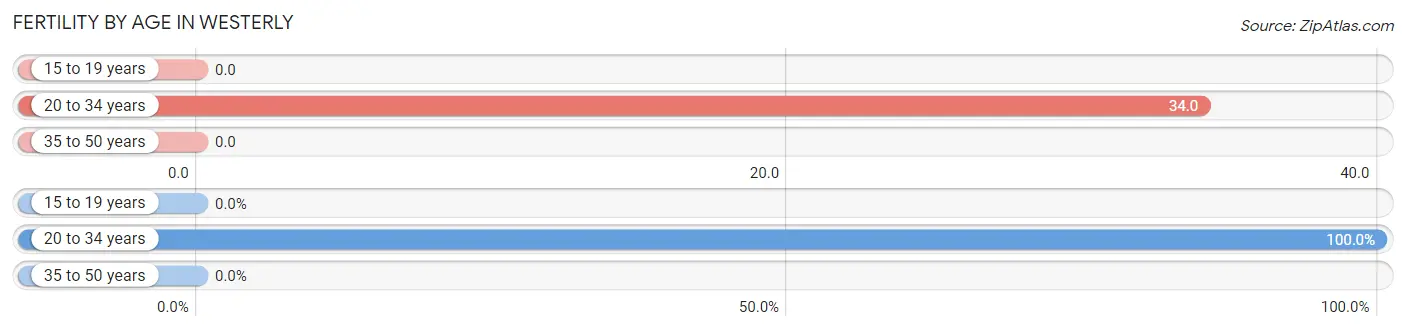
| Age Bracket | Women with Births | Births / 1,000 Women |
| 15 to 19 years | 0 (0.0%) | 0.0 |
| 20 to 34 years | 50 (100.0%) | 34.0 |
| 35 to 50 years | 0 (0.0%) | 0.0 |
| Total | 50 (100.0%) | 15.0 |
Fertility by Age by Marriage Status in Westerly
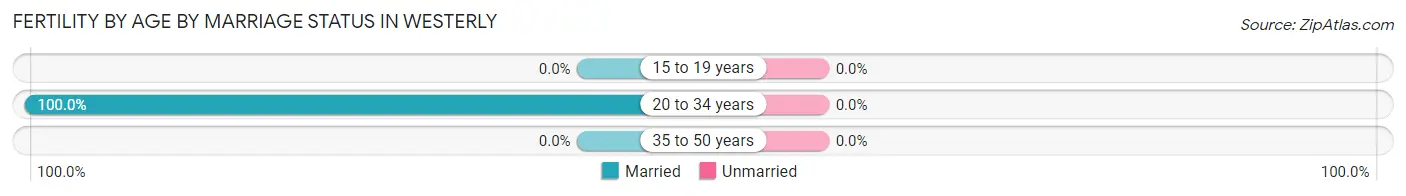
| Age Bracket | Married | Unmarried |
| 15 to 19 years | 0 (0.0%) | 0 (0.0%) |
| 20 to 34 years | 50 (100.0%) | 0 (0.0%) |
| 35 to 50 years | 0 (0.0%) | 0 (0.0%) |
| Total | 50 (100.0%) | 0 (0.0%) |
Fertility by Education in Westerly
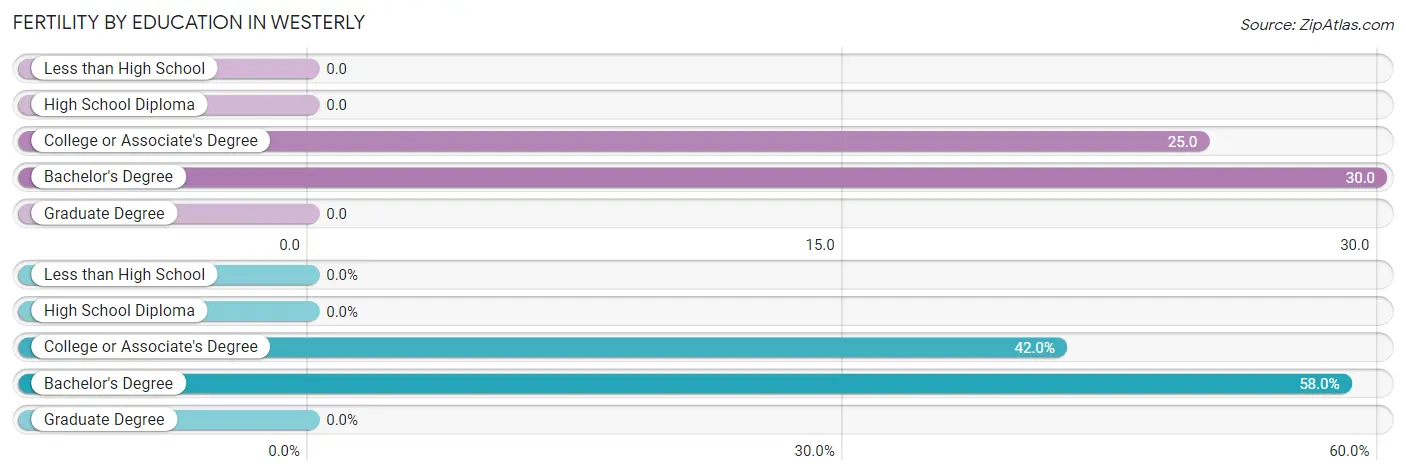
| Educational Attainment | Women with Births | Births / 1,000 Women |
| Less than High School | 0 (0.0%) | 0.0 |
| High School Diploma | 0 (0.0%) | 0.0 |
| College or Associate's Degree | 21 (42.0%) | 25.0 |
| Bachelor's Degree | 29 (58.0%) | 30.0 |
| Graduate Degree | 0 (0.0%) | 0.0 |
| Total | 50 (100.0%) | 15.0 |
Fertility by Education by Marriage Status in Westerly
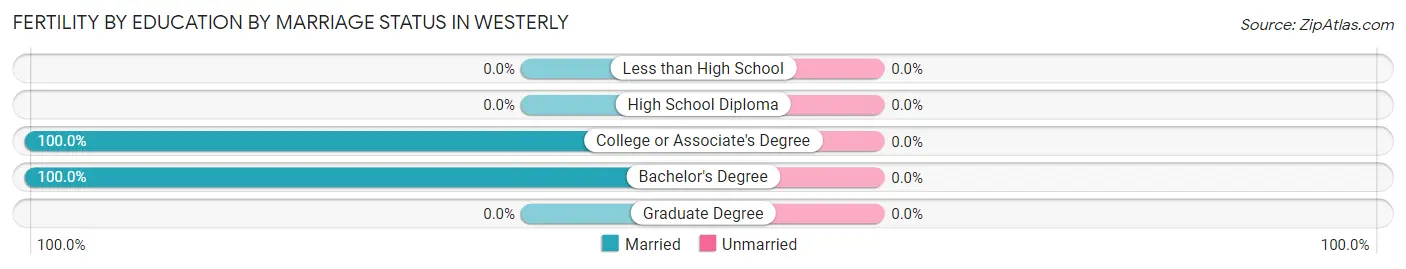
| Educational Attainment | Married | Unmarried |
| Less than High School | 0 (0.0%) | 0 (0.0%) |
| High School Diploma | 0 (0.0%) | 0 (0.0%) |
| College or Associate's Degree | 21 (100.0%) | 0 (0.0%) |
| Bachelor's Degree | 29 (100.0%) | 0 (0.0%) |
| Graduate Degree | 0 (0.0%) | 0 (0.0%) |
| Total | 50 (100.0%) | 0 (0.0%) |
Employment Characteristics in Westerly
Employment by Class of Employer in Westerly
Among the 9,545 employed individuals in Westerly, private company employees (6,323 | 66.2%), not-for-profit organizations (785 | 8.2%), and local government employees (685 | 7.2%) make up the most common classes of employment.
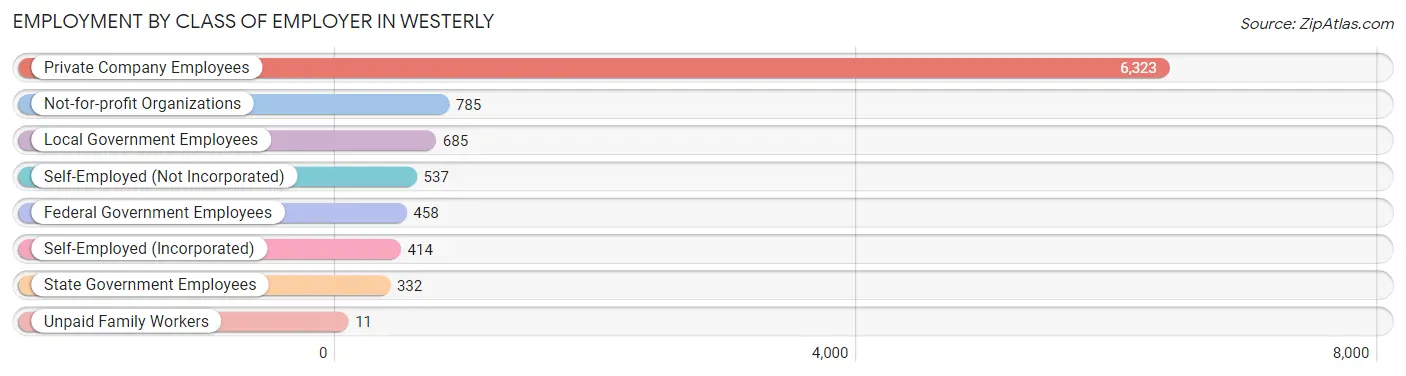
| Employer Class | # Employees | % Employees |
| Private Company Employees | 6,323 | 66.2% |
| Self-Employed (Incorporated) | 414 | 4.3% |
| Self-Employed (Not Incorporated) | 537 | 5.6% |
| Not-for-profit Organizations | 785 | 8.2% |
| Local Government Employees | 685 | 7.2% |
| State Government Employees | 332 | 3.5% |
| Federal Government Employees | 458 | 4.8% |
| Unpaid Family Workers | 11 | 0.1% |
| Total | 9,545 | 100.0% |
Employment Status by Age in Westerly
According to the labor force statistics for Westerly, out of the total population over 16 years of age (16,034), 64.6% or 10,358 individuals are in the labor force, with 6.5% or 673 of them unemployed. The age group with the highest labor force participation rate is 25 to 29 years, with 97.5% or 987 individuals in the labor force. Within the labor force, the 20 to 24 years age range has the highest percentage of unemployed individuals, with 10.5% or 117 of them being unemployed.
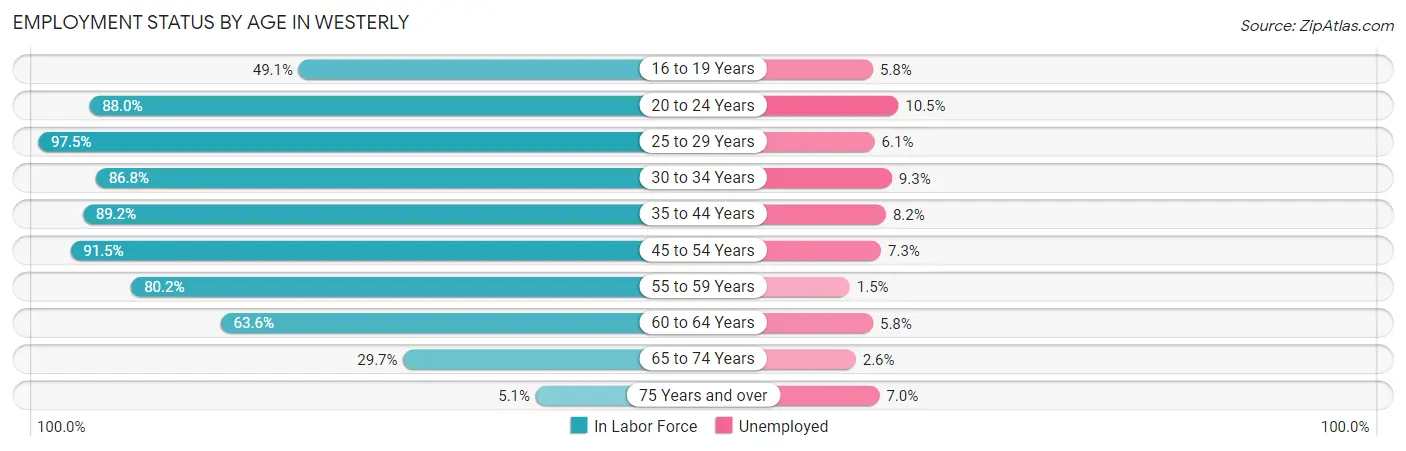
| Age Bracket | In Labor Force | Unemployed |
| 16 to 19 Years | 362 (49.1%) | 21 (5.8%) |
| 20 to 24 Years | 1,114 (88.0%) | 117 (10.5%) |
| 25 to 29 Years | 987 (97.5%) | 60 (6.1%) |
| 30 to 34 Years | 974 (86.8%) | 91 (9.3%) |
| 35 to 44 Years | 1,459 (89.2%) | 120 (8.2%) |
| 45 to 54 Years | 2,196 (91.5%) | 160 (7.3%) |
| 55 to 59 Years | 1,377 (80.2%) | 21 (1.5%) |
| 60 to 64 Years | 1,014 (63.6%) | 59 (5.8%) |
| 65 to 74 Years | 768 (29.7%) | 20 (2.6%) |
| 75 Years and over | 100 (5.1%) | 7 (7.0%) |
| Total | 10,358 (64.6%) | 673 (6.5%) |
Employment Status by Educational Attainment in Westerly
According to labor force statistics for Westerly, 84.5% of individuals (8,012) out of the total population between 25 and 64 years of age (9,482) are in the labor force, with 6.4% or 513 of them being unemployed. The group with the highest labor force participation rate are those with the educational attainment of bachelor's degree or higher, with 92.1% or 3,410 individuals in the labor force. Within the labor force, individuals with less than high school education have the highest percentage of unemployment, with 14.3% or 43 of them being unemployed.
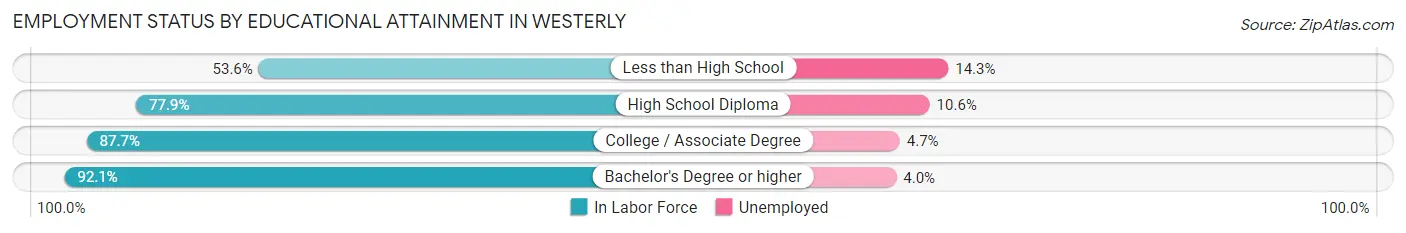
| Educational Attainment | In Labor Force | Unemployed |
| Less than High School | 300 (53.6%) | 80 (14.3%) |
| High School Diploma | 2,212 (77.9%) | 301 (10.6%) |
| College / Associate Degree | 2,087 (87.7%) | 112 (4.7%) |
| Bachelor's Degree or higher | 3,410 (92.1%) | 148 (4.0%) |
| Total | 8,012 (84.5%) | 607 (6.4%) |
Employment Occupations by Sex in Westerly
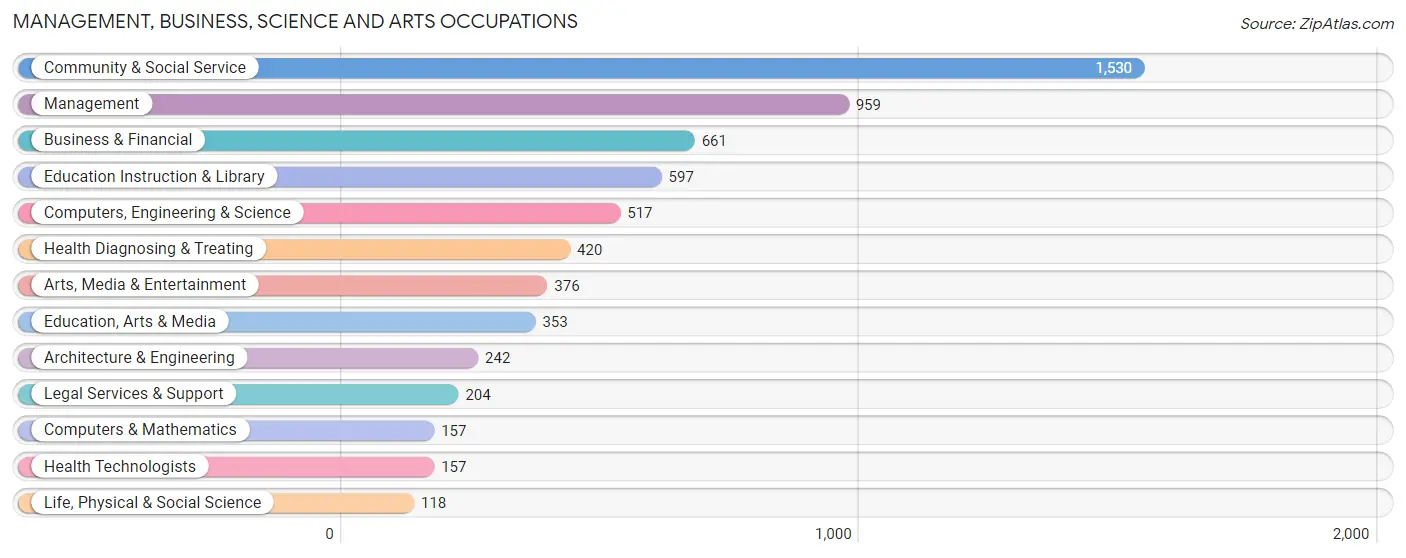
Management, Business, Science and Arts Occupations
The most common Management, Business, Science and Arts occupations in Westerly are Community & Social Service (1,530 | 16.0%), Management (959 | 10.1%), Business & Financial (661 | 6.9%), Education Instruction & Library (597 | 6.2%), and Computers, Engineering & Science (517 | 5.4%).
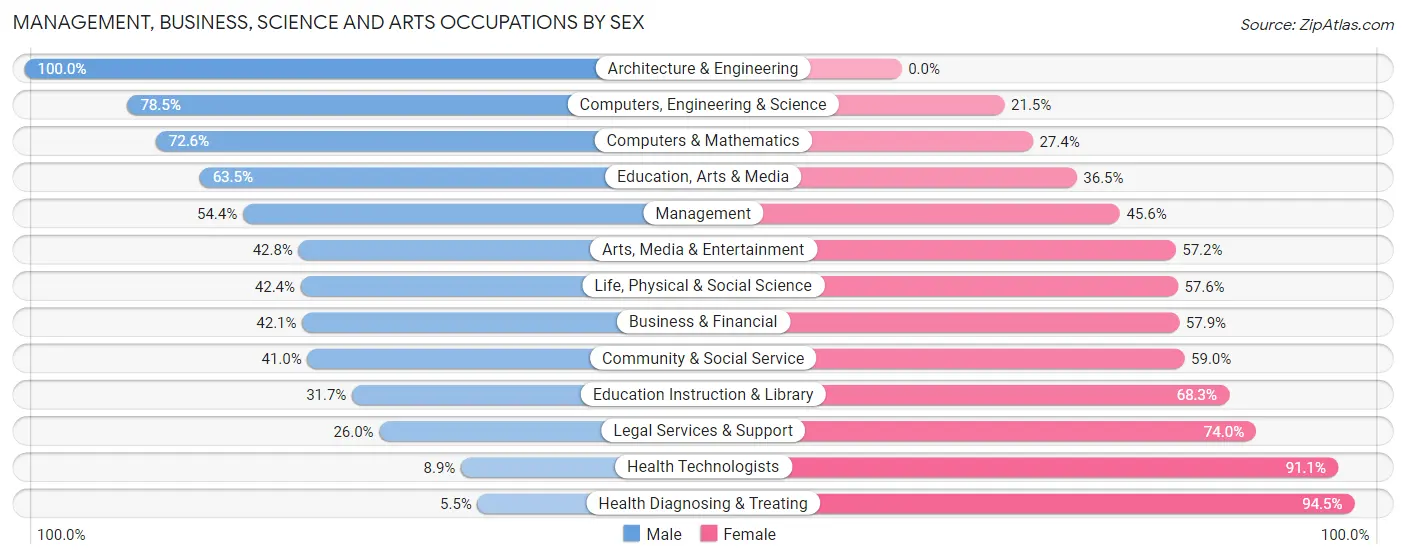
Management, Business, Science and Arts Occupations by Sex
Within the Management, Business, Science and Arts occupations in Westerly, the most male-oriented occupations are Architecture & Engineering (100.0%), Computers, Engineering & Science (78.5%), and Computers & Mathematics (72.6%), while the most female-oriented occupations are Health Diagnosing & Treating (94.5%), Health Technologists (91.1%), and Legal Services & Support (74.0%).
| Occupation | Male | Female |
| Management | 522 (54.4%) | 437 (45.6%) |
| Business & Financial | 278 (42.1%) | 383 (57.9%) |
| Computers, Engineering & Science | 406 (78.5%) | 111 (21.5%) |
| Computers & Mathematics | 114 (72.6%) | 43 (27.4%) |
| Architecture & Engineering | 242 (100.0%) | 0 (0.0%) |
| Life, Physical & Social Science | 50 (42.4%) | 68 (57.6%) |
| Community & Social Service | 627 (41.0%) | 903 (59.0%) |
| Education, Arts & Media | 224 (63.5%) | 129 (36.5%) |
| Legal Services & Support | 53 (26.0%) | 151 (74.0%) |
| Education Instruction & Library | 189 (31.7%) | 408 (68.3%) |
| Arts, Media & Entertainment | 161 (42.8%) | 215 (57.2%) |
| Health Diagnosing & Treating | 23 (5.5%) | 397 (94.5%) |
| Health Technologists | 14 (8.9%) | 143 (91.1%) |
| Total (Category) | 1,856 (45.4%) | 2,231 (54.6%) |
| Total (Overall) | 5,413 (56.7%) | 4,132 (43.3%) |
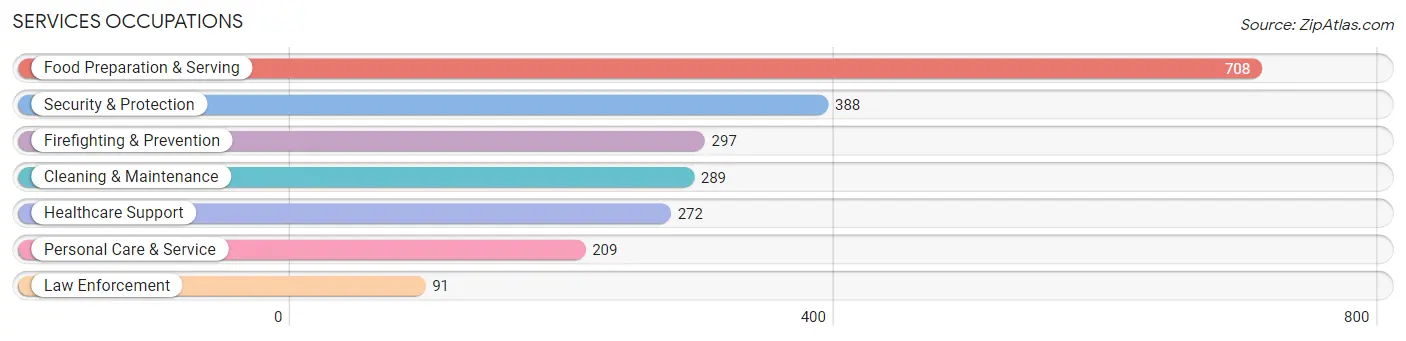
Services Occupations
The most common Services occupations in Westerly are Food Preparation & Serving (708 | 7.4%), Security & Protection (388 | 4.1%), Firefighting & Prevention (297 | 3.1%), Cleaning & Maintenance (289 | 3.0%), and Healthcare Support (272 | 2.9%).
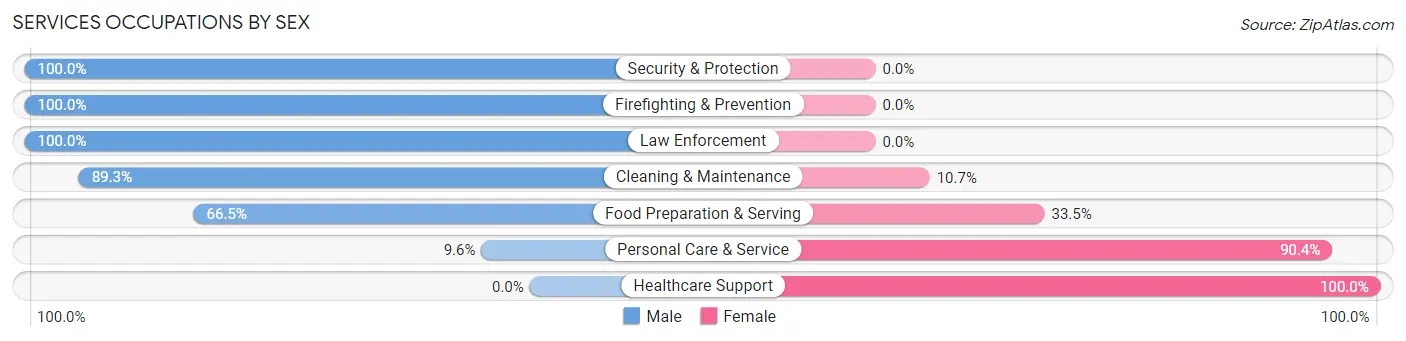
Services Occupations by Sex
Within the Services occupations in Westerly, the most male-oriented occupations are Security & Protection (100.0%), Firefighting & Prevention (100.0%), and Law Enforcement (100.0%), while the most female-oriented occupations are Healthcare Support (100.0%), Personal Care & Service (90.4%), and Food Preparation & Serving (33.5%).
| Occupation | Male | Female |
| Healthcare Support | 0 (0.0%) | 272 (100.0%) |
| Security & Protection | 388 (100.0%) | 0 (0.0%) |
| Firefighting & Prevention | 297 (100.0%) | 0 (0.0%) |
| Law Enforcement | 91 (100.0%) | 0 (0.0%) |
| Food Preparation & Serving | 471 (66.5%) | 237 (33.5%) |
| Cleaning & Maintenance | 258 (89.3%) | 31 (10.7%) |
| Personal Care & Service | 20 (9.6%) | 189 (90.4%) |
| Total (Category) | 1,137 (60.9%) | 729 (39.1%) |
| Total (Overall) | 5,413 (56.7%) | 4,132 (43.3%) |
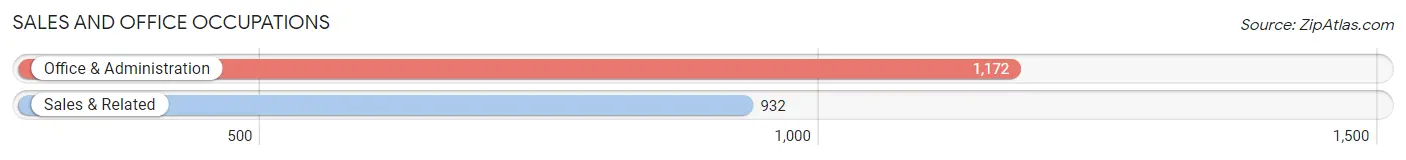
Sales and Office Occupations
The most common Sales and Office occupations in Westerly are Office & Administration (1,172 | 12.3%), and Sales & Related (932 | 9.8%).
Sales and Office Occupations by Sex
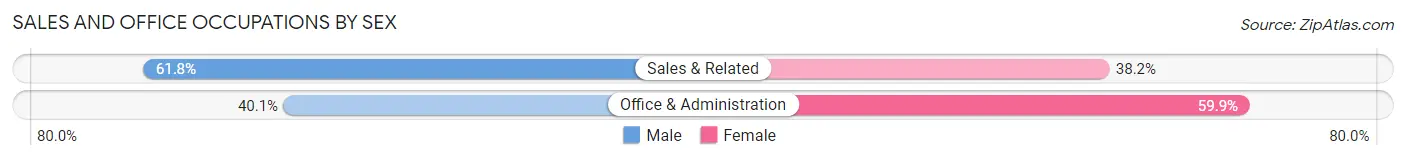
| Occupation | Male | Female |
| Sales & Related | 576 (61.8%) | 356 (38.2%) |
| Office & Administration | 470 (40.1%) | 702 (59.9%) |
| Total (Category) | 1,046 (49.7%) | 1,058 (50.3%) |
| Total (Overall) | 5,413 (56.7%) | 4,132 (43.3%) |
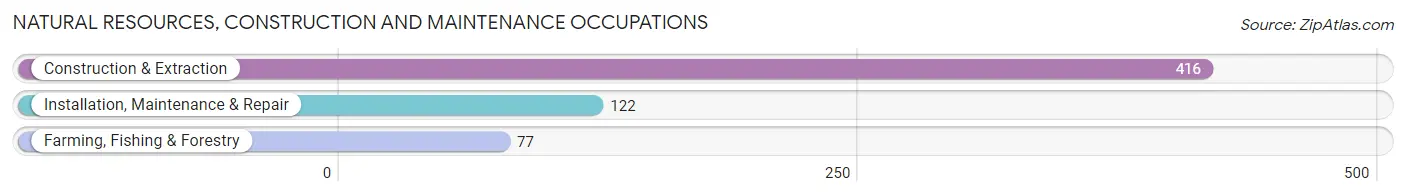
Natural Resources, Construction and Maintenance Occupations
The most common Natural Resources, Construction and Maintenance occupations in Westerly are Construction & Extraction (416 | 4.4%), Installation, Maintenance & Repair (122 | 1.3%), and Farming, Fishing & Forestry (77 | 0.8%).
Natural Resources, Construction and Maintenance Occupations by Sex
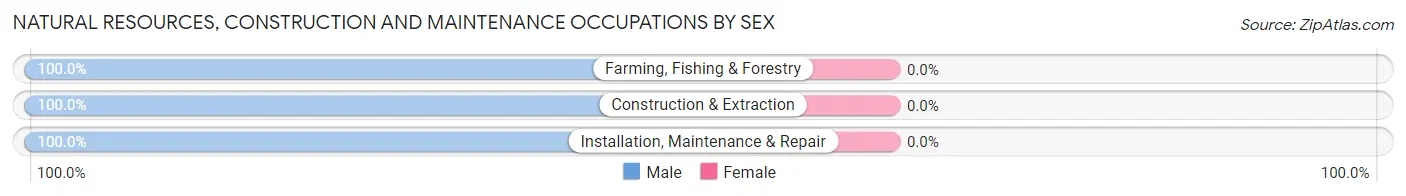
| Occupation | Male | Female |
| Farming, Fishing & Forestry | 77 (100.0%) | 0 (0.0%) |
| Construction & Extraction | 416 (100.0%) | 0 (0.0%) |
| Installation, Maintenance & Repair | 122 (100.0%) | 0 (0.0%) |
| Total (Category) | 615 (100.0%) | 0 (0.0%) |
| Total (Overall) | 5,413 (56.7%) | 4,132 (43.3%) |
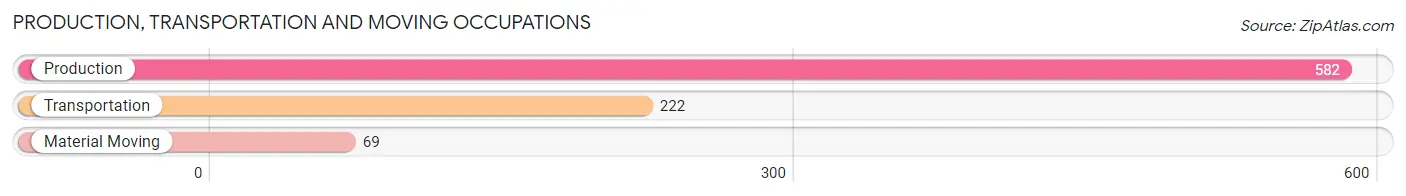
Production, Transportation and Moving Occupations
The most common Production, Transportation and Moving occupations in Westerly are Production (582 | 6.1%), Transportation (222 | 2.3%), and Material Moving (69 | 0.7%).
Production, Transportation and Moving Occupations by Sex
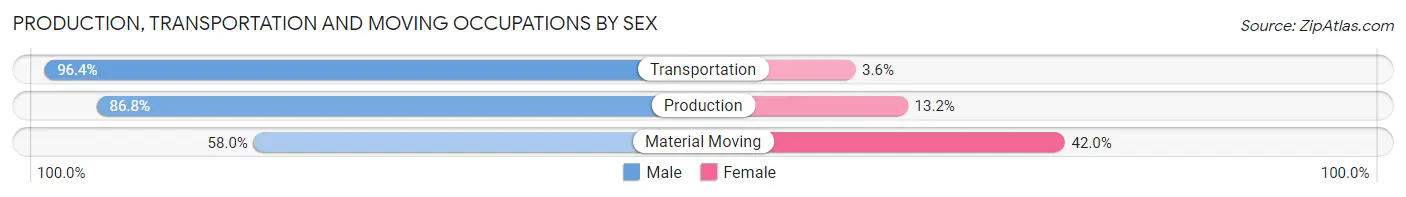
| Occupation | Male | Female |
| Production | 505 (86.8%) | 77 (13.2%) |
| Transportation | 214 (96.4%) | 8 (3.6%) |
| Material Moving | 40 (58.0%) | 29 (42.0%) |
| Total (Category) | 759 (86.9%) | 114 (13.1%) |
| Total (Overall) | 5,413 (56.7%) | 4,132 (43.3%) |
Employment Industries by Sex in Westerly
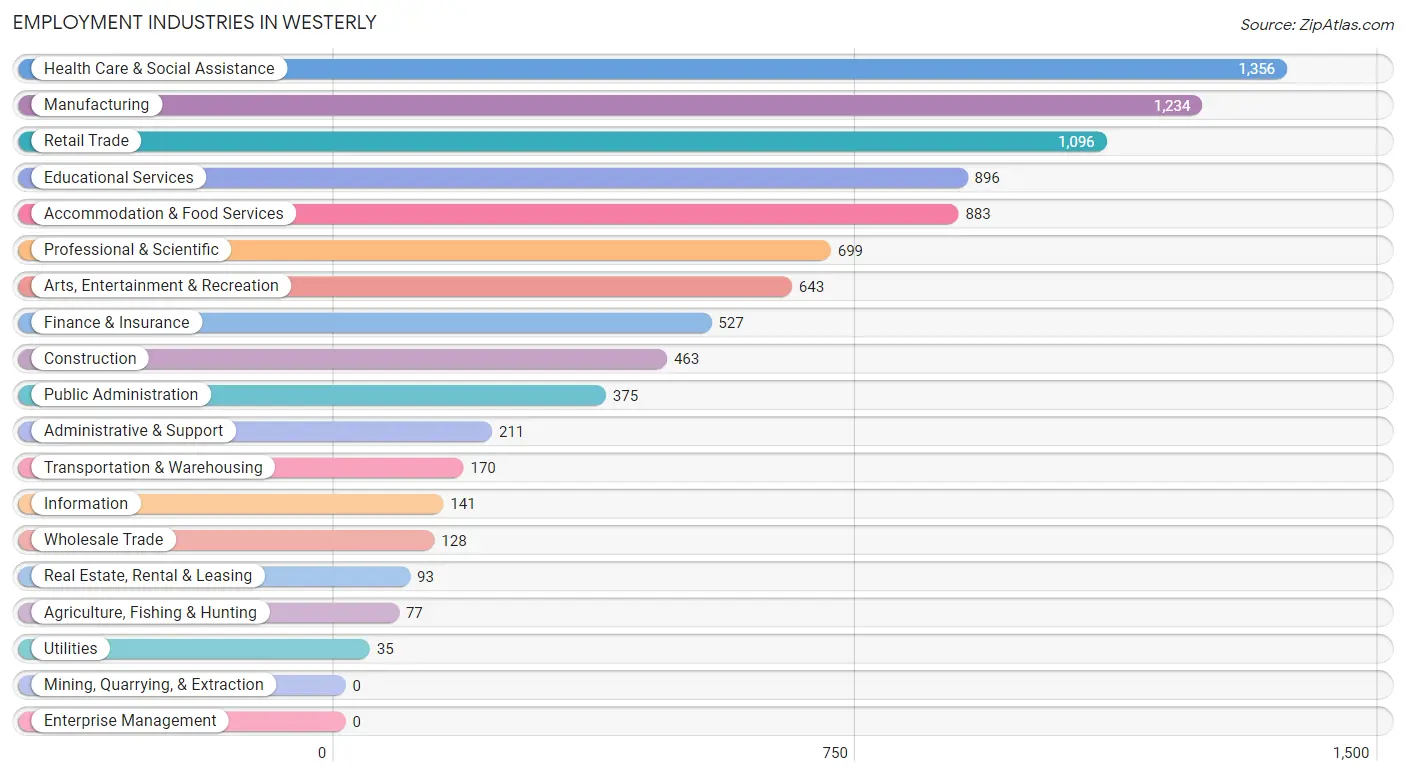
Employment Industries in Westerly
The major employment industries in Westerly include Health Care & Social Assistance (1,356 | 14.2%), Manufacturing (1,234 | 12.9%), Retail Trade (1,096 | 11.5%), Educational Services (896 | 9.4%), and Accommodation & Food Services (883 | 9.2%).
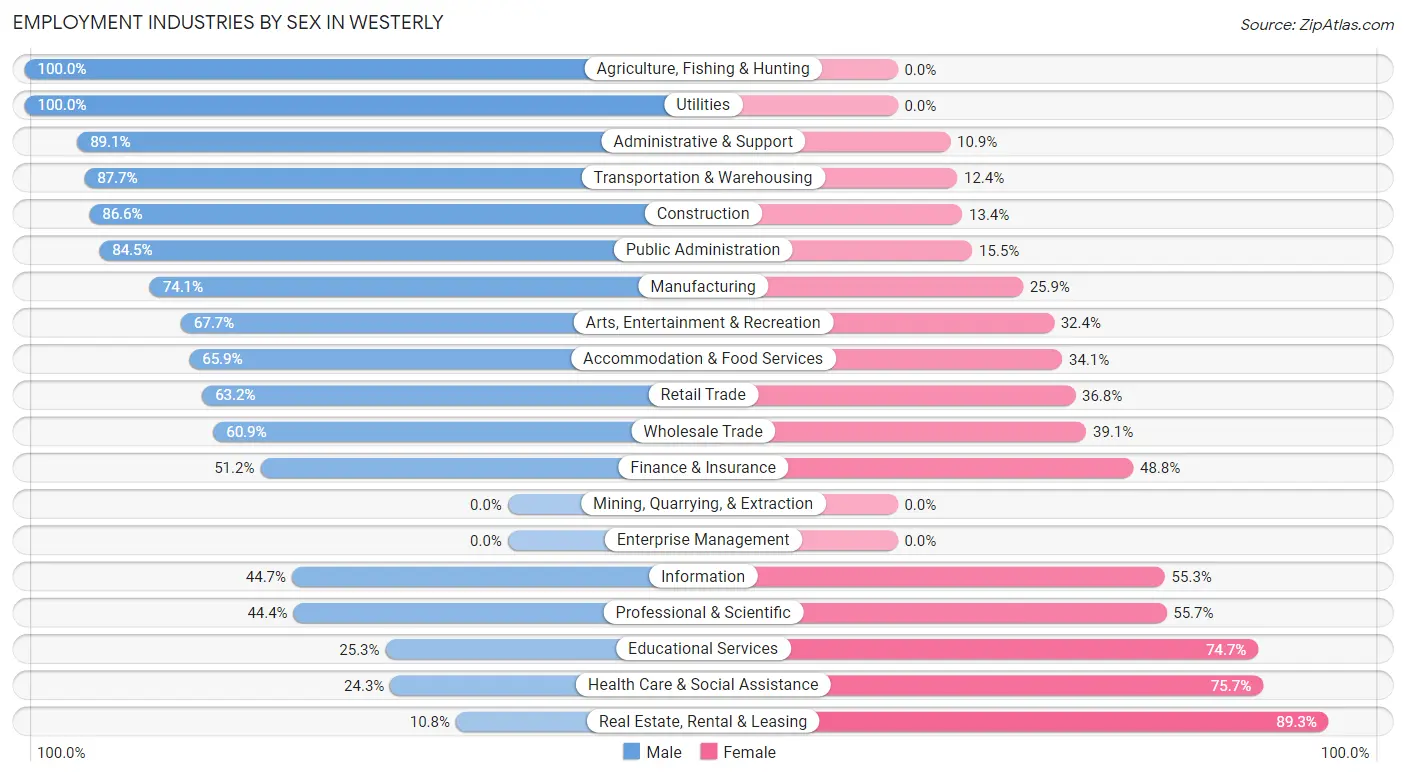
Employment Industries by Sex in Westerly
The Westerly industries that see more men than women are Agriculture, Fishing & Hunting (100.0%), Utilities (100.0%), and Administrative & Support (89.1%), whereas the industries that tend to have a higher number of women are Real Estate, Rental & Leasing (89.2%), Health Care & Social Assistance (75.7%), and Educational Services (74.7%).
| Industry | Male | Female |
| Agriculture, Fishing & Hunting | 77 (100.0%) | 0 (0.0%) |
| Mining, Quarrying, & Extraction | 0 (0.0%) | 0 (0.0%) |
| Construction | 401 (86.6%) | 62 (13.4%) |
| Manufacturing | 914 (74.1%) | 320 (25.9%) |
| Wholesale Trade | 78 (60.9%) | 50 (39.1%) |
| Retail Trade | 693 (63.2%) | 403 (36.8%) |
| Transportation & Warehousing | 149 (87.6%) | 21 (12.3%) |
| Utilities | 35 (100.0%) | 0 (0.0%) |
| Information | 63 (44.7%) | 78 (55.3%) |
| Finance & Insurance | 270 (51.2%) | 257 (48.8%) |
| Real Estate, Rental & Leasing | 10 (10.7%) | 83 (89.2%) |
| Professional & Scientific | 310 (44.4%) | 389 (55.6%) |
| Enterprise Management | 0 (0.0%) | 0 (0.0%) |
| Administrative & Support | 188 (89.1%) | 23 (10.9%) |
| Educational Services | 227 (25.3%) | 669 (74.7%) |
| Health Care & Social Assistance | 330 (24.3%) | 1,026 (75.7%) |
| Arts, Entertainment & Recreation | 435 (67.6%) | 208 (32.4%) |
| Accommodation & Food Services | 582 (65.9%) | 301 (34.1%) |
| Public Administration | 317 (84.5%) | 58 (15.5%) |
| Total | 5,413 (56.7%) | 4,132 (43.3%) |
Education in Westerly
School Enrollment in Westerly
The most common levels of schooling among the 2,795 students in Westerly are college / undergraduate (642 | 23.0%), high school (614 | 22.0%), and elementary school (536 | 19.2%).
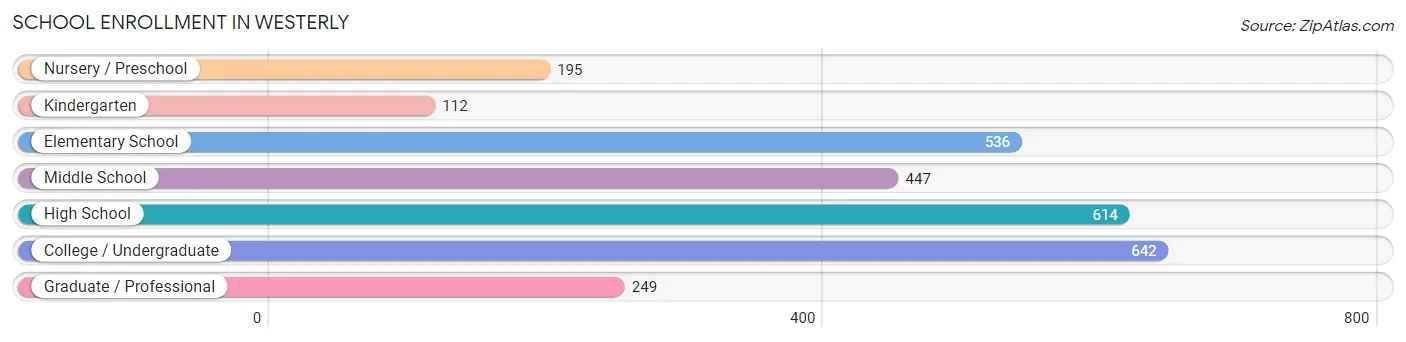
| School Level | # Students | % Students |
| Nursery / Preschool | 195 | 7.0% |
| Kindergarten | 112 | 4.0% |
| Elementary School | 536 | 19.2% |
| Middle School | 447 | 16.0% |
| High School | 614 | 22.0% |
| College / Undergraduate | 642 | 23.0% |
| Graduate / Professional | 249 | 8.9% |
| Total | 2,795 | 100.0% |
School Enrollment by Age by Funding Source in Westerly
Out of a total of 2,795 students who are enrolled in schools in Westerly, 710 (25.4%) attend a private institution, while the remaining 2,085 (74.6%) are enrolled in public schools. The age group of 3 to 4 year olds has the highest likelihood of being enrolled in private schools, with 97 (80.2% in the age bracket) enrolled. Conversely, the age group of 15 to 17 year olds has the lowest likelihood of being enrolled in a private school, with 435 (90.1% in the age bracket) attending a public institution.
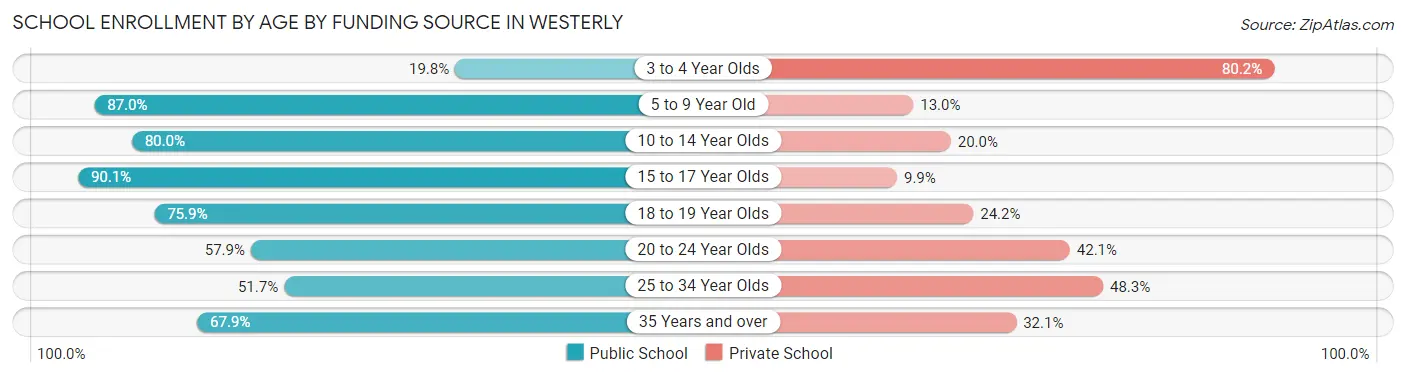
| Age Bracket | Public School | Private School |
| 3 to 4 Year Olds | 24 (19.8%) | 97 (80.2%) |
| 5 to 9 Year Old | 604 (87.0%) | 90 (13.0%) |
| 10 to 14 Year Olds | 405 (80.0%) | 101 (20.0%) |
| 15 to 17 Year Olds | 435 (90.1%) | 48 (9.9%) |
| 18 to 19 Year Olds | 179 (75.8%) | 57 (24.1%) |
| 20 to 24 Year Olds | 320 (57.9%) | 233 (42.1%) |
| 25 to 34 Year Olds | 61 (51.7%) | 57 (48.3%) |
| 35 Years and over | 57 (67.9%) | 27 (32.1%) |
| Total | 2,085 (74.6%) | 710 (25.4%) |
Educational Attainment by Field of Study in Westerly
Business (735 | 13.4%), education (610 | 11.1%), social sciences (520 | 9.5%), psychology (437 | 8.0%), and liberal arts & history (437 | 8.0%) are the most common fields of study among 5,484 individuals in Westerly who have obtained a bachelor's degree or higher.
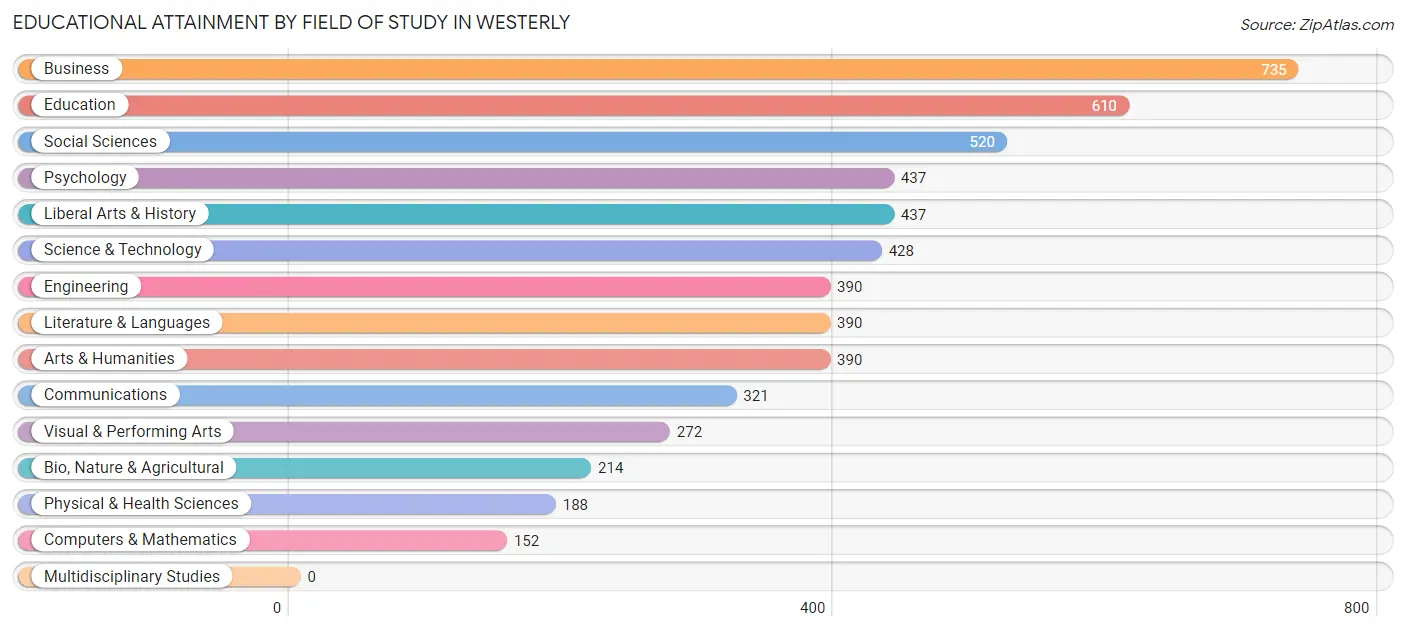
| Field of Study | # Graduates | % Graduates |
| Computers & Mathematics | 152 | 2.8% |
| Bio, Nature & Agricultural | 214 | 3.9% |
| Physical & Health Sciences | 188 | 3.4% |
| Psychology | 437 | 8.0% |
| Social Sciences | 520 | 9.5% |
| Engineering | 390 | 7.1% |
| Multidisciplinary Studies | 0 | 0.0% |
| Science & Technology | 428 | 7.8% |
| Business | 735 | 13.4% |
| Education | 610 | 11.1% |
| Literature & Languages | 390 | 7.1% |
| Liberal Arts & History | 437 | 8.0% |
| Visual & Performing Arts | 272 | 5.0% |
| Communications | 321 | 5.9% |
| Arts & Humanities | 390 | 7.1% |
| Total | 5,484 | 100.0% |
Transportation & Commute in Westerly
Vehicle Availability by Sex in Westerly
The most prevalent vehicle ownership categories in Westerly are males with 2 vehicles (2,005, accounting for 36.9%) and females with 2 vehicles (1,659, making up 48.9%).
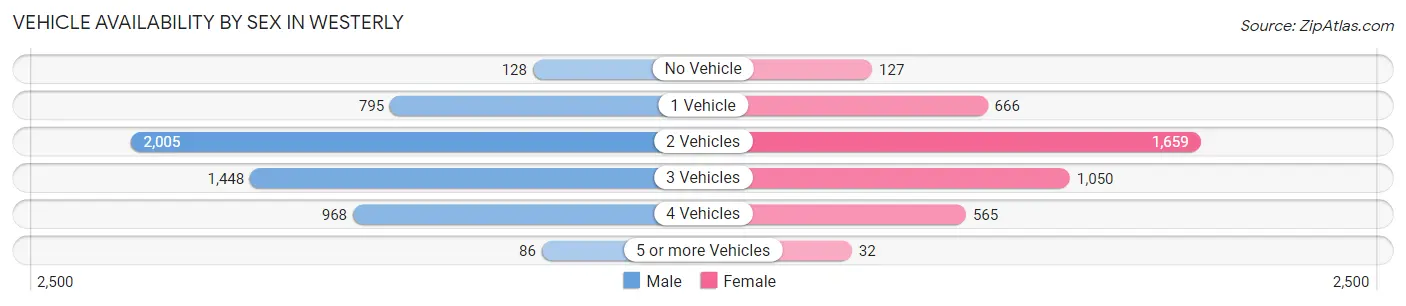
| Vehicles Available | Male | Female |
| No Vehicle | 128 (2.4%) | 127 (3.1%) |
| 1 Vehicle | 795 (14.6%) | 666 (16.3%) |
| 2 Vehicles | 2,005 (36.9%) | 1,659 (40.5%) |
| 3 Vehicles | 1,448 (26.7%) | 1,050 (25.6%) |
| 4 Vehicles | 968 (17.8%) | 565 (13.8%) |
| 5 or more Vehicles | 86 (1.6%) | 32 (0.8%) |
| Total | 5,430 (100.0%) | 4,099 (100.0%) |
Commute Time in Westerly
The most frequently occuring commute durations in Westerly are 5 to 9 minutes (1,588 commuters, 18.0%), 10 to 14 minutes (1,419 commuters, 16.1%), and 20 to 24 minutes (1,207 commuters, 13.7%).
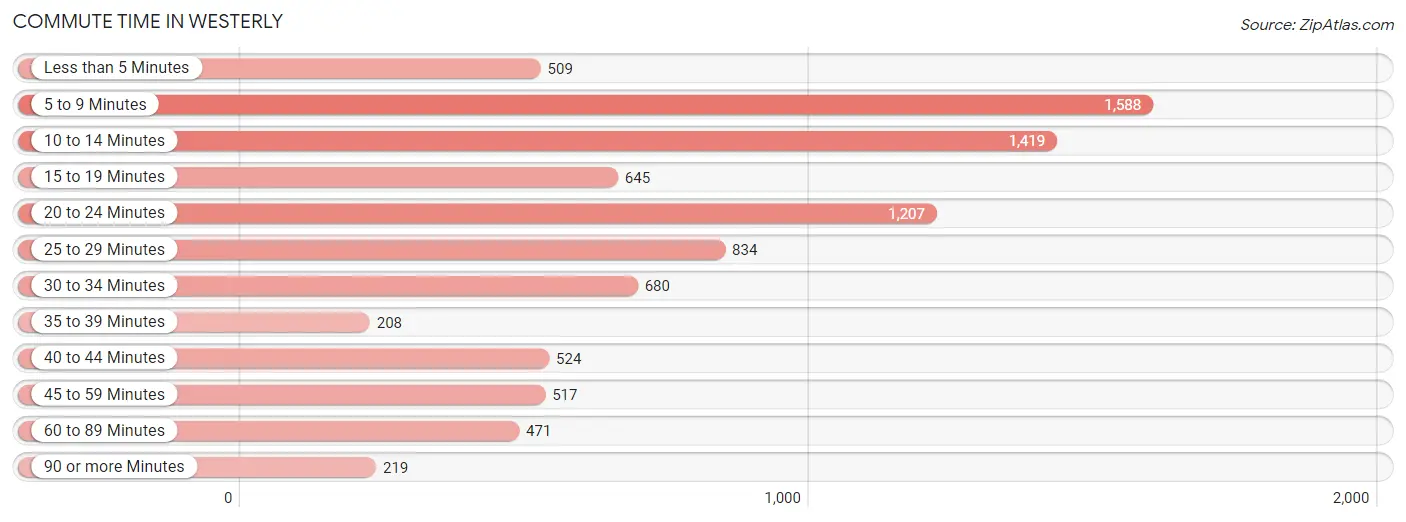
| Commute Time | # Commuters | % Commuters |
| Less than 5 Minutes | 509 | 5.8% |
| 5 to 9 Minutes | 1,588 | 18.0% |
| 10 to 14 Minutes | 1,419 | 16.1% |
| 15 to 19 Minutes | 645 | 7.3% |
| 20 to 24 Minutes | 1,207 | 13.7% |
| 25 to 29 Minutes | 834 | 9.5% |
| 30 to 34 Minutes | 680 | 7.7% |
| 35 to 39 Minutes | 208 | 2.4% |
| 40 to 44 Minutes | 524 | 5.9% |
| 45 to 59 Minutes | 517 | 5.9% |
| 60 to 89 Minutes | 471 | 5.3% |
| 90 or more Minutes | 219 | 2.5% |
Commute Time by Sex in Westerly
The most common commute times in Westerly are 5 to 9 minutes (872 commuters, 17.1%) for males and 10 to 14 minutes (740 commuters, 19.9%) for females.
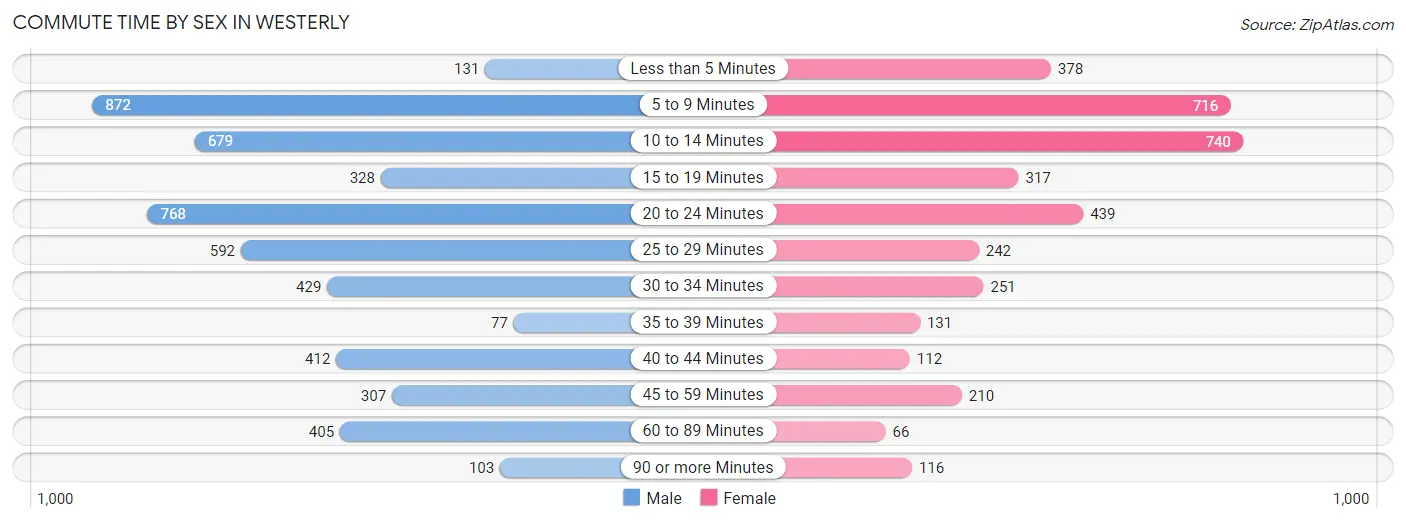
| Commute Time | Male | Female |
| Less than 5 Minutes | 131 (2.6%) | 378 (10.2%) |
| 5 to 9 Minutes | 872 (17.1%) | 716 (19.3%) |
| 10 to 14 Minutes | 679 (13.3%) | 740 (19.9%) |
| 15 to 19 Minutes | 328 (6.4%) | 317 (8.5%) |
| 20 to 24 Minutes | 768 (15.0%) | 439 (11.8%) |
| 25 to 29 Minutes | 592 (11.6%) | 242 (6.5%) |
| 30 to 34 Minutes | 429 (8.4%) | 251 (6.8%) |
| 35 to 39 Minutes | 77 (1.5%) | 131 (3.5%) |
| 40 to 44 Minutes | 412 (8.1%) | 112 (3.0%) |
| 45 to 59 Minutes | 307 (6.0%) | 210 (5.7%) |
| 60 to 89 Minutes | 405 (7.9%) | 66 (1.8%) |
| 90 or more Minutes | 103 (2.0%) | 116 (3.1%) |
Time of Departure to Work by Sex in Westerly
The most frequent times of departure to work in Westerly are 7:00 AM to 7:29 AM (910, 17.8%) for males and 8:00 AM to 8:29 AM (480, 12.9%) for females.
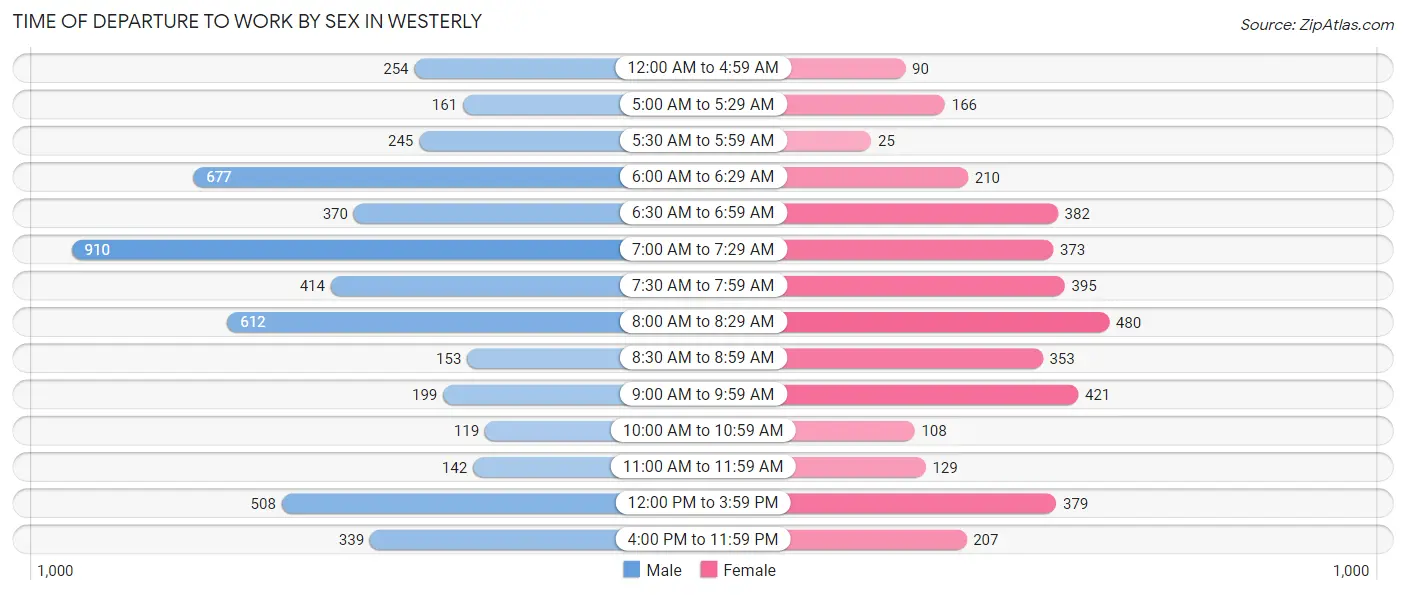
| Time of Departure | Male | Female |
| 12:00 AM to 4:59 AM | 254 (5.0%) | 90 (2.4%) |
| 5:00 AM to 5:29 AM | 161 (3.2%) | 166 (4.5%) |
| 5:30 AM to 5:59 AM | 245 (4.8%) | 25 (0.7%) |
| 6:00 AM to 6:29 AM | 677 (13.3%) | 210 (5.7%) |
| 6:30 AM to 6:59 AM | 370 (7.2%) | 382 (10.3%) |
| 7:00 AM to 7:29 AM | 910 (17.8%) | 373 (10.0%) |
| 7:30 AM to 7:59 AM | 414 (8.1%) | 395 (10.6%) |
| 8:00 AM to 8:29 AM | 612 (12.0%) | 480 (12.9%) |
| 8:30 AM to 8:59 AM | 153 (3.0%) | 353 (9.5%) |
| 9:00 AM to 9:59 AM | 199 (3.9%) | 421 (11.3%) |
| 10:00 AM to 10:59 AM | 119 (2.3%) | 108 (2.9%) |
| 11:00 AM to 11:59 AM | 142 (2.8%) | 129 (3.5%) |
| 12:00 PM to 3:59 PM | 508 (10.0%) | 379 (10.2%) |
| 4:00 PM to 11:59 PM | 339 (6.6%) | 207 (5.6%) |
| Total | 5,103 (100.0%) | 3,718 (100.0%) |
Housing Occupancy in Westerly
Occupancy by Ownership in Westerly
Of the total 8,222 dwellings in Westerly, owner-occupied units account for 5,779 (70.3%), while renter-occupied units make up 2,443 (29.7%).
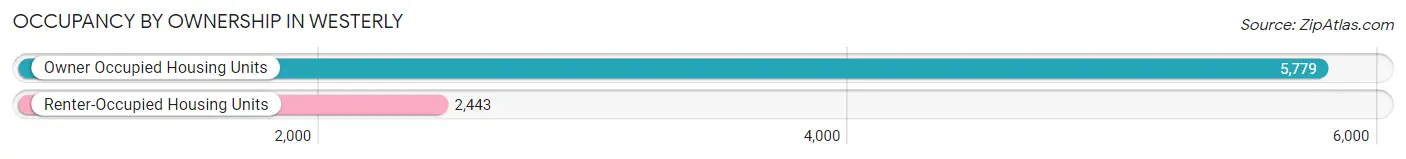
| Occupancy | # Housing Units | % Housing Units |
| Owner Occupied Housing Units | 5,779 | 70.3% |
| Renter-Occupied Housing Units | 2,443 | 29.7% |
| Total Occupied Housing Units | 8,222 | 100.0% |
Occupancy by Household Size in Westerly
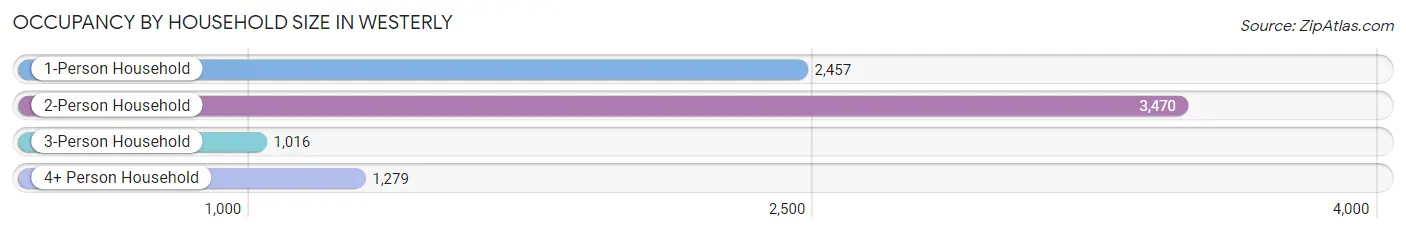
| Household Size | # Housing Units | % Housing Units |
| 1-Person Household | 2,457 | 29.9% |
| 2-Person Household | 3,470 | 42.2% |
| 3-Person Household | 1,016 | 12.4% |
| 4+ Person Household | 1,279 | 15.6% |
| Total Housing Units | 8,222 | 100.0% |
Occupancy by Ownership by Household Size in Westerly
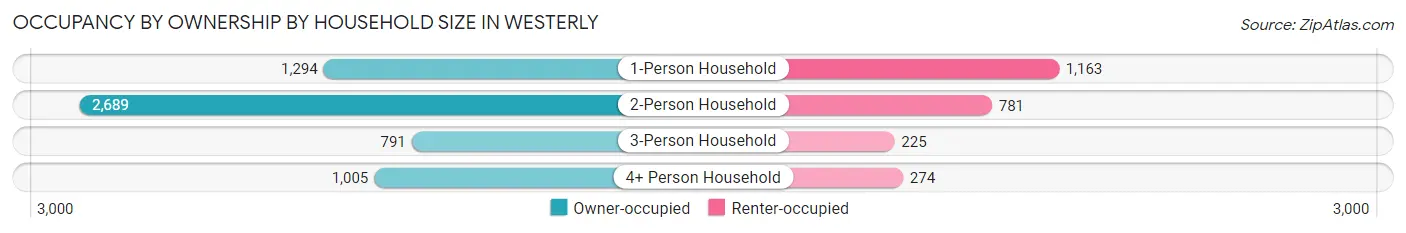
| Household Size | Owner-occupied | Renter-occupied |
| 1-Person Household | 1,294 (52.7%) | 1,163 (47.3%) |
| 2-Person Household | 2,689 (77.5%) | 781 (22.5%) |
| 3-Person Household | 791 (77.8%) | 225 (22.2%) |
| 4+ Person Household | 1,005 (78.6%) | 274 (21.4%) |
| Total Housing Units | 5,779 (70.3%) | 2,443 (29.7%) |
Occupancy by Educational Attainment in Westerly
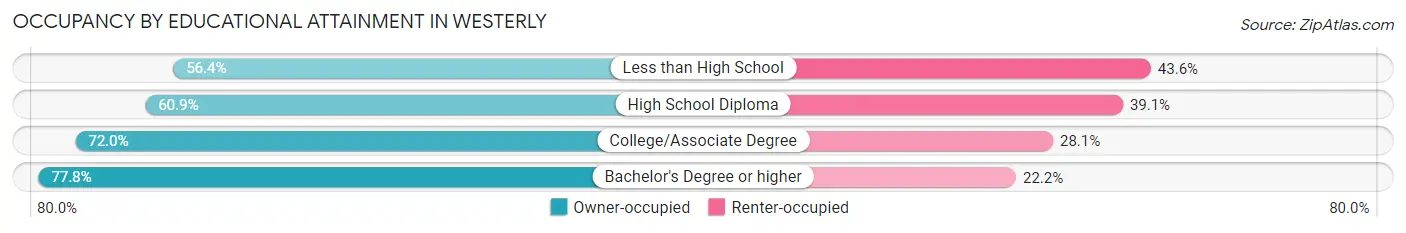
| Household Size | Owner-occupied | Renter-occupied |
| Less than High School | 290 (56.4%) | 224 (43.6%) |
| High School Diploma | 1,454 (60.9%) | 935 (39.1%) |
| College/Associate Degree | 1,275 (72.0%) | 497 (28.1%) |
| Bachelor's Degree or higher | 2,760 (77.8%) | 787 (22.2%) |
Occupancy by Age of Householder in Westerly
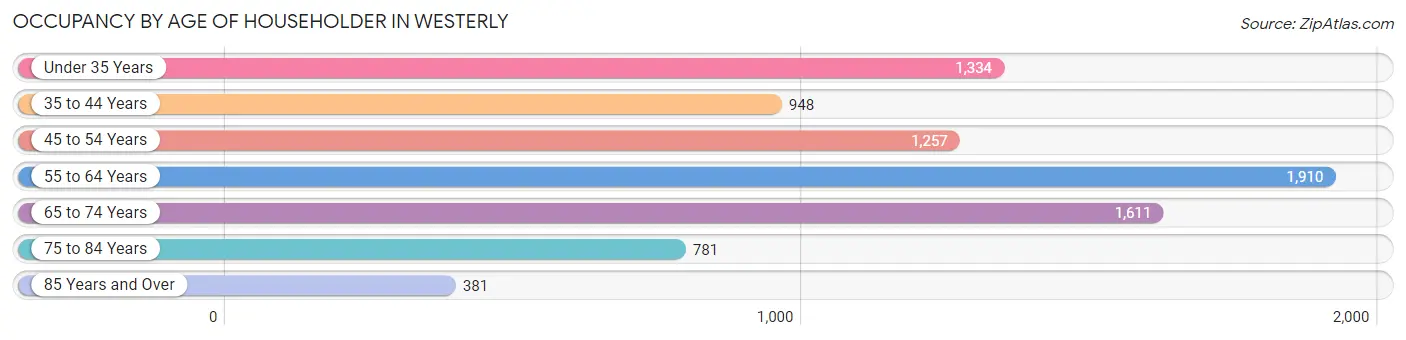
| Age Bracket | # Households | % Households |
| Under 35 Years | 1,334 | 16.2% |
| 35 to 44 Years | 948 | 11.5% |
| 45 to 54 Years | 1,257 | 15.3% |
| 55 to 64 Years | 1,910 | 23.2% |
| 65 to 74 Years | 1,611 | 19.6% |
| 75 to 84 Years | 781 | 9.5% |
| 85 Years and Over | 381 | 4.6% |
| Total | 8,222 | 100.0% |
Housing Finances in Westerly
Median Income by Occupancy in Westerly
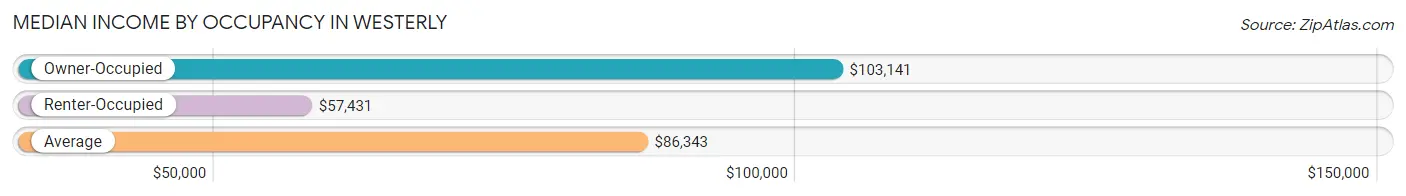
| Occupancy Type | # Households | Median Income |
| Owner-Occupied | 5,779 (70.3%) | $103,141 |
| Renter-Occupied | 2,443 (29.7%) | $57,431 |
| Average | 8,222 (100.0%) | $86,343 |
Occupancy by Householder Income Bracket in Westerly
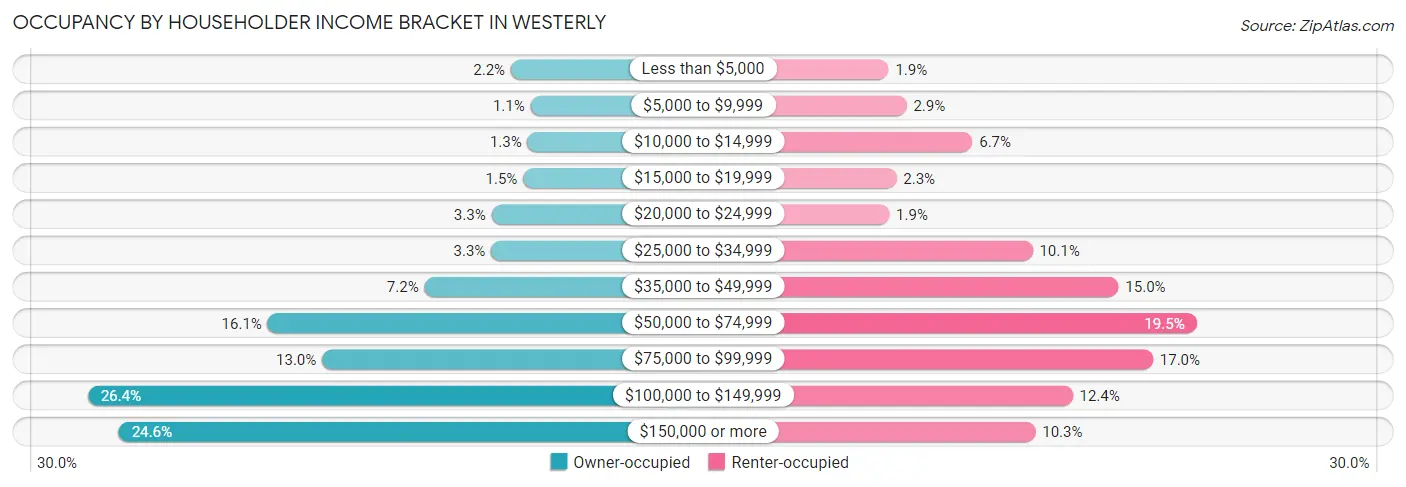
| Income Bracket | Owner-occupied | Renter-occupied |
| Less than $5,000 | 128 (2.2%) | 46 (1.9%) |
| $5,000 to $9,999 | 63 (1.1%) | 71 (2.9%) |
| $10,000 to $14,999 | 73 (1.3%) | 163 (6.7%) |
| $15,000 to $19,999 | 87 (1.5%) | 57 (2.3%) |
| $20,000 to $24,999 | 192 (3.3%) | 47 (1.9%) |
| $25,000 to $34,999 | 193 (3.3%) | 247 (10.1%) |
| $35,000 to $49,999 | 413 (7.1%) | 367 (15.0%) |
| $50,000 to $74,999 | 931 (16.1%) | 476 (19.5%) |
| $75,000 to $99,999 | 751 (13.0%) | 415 (17.0%) |
| $100,000 to $149,999 | 1,525 (26.4%) | 303 (12.4%) |
| $150,000 or more | 1,423 (24.6%) | 251 (10.3%) |
| Total | 5,779 (100.0%) | 2,443 (100.0%) |
Monthly Housing Cost Tiers in Westerly
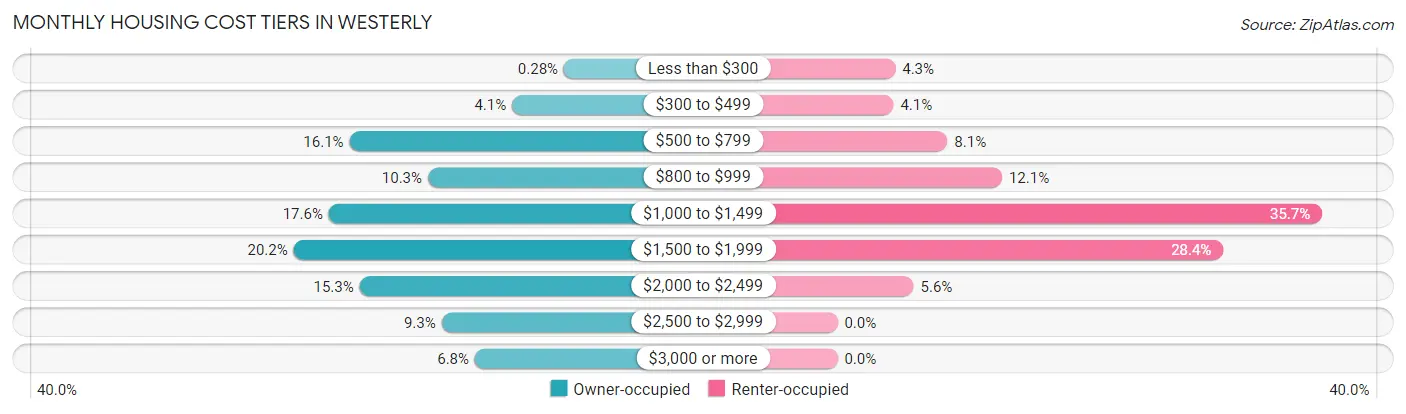
| Monthly Cost | Owner-occupied | Renter-occupied |
| Less than $300 | 16 (0.3%) | 104 (4.3%) |
| $300 to $499 | 237 (4.1%) | 101 (4.1%) |
| $500 to $799 | 929 (16.1%) | 198 (8.1%) |
| $800 to $999 | 595 (10.3%) | 296 (12.1%) |
| $1,000 to $1,499 | 1,017 (17.6%) | 872 (35.7%) |
| $1,500 to $1,999 | 1,167 (20.2%) | 694 (28.4%) |
| $2,000 to $2,499 | 886 (15.3%) | 137 (5.6%) |
| $2,500 to $2,999 | 537 (9.3%) | 0 (0.0%) |
| $3,000 or more | 395 (6.8%) | 0 (0.0%) |
| Total | 5,779 (100.0%) | 2,443 (100.0%) |
Physical Housing Characteristics in Westerly
Housing Structures in Westerly
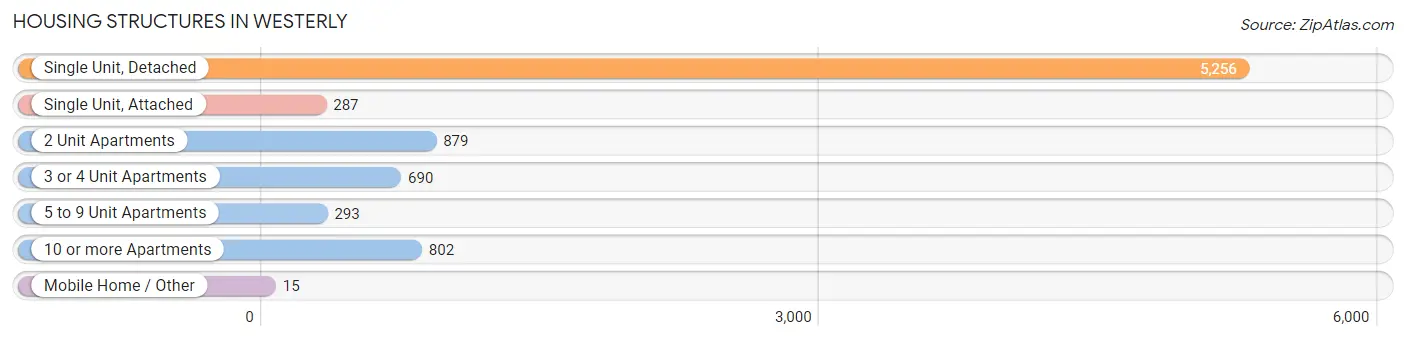
| Structure Type | # Housing Units | % Housing Units |
| Single Unit, Detached | 5,256 | 63.9% |
| Single Unit, Attached | 287 | 3.5% |
| 2 Unit Apartments | 879 | 10.7% |
| 3 or 4 Unit Apartments | 690 | 8.4% |
| 5 to 9 Unit Apartments | 293 | 3.6% |
| 10 or more Apartments | 802 | 9.8% |
| Mobile Home / Other | 15 | 0.2% |
| Total | 8,222 | 100.0% |
Housing Structures by Occupancy in Westerly
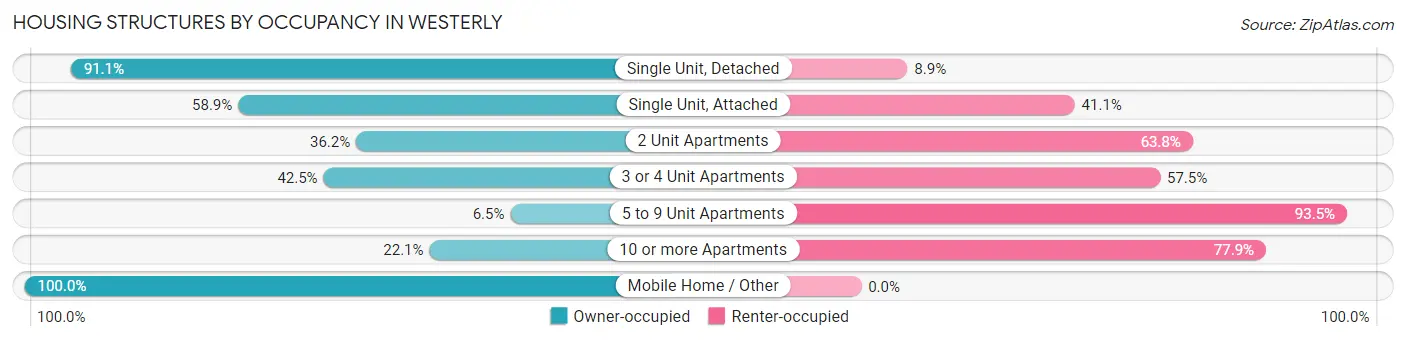
| Structure Type | Owner-occupied | Renter-occupied |
| Single Unit, Detached | 4,788 (91.1%) | 468 (8.9%) |
| Single Unit, Attached | 169 (58.9%) | 118 (41.1%) |
| 2 Unit Apartments | 318 (36.2%) | 561 (63.8%) |
| 3 or 4 Unit Apartments | 293 (42.5%) | 397 (57.5%) |
| 5 to 9 Unit Apartments | 19 (6.5%) | 274 (93.5%) |
| 10 or more Apartments | 177 (22.1%) | 625 (77.9%) |
| Mobile Home / Other | 15 (100.0%) | 0 (0.0%) |
| Total | 5,779 (70.3%) | 2,443 (29.7%) |
Housing Structures by Number of Rooms in Westerly
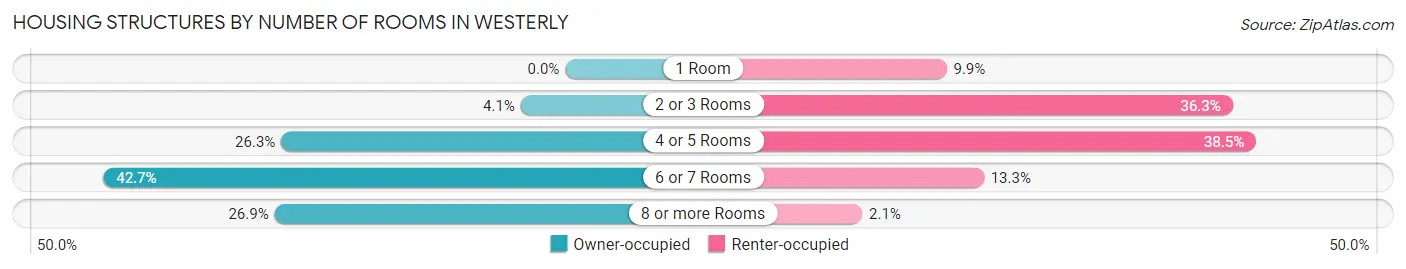
| Number of Rooms | Owner-occupied | Renter-occupied |
| 1 Room | 0 (0.0%) | 241 (9.9%) |
| 2 or 3 Rooms | 238 (4.1%) | 887 (36.3%) |
| 4 or 5 Rooms | 1,518 (26.3%) | 940 (38.5%) |
| 6 or 7 Rooms | 2,469 (42.7%) | 325 (13.3%) |
| 8 or more Rooms | 1,554 (26.9%) | 50 (2.1%) |
| Total | 5,779 (100.0%) | 2,443 (100.0%) |
Housing Structure by Heating Type in Westerly
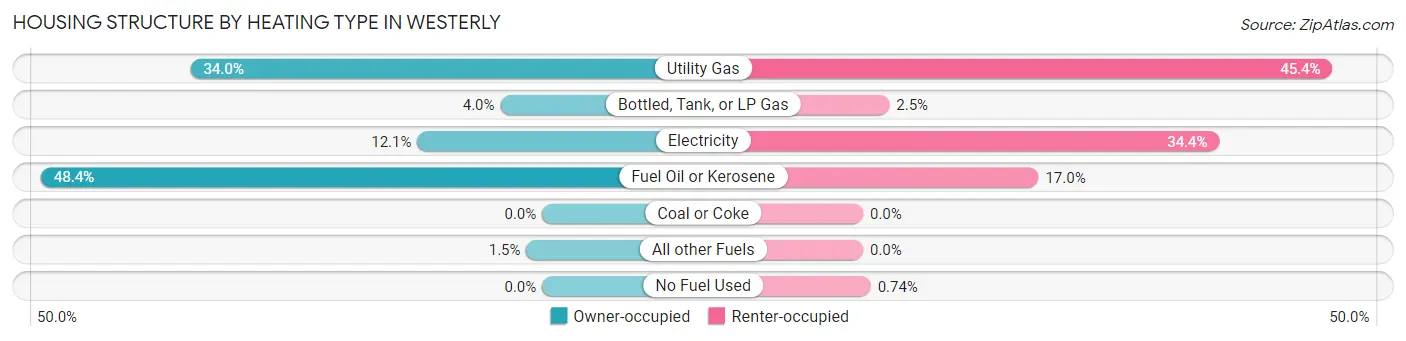
| Heating Type | Owner-occupied | Renter-occupied |
| Utility Gas | 1,963 (34.0%) | 1,108 (45.4%) |
| Bottled, Tank, or LP Gas | 233 (4.0%) | 62 (2.5%) |
| Electricity | 697 (12.1%) | 841 (34.4%) |
| Fuel Oil or Kerosene | 2,798 (48.4%) | 414 (17.0%) |
| Coal or Coke | 0 (0.0%) | 0 (0.0%) |
| All other Fuels | 88 (1.5%) | 0 (0.0%) |
| No Fuel Used | 0 (0.0%) | 18 (0.7%) |
| Total | 5,779 (100.0%) | 2,443 (100.0%) |
Household Vehicle Usage in Westerly
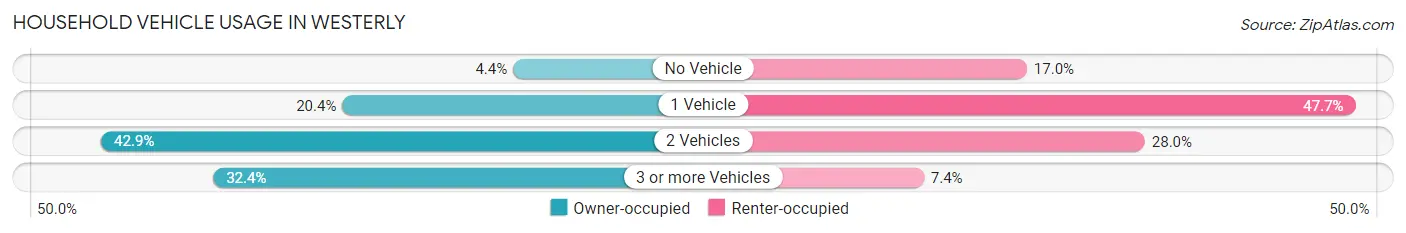
| Vehicles per Household | Owner-occupied | Renter-occupied |
| No Vehicle | 254 (4.4%) | 415 (17.0%) |
| 1 Vehicle | 1,176 (20.3%) | 1,164 (47.6%) |
| 2 Vehicles | 2,477 (42.9%) | 684 (28.0%) |
| 3 or more Vehicles | 1,872 (32.4%) | 180 (7.4%) |
| Total | 5,779 (100.0%) | 2,443 (100.0%) |
Real Estate & Mortgages in Westerly
Real Estate and Mortgage Overview in Westerly
| Characteristic | Without Mortgage | With Mortgage |
| Housing Units | 1,851 | 3,928 |
| Median Property Value | $389,400 | $372,100 |
| Median Household Income | $72,179 | $1,199 |
| Monthly Housing Costs | $729 | $395 |
| Real Estate Taxes | $3,707 | $17 |
Property Value by Mortgage Status in Westerly
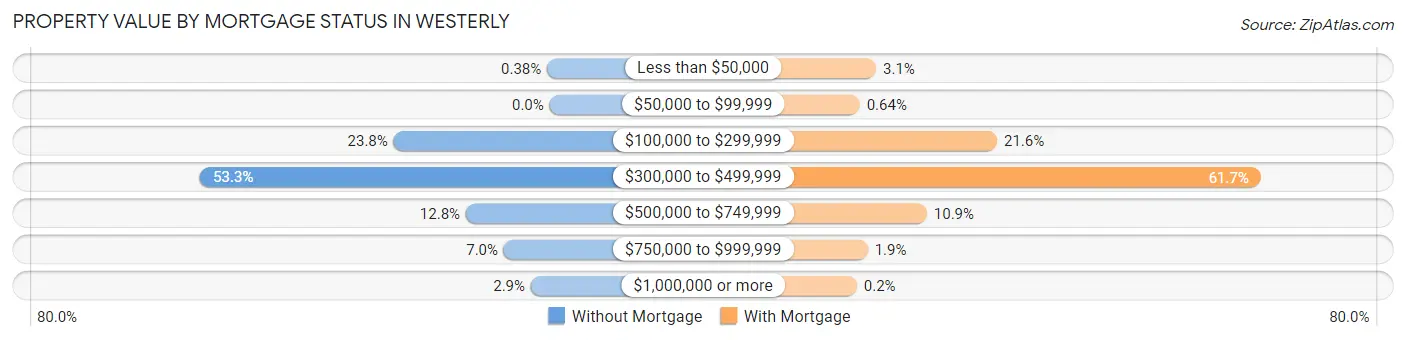
| Property Value | Without Mortgage | With Mortgage |
| Less than $50,000 | 7 (0.4%) | 123 (3.1%) |
| $50,000 to $99,999 | 0 (0.0%) | 25 (0.6%) |
| $100,000 to $299,999 | 440 (23.8%) | 847 (21.6%) |
| $300,000 to $499,999 | 986 (53.3%) | 2,425 (61.7%) |
| $500,000 to $749,999 | 236 (12.8%) | 427 (10.9%) |
| $750,000 to $999,999 | 129 (7.0%) | 73 (1.9%) |
| $1,000,000 or more | 53 (2.9%) | 8 (0.2%) |
| Total | 1,851 (100.0%) | 3,928 (100.0%) |
Household Income by Mortgage Status in Westerly
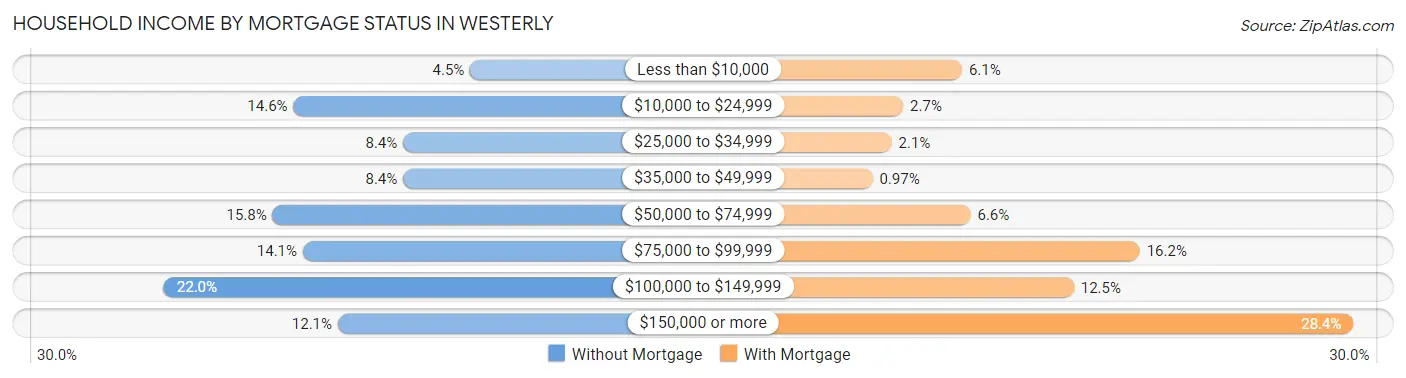
| Household Income | Without Mortgage | With Mortgage |
| Less than $10,000 | 84 (4.5%) | 239 (6.1%) |
| $10,000 to $24,999 | 271 (14.6%) | 107 (2.7%) |
| $25,000 to $34,999 | 155 (8.4%) | 81 (2.1%) |
| $35,000 to $49,999 | 155 (8.4%) | 38 (1.0%) |
| $50,000 to $74,999 | 293 (15.8%) | 258 (6.6%) |
| $75,000 to $99,999 | 261 (14.1%) | 638 (16.2%) |
| $100,000 to $149,999 | 408 (22.0%) | 490 (12.5%) |
| $150,000 or more | 224 (12.1%) | 1,117 (28.4%) |
| Total | 1,851 (100.0%) | 3,928 (100.0%) |
Property Value to Household Income Ratio in Westerly
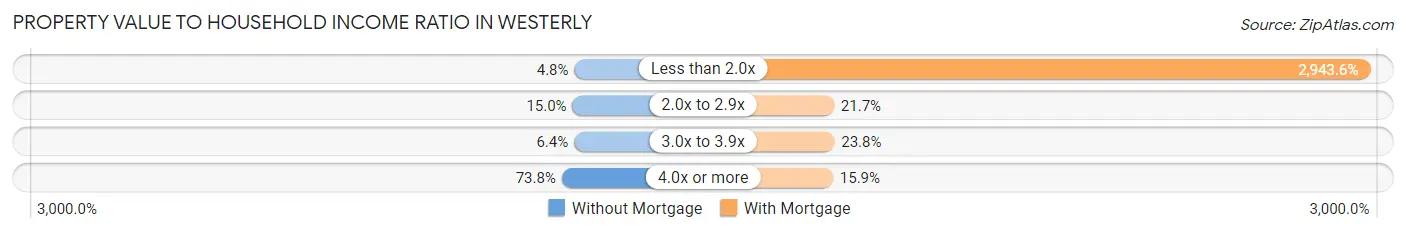
| Value-to-Income Ratio | Without Mortgage | With Mortgage |
| Less than 2.0x | 88 (4.8%) | 115,625 (2,943.6%) |
| 2.0x to 2.9x | 278 (15.0%) | 851 (21.7%) |
| 3.0x to 3.9x | 119 (6.4%) | 933 (23.7%) |
| 4.0x or more | 1,366 (73.8%) | 623 (15.9%) |
| Total | 1,851 (100.0%) | 3,928 (100.0%) |
Real Estate Taxes by Mortgage Status in Westerly
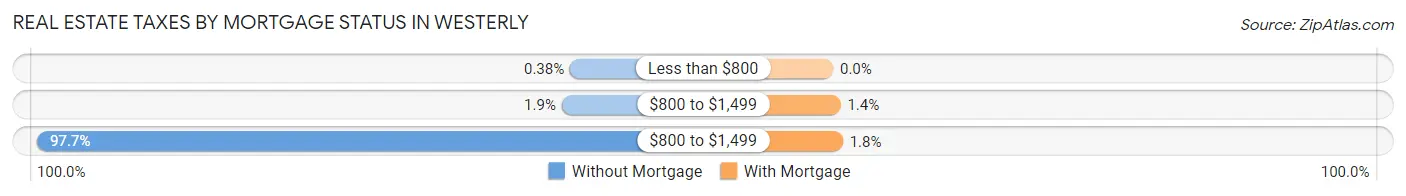
| Property Taxes | Without Mortgage | With Mortgage |
| Less than $800 | 7 (0.4%) | 0 (0.0%) |
| $800 to $1,499 | 35 (1.9%) | 53 (1.3%) |
| $800 to $1,499 | 1,809 (97.7%) | 69 (1.8%) |
| Total | 1,851 (100.0%) | 3,928 (100.0%) |
Health & Disability in Westerly
Health Insurance Coverage by Age in Westerly
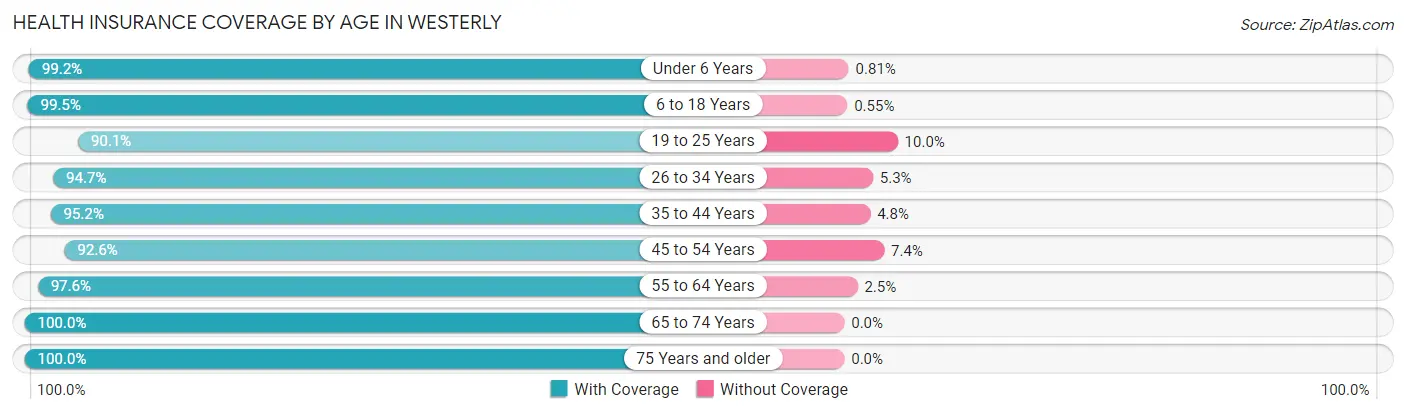
| Age Bracket | With Coverage | Without Coverage |
| Under 6 Years | 862 (99.2%) | 7 (0.8%) |
| 6 to 18 Years | 1,797 (99.5%) | 10 (0.5%) |
| 19 to 25 Years | 1,629 (90.0%) | 180 (10.0%) |
| 26 to 34 Years | 1,654 (94.7%) | 93 (5.3%) |
| 35 to 44 Years | 1,557 (95.2%) | 79 (4.8%) |
| 45 to 54 Years | 2,218 (92.6%) | 178 (7.4%) |
| 55 to 64 Years | 3,228 (97.6%) | 81 (2.5%) |
| 65 to 74 Years | 2,563 (100.0%) | 0 (0.0%) |
| 75 Years and older | 1,797 (100.0%) | 0 (0.0%) |
| Total | 17,305 (96.5%) | 628 (3.5%) |
Health Insurance Coverage by Citizenship Status in Westerly
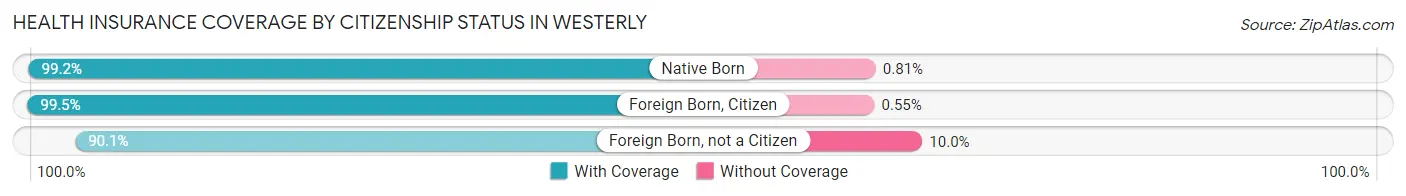
| Citizenship Status | With Coverage | Without Coverage |
| Native Born | 862 (99.2%) | 7 (0.8%) |
| Foreign Born, Citizen | 1,797 (99.5%) | 10 (0.5%) |
| Foreign Born, not a Citizen | 1,629 (90.0%) | 180 (10.0%) |
Health Insurance Coverage by Household Income in Westerly
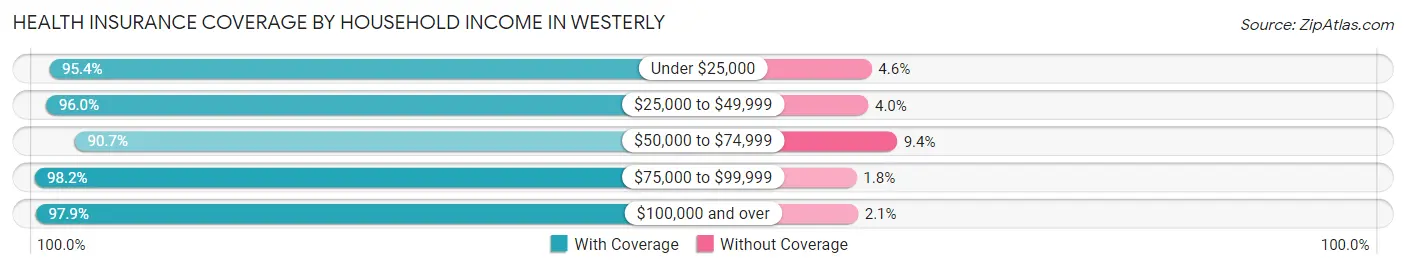
| Household Income | With Coverage | Without Coverage |
| Under $25,000 | 1,096 (95.4%) | 53 (4.6%) |
| $25,000 to $49,999 | 2,147 (96.0%) | 89 (4.0%) |
| $50,000 to $74,999 | 2,415 (90.6%) | 249 (9.3%) |
| $75,000 to $99,999 | 2,237 (98.2%) | 41 (1.8%) |
| $100,000 and over | 9,334 (97.9%) | 196 (2.1%) |
Public vs Private Health Insurance Coverage by Age in Westerly
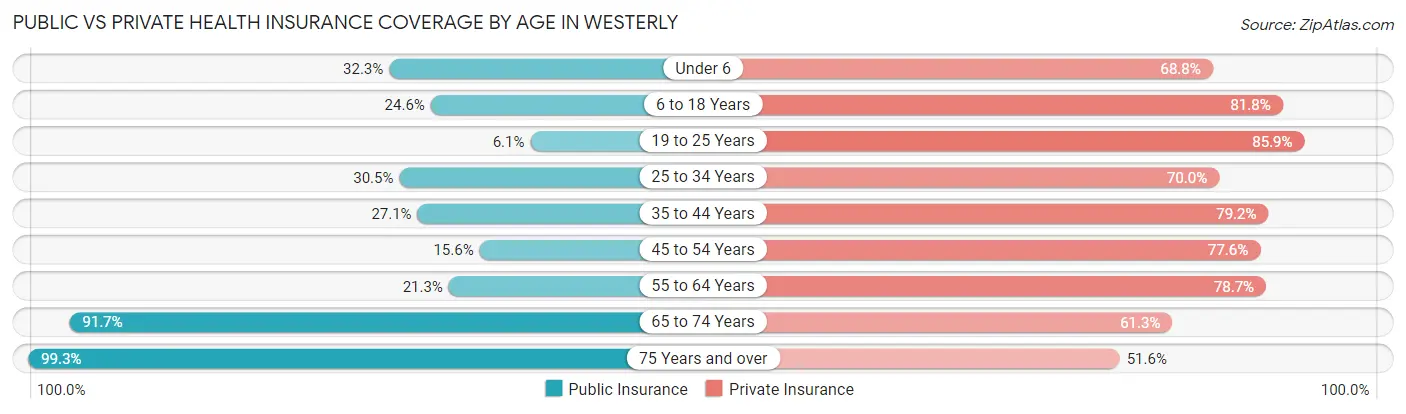
| Age Bracket | Public Insurance | Private Insurance |
| Under 6 | 281 (32.3%) | 598 (68.8%) |
| 6 to 18 Years | 445 (24.6%) | 1,478 (81.8%) |
| 19 to 25 Years | 111 (6.1%) | 1,553 (85.9%) |
| 25 to 34 Years | 532 (30.4%) | 1,223 (70.0%) |
| 35 to 44 Years | 443 (27.1%) | 1,295 (79.2%) |
| 45 to 54 Years | 373 (15.6%) | 1,860 (77.6%) |
| 55 to 64 Years | 704 (21.3%) | 2,605 (78.7%) |
| 65 to 74 Years | 2,350 (91.7%) | 1,572 (61.3%) |
| 75 Years and over | 1,785 (99.3%) | 927 (51.6%) |
| Total | 7,024 (39.2%) | 13,111 (73.1%) |
Disability Status by Sex by Age in Westerly
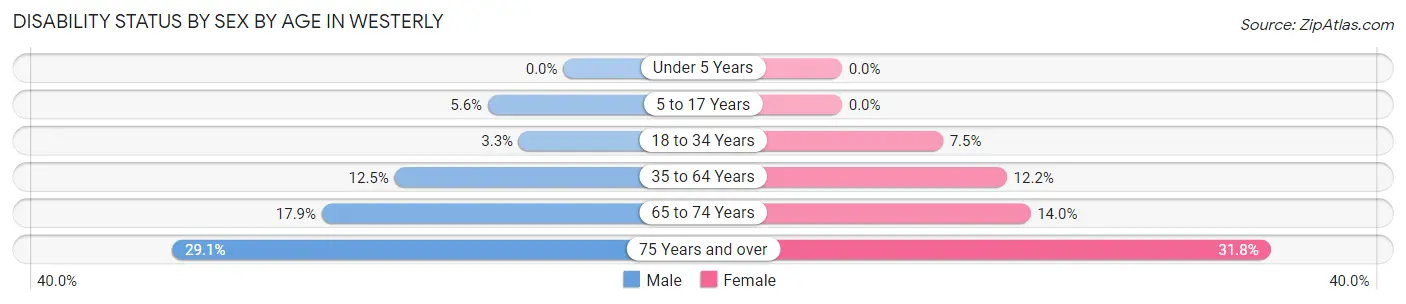
| Age Bracket | Male | Female |
| Under 5 Years | 0 (0.0%) | 0 (0.0%) |
| 5 to 17 Years | 63 (5.6%) | 0 (0.0%) |
| 18 to 34 Years | 72 (3.3%) | 114 (7.5%) |
| 35 to 64 Years | 455 (12.5%) | 454 (12.2%) |
| 65 to 74 Years | 234 (17.9%) | 176 (14.0%) |
| 75 Years and over | 199 (29.0%) | 354 (31.8%) |
Disability Class by Sex by Age in Westerly
Disability Class: Hearing Difficulty
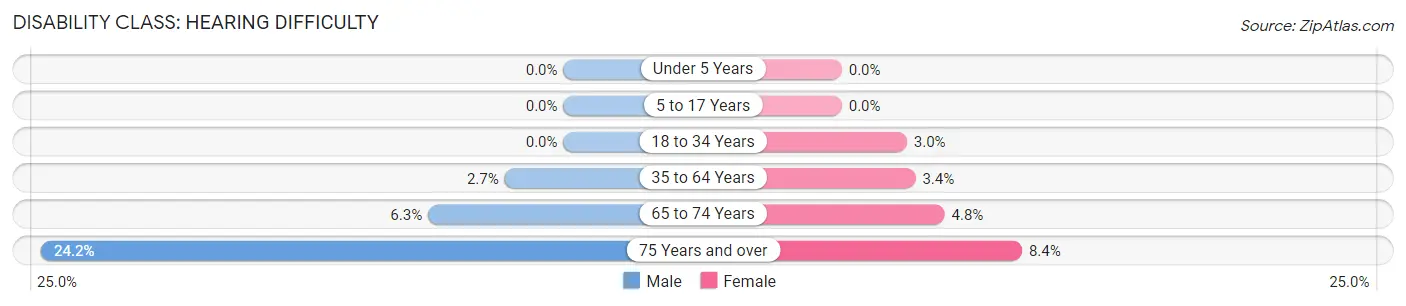
| Age Bracket | Male | Female |
| Under 5 Years | 0 (0.0%) | 0 (0.0%) |
| 5 to 17 Years | 0 (0.0%) | 0 (0.0%) |
| 18 to 34 Years | 0 (0.0%) | 46 (3.0%) |
| 35 to 64 Years | 99 (2.7%) | 127 (3.4%) |
| 65 to 74 Years | 82 (6.3%) | 60 (4.8%) |
| 75 Years and over | 166 (24.2%) | 93 (8.4%) |
Disability Class: Vision Difficulty
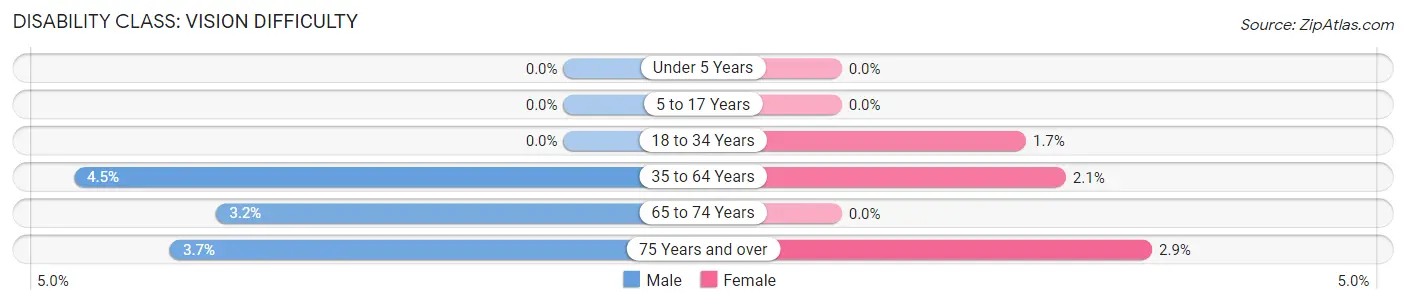
| Age Bracket | Male | Female |
| Under 5 Years | 0 (0.0%) | 0 (0.0%) |
| 5 to 17 Years | 0 (0.0%) | 0 (0.0%) |
| 18 to 34 Years | 0 (0.0%) | 26 (1.7%) |
| 35 to 64 Years | 165 (4.5%) | 77 (2.1%) |
| 65 to 74 Years | 42 (3.2%) | 0 (0.0%) |
| 75 Years and over | 25 (3.6%) | 32 (2.9%) |
Disability Class: Cognitive Difficulty
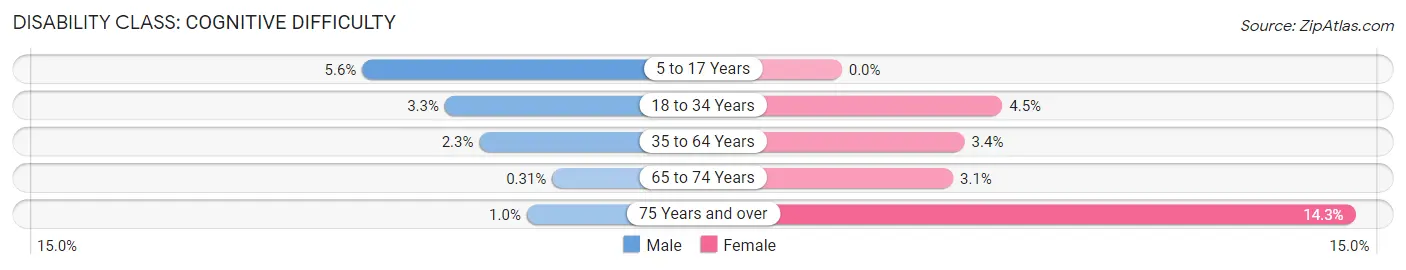
| Age Bracket | Male | Female |
| 5 to 17 Years | 63 (5.6%) | 0 (0.0%) |
| 18 to 34 Years | 72 (3.3%) | 68 (4.5%) |
| 35 to 64 Years | 85 (2.3%) | 127 (3.4%) |
| 65 to 74 Years | 4 (0.3%) | 39 (3.1%) |
| 75 Years and over | 7 (1.0%) | 159 (14.3%) |
Disability Class: Ambulatory Difficulty
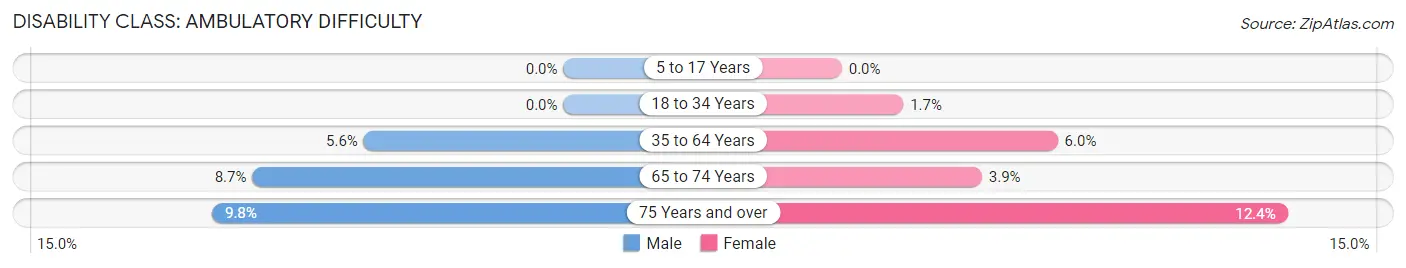
| Age Bracket | Male | Female |
| 5 to 17 Years | 0 (0.0%) | 0 (0.0%) |
| 18 to 34 Years | 0 (0.0%) | 26 (1.7%) |
| 35 to 64 Years | 202 (5.6%) | 223 (6.0%) |
| 65 to 74 Years | 113 (8.7%) | 49 (3.9%) |
| 75 Years and over | 67 (9.8%) | 138 (12.4%) |
Disability Class: Self-Care Difficulty
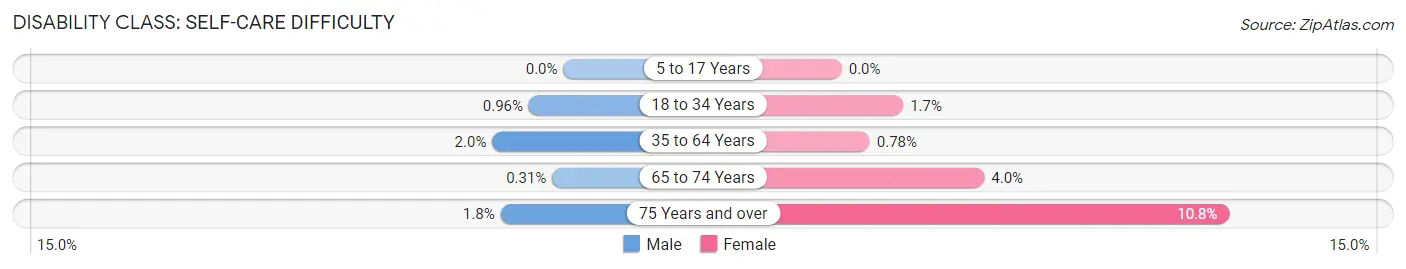
| Age Bracket | Male | Female |
| 5 to 17 Years | 0 (0.0%) | 0 (0.0%) |
| 18 to 34 Years | 21 (1.0%) | 26 (1.7%) |
| 35 to 64 Years | 72 (2.0%) | 29 (0.8%) |
| 65 to 74 Years | 4 (0.3%) | 50 (4.0%) |
| 75 Years and over | 12 (1.8%) | 120 (10.8%) |
Technology Access in Westerly
Computing Device Access in Westerly
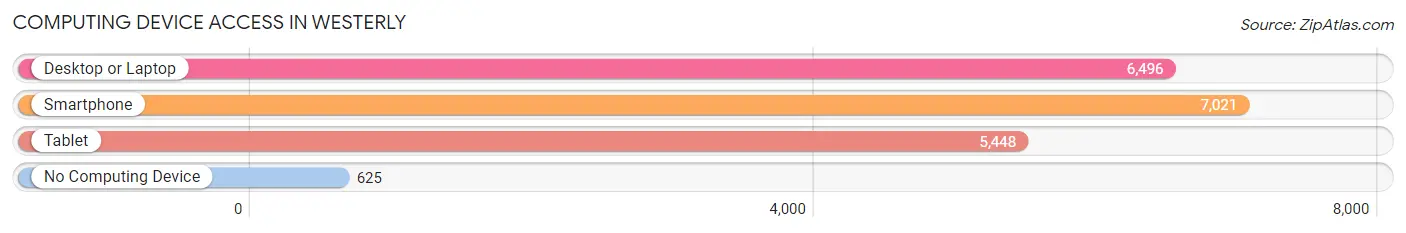
| Device Type | # Households | % Households |
| Desktop or Laptop | 6,496 | 79.0% |
| Smartphone | 7,021 | 85.4% |
| Tablet | 5,448 | 66.3% |
| No Computing Device | 625 | 7.6% |
| Total | 8,222 | 100.0% |
Internet Access in Westerly
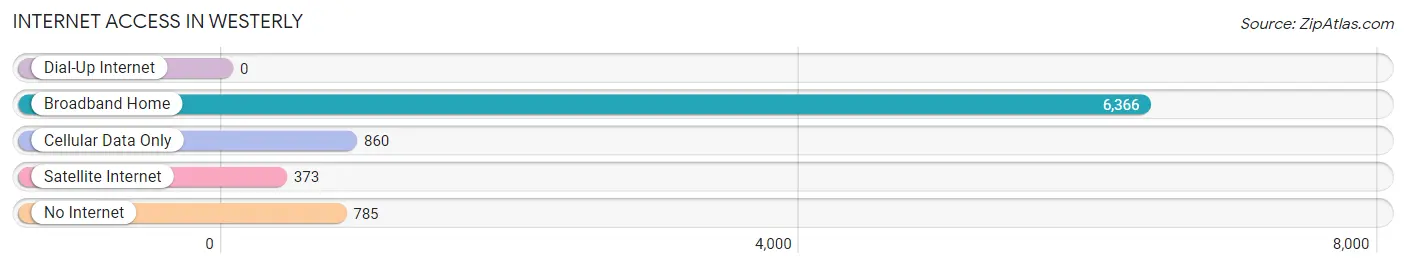
| Internet Type | # Households | % Households |
| Dial-Up Internet | 0 | 0.0% |
| Broadband Home | 6,366 | 77.4% |
| Cellular Data Only | 860 | 10.5% |
| Satellite Internet | 373 | 4.5% |
| No Internet | 785 | 9.6% |
| Total | 8,222 | 100.0% |
Westerly Summary
Westerly is a town located in Washington County, Rhode Island, United States. It is situated on the southwestern shore of the state, along the Atlantic Ocean. The town is bordered by the towns of Charlestown to the east, Hopkinton to the north, and South Kingstown to the west. Westerly is the most populous town in the county, with a population of 22,787 as of the 2010 census.
History
The area that is now Westerly was originally inhabited by the Narragansett Native American tribe. The first European settlers arrived in the area in 1661, and the town was officially incorporated in 1669. The town was named after the English town of Westerleigh, which was the hometown of one of the original settlers.
In the late 19th century, Westerly became a popular summer resort destination for wealthy families from New York City and Boston. The town was home to several grand hotels, including the Ocean House, which was built in 1868 and is now a National Historic Landmark.
Geography
Westerly is located at 41°22′N 71°45′W (41.37, -71.75). According to the United States Census Bureau, the town has a total area of 28.3 square miles (73.3 km2), of which 25.3 square miles (65.5 km2) is land and 3.0 square miles (7.8 km2) is water.
The town is located on the southwestern shore of Rhode Island, along the Atlantic Ocean. It is bordered by the towns of Charlestown to the east, Hopkinton to the north, and South Kingstown to the west.
Economy
Westerly’s economy is largely based on tourism and the service industry. The town is home to several popular beaches, including Misquamicut State Beach, which is one of the most popular beaches in the state. The town is also home to several marinas, which attract boaters from all over the region.
The town is also home to several manufacturing companies, including the Westerly Yacht Club, which produces sailboats, and the Westerly Marine Corporation, which produces powerboats.
Demographics
As of the 2010 census, there were 22,787 people, 9,845 households, and 6,093 families residing in the town. The population density was 902.2 people per square mile (348.7/km2). There were 10,845 housing units at an average density of 427.7 per square mile (164.9/km2). The racial makeup of the town was 94.2% White, 1.3% African American, 0.3% Native American, 1.2% Asian, 0.1% Pacific Islander, 1.2% from other races, and 1.7% from two or more races. Hispanic or Latino of any race were 4.2% of the population.
There were 9,845 households, out of which 28.2% had children under the age of 18 living with them, 49.2% were married couples living together, 11.3% had a female householder with no husband present, and 35.2% were non-families. 28.7% of all households were made up of individuals, and 11.7% had someone living alone who was 65 years of age or older. The average household size was 2.32 and the average family size was 2.86.
In the town, the population was spread out, with 22.2% under the age of 18, 7.2% from 18 to 24, 28.2% from 25 to 44, 26.2% from 45 to 64, and 16.2% who were 65 years of age or older. The median age was 40 years. For every 100 females, there were 93.2 males. For every 100 females age 18 and over, there were 90.2 males.
The median income for a household in the town was $48,945, and the median income for a family was $60,945. Males had a median income of $41,945 versus $30,945 for females. The per capita income for the town was $25,945. About 5.2% of families and 7.2% of the population were below the poverty line, including 9.2% of those under age 18 and 6.2% of those age 65 or over.
Common Questions
What is Per Capita Income in Westerly?
Per Capita income in Westerly is $46,503.
What is the Median Family Income in Westerly?
Median Family Income in Westerly is $108,682.
What is the Median Household income in Westerly?
Median Household Income in Westerly is $86,343.
What is Income or Wage Gap in Westerly?
Income or Wage Gap in Westerly is 22.8%.
Women in Westerly earn 77.2 cents for every dollar earned by a man.
What is Inequality or Gini Index in Westerly?
Inequality or Gini Index in Westerly is 0.39.
What is the Total Population of Westerly?
Total Population of Westerly is 18,272.
What is the Total Male Population of Westerly?
Total Male Population of Westerly is 9,346.
What is the Total Female Population of Westerly?
Total Female Population of Westerly is 8,926.
What is the Ratio of Males per 100 Females in Westerly?
There are 104.71 Males per 100 Females in Westerly.
What is the Ratio of Females per 100 Males in Westerly?
There are 95.51 Females per 100 Males in Westerly.
What is the Median Population Age in Westerly?
Median Population Age in Westerly is 50.6 Years.
What is the Average Family Size in Westerly
Average Family Size in Westerly is 2.8 People.
What is the Average Household Size in Westerly
Average Household Size in Westerly is 2.2 People.
How Large is the Labor Force in Westerly?
There are 10,358 People in the Labor Forcein in Westerly.
What is the Percentage of People in the Labor Force in Westerly?
64.6% of People are in the Labor Force in Westerly.
What is the Unemployment Rate in Westerly?
Unemployment Rate in Westerly is 6.5%.